Scolaris Content Display Scolaris Content Display

Study flow diagram.
Figuras y tablas -
Figure 1

Study flow diagram.

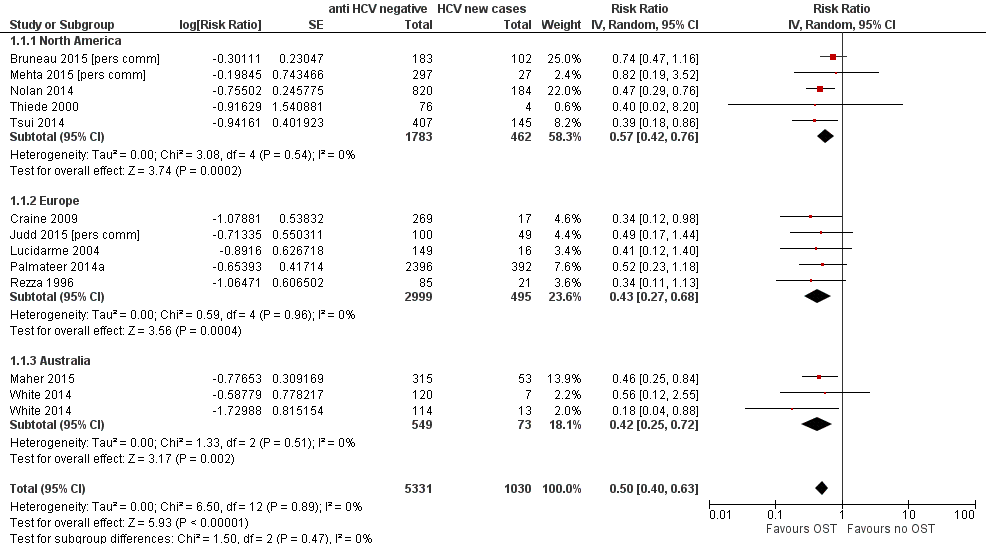
Forest plot of comparison: 1 Current OST versus no OST, outcome: 1.1 HCV incidence adjusted analyses by region.
Figuras y tablas -
Figure 2

Forest plot of comparison: 1 Current OST versus no OST, outcome: 1.1 HCV incidence adjusted analyses by region.

Funnel plot of comparison: 1 Current OST versus no OST, outcome: 1.1 HCV incidence adjusted analyses by region.
Figuras y tablas -
Figure 3

Funnel plot of comparison: 1 Current OST versus no OST, outcome: 1.1 HCV incidence adjusted analyses by region.

Forest plot of comparison: 2 High NSP coverage versus no/low NSP coverage, outcome: 2.1 HCV incidence adjusted analyses by region.
Figuras y tablas -
Figure 4

Forest plot of comparison: 2 High NSP coverage versus no/low NSP coverage, outcome: 2.1 HCV incidence adjusted analyses by region.

Forest plot of comparison: 4 Combined OST and high/low NSP versus no OST and low/no NSP, outcome: 4.1 HCV incidence adjusted analyses.
Figuras y tablas -
Figure 5

Forest plot of comparison: 4 Combined OST and high/low NSP versus no OST and low/no NSP, outcome: 4.1 HCV incidence adjusted analyses.

Comparison 1 Current OST versus no OST, Outcome 1 HCV incidence adjusted analyses by region.
Figuras y tablas -
Analysis 1.1

Comparison 1 Current OST versus no OST, Outcome 1 HCV incidence adjusted analyses by region.

Comparison 1 Current OST versus no OST, Outcome 2 HCV incidence adjusted analysis by study design.
Figuras y tablas -
Analysis 1.2

Comparison 1 Current OST versus no OST, Outcome 2 HCV incidence adjusted analysis by study design.

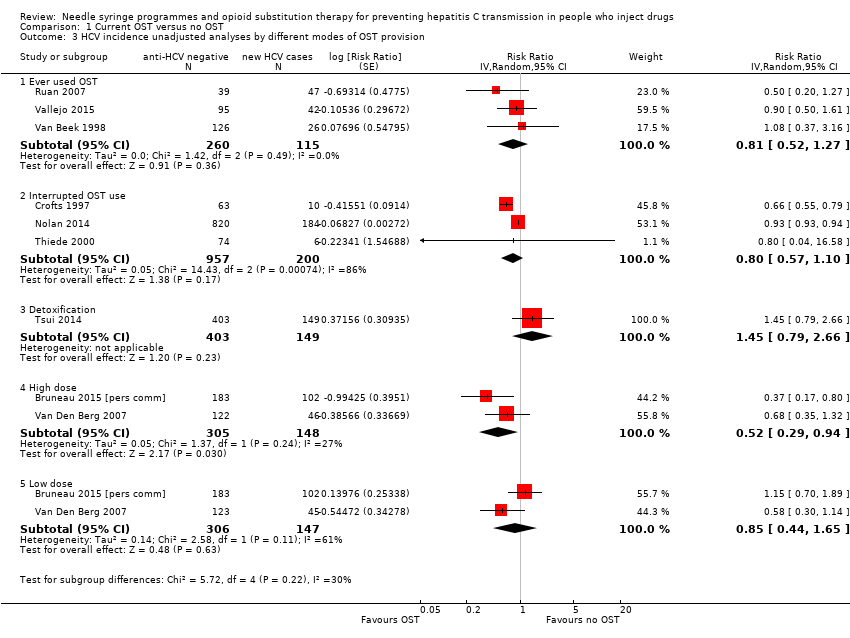
Comparison 1 Current OST versus no OST, Outcome 3 HCV incidence unadjusted analyses by different modes of OST provision.
Figuras y tablas -
Analysis 1.3

Comparison 1 Current OST versus no OST, Outcome 3 HCV incidence unadjusted analyses by different modes of OST provision.

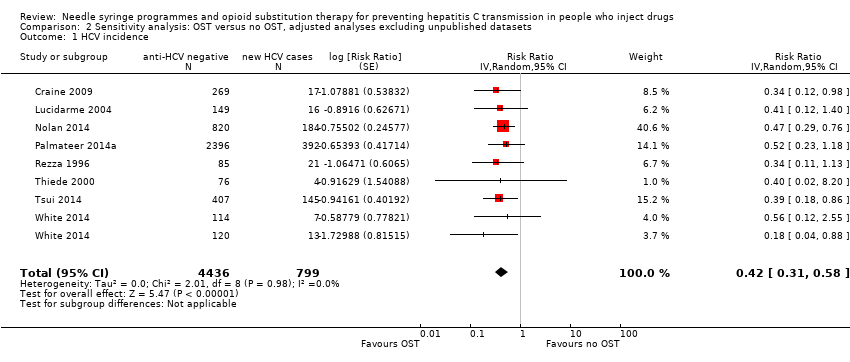
Comparison 2 Sensitivity analysis: OST versus no OST, adjusted analyses excluding unpublished datasets, Outcome 1 HCV incidence.
Figuras y tablas -
Analysis 2.1

Comparison 2 Sensitivity analysis: OST versus no OST, adjusted analyses excluding unpublished datasets, Outcome 1 HCV incidence.

Comparison 3 Sensitivity analysis: OST versus no OST, adjusted analyses excluding studies at critical risk of bias, Outcome 1 HCV incidence.
Figuras y tablas -
Analysis 3.1

Comparison 3 Sensitivity analysis: OST versus no OST, adjusted analyses excluding studies at critical risk of bias, Outcome 1 HCV incidence.

Comparison 4 Sensitivity analysis: OST versus no OST, adjusted analyses excluding cross‐sectional studies, Outcome 1 HCV incidence.
Figuras y tablas -
Analysis 4.1

Comparison 4 Sensitivity analysis: OST versus no OST, adjusted analyses excluding cross‐sectional studies, Outcome 1 HCV incidence.

Comparison 5 OST versus no OST, unadjusted analysis, Outcome 1 HCV incidence.
Figuras y tablas -
Analysis 5.1

Comparison 5 OST versus no OST, unadjusted analysis, Outcome 1 HCV incidence.

Comparison 6 High NSP coverage versus no/low NSP coverage, Outcome 1 HCV incidence adjusted analyses by region.
Figuras y tablas -
Analysis 6.1

Comparison 6 High NSP coverage versus no/low NSP coverage, Outcome 1 HCV incidence adjusted analyses by region.

Comparison 6 High NSP coverage versus no/low NSP coverage, Outcome 2 HCV incidence adjusted analyses by study design.
Figuras y tablas -
Analysis 6.2

Comparison 6 High NSP coverage versus no/low NSP coverage, Outcome 2 HCV incidence adjusted analyses by study design.

Comparison 7 Sensitivity analysis: high NSP versus low/no NSP, excluding unpublished data, Outcome 1 HCV incidence.
Figuras y tablas -
Analysis 7.1

Comparison 7 Sensitivity analysis: high NSP versus low/no NSP, excluding unpublished data, Outcome 1 HCV incidence.

Comparison 8 Sensitivity analysis: high NSP versus low/no NSP, excluding cross‐sectional surveys, Outcome 1 HCV incidence.
Figuras y tablas -
Analysis 8.1

Comparison 8 Sensitivity analysis: high NSP versus low/no NSP, excluding cross‐sectional surveys, Outcome 1 HCV incidence.

Comparison 9 High NSP coverage versus low/no coverage, unadjusted estimates, Outcome 1 HCV incidence.
Figuras y tablas -
Analysis 9.1

Comparison 9 High NSP coverage versus low/no coverage, unadjusted estimates, Outcome 1 HCV incidence.

Comparison 10 Low NSP coverage versus no coverage, Outcome 1 HCV incidence, adjusted analyses.
Figuras y tablas -
Analysis 10.1

Comparison 10 Low NSP coverage versus no coverage, Outcome 1 HCV incidence, adjusted analyses.

Comparison 11 Low NSP coverage versus no NSP, unadjusted analysis, Outcome 1 HCV incidence.
Figuras y tablas -
Analysis 11.1

Comparison 11 Low NSP coverage versus no NSP, unadjusted analysis, Outcome 1 HCV incidence.

Comparison 12 Combined OST and high/low NSP versus no OST and low/no NSP, Outcome 1 HCV incidence adjusted analyses.
Figuras y tablas -
Analysis 12.1

Comparison 12 Combined OST and high/low NSP versus no OST and low/no NSP, Outcome 1 HCV incidence adjusted analyses.

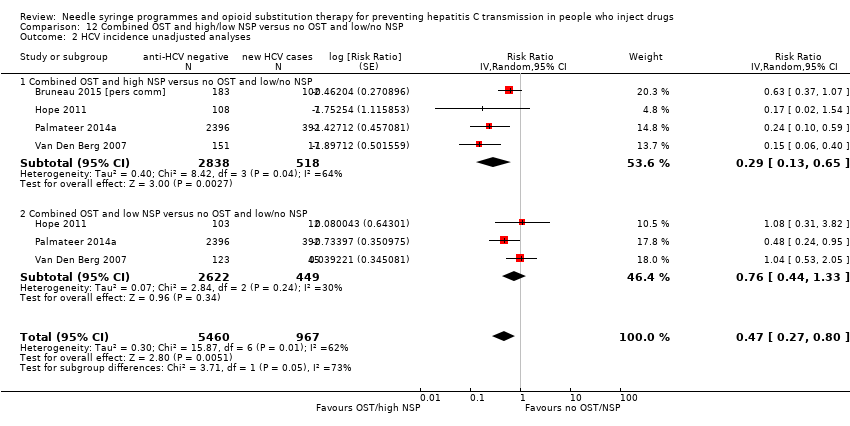
Comparison 12 Combined OST and high/low NSP versus no OST and low/no NSP, Outcome 2 HCV incidence unadjusted analyses.
Figuras y tablas -
Analysis 12.2

Comparison 12 Combined OST and high/low NSP versus no OST and low/no NSP, Outcome 2 HCV incidence unadjusted analyses.

Summary of findings for the main comparison. Current OST versus no OST for people who inject drugs

Current OST versus no OST

Patient or population: people who inject drugs
Settings: outpatient
Intervention: current OST versus no OST

Outcomes

Illustrative comparative risks* (95% CI)

Relative effect
(95% CI)

No of participants
(studies)

Quality of the evidence
(GRADE)

Assumed risk

Corresponding risk

No OST

Current OST

HCV incidence adjusted analyses
number of HCV seroconversion
Follow‐up: mean 440.5 person‐years

RR 0.50

(0.40 to 0.63)

6361
(12 studies)

⊕⊕⊝⊝
Lowa,b

*The basis for the assumed risk (e.g. the median control group risk across studies) is provided in footnotes. The corresponding risk (and its 95% confidence interval) is based on the assumed risk in the comparison group and the relative effect of the intervention (and its 95% CI).
CI: confidence interval; OST: opioid substitution therapy; RR: risk ratio.

GRADE Working Group grades of evidence
High quality: we are very confident that the true effect lies close to that of the estimate of the effect.
Moderate quality: we are moderately confident in the effect estimate: the true effect is likely to be close to the estimate of the effect, but there is a possibility that it is substantially different.
Low quality: our confidence in the effect estimate is limited: the true effect may be substantially different from the estimate of the effect.
Very low quality: we have very little confidence in the effect estimate: the true effect is likely to be substantially different from the estimate of effect

aDowngraded one level due to overall moderate risk of bias in 2 studies, overall serious risk of bias in 6 studies, 2 studies at overall critical risk of bias in 2 studies; not enough information to make judgment in 2 studies.
bUpgraded one level due to large magnitude of the effect: RR: 0.5.

Figuras y tablas -
Summary of findings for the main comparison. Current OST versus no OST for people who inject drugs
Summary of findings 2. High NSP coverage versus no/low NSP coverage for people who inject drugs

High NSP coverage versus no/low NSP coverage

Patient or population: people who inject drugs
Settings: outpatients
Intervention: high NSP coverage versus no/low NSP coverage

Outcomes

Illustrative comparative risks* (95% CI)

Relative effect
(95% CI)

No of participants
(studies)

Quality of the evidence
(GRADE)

Assumed risk

Corresponding risk

No/low NSP coverage

High NSP coverage

HCV incidence adjusted analyses
number of HCV seroconversion
Follow‐up: mean 269 person‐years

RR: 0.79 (0.39 to 1.61)

3530
(5 studies)

⊕⊝⊝⊝
Very lowa,b

*The basis for the assumed risk (e.g. the median control group risk across studies) is provided in footnotes. The corresponding risk (and its 95% confidence interval) is based on the assumed risk in the comparison group and the relative effect of the intervention (and its 95% CI).
CI: confidence interval; NSP: needle syringe programmes; RR: risk ratio.

GRADE Working Group grades of evidence
High quality: we are very confident that the true effect lies close to that of the estimate of the effect.
Moderate quality: we are moderately confident in the effect estimate: the true effect is likely to be close to the estimate of the effect, but there is a possibility that it is substantially different.
Low quality: our confidence in the effect estimate is limited: the true effect may be substantially different from the estimate of the effect.
Very low quality: we have very little confidence in the effect estimate: the true effect is likely to be substantially different from the estimate of effect.

aDowngraded one level due to serious overall risk of bias in all the studies.
bDowngraded one level due to significant heterogeneity: I2: 77%.

Figuras y tablas -
Summary of findings 2. High NSP coverage versus no/low NSP coverage for people who inject drugs
Summary of findings 3. Combined OST and high NSP versus no OST and low/no NSP for people who inject drugs

Combined OST and highNSP versus no OST and low/no NSP

Patient or population: people who inject drugs
Settings: outpatients
Intervention: Combined OST and high/low NSP versus no OST and low/no NSP

Outcomes

Illustrative comparative risks* (95% CI)

Relative effect
(95% CI)

No of participants
(studies)

Quality of the evidence
(GRADE)

Assumed risk

Corresponding risk

No OST and low/no NSP

Combined OST and high NSP

HCV incidence adjusted analyses
number of HCV seroconversions
Follow‐up: mean 356 person‐years

RR: 0.26 (0.07 to 0.89)

3241
(3 studies)

⊕⊕⊕⊝

Lowa,b

*The basis for the assumed risk (e.g. the median control group risk across studies) is provided in footnotes. The corresponding risk (and its 95% confidence interval) is based on the assumed risk in the comparison group and the relative effect of the intervention (and its 95% CI).
CI: Confidence interval; NSP: needle syringe programmes; OST: opioid substitution therapy; RR: Risk ratio.

GRADE Working Group grades of evidence
High quality: we are very confident that the true effect lies close to that of the estimate of the effect.
Moderate quality: we are moderately confident in the effect estimate: the true effect is likely to be close to the estimate of the effect, but there is a possibility that it is substantially different.
Low quality: our confidence in the effect estimate is limited: the true effect may be substantially different from the estimate of the effect.
Very low quality: we have very little confidence in the effect estimate: the true effect is likely to be substantially different from the estimate of effect.

aDowngraded one level due to serious overall risk of bias in all studies.
bUpgraded one level due to very large magnitude of the effect: RR: 0.26.

Figuras y tablas -
Summary of findings 3. Combined OST and high NSP versus no OST and low/no NSP for people who inject drugs
Table 1. Risk of bias of included studies

Study

Confounding

Selection bias

Measurement of interventions

Departures from intended interventions

Missing data

Measurement of outcomes

Selection of reported result

Overall risk of bias

Aitken 2015 [pers comm]

Critical

Critical

Serious

No info

Critical

Low

No info

Critical

Bruneau 2015 [pers comm]

Moderate

Serious

Moderate

No info

No info

Low

Low

Serious

Craine 2009

Serious

Serious

Serious

No info

Serious

Low

Low

Serious

Crofts 1997

Critical

Serious

Low

No info

Serious

Serious

Low

Critical

Hagan 1995

Serious

Serious

Serious

No info

Low

Low

Low

Serious

Hagan 1999

Moderate

Serious

Low

No info

Low

Low

Low

Serious

Holtzman 2009

Serious

Serious

Moderate

No info

No info

Low

Low

Serious

Hope 2011

Moderate

Moderate

Serious

No info

Low

Low

Low

Serious

Hope 2015 [pers comm]

Moderate

Moderate

Serious

No info

No info

Low

Low

Serious

Judd 2015 [pers comm]

Moderate

Critical

Critical

No info

Critical

Low

Low

Critical

Lucidarme 2004

Moderate

Serious

Serious

No info

Serious

Low

Low

Serious

Maher 2015

Moderate

Serious

Serious

No info

No info

Low

Low

Serious

Mehta 2015 [pers comm]

Moderate

No info

No info

No info

No info

Low

Low

No info

Nolan 2014

Serious

Serious

Moderate

No info

Low

Low

Low

Serious

Page 2015 [pers comm]

Moderate

No info

No info

No info

No info

Low

Low

No info

Palmateer 2014a

Serious

Serious

Moderate

No info

Serious

Low

Low

Serious

Patrick 2001

Serious

Moderate

Serious

No info

Serious

Low

Low

Serious

Rezza 1996

Serious

Low

Serious

No info

Critical

Low

Low

Critical

Roy 2007

Serious

Serious

Serious

No info

Critical

Low

Low

Critical

Ruan 2007

Critical

Critical

Serious

No info

Serious

Low

Low

Critical

Spittal 2012

Serious

Serious

Moderate

No info

Low

Low

Low

Serious

Thiede 2000

Moderate

Moderate

Low

No info

Low

Low

Low

Moderate

Thorpe 2002

Serious

Serious

Serious

No info

Moderate

Low

Low

Serious

Tsui 2014

Moderate

Moderate

Low

No info

Moderate

Low

Low

Moderate

Vallejo 2015

Serious

Serious

Low

No info

Serious

Low

Low

Serious

Van Beek 1998

Critical

Serious

Serious

No info

Critical

Low

Low

Critical

Van Den Berg 2007

Serious

Serious

Moderate

No info

Serious

Low

Low

Serious

White 2014

Moderate

Serious

Moderate

No info

No info

Low

Low

Serious

Figuras y tablas -
Table 1. Risk of bias of included studies
Table 2. Univariable meta‐regression analysis for studies measuring impact of current use of OST on HCV incidence

Variable

Studies

Univariable rate ratio (95% CI)

Ratio of rate ratios

(95% CI)

P value

Tau2

Geographic region

Europe

8

0.51 (0.37‐0.70)

1.0 (ref)

Australia

5

0.55 (0.28‐1.11)

1.12 (0.52‐2.41)

North America

6

0.69 (0.44‐1.08)

1.42 (0.73‐2.78)

0.53

0.10

Site of recruitment

Service attenders

12

0.67 (0.49‐0.92)

1.0 (ref)

Community

7

0.49 (0.33‐0.73)

0.73 (0.42‐1.27)

0.256

0.06

Study design

Cross‐sectional

4

0.51 (0.31‐0.85)

1.0

Prospective cohort

15

0.58 (0.43‐0.77)

1.12 (0.48‐2.61)

0.784

0.10

Females

17

1.59 (1.13‐2.29)

0.01

0.04

Prison experience

11

1.057 (0.61‐1.79)

0.821

0.43

Experience of homelessness

12

1.08 (0.83‐1.40)

0.521

0.23

Injection of stimulants

12

0.89 (0.65‐1.22)

0.373

0.17

Daily injection

7

0.88 (0.64‐1.22)

0.373

0.17

CI: confidence interval; HCV: hepatitis C virus; OST: opioid substitution therapy.

Figuras y tablas -
Table 2. Univariable meta‐regression analysis for studies measuring impact of current use of OST on HCV incidence
Table 3. Univariable meta‐regression analysis for studies measuring impact of high NSP coverage on HCV incidence

Variable

Studies

Univariable rate ratio (95%CI)

Ratio of rate ratios (95%CI)

P value

Tau2

Geographic region

Europe

5

0.44 (0.24‐0.80)

1.0 (Ref)

North America

3

1.58 (0.57‐4.42)

3.73 (0.95‐14.7)

0.057

0.41

Recruitment site

Service attenders

3

0.67 (0.28‐1.59)

1.0 (Ref)

Community

5

0.82 (0.29‐2.32)

0.76(0.12‐4.88)

0.74

0.89

Study design

Cross‐sectional survey

3

0.34 (0.16‐0.75)

1.0 (Ref)

Prospective cohort

4

1.26 (0.55‐2.93)

3.53 (0.78‐15.86)

0.087

0.48

Females

7

2.97(0.38‐23.1)

0.24

0.87

Prison experience

3

NA

Experience of homelessness

6

1.01 (0.38‐2.67)

0.976

1.53

Injection of stimulants

7

1.08 (0.47‐2.51)

0.827

1.15

Daily injection

5

3.66 (0.22‐61.3)

0.239

1.15

CI: confidence interval; HCV: hepatitis C virus; NSP: needle syringe programmes.

Figuras y tablas -
Table 3. Univariable meta‐regression analysis for studies measuring impact of high NSP coverage on HCV incidence
Comparison 1. Current OST versus no OST

Outcome or subgroup title

No. of studies

No. of participants

Statistical method

Effect size

1 HCV incidence adjusted analyses by region Show forest plot

12

6361

Risk Ratio (Random, 95% CI)

0.50 [0.40, 0.63]

1.1 North America

5

2245

Risk Ratio (Random, 95% CI)

0.57 [0.42, 0.76]

1.2 Europe

5

3494

Risk Ratio (Random, 95% CI)

0.43 [0.27, 0.68]

1.3 Australia

2

622

Risk Ratio (Random, 95% CI)

0.42 [0.25, 0.72]

2 HCV incidence adjusted analysis by study design Show forest plot

12

6361

Risk Ratio (Random, 95% CI)

0.50 [0.40, 0.63]

2.1 Prospective cohort

10

3467

Risk Ratio (Random, 95% CI)

0.51 [0.40, 0.65]

2.2 Cross‐sectional surveys

2

2894

Risk Ratio (Random, 95% CI)

0.46 [0.23, 0.89]

3 HCV incidence unadjusted analyses by different modes of OST provision Show forest plot

9

Risk Ratio (Random, 95% CI)

Subtotals only

3.1 Ever used OST

3

375

Risk Ratio (Random, 95% CI)

0.81 [0.52, 1.27]

3.2 Interrupted OST use

3

1157

Risk Ratio (Random, 95% CI)

0.80 [0.57, 1.10]

3.3 Detoxification

1

552

Risk Ratio (Random, 95% CI)

1.45 [0.79, 2.66]

3.4 High dose

2

453

Risk Ratio (Random, 95% CI)

0.52 [0.29, 0.94]

3.5 Low dose

2

453

Risk Ratio (Random, 95% CI)

0.85 [0.44, 1.65]

Figuras y tablas -
Comparison 1. Current OST versus no OST
Comparison 2. Sensitivity analysis: OST versus no OST, adjusted analyses excluding unpublished datasets

Outcome or subgroup title

No. of studies

No. of participants

Statistical method

Effect size

1 HCV incidence Show forest plot

8

5235

Risk Ratio (Random, 95% CI)

0.42 [0.31, 0.58]

Figuras y tablas -
Comparison 2. Sensitivity analysis: OST versus no OST, adjusted analyses excluding unpublished datasets
Comparison 3. Sensitivity analysis: OST versus no OST, adjusted analyses excluding studies at critical risk of bias

Outcome or subgroup title

No. of studies

No. of participants

Statistical method

Effect size

1 HCV incidence Show forest plot

9

5782

Risk Ratio (Random, 95% CI)

0.51 [0.40, 0.64]

Figuras y tablas -
Comparison 3. Sensitivity analysis: OST versus no OST, adjusted analyses excluding studies at critical risk of bias
Comparison 4. Sensitivity analysis: OST versus no OST, adjusted analyses excluding cross‐sectional studies

Outcome or subgroup title

No. of studies

No. of participants

Statistical method

Effect size

1 HCV incidence Show forest plot

10

3467

Risk Ratio (Random, 95% CI)

0.51 [0.40, 0.65]

Figuras y tablas -
Comparison 4. Sensitivity analysis: OST versus no OST, adjusted analyses excluding cross‐sectional studies
Comparison 5. OST versus no OST, unadjusted analysis

Outcome or subgroup title

No. of studies

No. of participants

Statistical method

Effect size

1 HCV incidence Show forest plot

16

9499

Risk Ratio (Random, 95% CI)

0.57 [0.45, 0.73]

Figuras y tablas -
Comparison 5. OST versus no OST, unadjusted analysis
Comparison 6. High NSP coverage versus no/low NSP coverage

Outcome or subgroup title

No. of studies

No. of participants

Statistical method

Effect size

1 HCV incidence adjusted analyses by region Show forest plot

5

3530

Risk Ratio (Random, 95% CI)

0.79 [0.39, 1.61]

1.1 North America

3

627

Risk Ratio (Random, 95% CI)

1.25 [0.63, 2.46]

1.2 Europe

2

2903

Risk Ratio (Random, 95% CI)

0.24 [0.09, 0.62]

2 HCV incidence adjusted analyses by study design Show forest plot

5

3530

Risk Ratio (Random, 95% CI)

0.95 [0.50, 1.82]

2.1 Prospective cohorts

3

627

Risk Ratio (Random, 95% CI)

1.44 [1.01, 2.05]

2.2 Cross‐sectional surveys

2

2903

Risk Ratio (Random, 95% CI)

0.24 [0.09, 0.62]

Figuras y tablas -
Comparison 6. High NSP coverage versus no/low NSP coverage
Comparison 7. Sensitivity analysis: high NSP versus low/no NSP, excluding unpublished data

Outcome or subgroup title

No. of studies

No. of participants

Statistical method

Effect size

1 HCV incidence Show forest plot

4

3245

Risk Ratio (Random, 95% CI)

0.77 [0.28, 2.13]

Figuras y tablas -
Comparison 7. Sensitivity analysis: high NSP versus low/no NSP, excluding unpublished data
Comparison 8. Sensitivity analysis: high NSP versus low/no NSP, excluding cross‐sectional surveys

Outcome or subgroup title

No. of studies

No. of participants

Statistical method

Effect size

1 HCV incidence Show forest plot

3

627

Risk Ratio (Random, 95% CI)

1.25 [0.63, 2.46]

Figuras y tablas -
Comparison 8. Sensitivity analysis: high NSP versus low/no NSP, excluding cross‐sectional surveys
Comparison 9. High NSP coverage versus low/no coverage, unadjusted estimates

Outcome or subgroup title

No. of studies

No. of participants

Statistical method

Effect size

1 HCV incidence Show forest plot

7

6455

Risk Ratio (Random, 95% CI)

0.78 [0.39, 1.55]

Figuras y tablas -
Comparison 9. High NSP coverage versus low/no coverage, unadjusted estimates
Comparison 10. Low NSP coverage versus no coverage

Outcome or subgroup title

No. of studies

No. of participants

Statistical method

Effect size

1 HCV incidence, adjusted analyses Show forest plot

6

2765

Risk Ratio (Random, 95% CI)

1.43 [0.82, 2.49]

Figuras y tablas -
Comparison 10. Low NSP coverage versus no coverage
Comparison 11. Low NSP coverage versus no NSP, unadjusted analysis

Outcome or subgroup title

No. of studies

No. of participants

Statistical method

Effect size

1 HCV incidence Show forest plot

9

3242

Risk Ratio (Random, 95% CI)

1.41 [0.95, 2.09]

Figuras y tablas -
Comparison 11. Low NSP coverage versus no NSP, unadjusted analysis
Comparison 12. Combined OST and high/low NSP versus no OST and low/no NSP

Outcome or subgroup title

No. of studies

No. of participants

Statistical method

Effect size

1 HCV incidence adjusted analyses Show forest plot

3

6197

Risk Ratio (Random, 95% CI)

0.45 [0.22, 0.94]

1.1 High NSP coverage

3

3241

Risk Ratio (Random, 95% CI)

0.26 [0.07, 0.89]

1.2 Low NSP coverage

2

2956

Risk Ratio (Random, 95% CI)

0.87 [0.44, 1.68]

2 HCV incidence unadjusted analyses Show forest plot

4

6427

Risk Ratio (Random, 95% CI)

0.47 [0.27, 0.80]

2.1 Combined OST and high NSP versus no OST and low/no NSP

4

3356

Risk Ratio (Random, 95% CI)

0.29 [0.13, 0.65]

2.2 Combined OST and low NSP versus no OST and low/no NSP

3

3071

Risk Ratio (Random, 95% CI)

0.76 [0.44, 1.33]

Figuras y tablas -
Comparison 12. Combined OST and high/low NSP versus no OST and low/no NSP