Auf Eltern beschränkte Interventionen bei übergewichtigen oder adipösen Kindern im Alter von 5 bis 11 Jahren
Abstract
Background
Child and adolescent overweight and obesity have increased globally, and are associated with short‐ and long‐term health consequences.
Objectives
To assess the efficacy of diet, physical activity and behavioural interventions delivered to parents only for the treatment of overweight and obesity in children aged 5 to 11 years.
Search methods
We performed a systematic literature search of databases including the Cochrane Library, MEDLINE, EMBASE, PsycINFO, CINAHL and LILACS as well trial registers. We checked references of identified trials and systematic reviews. We applied no language restrictions. The date of the last search was March 2015 for all databases.
Selection criteria
We selected randomised controlled trials (RCTs) of diet, physical activity and behavioural interventions delivered to parents only for treating overweight or obesity in children aged 5 to 11 years.
Data collection and analysis
Two review authors independently assessed trials for risk of bias and evaluated overall study quality using the GRADE instrument. Where necessary, we contacted authors for additional information.
Main results
We included 20 RCTs, including 3057 participants. The number of participants ranged per trial between 15 and 645. Follow‐up ranged between 24 weeks and two years. Eighteen trials were parallel RCTs and two were cluster RCTs. Twelve RCTs had two comparisons and eight RCTs had three comparisons. The interventions varied widely; the duration, content, delivery and follow‐up of the interventions were heterogeneous. The comparators also differed. This review categorised the comparisons into four groups: parent‐only versus parent‐child, parent‐only versus waiting list controls, parent‐only versus minimal contact interventions and parent‐only versus other parent‐only interventions.
Trial quality was generally low with a large proportion of trials rated as high risk of bias on individual risk of bias criteria.
In trials comparing a parent‐only intervention with a parent‐child intervention, the body mass index (BMI) z score change showed a mean difference (MD) at the longest follow‐up period (10 to 24 months) of ‐0.04 (95% confidence interval (CI) ‐0.15 to 0.08); P = 0.56; 267 participants; 3 trials; low quality evidence. In trials comparing a parent‐only intervention with a waiting list control, the BMI z score change in favour of the parent‐only intervention at the longest follow‐up period (10‐12 months) had an MD of ‐0.10 (95% CI ‐0.19 to ‐0.01); P = 0.04; 136 participants; 2 trials; low quality evidence. BMI z score change of parent‐only interventions when compared with minimal contact control interventions at the longest follow‐up period (9 to 12 months) showed an MD of 0.01 (95% CI ‐0.07 to 0.09); P = 0.81; 165 participants; 1 trial; low quality evidence. There were few similarities between interventions and comparators across the included trials in the parent‐only intervention versus other parent‐only interventions and we did not pool these data. Generally, these trials did not show substantial differences between their respective parent‐only groups on BMI outcomes.
Other outcomes such as behavioural measures, parent‐child relationships and health‐related quality of life were reported inconsistently. Adverse effects of the interventions were generally not reported, two trials stated that there were no serious adverse effects. No trials reported on all‐cause mortality, morbidity or socioeconomic effects.
All results need to be interpreted cautiously because of their low quality, the heterogeneous interventions and comparators, and the high rates of non‐completion.
Authors' conclusions
Parent‐only interventions may be an effective treatment option for overweight or obese children aged 5 to 11 years when compared with waiting list controls. Parent‐only interventions had similar effects compared with parent‐child interventions and compared with those with minimal contact controls. However, the evidence is at present limited; some of the trials had a high risk of bias with loss to follow‐up being a particular issue and there was a lack of evidence for several important outcomes. The systematic review has identified 10 ongoing trials that have a parent‐only arm, which will contribute to future updates. These trials will improve the robustness of the analyses by type of comparator, and may permit subgroup analysis by intervention component and the setting. Trial reports should provide adequate details about the interventions to be replicated by others. There is a need to conduct and report cost‐effectiveness analyses in future trials in order to establish whether parent‐only interventions are more cost‐effective than parent‐child interventions.
PICO
Laienverständliche Zusammenfassung
Auf Eltern beschränkte Interventionen bei übergewichtigen oder adipösen Kindern im Alter von 5 bis 11 Jahren
Fragestellung des Reviews
Wie wirksam sind Interventionen bezüglich Ernährung, körperlicher Betätigung und Verhalten, wenn diese lediglich den Eltern vermittelt werden, um das Gewicht übergewichtiger und adipöser Kinder zu reduzieren?
Hintergrund
Auf der ganzen Welt leiden immer mehr Kinder an Übergewicht und Adipositas. Bei diesen Kindern besteht ein erhöhtes Gesundheitsrisiko sowohl im Kindesalter als auch im späteren Leben. Die Eltern können die Ernährungsgewohnheiten ihrer Kinder maßgeblich beeinflussen. Um herauszufinden, ob die Beratung der Eltern bezüglich der familiären Ernährungsgewohnheiten und des Lebensstils zur Lösung dieses Problems beisteuert, bedarf es weiterführender Informationen.
Studienmerkmale
Wir identifizierten 20 randomisierte, kontrollierte klinische Studien (Untersuchungen, in denen die Teilnehmer zufällig auf eine, zwei oder mehr Behandlungsgruppen verteilt werden). In diesen Studien wurden Behandlungen (Interventionen) bezüglich Ernährung, körperlicher Aktivität und Verhalten der Teilnehmer (bei denen sich eine Veränderung oder Verbesserung der Lebensgewohnheiten zeigte) gegen unterschiedliche Kontrollgruppen verglichen (in denen die Teilnehmer keine Behandlungen erhielten). Diese Interventionen bezogen sich lediglich auf die Eltern von insgesamt 3.057 Kindern im Alter von 5 bis 11 Jahren. Es gab nur wenige Ähnlichkeiten bezüglich der Art der verwendeten Interventionen. Wir gruppierten die Studien nach Art des verwendeten Vergleichs. Unser systematischer Review berichtete über die Wirkung der auf die Eltern beschränkten Interventionen im Vergleich zu Interventionen an Eltern und Kindern gleichzeitig, Wartelisten‐Kontrollgruppen (bei denen die Interventionen bis zum Ende der Studie verzögert wurden), anderen Interventionen mit lediglich minimaler Beratung oder Kontakt sowie anderen Arten von auf die Eltern beschränkten Interventionen. Die in die Studien eingeschlossenen Kinder wurden zwischen sechs Monate und zwei Jahre nachbeobachtet. Die vorliegende Evidenz befindet sich auf dem Stand von März 2015.
Hauptergebnisse
Der am häufigsten berichtete Endpunkt betraf den Body‐Mass‐Index (BMI). Dabei handelt es sich um ein Maß für das Körperfett. Die Berechnung erfolgt, indem man das Körpergewicht (in Kilogramm) durch das Quadrat der Körpergröße (in Metern) dividiert (kg/m2). In den Studien wurden Geschlecht, Körpergewicht und Körpergröße im Laufe der körperlichen Entwicklung der Kinder für die Berechnung des BMI berücksichtigt (z.B. über den z‐Wert des BMI und das Perzentil des BMI).
Im Vergleich zur Wartelisten‐Kontrollgruppe bestand nur eingeschränkte Evidenz dafür, dass eine elterliche Intervention zur Senkung des BMI führte. Bei Betrachtung der längsten Nachbeobachtungszeiten der eingeschlossenen Studien konnten wir keine robuste Evidenz bezüglich der Vor‐ oder Nachteile der auf die Eltern beschränkten Interventionen identifizierten, weder im Vergleich zu den Interventionen bei Eltern und Kind gleichzeitig noch im Vergleich zu den Interventionen mit eingeschränkter Beratung. Im Rahmen unseres Reviews konnten wir nur sehr wenige Angaben darüber finden, wie sich die verschiedenen Arten elterlicher Interventionen zueinander verhalten. In keiner der Studien wurde über Todesfälle jeglicher Ursache, Erkrankungen oder sozioökonomische Effekte (z.B. ob auf die Eltern beschränkte Interventionen kostengünstiger sind als Interventionen bei Eltern und Kind gleichzeitig) berichtet. Zwei Studien erläuterten, dass keine schwerwiegenden Nebenwirkungen auftraten, während die übrigen Studien keine Aussage über das Auftreten von Nebenwirkungen machten. Nur selten wurde über das Verhältnis zwischen Eltern und Kind oder die gesundheitsbezogene Lebensqualität berichtet.
Qualität der Evidenz
Insgesamt war die Qualität der Evidenz niedrig. Dies lag hauptsächlich an der geringen Studienzahl pro Endpunkt oder an der geringen Anzahl an eingeschlossenen Kindern. Zudem brachen viele Kinder die Studien vor dem regulären Studienende ab.
Authors' conclusions
Summary of findings
| Parent‐only interventions vs. parent‐child interventions for childhood overweight or obesity | ||||||
| Population: children with overweight or obesity Settings: outpatients; community/university Intervention: parent‐only interventions Comparison: parent‐child interventions | ||||||
| Outcomes | Parent‐child | Parent‐only | Relative effect | No of participants | Quality of the evidence | Comments |
| BMI z score change (x * SD) Follow‐up: 40‐104 weeks | The mean BMI z score change ranged across control groups from ‐0.16 to ‐0.24 | The mean BMI z score change in the intervention groups was 0.04 lower (0.15 lower to 0.08 higher) | ‐ | 267 (3) | ⊕⊕⊝⊝ | Lower scores indicate improved weight loss |
| Adverse events | See comment | See comment | See comment | See comment | See comment | No trials reported adverse events |
| Health‐related quality of life | See comment | See comment | See comment | See comment | See comment | No trials reported health‐related quality of life |
| All‐cause mortality | See comment | See comment | See comment | See comment | See comment | No trials reported all‐cause mortality |
| Morbidity | See comment | See comment | See comment | See comment | See comment | No trials reported morbidity |
| Parent‐child relationship or assessment of parenting | See comment | See comment | See comment | See comment | See comment | No trials reported outcomes assessing parent‐child relationships or an assessment of parenting |
| Socioeconomic effects | See comment | See comment | See comment | See comment | See comment | No trials reported socioeconomic effects |
| *The basis for the assumed risk (e.g. the median control group risk across trials) is provided in footnotes. The corresponding risk (and its 95% confidence interval) is based on the assumed risk in the comparison group and the relative effect of the intervention (and its 95% CI). GRADE Working Group grades of evidence | ||||||
| "A BMI z score or standard deviation score indicates how many units (of the standard deviation) a child's BMI is above or below the average BMI value for their age group and sex. For instance, a z score of 1.5 indicates that a child' is 1.5 standard deviations above the average value, and a z score of ‐1.5 indicates a child is 1.5 standard deviations below the average value" (Noo NHS 2011). aDowngraded by one level because of serious risk of attrition bias and one level for serious imprecision (see Appendix 9). | ||||||
| Parent‐only interventions vs. waiting list control for childhood overweight or obesity | ||||||
| Population: children with overweight or obesity Settings: outpatients; community Intervention: parent‐only interventions Comparison: waiting list control | ||||||
| Outcomes | Waiting list | Parent‐only | Relative effect | No of participants | Quality of the evidence | Comments |
| BMI z score change (x * SD) Follow‐up: 40‐48 weeks | The mean BMI z score change ranged across control groups from ‐0.13 to 0.02 | The mean BMI z score change in the intervention groups was 0.1 lower (0.19 lower to 0.01 lower) | ‐ | 136 (2) | ⊕⊕⊝⊝ | Lower scores indicate improved weight loss |
| Adverse events | See comment | See comment | See comment | See comment | See comment | No trials reported adverse events |
| Health‐related quality of life | See comment | See comment | See comment | See comment | See comment | No trials reported health‐related quality of life |
| All‐cause mortality | See comment | See comment | See comment | See comment | See comment | No trials reported all‐cause mortality |
| Morbidity | See comment | See comment | See comment | See comment | See comment | No trials reported morbidity |
| Parent‐child relationship or assessment of parenting (parenting scale (PS), 30 items, scored from 1 to 7; lower scores indicate more effective parental discipline practices) Follow‐up: 12 weeks | The mean PS score for the control group was 3.4 | The mean PS score in the intervention group was 0.6 points lower | ‐ | 101 (1) | ⊕⊕⊝⊝ | ‐ |
| Socioeconomic effects | See comment | See comment | See comment | See comment | See comment | No trials reported socioeconomic effects |
| *The basis for the assumed risk (e.g. the median control group risk across trials) is provided in footnotes. The corresponding risk (and its 95% confidence interval) is based on the assumed risk in the comparison group and the relative effect of the intervention (and its 95% CI). GRADE Working Group grades of evidence | ||||||
| "A BMI z score or standard deviation score indicates how many units (of the standard deviation) a child's BMI is above or below the average BMI value for their age group and sex. For instance, a z score of 1.5 indicates that a child' is 1.5 standard deviations above the average value, and a z score of ‐1.5 indicates a child is 1.5 standard deviations below the average value" (Noo NHS 2011). aDowngraded by one level because of serious risk of attrition bias and one level for serious imprecision (see Appendix 9). | ||||||
| Parent‐only interventions vs. minimal contact control for childhood overweight or obesity | ||||||
| Population: children with overweight or obesity Settings: outpatients Intervention: parent‐only interventions Comparison: minimal contact control | ||||||
| Outcomes | Minimal contact | Parent‐only | Relative effect | No of participants | Quality of the evidence | Comments |
| BMI z score change (x * SD) Follow‐up: 52 weeks | The mean BMI z score change ranged across control groups from ‐0.06 to ‐0.06 | The mean BMI z score change in the intervention group was 0.01 lower (‐0.07 lower to 0.09 higher) | ‐ | 165 (1) | ⊕⊕⊝⊝ | Lower scores indicate improved weight loss |
| Adverse events | See comment | See comment | See comment | See comment | See comment | No trials reported adverse events |
| Health‐related quality of life (Pediatric Health‐Related Quality of Life, scale from 0 to 100; higher scores indicate better HRQoL) Follow‐up: 24 weeks) | See comment | See comment | See comment | 93 (1) | See comment | No data were presented ('"no improvements in health‐related quality of life") |
| All‐cause mortality | See comment | See comment | See comment | See comment | See comment | No trials reported all‐cause mortality |
| Morbidity | See comment | See comment | See comment | See comment | See comment | No trials reported morbidity |
| Parent‐child relationship or assessment of parenting (Child Feeding Questionnaire subscale parental concern (total of 7 subscales), score range 3‐15; higher scores indicate greater parental concern) Follow‐up: 12 weeks | The mean parent concern score was 4.7 in the control group | The mean parent concern score in the intervention group was 0.1 lower. | ‐ | 93 (1) | ⊕⊕⊝⊝ | ‐ |
| Socioeconomic effects | See comment | See comment | See comment | See comment | See comment | No trials reported socioeconomic effects |
| *The basis for the assumed risk (e.g. the median control group risk across trials) is provided in footnotes. The corresponding risk (and its 95% confidence interval) is based on the assumed risk in the comparison group and the relative effect of the intervention (and its 95% CI). GRADE Working Group grades of evidence | ||||||
| "A BMI z score or standard deviation score indicates how many units (of the standard deviation) a child's BMI is above or below the average BMI value for their age group and sex. For instance, a z score of 1.5 indicates that a child' is 1.5 standard deviations above the average value, and a z score of ‐1.5 indicates a child is 1.5 standard deviations below the average value" (Noo NHS 2011). aDowngraded by one level because of serious risk of attrition bias and one level for serious imprecision (see Appendix 9). | ||||||
| Parent‐only interventions vs. parent‐only interventions for childhood overweight or obesity | ||||||
| Population: children with overweight or obesity Settings: outpatients; university + primary care Intervention: parent‐only interventions Comparison: parent‐only interventions | ||||||
| Outcomes | Parent‐only | Parent‐only | Relative effect | No of participants | Quality of the evidence | Comments |
| BMI z score change (x * SD) Follow‐up: 12‐24 months | See comment | See comment | See comment | 467 (5) | ⊕⊕⊝⊝ | No meta‐analysis because of little consistency between trial interventions and comparators; there were no substantial differences between different parent‐only interventions |
| Adverse events | See comment | See comment | See comment | See comment | See comment | Two trials reported that there were no serious adverse events (Raynor 2012a; Raynor 2012b) |
| Health‐related quality of life | See comment | See comment | See comment | See comment | See comment | No trials reported health‐related quality of life |
| All‐cause mortality | See comment | See comment | See comment | See comment | See comment | No trials reported all‐cause mortality |
| Morbidity | See comment | See comment | See comment | See comment | See comment | No trials reported morbidity |
| Parent‐child relationship or assessment of parenting (Alabama Parenting Questionnaire, 35 items; higher scores indicate improvement) Follow‐up: 24 months | See comment | See comment | See comment | 106 (1) | See comment | 1 study assessed parent‐child relationship or assessment of parenting but there were no data for comparisons between intervention groups provided |
| Socioeconomic effects | See comment | See comment | See comment | See comment | See comment | No trials reported socioeconomic effects |
| *The basis for the assumed risk (e.g. the median control group risk across trials) is provided in footnotes. The corresponding risk (and its 95% confidence interval) is based on the assumed risk in the comparison group and the relative effect of the intervention (and its 95% CI). GRADE Working Group grades of evidence | ||||||
| "A BMI z score or standard deviation score indicates how many units (of the standard deviation) a child's BMI is above or below the average BMI value for their age group and sex. For instance, a z score of 1.5 indicates that a child' is 1.5 standard deviations above the average value, and a z score of ‐1.5 indicates a child is 1.5 standard deviations below the average value" (Noo NHS 2011). aDowngraded by one level because of serious risk of attrition bias and one level for serious imprecision (see Appendix 9) | ||||||
Background
The prevalence of overweight and obese children and adolescents has increased throughout the world, presenting a global public health crisis (Ng 2014; WHO 2015a). Although once considered to be a condition affecting only developed countries, rates of paediatric overweight and obesity have started to rise dramatically in some developing countries (Wang 2012). Using the International Obesity Task Force (IOTF) standard definition, the age‐standardised prevalence of overweight and obesity in children and adolescents has increased in both developed and developing countries since the mid‐1980s (Cole 2000). In 2013, the prevalence of overweight and obese children and adolescents in developed countries was estimated at 23.8% (95% confidence interval (CI) 22.9 to 24.7)) for boys and 22.6% (95% CI 21.7 to 23.6) for girls. In developing countries, the prevalence was estimated as 12.9% (95% CI 12.3 to 13.5) for boys and 13.4% (95% CI 13.0 to 13.9) for girls (Ng 2014). Very young children are also affected. In 2010, de Onis 2010 used the World Health Organization (WHO) growth standards (WHO 2015b) to estimate that over 42 million children under five years of age were overweight or obese, with approximately 35 million of these children living in developing countries.
Inequalities in overweight and obesity prevalence have also been documented. Generally, socioeconomically disadvantaged children in developed countries (Knai 2012; Shrewsbury 2008), and children of higher socioeconomic status in developing countries (Lobstein 2004; Wang 2012), are at greater risk of becoming overweight. However, this relationship may vary by population demographics (e.g. age, gender, ethnicity), and environment (e.g. country, urbanisation) (Wang 2012). The prevalence of obesity varies by ethnicity, with large data sets showing substantial ethnic variation in English (HSCIC 2015), American (Freedman 2006; Skinner 2014), and New Zealand (Rajput 2014) child populations.
While there is some evidence that the rate of increase in paediatric obesity may be slowing in some developed countries, current levels remain too high, and continue to rise in many developing countries (Olds 2011; Rokholm 2010). However, an additional concern in some developed countries such as the USA (Kelly 2013; Skinner 2014), and England (CMO 2012; Ells 2015), is the rise in severe paediatric obesity. While the IOTF published an international definition for severe paediatric (morbid) obesity in 2012 (Cole 2012), often severe obesity prevalence is reported using country‐specific cut‐off points making international comparisons difficult. However, data from the USA (Skinner 2014), and England (Ells 2015), have shown that the prevalence of severe paediatric obesity varies by socioeconomic status and ethnicity, and may result in a greater risk of adverse cardio‐metabolic events and severe obesity in adulthood (Kelly 2013).
Description of the condition
Childhood overweight and obesity results from an accumulation of excess body fat, and can increase the risk of both short‐ and longer‐term health consequences. Numerous obesity‐related co‐morbidities can develop during childhood, which include muscular skeletal complaints (Paulis 2014); cardiovascular risk factors such as hypertension, insulin resistance and hyperlipidaemia (Reilly 2003), even in very young children (Bocca 2013); and conditions such as such as sleep apnoea (Narang 2012), asthma (Egan 2013), liver disease, and type 2 diabetes (Daniels 2009; Lobstein 2004). The condition can also affect psychosocial well‐being, with obese young people susceptible to reduced self esteem and health‐related quality of life (Griffiths 2010), and stigmatisation (Puhl 2007; Tang‐Peronard 2008). Evidence also shows that childhood obesity can track into adulthood (Parsons 1999; Singh 2008; Whitaker 1997), and is therefore associated with an increased risk of ill health later in life (Reilly 2011).
Description of the intervention
Given the serious implications associated with childhood and adolescent obesity, effective treatment is imperative. While the fundamental principles of weight management in children and adolescents are the same as adults (i.e. reduced energy intake and increased energy expenditure), the primary aim of treatment (i.e. weight reduction or deceleration of weight gain) and the most suitable intervention approach varies, and is dependent on the child's age and degree of excess weight, among other considerations.
Family‐based interventions combining dietary, physical activity and behavioural components are effective and are considered as the current best practice in the treatment of childhood obesity in children under 12 years of age (Oude Luttikhuis 2009). However, interventions that involve the whole family can be costly, especially with parents and children in separate groups and when not running at full capacity (Upton 2012). Therefore, increased attention is being paid to the possibility of parent‐focused interventions.
Parents have been defined as the 'agents of change' for intervening with children under 12 years of age who are obese (Golan 2004). Several interventions have been developed where parents are targeted solely for the treatment of their child's obesity, thereafter referred to as 'parent‐only' interventions, in which the child is not involved directly with the intervention. Parent‐only interventions vary both by type (e.g. based on parenting courses, cognitive behavioural therapy, behaviour change) and by setting (e.g. community, clinic based).
Adverse effects of the intervention
It is not anticipated that parent‐only interventions will lead to adverse outcomes. However, as with all obesity treatment interventions in children and young people, potential adverse effects should be considered, including effects on linear growth, eating disorders and psychological well‐being.
How the intervention might work
The home environment is important in the aetiology of childhood obesity, with parents playing a large role in food choice and physical activity for their children. In surveys in the US, Wansink estimated that the 'nutritional gatekeeper' (who buys and cooks the food) controls 72% of the food eaten by children, both within and outside the home (Wansink 2006). One systematic review by Clark et al. showed that a high level of parental restriction of snack foods is associated with increased energy intake and weight gain in children (Clark 2007). In contrast, 'covert' control of children's food intake by controlling the home eating environment to limit exposure to unhealthy foods (i.e. not buying unhealthy foods) lows the intake of unhealthy snacks when compared with 'overt' control (i.e. buying the snacks but not allowing access) (Ogden 2006). In terms of physical activity, one systematic review showed that parental support is strongly associated with physical activity levels in children, albeit the influence of parental modelling by being physically active themselves was inconsistent (Gustafson 2006).
Poor family functioning, such as poor communication and high levels of conflict, is also associated with higher risk of obesity in children (Halliday 2014). Authoritative parenting style is associated with lower risk of obesity in children, when compared with other parenting styles (Sleddens 2011).
Due to the importance of the role of parents in the home environment and the importance of parenting styles and skills, parents have been defined as the 'agents of change' in the family for intervening with children under 12 years of age who are obese (Golan 2004). The importance of parents in the change process has led to a questioning of whether children need to be at the intervention. Parent‐only interventions aim to work by giving parents the responsibility for their family's eating and physical activity environment and by increasing parental capacity to implement the lifestyle changes. Trials have assessed whether parent‐only interventions are superior to or equivalent to parent‐child interventions, as well as comparisons with waiting list control.
Why it is important to do this review
The first version of this systematic review was published in 2003 and included analysis of childhood obesity treatment trials published up to July 2001 (Summerbell 2003). The second version was published in 2009 providing an update to the 2003 review (Oude Luttikhuis 2009).
To reflect the rapid growth in this field, the third update to this review has been split across six reviews focusing on the following treatment approaches: surgery; drugs; parent‐only interventions; diet, physical activity and behavioural interventions for young children aged 0 to 4 years; school children aged 5 to 11 years and adolescents aged 12 to 17 years.
The current review examined the effectiveness of interventions in which parents were targeted solely for the treatment of childhood obesity. This review built on two reviews in this area in which parent‐only interventions appeared to be as effective as interventions that adopted the traditional model where the parent and child were both involved in the intervention (Ewald 2014; Jull 2013). Faith 2012 revealed inconsistent evidence that greater parent and adult carer involvement was associated with better child outcomes. This review extended the evidence of effectiveness by including trials that compared parent‐only interventions with parent‐child interventions, waiting list controls, other interventions with only minimal information or contact and other types of parent‐only interventions. These trials were brought together to examine the effectiveness of parent‐only interventions for the treatment of childhood obesity. The review also intended to explore the impact of the type of parent‐only intervention (e.g. focusing on parenting, cognitive behavioural therapy, behaviour change) and the setting (e.g. community, clinic‐based, internet), to determine if any specific approach was more effective for the treatment of childhood obesity.
The results of this current review and other systematic reviews in this series provided information on which to underpin clinical guidelines and health policy on the treatment of childhood overweight or obesity.
Objectives
To assess the efficacy of diet, physical activity and behavioural interventions delivered to parents only for the treatment of overweight and obesity in children aged 5 to 11 years.
Methods
Criteria for considering studies for this review
Types of studies
We included randomised controlled trials (RCTs).
Types of participants
Study groups consisted of children with a mean study age of 5 to 11 years at the commencement of the intervention.
Diagnostic criteria
We included overweight or obese children by any classification.
Types of interventions
We planned to investigate the following comparisons of intervention versus control/comparator.
Intervention
Any form of lifestyle intervention with a primary aim to treat overweight or obesity in children (any form of dietary, physical activity, behavioural therapy, or a combination of these delivered as single or multi‐component interventions) directed at the parents as the agents of change (i.e. interventions did not include their children).
Comparator
Usual care, a parent‐child intervention, child only intervention or an alternative concomitant therapy providing it was delivered in the intervention arm.
Concomitant interventions had to be the same in the intervention and comparator groups to establish fair comparisons.
Minimum duration of intervention/follow‐up
Duration of intervention/follow‐up had to be at least six months.
Exclusion criteria
We excluded critically ill children or children with a syndromic cause for their obesity (e.g. Prader‐Willi).
Types of outcome measures
Primary outcomes
-
Changes in body mass index (BMI) and body weight.
-
Adverse events.
Secondary outcomes
-
Health‐related quality of life and self esteem.
-
All‐cause mortality.
-
Morbidity.
-
Measures of body fat distribution.
-
Behaviour change.
-
Participants' views of the intervention.
-
Parent‐child relationship or assessment of parenting.
-
Socioeconomic effects by validated measures.
Method and timing of outcome measurement
-
Changes in BMI (kg/m2) and body weight (kg) measured at baseline, and at least at 6, 12 and 24 months.
-
Adverse events: defined as an adverse outcome that occurred during or after the intervention but was not necessarily caused by it, and measured at baseline, and at least at 6, 12 and 24 months.
-
Health‐related quality of life: evaluated by a validated instruments such as the Paediatric Quality of Life Inventory and measured at baseline, and at least at 6, 12 and 24 months.
-
All‐cause mortality: defined as any death that occurred during or after the intervention and measured at baseline, and at least at 6, 12 and 24 months
-
Morbidity: defined as illness or harm associated with the intervention and measured at baseline, and at least at 6, 12 and 24 months.
-
Measures of body fat distribution: defined using validated tools such as dual‐energy X‐ray absorptiometry (DXA), waist circumference, skin‐fold thickness, waist‐to‐hip ratio or bioelectrical impedance analysis and measured at baseline, and at least at 6, 12 and 24 months.
-
Behaviour change: defined as validated measures of diet and physical activity and measured at baseline, and at least at 6, 12 and 24 months.
-
Participants' views of the intervention: defined as documents accounts from participant feedback and measured at baseline, and at least at 6, 12 and 24 months.
-
Parent‐child relationship or assessment of parenting: evaluated by a validated instrument and measured at baseline, and at least at 6, 12 and 24 months.
-
Socioeconomic effects defined as a validated measure of socioeconomic status such as parental income or educational status and measured at baseline, and at least at 6, 12 and 24 months.
Summary of findings
We present a 'Summary of findings' table to report the following outcomes, listed according to priority.
-
Changes in BMI and body weight.
-
Adverse events.
-
Health‐related quality of life
-
All‐cause mortality.
-
Mobidity.
-
Parent‐dhild relationship or assessment of parenting.
-
Socioeconomic effects.
Search methods for identification of studies
Electronic searches
We searched the following sources from inception of each database to the specified date and placed no restrictions on the language of publication.
-
Cochrane Library:
-
Cochrane Database of Systematic Reviews (CDSR) (Issue 3, 10 March 2015).
-
Cochrane Central Register of Controlled Trials (CENTRAL) (Issue 3, 10 March 2015).
-
Database of Abstracts of Reviews of Effects (DARE) (Issue 1, 10 March 2015).
-
Health Technology Assessment (HTA) (Issue 1, 10 March 2015).
-
-
MEDLINE and MEDLINE In‐Process & Other Non‐Indexed Citations, 1946 to 10 March 2015.
-
EMBASE, 1974 to 10 March 2015.
-
PsycINFO, 1806 to 10 March 2015.
-
CINAHL (10 March 2015).
-
LILACS (10 March 2015).
-
ClinicalTrials.gov (10 March 2015).
-
World Health Organization (WHO) International Clinical Trials Registry Platform (ICTRP) Search Portal (http://apps.who.int/trialsearch/), which is a meta‐register of trials with links to several trial registers, that includes
-
Australian New Zealand Clinical Trials Registry (2 March 2015).
-
Chinese Clinical Trial Registry (2 March 2015).
-
ClinicalTrials.gov (2 March 2015).
-
EU Clinical Trials Register (EU‐CTR) (2 March 2015).
-
ISRCTN (International Standard Randomised Controlled Trial Number) Register (2 March 2015).
-
The Netherlands National Trial Register (2 March 2015).
-
Brazilian Clinical Trials Registry (2 February 2015).
-
Clinical Trials Registry ‐ India (2 March 2015).
-
Clinical Research Information Service ‐ Republic of Korea (3 March 2015).
-
Cuban Public Registry of Clinical Trials (3 March 2015).
-
German Clinical Trials Register (3 March 2015).
-
Iranian Registry of Clinical Trials (3 March 2015).
-
Japan Primary Registries Network (3 March 2015).
-
Pan African Clinical Trial Registry (3 March 2015).
-
Sri Lanka Clinical Trials Registry (2 March 2015).
-
Thai Clinical Trials Register (3 March 2015).
-
We continuously applied a MEDLINE (via Ovid) email alert service established by the Cochrane Metabolic and Endocrine Disorders (CMED) Group to identify newly published trials using the same search strategy as described for MEDLINE (for details on search strategies see Appendix 1). Should we have identified new trials for inclusion, we would have evaluated these, incorporated findings in our review and re‐submitted another review draft (Beller 2013).
Searching other resources
We tried to identify other potentially eligible trials or ancillary publications by searching the reference lists of retrieved included trials, (systematic) reviews, meta‐analyses and HTA reports.
Data collection and analysis
Selection of studies
Two review authors (two of RJ, LA, KR, EL, JC, WR, EM) independently scanned the abstract, title, or both, of every record retrieved, to determine which trials should be assessed further. We investigated all potentially relevant articles as full text. We resolved any discrepancies through consensus or recourse to a third review author (KR, EL, LA). Where resolution of a disagreement was not possible, we added the article to those 'awaiting assessment' and contacted study authors for clarification. We presented an adapted PRISMA (Preferred Reporting Items for Systematic Reviews and Meta‐Analyses) flow diagram showing the process of study selection (Liberati 2009).
Data extraction and management
For trials that fulfilled inclusion criteria, two review authors (two of RJ, LA, EL, JC, WR) independently abstracted key participant and intervention characteristics and reported data on efficacy outcomes and adverse events using standard data extraction templates as supplied by the CMED group, with any disagreements resolved by discussion, or, if required, by consultation with a third review author (KR) (for details see Table 1; Appendix 2; Appendix 3; Appendix 4; Appendix 5; Appendix 6; Appendix 7; Appendix 8; Appendix 9).
| Intervention(s) and comparator(s) | Sample sizea | Screened/eligible | Randomised | ITT | Analysed | Finishing trial | Randomised finishing trial | Follow‐up | |
| (20) Resnicow 2015 | I1: parent‐only PCP motivational interviewing | The study was powered to detect a 3‐point difference in BMI percentile between any pair of study groups at 2‐year follow‐up, with an assumed SD for BMI percentile between 4 and 6: power of 0.80 and 2‐tailed a of 0.05. Sample size was inflated to account for practice‐level clustering, assuming an intraclass correlation between 0.01 and 0.05. On this basis and a projected 25‐30% attrition at 2‐year follow‐up, 10‐12 practices per arm (30‐36 total) and a mean of 15‐20 children per practice at baseline were required | ‐ | 16 practices 212 participants | 145 | 145 | 145 | 68 | 2 years (2 years) |
| I2: parent‐only PCP + dietician motivational interviewing | 15 practices 235 participants | 154 | 154 | 154 | 66 | ||||
| C: usual care | 11 practices 198 participants | 158 | 158 | 158 | 80 | ||||
| total: | 645 | 457 | 457 | 457 | 71 | ||||
| (19) Mazzeo 2014 | I: parent NOURISH | ‐ | 235 | 48 | ‐ | 46 | 10 | 21 | 12 weeks post 12‐week intervention (24 weeks) |
| C: parent control | 45 | ‐ | 45 | 16 | 36 | ||||
| total: | 93 | 91 | 26 | 28 | |||||
| (18) Van Grieken 2013 | I: parent‐only | Sample size was calculated taking into account the intracluster correlation coefficient (ρ = 0.1), the number of clusters (44), the expected prevalence of overweight children in the study population, the SD, expected effect (a difference in mean), and the power of the study (80%). With a participation of 50%, an expected prevalence of overweight children of 9% and a loss‐to‐follow‐up of 30%, at least 11,301 children (and their parents) should be invited by the YHC teams to participate in the study to have a final sample of about 356 overweight children (178 in both the intervention and control group). Assuming a SD of BMI to be 1.0 kg/m2, a difference in mean BMI of 0.35 kg/m2 between the children in the intervention group and the children in the control group can be established under the assumptions mentioned above | 22 clusters 7004 participants | 349 | ‐ | 21 clusters 277 participants | 277 | 79 | 2 years post up to 12‐month intervention |
| C: usual care | 22 clusters 7004 participants | 288 | ‐ | 21 clusters 230 participants | 230 | 80 | |||
| total | 637 | ‐ | 42 (507) | 507 | 80 | ||||
| (17) Small 2013 | I: parent‐only | ‐ | ‐ | 34 | 33 | 33 | 33 | 97 | 24 weeks post 16‐week intervention (41 weeks) |
| C: parent control | 33 | 27 | 27 | 27 | 82 | ||||
| total: | 67 | 60 | 60 | 60 | 90 | ||||
| (16) Esfarjani 2013 | I: parent‐only | ‐ | 550/156 | 70 | ‐ | 55 | 58 | 83 | Intervention 6 months (not reported) |
| C: parent control | 86 | ‐ | 52 | 59 | 69 | ||||
| total: | 156 | ‐ | 107 | 117 | 75 | ||||
| (15) Moens 2012 | I: parent‐only | ‐ | 80/75 | 31 | ‐ | ‐ | 31 | 100 | Immediately following 6‐month intervention |
| C: waiting list control | 19 | ‐ | ‐ | 15 | 79 | ||||
| total: | 50 | ‐ | ‐ | 46 | 92 | ||||
| (14) Raynor 2012a | I1: parent‐only | Sample size calculations presumed 2‐sided hypothesis testing at 6‐month assessment, with type 1 error rate = 0.05. To reject with 80% power the null hypothesis of no pre‐ to post‐treatment difference between intervention conditions vs. the alternative that the pre‐ to post‐treatment difference was 0.6 or greater (effect size), 24 participants per group were needed | 549 | 33 | 33 | 33 | 29 | 88 | 24 weeks post 24‐week intervention (reported as '12 months') |
| I2: parent ‐ diet decrease | 33 | 33 | 33 | 29 | 88 | ||||
| I3: parent ‐ diet increase | 35 | 35 | 35 | 32 | 91 | ||||
| total: | 101 | 101 | 101 | 90 | 89 | ||||
| (13) Raynor 2012b | I1: parent‐only | Sample size calculations presumed 2‐sided hypothesis testing at 6‐month assessment, with type 1 error rate = 0.05. To reject with 80% power the null hypothesis of no pre‐ to post‐treatment difference between intervention conditions vs. the alternative that the pre‐ to post‐treatment difference is 0.6 or greater (effect size), 24 participants per group were needed | 549 | 29 | 29 | 29 | 26 | 90 | 24 weeks post 24‐week intervention (reported as '12 months') |
| I2: parent ‐ diet and activity traditional | 26 | 26 | 26 | 24 | 92 | ||||
| I3: parent ‐ diet and activity substitute | 26 | 26 | 26 | 24 | 92 | ||||
| total: | 81 | 81 | 81 | 74 | 91 | ||||
| (12) Margarey 2011 | I: parent healthy lifestyle | Sample size calculation was based on a reduction in BMI z score of 0.26 (SD 0.49) over 12 months (power 80%, alpha = 0.05, and drop‐out rate of 30%). This represents a 50% reduction in weight velocity over 12 months and no change in height velocity. We sought 42 children per group per site (168 children) | 398 | 85 | 85 | 85 | 52 | 61 | 80 weeks post 24‐week intervention (104 weeks) |
| C: healthy lifestyle | 84 | 84 | 84 | 54 | 64 | ||||
| total: | 169 | 169 | 169 | 106 | 63 | ||||
| (11) Jansen 2011 | I: parent CBT | ‐ | 161 | 59 | ‐ | 54 | 54 | 92 | 12 weeks post 12‐week intervention (24 weeks) |
| C: waiting list control | 39 | ‐ | 34 | 34 | 87 | ||||
| total: | 98 | 88 | 88 | 90 | |||||
| (10) Collins 2011 | I: parent‐only ‐ diet | Power: 80% chance of detecting significance (2‐sided 5% level), with a 0.26 BMI z score difference from baseline to 12 months as the initial end point, with an anticipated loss to follow‐up of 20% | 505/319 | 63 | ‐ | 42 | 22 | 35 | 80 weeks post 24‐week intervention (104 weeks) |
| C1: parent‐child (physical activity) | 73 | ‐ | 63 | 35 | 48 | ||||
| C2: parent‐child (physical activity + diet) | 70 | ‐ | 60 | 36 | 51 | ||||
| total: | 206 | ‐ | 165 | 93 | 45 | ||||
| (9) Boutelle 2011 | I: parent‐only | Sample size was determined by pragmatic factors, including budget and investigator time commitments. No interim analyses were done. The hypotheses tested related to non‐inferiority of the parent treatment to the parent‐child treatment on child and parent weight loss and child daily caloric intake and physical activity. The bound for non‐inferiority hypotheses related to BMI percentile was set to 1. This is the maximum value the parent‐child group could do better than parent‐only, below which non‐inferiority would be concluded. This bound could correspond to an mean‐aged child in this sample having a BMI of 26 in the parent‐child group and 28.5 in the parent‐only group at post‐treatment/follow‐up, assuming equivalence at baseline. For a non‐inferiority bound for child BMI, which was selected post hoc, we considered choosing a BMI that would correspond to the BMI percentile non‐inferiority bound (BMI = 2.5), but instead chose a more rigorous value of BMI = 1 | 157 | 40 | ‐ | 24 | 24 | 60 | 24 weeks post 20‐week intervention (week 44) |
| C: parent‐child | 40 | ‐ | 28 | 28 | 70 | ||||
| total: | 80 | 52 | 52 | 65 | |||||
| (8) West 2010 | I: parent‐only | ‐ | 205 | 52 | 52 | 52 | 34 | 65 | 40 weeks post 12‐week intervention (52 weeks) |
| C: waiting list control | 49 | 49 | 49 | 46 | 94 | ||||
| total: | 101 | 101 | 101 | 80 | 79 | ||||
| (7) Resnick 2009 | I: educational material + personal encounters | ‐ | 84/46 | 22 | ‐ | 18 | 18 | 82 | Unclear (41 weeks between start and last mail out) |
| C: educational material | 24 | ‐ | 24 | 24 | 100 | ||||
| total: | 46 | 42 | 42 | 91 | |||||
| (6) Estabrooks 2009 | I1: parent group + IVR | Sample size calculations were completed, varying the detectable effect sizes from small to medium with a power of 0.8. The result was a need for 42 participants per intervention to detect a medium effect and 64 participants to detect a small effect | 1487/656 | 85 | ‐ | 63 | 63 | 74 | 28‐40 weeks post 12‐ to 24‐week intervention (52 weeks) |
| I2: parent group | 85 | ‐ | 56 | 56 | 66 | ||||
| C: parent workbook | 50 | ‐ | 36 | 36 | 72 | ||||
| total: | 220 | 155 | 155 | 70 | |||||
| (5) Munsch 2008 | I: mother‐only CBT | Trial authors did not reach the necessary sample size of 68 families with obese children within the given time span (the target sample size of 68 was based on a repeated‐measures analysis with alpha = 0.05, 1 ‐ beta = 0.8, and a medium effect size for the linear term of the interaction between treatment and time, assuming a drop‐out rate of 20% | 181/60 | 25 | ‐ | 7 | 7 | 28 | 24 weeks post 10‐week intervention (34 weeks) |
| C: mother‐child CBT | 31 | ‐ | 20 | 20 | 65 | ||||
| total: | 56 | 27 | 27 | 48 | |||||
| (4) Janicke 2008 | I: parent‐only | Post hoc power analyses were used to determine the detectable change in BMI z score from 0 to 10 months for the family based and parent‐only interventions relative to the waiting list control condition. Effect sizes (standardised BMI index) detectable with 80% power and 2‐sided level 0.05 tests were used. Standard deviations and sample sizes were set equal to their observed values. For comparing the family‐based and waiting list control conditions, trial authors reported 80% power to detect a shift from 0.022 to ‐0.145. For comparing the parent‐only and waiting list control conditions, trial authors reported 80% power to detect a shift from 0.022 to ‐0.135 | 111 | 34 | ‐ | 26 | 26 | 76 | 14 weeks post 16‐week intervention (40 weeks) |
| C1: parent‐child | 33 | ‐ | 24 | 24 | 73 | ||||
| C2: waiting list control | 26 | ‐ | 21 | 21 | 81 | ||||
| total: | 93 | 71 | 71 | 76 | |||||
| (3) Golley 2007 | I: parent intervention + lifestyle education | Sample size calculation was based on a fall in BMI z score reflecting a weight gain of only 50% of that expected over 12 months with normal growth. A sample size of 28 per group was estimated to have 80% power to detect a 12‐month fall in mean BMI z score from a baseline of 0.26 (SD 0.49), assuming no change in the control group, at a 2‐sided significance level of 0.05. To account for a drop‐out rate of up to one‐third (commonly 20‐50% in child weight‐management studies), 42 children per study group were sought (126 children) | 262/115 | 38 | ‐ | 31 | 31 | 82 | 24 weeks post 24‐week intervention (48 weeks) |
| C1: parent intervention | 37 | ‐ | 29 | 29 | 78 | ||||
| C2: waiting list control | 36 | ‐ | 31 | 31 | 86 | ||||
| total: | 111 | 101 | 101 | ‐ | |||||
| (2) Golan 2006 | I: parent‐only | The study was designed to detect differences of 10% weight loss with a power of 90% and a significance level of 0.05, given a drop‐out rate of 10% with a sample of 12 in each group | 102 | 14 | ‐ | 10 | 10 | 71 | 1 year post 26‐week intervention (18 months) |
| C: parent‐child | 18 | ‐ | 17 | 17 | 94 | ||||
| total: | 32 | 27 | 27 | 84 | |||||
| (1) Aragona 1975 | I1: parent‐only with reinforcement | ‐ | ‐ | 5 | ‐ | 4 | 4 | 80 | 12 weeks (51 weeks' follow‐up) |
| I2: parent‐only | 5 | ‐ | 3 | 3 | 60 | ||||
| C: waiting list control | 5 | ‐ | 5 | 2 | 40 | ||||
| total: | 15 | 12 | 9 | 60 | |||||
| Grand total | All interventions | ‐ | 1773c | 1276 | |||||
| All comparators | 1284c | 942 | |||||||
| All interventions and comparators | 3057c | 2218 | |||||||
aAccording to power calculation in trial publication or report
bDuration of intervention or follow‐up (or both) under randomised conditions until end of trial
cSome trials had more than one intervention/comparator group
"‐" denotes not reported
BMI: body mass index; C: comparator; CBT: cognitive behavioural therapy; I: intervention; ITT: intention‐to‐treat; IVR: interactive voice response; n: number of participants; NOURISH: nourishing our understanding of role modelling to improve support and health; PCP: primary care providers; SD: standard deviation; YHC: Youth Health Care
We provided information including trial identifier about potentially relevant ongoing trials in the Characteristics of ongoing studies table and in the 'Matrix of study endpoints (publications and trial documents)' where available. We tried to find the protocol of each included study in trial registers or publications of study designs, or both, and reported primary, secondary and other outcomes in comparison with data in publications in Appendix 5.
We emailed all authors of included trials to enquire whether they were willing to answer questions regarding their trials. Appendix 10 shows the results of this survey. Thereafter, we sought relevant missing information on the trial from the primary author(s) of the article, if required.
Dealing with duplicate and companion publications
In the event of duplicate publications, companion documents or multiple reports of a primary study, we tried to maximise yield of information by collating all available data and use the most complete data set aggregated across all known publications. In case of doubt, we gave priority to the publication reporting the longest follow‐up associated with our primary or secondary outcomes.
Assessment of risk of bias in included studies
Two review authors (two of RJ, LA, EL, JC) assessed the risk of bias of each included study independently. We resolved possible disagreements by consensus, or with consultation with a third review author (KR).
We used Cochrane's tool for assessing risk of bias (Higgins 2011a; Higgins 2011b), and evaluated the following criteria.
-
Random sequence generation (selection bias).
-
Allocation concealment (selection bias).
-
Blinding of participants and personnel (performance bias).
-
Blinding of outcome assessment (detection bias).
-
Incomplete outcome data (attrition bias).
-
Selective reporting (reporting bias).
-
Other potential sources of bias.
We judged the above risk of bias criteria as 'low risk', 'high risk' or 'unclear risk' and evaluated individual bias items as described in the Cochrane Handbook for Systematic Reviews of Interventions (Higgins 2011a). We presented a 'Risk of bias' graph and a 'Risk of bias' summary. We assessed the impact of individual bias domains on study results at endpoint and study levels. In case of high risk of selection bias, we marked all endpoints investigated in the associated study as high risk.
We evaluated whether imbalances in baseline characteristics existed and how these were addressed (Egbewale 2014).
For performance bias (blinding of participants and personnel) and detection bias (blinding of outcome assessors), we evaluated the risk of bias separately for each outcome type (objective and subjective) (Hróbjartsson 2013).
We considered the implications of missing outcome data from individual participants per outcome such as high drop‐out rates (e.g. above 15%) or disparate attrition rates (e.g. difference of 10% or more between study arms).
We assessed outcome reporting bias by integrating the results of 'Examination of outcome reporting bias' (Appendix 6) and the 'Matrix of study endpoints (publications and trial documents)' (Appendix 5) (Kirkham 2010). This analysis formed the basis for the judgement of selective reporting (reporting bias).
We defined the following as self reported outcomes ('subjective outcomes').
-
Adverse events.
-
Health‐related quality of life and self esteem.
-
Parent‐child relationship or assessment of parenting.
-
Participants' views of the intervention.
We defined the following as investigator‐assessed outcomes ('objective outcomes').
-
Changes in BMI measures and body weight.
-
Measures of body fat distribution.
-
Adverse events.
-
All‐cause mortality.
-
Morbidity.
-
Behaviour change.
-
Socioeconomic effects.
Measures of treatment effect
We expressed dichotomous data as odds ratios (ORs) or risk ratios (RRs) with 95% confidence intervals (CIs). We expressed continuous data as mean differences (MD) with 95% CI. We planned to express time‐to‐event data as hazard ratios (HRs) with 95% CIs.
Unit of analysis issues
We took into account the level at which randomisation occurred, such as cross‐over trials, cluster‐randomised trials and multiple observations for the same outcome. For cluster‐randomised trials, we used the adjusted data reported in the original studies. Where studies had multiple control groups, we used data from the control group for each comparison by reducing the weight assigned to the control group by dividing the number of participants in the control group by the number of intervention groups.
Dealing with missing data
We obtained relevant missing data from authors, if possible, and evaluated important numerical data such as screened, eligible, randomised participants as well as intention‐to‐treat (ITT), as‐treated and per‐protocol (PP) populations where possible. We investigated attrition rates, for example drop‐outs, losses to follow‐up and withdrawals, and critically appraise issues of missing data and imputation methods (e.g. last‐observation‐carried‐forward (LOCF)).
Where standard deviations (SD) for outcomes were not reported, and we did not receive information from study authors, we calculated these following the methods presented in the Cochrane Handbook for Systematic Reviews of Interventions (Higgins 2011a). Where papers did not report results as change from baseline, we calculated this and for the SD differences followed the methods presented in the Cochrane Handbook for Systematic Reviews of Interventions for imputing these (Section 16.1.3.2 Imputing standard deviations for changes from baseline; Higgins 2011a), and assumed a correlation of 0.5 between baseline and follow‐up measures as suggested by Follman 1992.
Assessment of heterogeneity
In the event of substantial clinical or methodological heterogeneity, we did not report study results as meta‐analytically pooled effect estimates. We identified heterogeneity by visual inspection of the forest plots and by using a standard Chi2 test with a significance level of α = 0.1, in view of the low power of this test. We examined heterogeneity using the I2 statistic, which quantifies inconsistency across trials to assess the impact of heterogeneity on the meta‐analysis (Higgins 2002; Higgins 2003), where an I2 statistic of 75% or more indicates a considerable level of inconsistency (Higgins 2011a).
When we found heterogeneity, we attempted to determine potential reasons for it by examining individual study and subgroup characteristics.
Assessment of reporting biases
If we had included 10 trials or more for a given outcome, we would have used funnel plots to assess small‐study effects. Due to several explanations for funnel plot asymmetry, we would have interpreted results carefully (Sterne 2011).
Data synthesis
Unless there was good evidence for homogeneous effects across trials, we primarily summarised data by means of a random‐effects model (Wood 2008). We had planned to interpret random‐effects meta‐analyses with due consideration of the whole distribution of effects, ideally by presenting a prediction interval; however, there were relatively few trials included in each category, of low methodological quality and so theses analyses were not conducted (Higgins 2009). A prediction interval specifies a predicted range for the true treatment effect in an individual study (Riley 2011). We performed statistical analyses according to the statistical guidelines referenced in the latest version of the Cochrane Handbook for Systematic Reviews of Interventions (Higgins 2011a).
Quality of evidence
We present the overall quality of the evidence for each outcome according to the Grading of Recommendations Assessment, Development and Evaluation (GRADE) approach, which takes into account issues not only related to internal validity (risk of bias, inconsistency, imprecision, publication bias) but also to external validity such as directness of results. Two review authors (EL, KR) rated the quality for each outcome. We presented a summaries of the evidence in a 'Summary of findings' tables, which provide key information about the best estimate of the magnitude of the effect, in relative terms and absolute differences for each relevant comparison of alternative management strategies, numbers of participants and trials addressing each important outcome, and the rating of the overall confidence in effect estimates for each outcome. We created the 'Summary of findings' tables based on the methods described in the Cochrane Handbook for Systematic Reviews of Interventions (Higgins 2011a). We presented results on the outcomes as described in Types of outcome measures.
In addition, we established an appendix 'Checklist to aid consistency and reproducibility of GRADE assessments' (Meader 2014) to help with standardisation of 'Summary of findings' tables (Appendix 9).
Subgroup analysis and investigation of heterogeneity
We expected the following characteristics to introduce clinical heterogeneity, and aimed to carry out subgroup analyses with investigation of interactions where data permitted.
-
Differences in BMI at baseline.
-
Length of follow‐up.
-
The impact of comparator/control: whether concomitant therapy or no treatment (true control).
-
The setting in which the intervention was conducted.
Sensitivity analysis
We planned to perform sensitivity analyses to explore the influence of the following factors on effect size.
-
Restricting the analysis to published trials.
-
Restricting the analysis taking into account risk of bias, as specified in the 'Assessment of risk of bias in included studies' section.
-
Restricting the analysis to very long or large trials to establish how much they dominated the results.
-
Restricting the analysis to trials using the following filters: diagnostic criteria, language of publication, source of funding (industry versus other), country.
We tested the robustness of the results by repeating the analysis using different statistical models (fixed‐effect and random‐effects models).
Results
Description of studies
For a detailed description of trials, see the Characteristics of included studies, Characteristics of excluded studies and Characteristics of ongoing studies tables.
Results of the search
The searches generated 13,759 hits after duplicates were removed. Screening of titles and abstracts identified 137 papers to go forward for formal inclusion and exclusion. Twenty completed RCTs fulfilled the inclusion criteria and were included in the review. For a detailed description of the included trials, see the Characteristics of included studies table. The search identified 10 ongoing trials, which are reported in the Characteristics of ongoing studies table. The flow of trials through the review is presented in Figure 1.

Study flow diagram.
Included studies
A detailed description of the characteristics of included trials is presented elsewhere (see Characteristics of included studies table and Appendix 2; Appendix 3; Appendix 4; Appendix 5; Appendix 6; Appendix 7; Appendix 8; Appendix 9). The following is a succinct overview.
Source of data
The majority of data presented in the review was obtained from published literature, including supplementary published data where available. For five trials, trial authors provided data (Appendix 10).
Study details
We included 20 RCTs in 19 main publications (Aragona 1975; Boutelle 2011; Collins 2011; Esfarjani 2013; Estabrooks 2009; Golan 2006; Golley 2007; Janicke 2008; Jansen 2011; Magarey 2011; Mazzeo 2014; Munsch 2008; Raynor 2012a; Raynor 2012b; Resnick 2009; Resnicow 2015; Small 2013; van Grieken 2013; West 2010). Eighteen RCTs were parallel comparisons with individual randomisation. In most trials, the unit of randomisation was the family (parent and child); however, study authors analysed the children and parents for respective outcomes separately. Two RCTs were cluster RCTs, where the Primary Care Provider (PCP) (Resnicow 2015) or Youth Health Care (YHC) (van Grieken 2013) team were the unit of randomisation. Eighteen RCTs were superiority trials, one had a non‐inferiority study design (Boutelle 2011), and one an equivalence study design (Munsch 2008). Eight RCTs had three comparisons (Aragona 1975; Collins 2011; Estabrooks 2009; Golley 2007; Janicke 2008; Raynor 2012a; Raynor 2012b; Resnicow 2015); the remaining trials had two comparison groups.
Ten trials were undertaken in the USA (Aragona 1975; Boutelle 2011; Estabrooks 2009; Janicke 2008; Mazzeo 2014; Raynor 2012a; Raynor 2012b; Resnick 2009; Resnicow 2015; Small 2013); four in Australia (Collins 2011; Golley 2007; Magarey 2011; West 2010), and two in the Netherlands (Jansen 2011; van Grieken 2013). There was one trial each from Israel (Golan 2006), Switzerland (Munsch 2008), Iran (Esfarjani 2013), and Belgium (Moens 2012). Five trials were single‐centre trials (Aragona 1975; Boutelle 2011; Esfarjani 2013; Golan 2006; Moens 2012); the remaining trials were either multi‐centre trials (with two centres: Golley 2007; Munsch 2008; Resnick 2009; three centres: Jansen 2011; Magarey 2011; and six centres: West 2010), or the numbers of centres were not reported (Collins 2011; Estabrooks 2009; Janicke 2008; Mazzeo 2014; Raynor 2012a; Raynor 2012b; Small 2013). The cluster RCT by van Grieken 2013 was undertaken in nine study centres, across 44 healthcare teams. The cluster RCT by Resnicow 2015 was undertaken in 42 primary care practices.
Overview of study populations
All trials included parents of overweight or obese children. The diagnostic criteria differed between trials, in 10 trials this was based on the BMI 85th percentile (Boutelle 2011; Estabrooks 2009; Golan 2006; Janicke 2008; Mazzeo 2014; Munsch 2008; Raynor 2012a; Raynor 2012b; Resnick 2009; Resnicow 2015), and in one trial the BMI 95th percentile (Esfarjani 2013). In other trials, this was based on the parent or physician describing their child as overweight (Aragona 1975; Moens 2012; Small 2013; West 2010); the IOTF definition (Golley 2007; Magarey 2011), or stated as international cut‐off points that were not specified (van Grieken 2013); a specified BMI cut‐off (Collins 2011); or the proportion of BMI above expected BMI (at least 30% greater in Jansen 2011).
All trials included parents of children aged between 4 and 13 years, the majority of which did not include children above 11 years of age. The mean ages of participants were reported in 16 trials. In six trials, the mean ages were between 5 and 7 years (Esfarjani 2013; Raynor 2012a; Raynor 2012b; Resnicow 2015; Small 2013; van Grieken 2013); in seven trials, the mean ages were between 8 and 9 years (Aragona 1975; Collins 2011; Golan 2006; Magarey 2011; Moens 2012; West 2010); and in four trials, the mean ages of the children was between 10 and 11 years (Boutelle 2011; Estabrooks 2009; Janicke 2008; Munsch 2008). The proportion of girls in the trials typically ranged from 40% to 70% where reported (four trials did not report this: Esfarjani 2013; Janicke 2008; Mazzeo 2014; Resnick 2009), although was 100% in one study (Aragona 1975). Only eight trials reported ethnicity of the children and in all trials there was a high proportion of children categorised as white (between 60% and 100% across all trials: Estabrooks 2009; Janicke 2008; Moens 2012; Raynor 2012a; Raynor 2012b; Resnicow 2015; Small 2013; West 2010). Only eight trials reported socioeconomic indices of the parents (Boutelle 2011; Esfarjani 2013; Janicke 2008; Moens 2012; Resnicow 2015; Small 2013; van Grieken 2013; West 2010). Each used a different indicator of socioeconomic status (see Appendix 4).
The number of participants included in the 19 trials ranged between 15 and 645. Five trials had fewer than 30 participants per study arm (Aragona 1975; Moens 2012; Munsch 2008; Raynor 2012b; Resnick 2009), whereas four trials had greater than 60 participants per study arm (Collins 2011; Esfarjani 2013; Estabrooks 2009; Magarey 2011). In the cluster RCT by van Grieken 2013, there were 22 clusters in each arm (total 637 participants), in the Resnicow 2015 cluster RCT, there were 42 clusters (total 645 participants).
Seven trials reported the BMI z score, which ranged from 2.0 to 2.8 at baseline (Boutelle 2011; Collins 2011; Estabrooks 2009; Golley 2007; Janicke 2008; Magarey 2011; West 2010). Five trials reported the BMI percentile, which ranged from 92% to 98.5% at baseline (Jansen 2011; Mazzeo 2014; Resnick 2009; Resnicow 2015; Small 2013). Five trials reported BMI (Esfarjani 2013; Mazzeo 2014; Munsch 2008; Raynor 2012a; Raynor 2012b), and could be calculated from individual participant data in one other study (Aragona 1975). The BMI in these trials ranged from 22 to 33.6 at baseline. Eleven trials reported parental BMI. In eight trials, the mean parental BMI ranged between 26 and 36; with four trials including parents with BMIs between 26 and 30 (Jansen 2011; Munsch 2008; Resnick 2009; Resnicow 2015), and four trials including parents with BMIs above 30 (Boutelle 2011; Janicke 2008; Mazzeo 2014; Small 2013). One study reported the proportions of parents in three categories (healthy, overweight, obese); these were approximately 37% (healthy), 23% (overweight) and 40% (obese) (West 2010). Another study reported the proportions of 'normal' (about 56%) and 'overweight' (about 44%) (van Grieken 2013). One study reported the weight of the parents (for mothers and fathers for each group respectively) (Golan 2006).
For details of baseline characteristics of participants in the included trials, see Appendix 4 and Appendix 5. There were no substantial differences in baseline characteristics between the intervention and comparator groups in the included trials.
Interventions
Seventeen trials reported the settings for the interventions. In four trials, the intervention was in an outpatient setting (Collins 2011; Estabrooks 2009; Golley 2007; Magarey 2011), and in four trials it was a community setting (Janicke 2008; Mazzeo 2014; Resnick 2009; van Grieken 2013). Two trials were undertaken in a university setting (Boutelle 2011; Moens 2012); two in a primary care setting (Resnicow 2015; Small 2013), and five trials win a mixture of settings including outpatient, university, primary care or a combination of these settings (Jansen 2011; Munsch 2008; Raynor 2012a; Raynor 2012b; West 2010).
The interventions in the included trials predominantly focused on nutritional, physical activity and behavioural components; see Characteristics of included studies table and Appendix 2 for specific details for each included study.
Five trials compared a parent‐only intervention to a parent‐child intervention (two also had a third comparison of a waiting list control, Janicke 2008 or a second parent‐child intervention, Collins 2011) (Boutelle 2011; Collins 2011; Golan 2006; Janicke 2008; Munsch 2008). In one study, the duration of the intervention was 10 weeks (Munsch 2008); and four trials had interventions of 16 to 24 weeks' duration (Boutelle 2011; Collins 2011; Golan 2006; Janicke 2008). Session lengths ranged from one to two hours in all five trials. All trials followed participants beyond the timing of the end of the intervention. This was 14 weeks' post intervention in one study (Janicke 2008), 24 to 26 weeks' post intervention in two trials (Boutelle 2011; Munsch 2008), one year post intervention in one trial (Golan 2006), and 80 weeks' post intervention in one study (Collins 2011).
Six trials compared a parent‐only intervention to a waiting list control (Aragona 1975; Golley 2007; Janicke 2008; Jansen 2011; Moens 2012; West 2010) and two of these trials had two different parent‐only interventions (Aragona 1975; Golley 2007). The duration of the intervention ranged from 12 to 24 weeks in these trials and sessions ranged between 90 minutes and two hours (one study did not provide details, Aragona 1975). In two trials, there were additional sessions via telephone contact between interventionists and the parents, which were approximately 20 minutes long (Golley 2007; West 2010). All but one study followed participants up beyond the timing of the end of the intervention (Moens 2012). This was 12 to 14 weeks post intervention in one trial (Jansen 2011), 24 weeks post intervention in two trials (Golley 2007; Janicke 2008), 39 weeks post intervention in one trial (Aragona 1975) and 40 weeks post intervention in one trial West 2010).
Seven trials compared a parent‐only intervention with a minimal contact parenting advice control (mailed information or a workbook or minimal sessions) (Esfarjani 2013; Estabrooks 2009; Mazzeo 2014; Resnick 2009; Resnicow 2015; Small 2013; van Grieken 2013); two trials had two different parent‐only interventions (Estabrooks 2009; Resnicow 2015). The duration of the interventions ranged from 12 to 26 weeks in five trials (in the Resnick 2009 study the interventions ranged from 30 to 41 weeks but the study reports a mean of 18 weeks). In one study, the duration of the intervention differed for each participants, but was up to 12 months (van Grieken 2013). In one trial, the intervention continued to 24 months (Resnicow 2015). In three trials, the number of sessions provided to parents was lower than reported in the other parent‐only interventions, being three or four sessions (Resnick 2009; Small 2013; van Grieken 2013). In two trials, the intervention was delivered across 12 sessions (Esfarjani 2013; Mazzeo 2014); in the study by Estabrooks 2009, there were two parent‐only treatment arms, which were either 12 or 24 weeks in duration and in the study by Resnicow 2015, there were also two parent‐only treatment arms, which were either four or 10 sessions. Six trials reported the duration of follow‐up in relation to the completion of the intervention. In the study by Mazzeo 2014, this was 12 weeks post intervention completion, in Small 2013, this was 24 weeks post completion of the intervention, in Estabrooks 2009, this was between 28 and 40 weeks post completion of the intervention and in Aragona 1975, this was 39 weeks post completion of the intervention. In the van Grieken 2013 RCT, follow‐up was 24 months after baseline (the duration of the intervention was "up to 12 months") and in the Resnicow 2015 trial, follow‐up was at completion of the intervention at 24 months.
Seven trials compared different types of parent‐only interventions (Aragona 1975; Estabrooks 2009; Golley 2007; Magarey 2011; Raynor 2012a; Raynor 2012b; Resnicow 2015), two also had a parent‐only versus waiting list control comparison (Aragona 1975; Golley 2007), and two trials also had a parent‐only versus minimal contact intervention (Estabrooks 2009; Resnicow 2015). In the first, by Estabrooks 2009, there were three treatment arms. In one treatment group, the parents received a self help workbook, attended two group sessions and these were followed up with 10 interactive voice response (IVR) counselling sessions over a 10‐week period. In the second arm, the parents received the work book and attended the same two group sessions but did not have the IVR follow‐up sessions. In the third group, parents received the workbook only. In the study by Resnicow 2015, participants either received motivational interviewing over four sessions in the primary care practice, or received the four motivational interviewing sessions and six sessions with a dietician (the third arm received usual care information). In the study by Magarey 2011, parents were randomised into two arms, one received a four‐session parenting programme that was followed by eight group sessions about healthy lifestyles. The second group received the eight sessions about healthy lifestyles only. Both the trials by Estabrooks 2009 and Magarey 2011 followed participants up beyond the timing of the end of the intervention. In the study by Estabrooks 2009, this was between 28 and 40 weeks post completion of the intervention and in the study by Magarey 2011, this was 80 weeks post completion of the intervention. In the study by Resnicow 2015, follow‐up was at the point of completing the intervention (24 weeks) although in the second 12‐month period of the intervention there were fewer sessions held.
Two trials in one publication also compared different parent‐only interventions (Raynor 2012a; Raynor 2012b). There were many shared attributes of the two trials. The first trial compared a parent‐only intervention that focused on growth monitoring to a parent intervention that focused on decreasing sugary foods in the diet and a parent intervention that focused on increasing healthy food consumption (Raynor 2012a). Parents randomised to the two comparison groups also received the parent‐only intervention (growth monitoring). The second study compared the parent‐only intervention to a parent intervention that focused on decreasing sugary foods and increasing physical activity, and to a parent intervention that focused on increasing low‐fat milk intake and decreasing television watching (Raynor 2012b). Parents randomised to the two comparison groups also received the parent‐only 'growth monitoring' intervention. The duration of the interventions in these two trials was six months, and there were eight sessions of 45 minutes' duration. These trials followed participants up 24 weeks after the timing of the end of the intervention. Golley 2007 compared parenting skills training with the addition of intensive lifestyle education with the parenting skills training without the additional intensive lifestyle education. The duration of the interventions are as described above. Aragona 1975 compared a parenting response‐cost and training in reinforcement skills with the response‐cost training only. Parents were required to enter a contract with the interventionists and pay a deposit relating to a goal of weight loss in their child, which could be returned for attendance at the sessions and when the goal was achieved. The duration of the interventions is as described above.
Six trials reported compliance rates with the interventions (Estabrooks 2009; Golan 2006; Golley 2007; Mazzeo 2014; Raynor 2012a; Raynor 2012b). One study reported that attendance in both arms of their trial was above 80% (Golan 2006). In two trials, the trial authors reported that attendance at growth monitoring appointments did not differ among the groups (Raynor 2012a; Raynor 2012b). In Raynor 2012a, compliance with attendance and turning in monitoring dairies was 73%, in Raynor 2012b this was 64%. In the study by Mazzeo 2014, the numbers attending 50% or more of sessions were reported for the parent‐only intervention (22/43). Mean session attendance across groups was 53%. In the control group, 35/41 parents attended the single session. Golley 2007 reported the number of participants attending sessions in the two intervention arms. There were 11 sessions in the parenting‐skill training arm and 19 parents attended at least eight sessions; 13 attended 2 to 7 sessions and 5 attended 1 or 0 sessions. In the parenting‐skills training with intensive lifestyle education arm, there were 18 sessions and the study reported that 18 parents attended at least 13 sessions; 18 attended 2 to 12 sessions; and 2 attended 1 or sessions. Estabrooks 2009 reported the number of participants taking part in the IVR intervention where 20 participants took part in 0 to 5 calls while 38 took part in 6 to 10 calls.
Outcomes
All trials reported weight, BMI, or both, as an outcome measure. Other outcomes reported in the trials differed with few similarities across the included trials in the choice of outcomes reported (see Appendix 5). Where reported, measures of BMI were reported differently across the trials. Where a study reported more than one measure of BMI, we took the BMI z score as the preferred measure in the data synthesis.
Excluded studies
We excluded 83 of 137 full‐text articles after evaluation of the full publication.
The main reasons for exclusion were the interventions also included the children (not parent‐only) and the duration of the study was less than six months. Many trials had multiple reasons for exclusion (for further details see Characteristics of excluded studies table, which lists the 16 trials that most closely missed the inclusion criteria).
Risk of bias in included studies
For details on risk of bias of included trials, see Characteristics of included studies table. For an overview of review authors' judgements about each risk of bias item for individual trials and across all trials, see Figure 2 and Figure 3.

Risk of bias graph: review authors' judgements about each risk of bias item presented as percentages across all included studies (blank cells indicate that the particular outcome was not investigated in some studies).

Risk of bias summary: review authors' judgements about each risk of bias item for each included study (blank cells indicate that the study did not report that particular outcome).
Trial quality was generally low. Many trials did not report adequate information to assess the risk of bias and we assessed 14 trials at high risk of bias on at least one domain (Boutelle 2011; Collins 2011; Esfarjani 2013; Estabrooks 2009; Golley 2007; Janicke 2008; Jansen 2011; Magarey 2011; Mazzeo 2014; Moens 2012; Munsch 2008; Resnick 2009; Resnicow 2015; West 2010). We assessed six trials at high risk of bias on three or more domains (Collins 2011; Estabrooks 2009; Janicke 2008; Magarey 2011; Moens 2012; West 2010).
Allocation
Only 10 of 19 trials reported an adequate method of randomisation (Boutelle 2011; Collins 2011; Estabrooks 2009; Golley 2007; Magarey 2011; Mazzeo 2014; Raynor 2012a; Raynor 2012b; van Grieken 2013; West 2010). Five trials reported an adequate concealment of allocation (Golan 2006; Golley 2007; Magarey 2011; Raynor 2012a; Raynor 2012b).
Blinding
The potential for performance bias was unknown in most trials. Six trials were at high risk of performance bias for objective or subjective (or both) outcomes as appropriate to their study outcomes (Collins 2011; Estabrooks 2009; Magarey 2011; Moens 2012; Resnicow 2015; West 2010). Blinding of outcome assessors was adequate for objective outcomes in nine trials (Collins 2011; Estabrooks 2009; Golan 2006; Golley 2007; Magarey 2011; Raynor 2012a; Raynor 2012b; Resnicow 2015; van Grieken 2013). In three trials, the risk of detection bias was high for subjective outcomes (Estabrooks 2009; Moens 2012; West 2010).
Incomplete outcome data
Many trials reported high levels of drop‐out or loss to follow‐up (highest drop‐out rates ranged between 40% and 79%) and only nine trials reported adequate means to address these in the analysis (Aragona 1975; Golan 2006; Jansen 2011; Mazzeo 2014; Raynor 2012a; Raynor 2012b; Resnicow 2015; Small 2013; West 2010). Eight trials were at high risk of attrition bias on objective outcomes (Boutelle 2011; Collins 2011; Esfarjani 2013; Estabrooks 2009; Janicke 2008; Magarey 2011; Munsch 2008; Resnick 2009), and four trials on subjective outcome measures (Collins 2011; Janicke 2008; Magarey 2011; Munsch 2008).
Selective reporting
One trial was at low risk of selective reporting bias (van Grieken 2013), whereas eight trials were at high risk of selective reporting bias (Collins 2011; Estabrooks 2009; Golley 2007; Janicke 2008; Magarey 2011; Mazzeo 2014; Moens 2012; Resnicow 2015). All other trials were at unclear risk of selective reporting bias.
Other potential sources of bias
One study by Jansen 2011 was at high risk of bias because nine participant families who had originally been randomised to the waiting list control were included in the analysis for the parent‐only intervention. There were no other potential sources of bias identified by review authors and all of the remaining trials were at unclear risk of bias on this factor.
Effects of interventions
See: Summary of findings for the main comparison Parent‐only interventions versus parent‐child interventions for childhood overweight or obesity; Summary of findings 2 Parent‐only interventions versus waiting list control for childhood overweight or obesity; Summary of findings 3 Parent‐only interventions versus minimal contact control for childhood overweight or obesity; Summary of findings 4 Parent‐only interventions versus parent‐only interventions for childhood overweight or obesity
The included trials had different durations of interventions and follow‐up. To assess the effects of the interventions we considered outcomes from the longest period of follow‐up in each study. In addition, we also reported outcomes from any post intervention follow‐up period (if it differed from the longest period of follow‐up). This allowed an assessment of the initial response to the intervention and any maintenance of that response on outcomes. If a study reported outcomes at any interim time points, we extracted these data as per the review protocol.
For 10 of 19 trials, we had to calculate SD as described (Dealing with missing data) (Boutelle 2011; Collins 2011; Esfarjani 2013; Estabrooks 2009; Jansen 2011; Magarey 2011; Mazzeo 2014; Resnick 2009; Small 2013; West 2010). Furthermore, one trial author provided SD data on two trials (Raynor 2012a; Raynor 2012b), after being contacted (Appendix 10).
Parent‐only interventions versus parent‐child interventions
Five trials reported seven comparisons of a parent‐only intervention and a parent‐child intervention (Boutelle 2011; Collins 2011; Golan 2006; Janicke 2008; Munsch 2008). To allow consideration of the effects of the interventions, we considered outcomes here from the longest period of follow‐up and any post intervention follow‐up. The period for the post intervention follow‐up in these trials ranged from 10 weeks to 12 months and the period for the longest point of follow‐up ranged from 8 to 24 months. Losses to follow‐up ranged from 6% to 50% at the post intervention follow‐up and 18% to 72% at the longest period of follow‐up (see Table 1). One study reported the participants completing the study but it was unclear what numbers of participants were included in the post intervention follow‐up (Golan 2006). In the trials by Golan 2006, Collins 2011, and Munsch 2008, there was a differential rate of losses to follow‐up between groups. All of these factors need to be considered when interpreting the results of the trials.
Primary outcomes
Changes in body mass index and body weight
Five trials reported BMI variables at the end of the intervention (Boutelle 2011 at five months; Collins 2011 and Golan 2006 at six months; Janicke 2008 at four months; Munsch 2008 at 10 weeks). All trials reported the BMI z score. Three trials (four comparisons) reported data that could be analysed in a meta‐analysis; Golan 2006 and Munsch 2008 did not report SDs or information that could be used to estimate SDs.
A pooled summary estimate of the change in BMI z score is shown in Analysis 1.1, the MD was ‐0.06 ((95% CI ‐0.13 to 0.02); P = 0.14; 277 participants; 3 trials with 4 treatment groups; low quality evidence). There was moderate heterogeneity (I2 = 37%), and similar results occurred with a fixed‐effect meta‐analysis. All included trials had a high risk of attrition bias. SDs were imputed for one trial (Boutelle 2011).
Of the two trials that did not report measure of variance, the mean change in BMI z score was reduced in both groups; ‐0.4 in the parent‐only group and ‐0.1 in the parent‐child group in the study by Golan 2006, and ‐0.16 in the parent‐only group and ‐0.08 in the parent‐child group in the study by Munsch 2008. All trials had either high rates of non‐completion across groups or differential non‐completion rates between study groups and, therefore, these results need to be interpreted with caution. In the study by Collins 2011, the BMI was also reported, there were no significant differences in change from baseline between groups.
Five trials (six comparisons) reported BMI variables beyond the end of the intervention (Boutelle 2011, Janicke 2008, and Munsch 2008 after six months; Collins 2011 after 18 months; Golan 2006 after 12 months). In all five trials, this was the BMI z score. Two trials did not report SDs or information that could be used to estimate SDs and, therefore, these were not included in the pooled summary estimate (Golan 2006; Munsch 2008). Three trials (four comparisons) therefore provided data that could be analysed in a meta‐analysis (Boutelle 2011; Collins 2011; Janicke 2008) (see Analysis 1.2). There was no substantial difference on BMI z score change between those in the parent‐only interventions and those in the parent‐child interventions ((MD ‐0.04 (95% CI ‐0.15 to 0.08); P = 0.56; 267 participants; 3 trials with 4 treatment groups; low quality evidence). There was moderate heterogeneity (I2 = 37%); results were similar with a fixed‐effect meta‐analysis. There was a high risk of attrition bias in these three studies; we imputed SDs for two of these trials (Boutelle 2011; Collins 2011). In one of the two trials that did not report SDs, there was a reduction in BMI z score in both intervention groups (‐0.3 with parent‐only versus ‐0.14 with parent‐child) (Munsch 2008) . In the study by Golan 2006, there was a reduction in BMI z score in the parent‐only group (‐1.28) and a slight increase in BMI z score in the parent‐child group (0.032).
Two trials also reported the change in percentage overweight at follow‐up. In the study by Golan 2006, immediately after the intervention the overweight change in the parent‐only group was ‐10% (SD 22) and in the parent‐child group this was ‐3% (SD 18) (P < 0.05 for between‐group difference). At follow‐up 12 months later, the change in percentage overweight was ‐12% in the parent‐only group and 0.4% in the parent‐child group (P < 0.05). In Munsch 2008, the change reported was a ‐4% reduction at the end of treatment in the parent‐only group and a ‐2.% reduction at the end of treatment in the parent‐child group (P not significant). At follow‐up six months later, the reduction in per cent overweight was ‐5% in the parent‐only group and ‐2% in the parent‐child group (P not significant).
Collins 2011 reported body weight, adjusted for age, immediately after the intervention and at the longest period of follow‐up (24 months). At six months (immediately after the intervention), in the parent‐only group the change from baseline weight was 0.4 kg (SD 2); in the parent‐child physical activity group this was 1.3 kg (SD 3.2) and in the parent‐child physical activity plus diet group this was 0.1 kg (SD 2.9). At 24 months, in the parent‐only intervention this was ‐1.7 kg (SD 9.4), in the parent‐child physical activity group this was 0.4 kg (SD 11) and in the parent‐child physical activity plus diet group this was ‐0.9 kg (SD 10.7).
Three trials reported parental BMI (Boutelle 2011; Janicke 2008; Munsch 2008). The change from baseline parental BMI in the Janicke 2008 study was ‐0.9 (SD 1.6) in the parent‐based group and ‐0.7 (SD 1.0) in the control group at the end of the intervention (five months) and was ‐0.6 (SD 2.4) in the parent‐only group and 0.2 (SD 1.5) in the control group at the follow‐up at 11 months. There were no substantial differences between groups at either time point (P = 0.93 at four months, P = 0.17 at 10 months). In the study by Munsch 2008, the change in parental BMI at the end of treatment (10 weeks) was 0.1 (SD not calculable) in the parent‐only group and ‐0.04 (SD not calculable) in the parent‐child group. At the end of follow‐up (six months later), the change in parental BMI was ‐0.1 (SD not calculable) in the parent‐only group and 0.1 (SD not calculable) in the parent‐child group. The study reported that there were no significant differences between groups. Boutelle 2011 reported BMI post‐intervention (five months) and six months later. Parental BMI change was ‐0.7 (SD 8.7) in the parent‐only group and ‐0.1 (SD 7.4) in the parent‐child group post intervention, and 0.1 (SD 9.1) in the parent‐only group and 0.3 (SD 7.2) in the parent‐child group at follow‐up. Results were suggested by the authors to be likely to be non‐inferior. There were high levels of non‐completion in these trials.
Adverse events
No trials reported adverse events.
Secondary outcomes
Health‐related quality of life and self esteem
No trials reported health‐related quality of life measures.
Immediately post the four‐month intervention Janicke 2008 assessed the self esteem of the children on four subscales of the validated Self‐Perception Profile for Children (SPPC) measure. These were social self esteem, athletic self esteem, physical self esteem and global self esteem. Results were reported for boys and girls separately because of gender differences in self esteem and, therefore, normative data were presented for the separate groups. An increase in score on this measure corresponds to increased self esteem. Changes from baseline were generally positive for all measures for both the parent‐only and parent‐child groups. There were no substantial differences between the groups seen at follow‐up (analysis was for a treatment effect between the three interventions included in the study, no pairwise analysis was undertaken of the parent‐only and parent‐child groups).
All‐cause mortality
No trials reported all‐cause mortality.
Morbidity
No trials reported morbidity.
Measures of body fat distribution
One trial reported waist circumference adjusted for age and gender (waist z score) (Collins 2011). The change from baseline between groups at the immediate follow‐up was: parent‐only ‐0.3 (SD 0.3); parent‐child physical activity ‐0.1 (SD 0.5); parent‐child physical activity plus diet ‐0.2 (SD 0.5). At 24‐month follow‐up, change from baseline was: parent‐only ‐3.9 (SD 9.9); parent‐child physical activity ‐1.5 (SD 11.6); parent‐child physical activity plus diet ‐1.1 (SD 11.1). Both sets of results should be interpreted in view of the differential and high rates of study non‐completion.
Behaviour change
One trial used the Physical Activity Questionnaire for Older Children (Boutelle 2011). This was a seven‐day recall measure designed to assess physical activity levels and consists of nine items, each being rated on a 5‐point scale. At post‐intervention follow‐up and six months later, results for the parent‐only group showed non‐inferiority to the parent‐child group. Scores were 2.8 (SD 0.6) in the parent‐only group and 2.7 (SD 1) in the parent‐child group at immediate follow‐up, and 4.2 (SD 3.7) in the parent‐only group versus 2.8 (SD 0.7) in the parent‐child group at follow‐up six months later. Non‐completion rates were high in both groups in this study.
Munsch 2008 reported outcomes on the German version of the Child Behaviour CheckList (CBCL), reporting the global score and the subscales of CBCL externalising, CBCL internalising and CBCL social problems at the end of treatment (10 weeks) and six months later. There were no substantial differences between the parent‐only group and parent‐child groups on any of these scales (data provided by study author).
The study by Collins 2011 used an objective measure of physical activity from the Actigraph 7164 uniaxial accelerometer to assess counts per minute over an eight‐day period. The total physical activity recorded increased in all groups at the immediate point of assessment (six months) but there were no substantial differences between groups. At the longest point of follow‐up (12 months), the physical activity recorded increased in the two parent‐child groups and decreased in the parent‐only group, but there were no substantial differences seen. In addition, this study measured parental report of screen behaviours by a validated measure, the Children's Leisure Activities Study Survey. The total screen time use decreased in all three groups at both measurements, but there were no substantial differences between groups.
Participants' views of the intervention
The study by Janicke 2008 asked parents whether they would be prepared to join the programme again. In the parent‐only group, 88% of parents responded that they would and 12% responded that they may be prepared to join the programme again. In the parent‐child intervention, 91% of parents responded that they would and 9% responded that they may be prepared to join the programme again. Children in the parent‐child group were asked if it was true that "Overall, this was a good program", where 85% responded 'really true'; 12% responded 'sort of true' and 3% responded 'sort of not true'.
Parent‐child relationship or assessment of parenting
No trials reported outcomes assessing parent‐child relationships or an assessment of parenting.
Socioeconomic effects
No trials reported outcomes assessing socioeconomic effects.
Parent‐only interventions versus waiting list controls
Six trials reported eight comparisons of a parent‐only intervention and a waiting list control (Aragona 1975; Golley 2007; Janicke 2008; Jansen 2011; Moens 2012; West 2010). To allow consideration of the effects of the interventions, we considered outcomes from the longest period of follow‐up and any post intervention follow‐up. The period for the post intervention follow‐up in these trials ranged from three to six months and the period for the longest point of follow‐up ranged from six to 12 months. Two trials did not report a period of follow‐up beyond the post intervention follow‐up (Moens 2012; West 2010). Losses to follow‐up ranged from 6% to 40% at the post intervention follow‐up and 18% to 60% at the longest period of follow‐up (see Table 1). In the trials by Janicke 2008, Jansen 2011, West 2010, and Aragona 1975, there was a differential rate of losses to follow‐up between groups. In the trials by Golley 2007 and Aragona 1975, losses to follow‐up at both time points were high: between 14% and 24% in the study by Golley 2007 and up to 69% in the study by Aragona 1975. Aragona 1975 had a very small sample size of five participants per treatment group. These factors need to be considered when interpreting the results of the trials.
Primary outcomes
Changes in body mass index and body weight
Three trials reported BMI variables at follow‐up post intervention (Janicke 2008 at four months; West 2010 at 12 weeks; Jansen 2011 at three months). In two trials, this was the BMI z score (Janicke 2008; West 2010), and in the third trial, this was the BMI percentile (Jansen 2011). A fourth study reported individual participant data for weight and height and we calculated the mean BMI from these data (Aragona 1975). Another study reported adjusted BMI based on parental report of weight and height and as the data were, therefore, not reliable, we have not discussed them further here (Moens 2012).
The meta‐analysis for the change in the BMI z score comparing the parent‐only group and the waiting list control group showed an MD of ‐0.12 ((95% CI ‐0.21 to ‐0.04); P = 0.003; 153 participants; 2 trials; low quality evidence; Analysis 2.1). Janicke 2008 had a high risk of attrition and reporting bias, and West 2010 had a high risk of selection and performance bias. We imputed SDs for West 2010.
At the longest point of follow‐up, four trials (six comparisons) reported BMI variables (Golley 2007 12 months post baseline; Janicke 2008 and Jansen 2011 six months after; Aragona 1975 39 weeks after). In two trials, this was the BMI z score (Golley 2007; Janicke 2008), in one trial, this was the BMI percentile (Jansen 2011), and in one trial this was the BMI (Aragona 1975).
Meta‐analysis for the change in BMI z score comparing the parent‐only group with the waiting list control group showed a MD of ‐0.10 ((95% CI ‐0.19 to ‐0.01); P = 0.04; 136 participants; 2 trials with 3 treatment arms; low quality evidence; Analysis 2.2). Janicke 2008 had a high risk of attrition and reporting bias, Golley 2007 had a high risk of reporting bias.
Jansen 2011 found no significant difference between the parent‐only intervention and the waiting list control in BMI percentile change from baseline (MD ‐1.90 (95% CI ‐3.76 to ‐0.04); Analysis 2.4). Aragona 1975 found no significant difference between either the parent‐only plus reinforcement group or the parent‐only group and the waiting list control on change from baseline BMI (Analysis 2.6). These data were based on small numbers and the rate of non‐completion was high and these data have not been combined in a meta‐analysis.
In Jansen 2011, there was a treatment effect in favour of the parent‐only intervention for BMI percentile change (‐0.48 (95% CI ‐0.89, 0.07); Analysis 2.3); however, Jansen 2011 was at a high risk of bias owing to nine families originally allocated to the waiting list control group being included in the data set for the parent‐only intervention, and, therefore, these data should be considered with caution. In Aragona 1975, there was a reduction from baseline BMI in both the parent‐only plus reinforcement group and the parent‐only intervention group compared with the waiting list control group (Analysis 2.5). However, we did not perform a meta‐analysis because these data were based on small numbers and the rate of non‐completers was high.
We undertook no sensitivity analyses on BMI change for trials with high loss to follow‐up as all of the trials had high loss to follow‐up. Therefore, caution is recommended in the interpretation of these data.
Aragona 1975 found a reduction in weight (which we converted to kilograms) in all three intervention groups at the end of the intervention period (parent‐only with reinforcement ‐5.1 kg (SD 0.8); parent‐only without reinforcement ‐4.3 kg (SD 2.9); control ‐0.2 kg (SD 2.1)). At the longest point of follow‐up, there was a decrease in weight in the parent‐only with reinforcement group (‐0.3 (SD 2.4)) and increases in weight in the parent‐only without reinforcement group (3.3 (SD 2.9) and the control group (4.7 (SD 3.4)).
Two trials reported the change in parental BMI (Janicke 2008; Jansen 2011). In the study by Janicke 2008, there was a decrease in parental BMI in both the parent‐only group and the waiting list control group at the post intervention follow‐up (parent‐only ‐0.9 (SD 1.6) versus waiting list control ‐0.7 (SD 2.6); P = 0.93 based on a three‐way comparison). At the longest period of follow‐up (at 10 months), there was also a decrease in parental BMI from baseline, albeit smaller (parent‐only ‐0.6 (SD 2.4) versus waiting list control ‐0.6 (SD 3.6); P = 0.17, based on a three‐way comparison). In the study by Jansen 2011, the parental BMI decreased in the parent‐only group and increased in the waiting list control group immediately post intervention (parent‐only ‐0.3 (SD 4.5) versus waiting list control 0.1 (SD 6.3)), and at the longest period of follow‐up six months post intervention (parent‐only ‐0.2 (SD 4.5) versus waiting list control 0.1 (SD 6.3)).
Adverse events
No trials reported adverse events.
Secondary outcomes
Health‐related quality of life and self esteem
No trials reported health‐related quality of life.
The study by Jansen 2011 assessed self esteem on the SPPC. This validated measure comprises of six subscales, two of which were of interest and reported by the study authors (physical appearance, global self worth). Scores for each item range from 1 to 4 with higher scores relating to poorer outcome. At the post treatment assessment (three months), the physical appearance rating from the parent‐only intervention group's children was 15.9 (SD 5) and in the waiting list control this was 16.1 (SD 4.7). Six months later, the ratings were 16 (SD 5.3) for the parent‐only group and 15.7 (SD 4.7) for the waiting list control group. There was no substantial main effect between groups (comparing both groups over both time periods). On the global self worth scale, the parent‐only intervention rating was 18.8 (SD 4.2) and the waiting list control rating was 20.3 (SD 4.2) at the three month post intervention follow‐up. At the final follow‐up, these ratings were 19 (SD 4.9) for the parent‐only group and 20.2 (SD 4.1) for the waiting list control group. There was no substantial main effect between groups (comparing both groups over both time periods).
Janicke 2008 assessed the self esteem of the children on four subscales (social self esteem, athletic self esteem, physical self esteem and global self esteem) of the SPPC measure at the end of the four‐month intervention. Results were reported for boys and girls separately. Changes from baseline were generally positive for all measures for both the parent‐only and waiting list control groups. There were no substantial differences between the groups at follow‐up.
All‐cause mortality
No trials reported all‐cause mortality.
Morbidity
No trials reported morbidity.
Measures of body fat distribution
Golley 2007 calculated the waist circumference z score. At the final follow‐up (at 12 months), the mean change in score was ‐0.3 (SD 0.5) in the parent‐only intense group, ‐0.2 (0.5) in the parent‐only group and ‐0.02 (0.6) in the waiting list control group. These reductions in waist circumference z scores were not substantially different between groups.
Behaviour change
West 2010 reported the Lifestyle Behaviour Checklist (LBC), which is a measure of child weight‐related problem behaviour and includes items on eating behaviours and physical activity, yielding scores on two scales, the LBC problem scale (lower scores indicate better outcome) and the LBC confidence scale (higher scores indicate better outcome). At the post intervention follow‐up at 12 weeks, the LBC problem scores were 59.4 (SD 20.7) in the parent‐only group and 73.8 (SD 19.3) in the waiting list control group. The LBC confidence scores were 204.4 (SD 37.5) in the parent‐only group compared with 165.8 (SD 46.4) in the waiting list control group (P < 0.0125 on both scales in favour of the parent‐only intervention).
Participants' views of the intervention
For the participants' views of the parent‐only interventions in the study by Golley 2007 see 'Parent‐only interventions versus parent‐only interventions' below.
Parent‐child relationship or assessment of parenting
The study by West 2010 reported data from the Parenting Scale, which is a validated measure of parental discipline practices. It has 30 items and parents indicate their tendencies to use specific discipline strategies using 7‐point Likert scales, where 7 indicates a high probability of making the discipline mistake and 1 indicates a high probability of using an effective, alternative discipline strategy. At the post intervention follow‐up at 12 weeks the Parenting Scale scores were 2.7 (SD 0.7) in the parent‐only group and 3.4 (SD 0.5) in the waiting list control group (P < 0.0125 in favour of the parent‐only intervention; low quality evidence).
Socioeconomic effects
No trials reported socioeconomic effects.
Parent‐only interventions versus minimal contact interventions
Seven trials reported 10 comparisons of a parent‐only intervention and a minimal contact control (Esfarjani 2013; Estabrooks 2009; Mazzeo 2014; Resnick 2009; Small 2013; Resnicow 2015; van Grieken 2013). To allow consideration of the effects of the interventions, we considered outcomes from the longest period of follow‐up and any post intervention follow‐up. The period for the post intervention follow‐up in these trials ranged from three to six months in all but two trials (12 months for van Grieken 2013; 24 months for Resnicow 2015), and the period for the longest point of follow‐up ranged from six to 12 months (one study, Esfarjani 2013, did not state the duration of follow‐up). One study had a planned six‐month follow‐up but did not report results as the loss to follow‐up was high (Mazzeo 2014, 68% to 73% loss to follow‐up). Two trials did not report a period of follow‐up beyond the end of the intervention (Resnick 2009; Resnicow 2015). Losses to follow‐up in the included trials ranged from 0% to 34% at the post intervention follow‐up and were between 17% and 38% at the longest period of follow‐up (see Table 1). These need to be considered when interpreting the results of the trials below.
Primary outcomes
Changes in body mass index and body weight
Six trials (eight comparisons) reported BMI variables at follow‐up post intervention. In one study (two comparisons), this was the BMI z score (Estabrooks 2009), and in the remaining trials, this was the BMI percentile (Mazzeo 2014; Resnick 2009; Resnicow 2015; Small 2013) or BMI (Esfarjani 2013). The period for the outcome assessment differed between trials (Esfarjani 2013 at six months; Estabrooks 2009 at 12 to 24 weeks; Mazzeo 2014 at 12 weeks; Resnick 2009 at 18 to 30 weeks; Resnicow 2015 at 24 months; Small 2013 at 17 weeks).
Meta‐analysis for change in BMI z score between the parent‐only groups and the control group showed an MD of ‐0.00 ((95% CI ‐0.08 to 0.08); P = 0.99; 170 participants; 1 trial with 3 treatment arms; low quality evidence). There was a high risk of attrition bias and reporting bias for Estabrooks 2009 and we imputed SDs.
Four trials reported the change in BMI percentile; however, because of lack of standardisation these could not be pooled. None of the studies demonstrated treatment effects (Analysis 3.3).
For BMI change from the trial by Esfarjani 2013, there was no difference between comparison groups (Analysis 3.5).
At the longest point of follow‐up, four trials (five comparisons) reported BMI variables. In one trial (two comparisons, Estabrooks 2009), this was the BMI z score, in one trial this was the BMI percentile (Small 2013), and in the remaining two trials this was the BMI (Esfarjani 2013; van Grieken 2013). The duration of follow‐up varied, in the study by Estabrooks 2009 and Small 2013, this was six months after the end of the intervention; the study by Esfarjani 2013 did not report the duration of follow‐up after the six month intervention; in the study by van Grieken 2013, follow‐up was at 24 months following an intervention of up to 12 months.
Meta‐analysis for the change in BMI z score comparing the parent‐only group with the minimal contact control group showed a MD of 0.01 ((95% CI ‐0.07 to 0.09); P = 0.81; 165 participants; 1 trial with 3 treatment arms; low quality evidence; Analysis 3.2).
The one study reporting BMI percentile found no a substantial treatment effect on BMI percentile change (MD ‐0.93 (95% CI ‐3.49 to 1.63); Analysis 3.4).
Meta‐analysis for change from baseline BMI showed an MD of ‐0.12 ((95% CI ‐0.39 to 0.15); P = 0.39; 614 participants; 2 trials; low quality evidence; Analysis 3.6) (Esfarjani 2013; van Grieken 2013). In the cluster trial, the study authors calculated an intra‐cluster correlation coefficient of 0.06 for BMI and the numbers analysed appear to have been adjusted appropriately (van Grieken 2013). All of these trials had high loss to follow‐up, which should be considered when interpreting these results.
No trials reported the parental BMI.
In the study by Esfarjani 2013, weight in kilograms was also reported as an outcome. The change from baseline weight at the end of the six‐month intervention was 1.8 kg (SD 4.9) in the parent‐only group and 2.6 kg (SD 5) in the control group, giving a difference of 0.8 kg (95% CI ‐2.67 to 1.1). At the longest point of follow‐up (not defined), the weight change for the two groups were 5 kg (SD 5.1) for the parent‐only group and 5.7 kg (SD 5.17) for the control group (difference 0.7 kg (95% CI ‐2.6 to 1.2).
Adverse events
No trials reported adverse events.
Secondary outcomes
Health‐related quality of life and self esteem
One study reported narratively that there were no improvements in health‐related quality of life but reported no data (Mazzeo 2014).
No trials reported self esteem.
All‐cause mortality
No trials reported all‐cause mortality.
Morbidity
No trials reported morbidity.
Measures of body fat distribution
Small 2013 reported waist and waist‐to‐height ratio. At the post intervention assessment (three months), waist circumference was 28.2 inches (SD 3.8) in the parent‐only intervention compared with 28.4 inches (SD 3.7) in the control group (1 inch = 2.5 cm). At the final assessment (six months later), the waist circumference in the parent‐only group was 29.5 inches (SD 3.5) compared with 28.9 inches (3.7) in the control group. The waist‐to‐height ratio at three months was 0.58 (SD 0.08) in the parent‐only group and 0.60 (SD 0.06) in the control group. The corresponding values at six‐month follow‐up were 0.59 (SD 0.09) in the parent‐only group and 0.59 (SD 0.08) in the control group. The trial reported that these results were not statistically significant between groups. The study by Esfarjani 2013 reported waist circumference. The change from baseline waist circumference at the end of the six‐month intervention was ‐1.0 cm (SD 5.8) in the parent‐only group and 1.5 cm (SD 5.1) in the control group, with a difference of 2.5 cm (95% CI ‐4.6 to ‐0.4). At the longest point of follow‐up (not defined), the changes in waist circumference were 2 cm (SD 5.8) in the parent‐only group and 3.5 cm (SD 5.28) in the control group, with a difference of 1.5 cm (95% CI ‐3.6 to 0.6). van Grieken 2013 also reported waist circumference at 24‐month follow‐up. In the parent‐only group the change in waist circumference was 7.2 cm (SD 5.5) compared with 7.3 cm (SD 5.3) in the control group, with a difference of 0.1 cm (95% CI ‐1.1 to 0.8).
Esfarjani 2013 reported hip circumference. There was a change in hip circumference in the parent‐only group at the end of the intervention of ‐0.5 cm (SD 4.9) compared with 1.4 cm (SD 4.9) in the control group, with a difference of 1.9 cm (95% CI ‐3.8 to ‐0.1). At the longest point of follow‐up (not defined), the change in hip circumference was 2.1 cm (SD 4.8) in the parent‐only group and 3.7 cm (SD 5.1) in the control group, with a difference of 1.6 cm (95% CI ‐3.5 to 0.2).
Behaviour change
No trials reported validated measures assessing behaviour change.
Participants' views of the intervention
The study by Mazzeo 2014 sought parental views at completion of the parent‐only intervention. Parents either strongly agreed (79%) or moderately agreed (21%) with the statement "I enjoyed attending each NOURISH session." In addition, 92% strongly agreed that they would recommend the intervention to other parents, 91% strongly or moderately agreed that the sessions had helped them eat in a healthier manner and 78% said they were exercising more. The study also reported examples of qualitative responses received from parents in interviews, both positive and negative (e.g. "I really enjoyed them and hearing what other parents concerns were like mine" and "I was excited at first but once it started, it was sometimes difficult to get there, park, and stay focused for 90 min after working all day").
Resnick 2009 asked parents a questions about the materials used and both groups appeared to be satisfied with the materials. Of 20 parents in the parent‐only group, 13 (65%) reported reading all the study materials, the corresponding rate in the control group was 17/22 (77%). Some 17 (94%) parents in the parent‐only group and 18 (82%) of parents in the control group stated that they would recommend the programme to other families. The parents in the intervention group were also asked if they found the community health workers to be helpful and 16/20 (80%) stated "yes". The trial authors reported responses to other questions.
Parent‐child relationship or assessment of parenting
Mazzeo 2014 reported parental concern about the child's weight. This was one of seven subscales of the Child Feeding Questionnaire (results of other subscales were not reported). Parental concern decreased from 4.7 (SD 0.5) to 4.6 (SD 0.7) in the parent‐only group and from 4.7 (SD 0.5) to 4.7 (SD 0.5) in the control group at the follow‐up immediately following the 12‐week intervention (P = 0.041 in favour of the parent‐only intervention; 93 participants; 1 trial; low quality evidence).
Socioeconomic effects
No trials reported socioeconomic effects.
Parent‐only interventions versus parent‐only interventions
Seven trials reported nine comparisons of two different parent‐only interventions (Aragona 1975; Estabrooks 2009; Golley 2007; Magarey 2011; Raynor 2012a; Raynor 2012b; Resnicow 2015). The point of post intervention follow‐up was three months in one study (Aragona 1975); six months in five studies (Estabrooks 2009; Golley 2007; Magarey 2011; Raynor 2012a; Raynor 2012b); and 24 months in one study (Resnicow 2015). The longest points of follow‐up ranged from 12 to 24 months (all trials except Magarey 2011 had a 12‐month follow‐up, Resnicow 2015 only had one period of follow‐up at the end of the intervention). Losses to follow‐up in the included trials ranged from 3% to 40% at the post intervention follow‐up and were between 8% and 60% at the longest period of follow‐up (see Table 1). These need to be considered when interpreting the results of the trials.
Primary outcomes
Changes in body mass index and body weight
Five trials reported BMI z score and Analysis 4.1 and Analysis 4.2 show the change from baseline for each study. No meta‐analysis was possible because there was little or no consistency between trial interventions and comparators. A narrative synthesis of the results of the trials follows.
The study by Estabrooks 2009 (a three‐arm trial, see above for other comparisons) compared two parent‐only interventions. Parents either attended a group intervention that addressed behavioural health skills and knowledge or a group intervention that addressed the same issues but also included 10 automated telephone counselling sessions over a period of six months. Both groups also utilised a workbook aimed at promoting healthy habits and physical activity throughout the interventions. Change in BMI z score at the immediate follow‐up at six months showed an MD of ‐0.04 ((95% CI ‐0.16 to 0.08); P = 0.51) and at the follow‐up 12 months later an MD of ‐0.06 ((95% CI ‐0.18 to 0.06); P = 0.34). Losses to follow‐up were above 20% in both groups at both time points.
In a three‐arm study, Golley 2007 had two parent‐only interventions: parents either attended a behavioural change parenting skills training intervention or the same intervention with seven additional intensive lifestyle support group sessions. At six months, BMI z score change showed a MD of ‐0.09 ((95% CI ‐0.38 to 0.20); P = 0.54) where there was a 24% drop‐out rate in both groups at this time point. Similarly, at 12 months' follow‐up, the MD was ‐0.09 ((95% CI ‐0.32 to 0.14); P = 0.44). The non‐completion rate at this point of follow‐up was 18% in the intensive group and 22% in the standard group intervention.
Magarey 2011 compared two parent‐only interventions, a healthy lifestyle group (which included recommendations, practical skills and monitoring aspects) and a group that had the same healthy lifestyle intervention with the addition of four parenting skills sessions. BMI z score change at the completion of the intervention at six months showed an MD of ‐0.07 ((95% CI ‐0.29 to 0.15); P = 0.54) and at the 24‐month follow‐up, an MD of 0.03 ((95% CI ‐0.24 to 0.30); P = 0.82). Non‐completion rates in this study were between 17% and 22% at the post intervention follow‐up and 36% and 39% at the 24‐month follow‐up.
One publication reported two trials and each trial had three arms, a standard arm that was a growth monitoring intervention and two additional parent‐only interventions. In the first trial, the two additional interventions focused on diet, with one intervention focusing on decreasing sugar and salty snack food and drink consumption and the second intervention focusing on increasing fruit, vegetable and low‐fat dairy intake (Raynor 2012a). In the second trial, the two additional interventions focused on diet and physical activity, with one intervention focusing on decreasing sugar intake and increasing physical activity and the second intervention focusing on increasing low‐fat intake and decreasing sedentary lifestyles such as watching television (Raynor 2012b). The completion rates in these trials were better than the other trials, with between 3% and 12% of participants not completing the study. At the point of completion of the intervention (six months) in the Raynor 2012a trial, the difference in BMI z score change between the growth monitoring group and the group focusing on decreasing sugar consumption was ‐0.04 ((95% CI ‐0.17 to 0.09); P = 0.53; data provided by study authors). The difference between the growth monitoring group and the group focusing on increasing healthy food consumption was ‐0.01 ((95% CI ‐0.14 to 0.12); P = 0.88; data provided by study authors). Similar results were also seen at 12 months in the decreasing sugar group with an MD of ‐0.04 ((95% CI ‐0.19 to 0.11); P = 0.61), and in the increasing healthy food group with an MD of ‐0.02 ((95% CI ‐0.17 to 0.13); P = 0.80) (data provided by study authors). At the point of completion of the Raynor 2012b trial, BMI z score change between the group focusing on increasing activity compared with the growth monitoring group was ‐0.69 ((95% CI ‐0.83 to ‐0.55); P < 0.00001; data provided by study authors). The difference between the group focusing on reducing sedentary behaviours compared with the growth monitoring group was ‐0.70 (( 95% CI ‐0.86 to ‐0.54); P < 0.00001; data provided by study authors). At 12 months, there was a different pattern, with neither comparisons showing substantial differences between groups: increasing activity group MD 0.01 ((95% CI ‐0.17 to 0.19); P = 0.92) and decreasing sedentary behaviours group MD ‐0.03 ((95% CI ‐0.24 to 0.18); P = 0.78) (data provided by study authors).
Aragona 1975 reported the weight and height of individual participants and mean BMI was calculated from these data. Both parent‐only interventions included training in nutrition, exercise and behaviour, and parents contracted to the investigators regarding a weight loss goal for their child. One intervention also taught reinforcement techniques. Immediately after the intervention, and at the longest point of follow‐up, there were no substantial differences in change from baseline BMI seen (Analysis 4.3; Analysis 4.4).
The study by Resnicow 2015 reported the BMI percentile at the end of the 24‐month intervention. There were no differences between the two parent‐only interventions (Analysis 4.5).
Adverse events
The trials by Raynor 2012a; Raynor 2012b reported narratively that there were no serious adverse events.
Secondary outcomes
Health‐related quality of life and self esteem
No trials reported health‐related quality of life or self esteem.
All‐cause mortality
No trials reported all‐cause mortality.
Morbidity
No trials reported morbidity.
Measures of body fat distribution
Golley 2007 calculated waist circumference z score. At the post intervention follow‐up (six months), the mean change in waist z score was ‐0.27 (SD 0.7) in the parent‐only intense group and ‐0.12 (SD 0.61) in the parent‐only group. These reductions in waist circumference z scores were not significantly different between groups. At the final follow‐up (at 12 months), the mean change in score was ‐0.31 (SD 0.53) in the parent‐only intense group and ‐0.17 (0.50) in the parent‐only group. These reductions in waist circumference z scores were not statistically significantly different between groups.
Behaviour change
No trials reported behaviour changes.
Participants' views of the intervention
Golley 2007 reported a programme evaluation. Response rates varied, with 26/31 in the parenting and intensive lifestyle group responding and 10/29 in the parenting group responding. All participants in both groups rated the quality of the service provided during the interventions as good to excellent. Fifty per cent (13/26) of participants in the parenting and intensive lifestyle training group and 80% (8/10) in the parent‐only group said they either generally or definitely received the type of help they required from the respective programme. One hundred per cent of parents in the parenting group and 85% (22/26) in the parenting and intensive lifestyle group stated they were satisfied to very satisfied with the amount of help received. One hundred per cent of parents in the parenting group and 92% (24/26) in the parenting and intensive lifestyle group stated they were helped somewhat or helped a great deal by the intervention. The study authors provided other responses.
Parent‐child relationship or assessment of parenting
One study reported results from the Alabama Parenting Questionnaire (satisfaction, efficacy, involvement, positive parenting, poor monitoring, inconsistent discipline, corporal punishment), which is a validated measure (Magarey 2011). However, outcomes were reported only for the total group, and no comparisons between the two treatment groups were provided.
Socioeconomic effects
No trials reported socioeconomic effects.
Subgroup analyses
We did not perform subgroups analyses because there were not enough trials to estimate effects in various subgroups.
Sensitivity analyses
We did not perform any sensitivity analyses because there were not enough trials included in the analyses.
Assessment of reporting bias
We did not draw funnel plots due to limited number of trials with data included in any one analysis.
Ongoing trials
We found 10 ongoing RCTs (see Characteristics of ongoing studies table). Nine of these RCTs are parallel trials, one is a cluster trial. The ages of the participants in these trials incorporate the range of 2 to 6 years in six trials, 7 to 13 years in two trials and were not reported in three trials. In five trials, the target population are children classed as overweight (various definitions), in two trials the target population are children classed as obese, and in four trials the population is described as overweight or obese. Five trials are comparing a parent‐only intervention with another parent‐only intervention; three trials are comparing a parent‐only intervention with a parent‐child intervention; three trials are comparing a parent‐only intervention with a minimal contact intervention and one trial is comparing a parent‐only intervention to no treatment. The primary outcome is the BMI z score in nine of the 10 ongoing trials; in the one other trial, this is weight change. The estimated study completion dates, where reported, range from January 2014 to November 2016.
Discussion
Summary of main results
This systematic review summarised 20 RCTs examining the effect of parent‐only interventions for treating overweight and obesity in children aged 5 to 11 years. We only included trials with at least a six‐month outcome assessment with the aim of assessing the longer‐terms effects of these types of interventions. Interventions and comparators varied between the included trials and we divided the trials into four main groups to ease interpretation. Outcomes assessed also varied between groups; although all trials reported a measure of body weight, this varied between the BMI, BMI z score, BMI percentile and weight. Many trials were of low quality, non‐completion rates of the trials were generally high and few trials accounted for these in their analyses. To allow comparisons across trials, we analysed outcome data, where reported, from the post intervention assessment and the longest period of follow‐up.
Overall, in trials comparing a parent‐only intervention with a parent‐child intervention there were no substantial differences in BMI measures at either the post intervention follow‐up or the longest follow‐up period. Other outcomes, reported less consistently across trials, also generally reported no substantial differences between groups, including parental BMI, behavioural changes and health‐related quality of life. One study undertook a process evaluation where parents responses about undertaking the programme again were similar across groups. In trials comparing a parent‐only intervention with a waiting list control, there was a treatment effect on BMI in favour of the parent‐only intervention at the post intervention follow‐up and at the longest follow‐up period (low quality evidence). There was no substantial effect of the parent‐only intervention on parental BMI or the child's self esteem. One trial reported better outcomes in the parent‐only groups on a measure of behavioural change and on a measure of parenting discipline practices (low quality evidence). There were no substantial effects of parent‐only interventions on BMI or weight when compared with minimal contact control interventions. One trial found reduced levels of parental concern in the parent‐only group. Two trials reported process evaluations and the interventions were generally rated more highly by those who responded in the parent‐only group than the control group. A number of trials compared a parent‐only intervention with another parent‐only intervention. To meet the inclusion criteria for the review, parent‐only comparisons were required to be a concomitant therapy delivered in the intervention arm. There were few similarities between interventions and comparators across the included trials. Generally, these trials did not show substantial differences between their respective parent‐only groups on the various outcomes reported.
All results need to be interpreted cautiously because of the low quality of these trials and the differences between the interventions and comparators.
Overall completeness and applicability of evidence
This review included only trials that reported outcomes at six months or more; however, within the individual trials there was considerable heterogeneity with the duration of the interventions and their respective follow‐ups varied considerably. Few trials had similar intervention characteristics and, together with the mixture of outcomes assessed and results seen, it was difficult to establish whether there is any particular intervention type that is more likely to lead to a successful outcome. It was our intention to explore the impact of the type of parent‐only intervention (e.g. focusing on parenting, cognitive behavioural therapy, behaviour change) and the setting (e.g. community, clinic‐based, internet), to determine if any specific approach was more effective for the treatment of childhood overweight and obesity. Despite the relatively large number of trials included in the review, the profound clinical heterogeneity meant that we were unable to do this. Few trials provided enough details of the intervention to allow these to be replicated by other trialists (length, type, nature of sessions, group sizes, contents, training of the provider or theoretical basis for the intervention). Few trials reported outcomes over a relatively long period of follow‐up (e.g. over two years).
Results seemed to suggest that parent‐only interventions are similar to parent‐child interventions, and minimal contact interventions, but that they are better than a waiting list control. However, there are numerous issues to consider, not least the sample sizes of many trials, the loss to follow‐up and the low quality evidence.
There was an insufficient number of trials reporting secondary outcomes of interest to the review and we could only pool BMI indices in meta‐analyses.
Quality of the evidence
Trial quality was generally low with a large proportion of trials being rated at high risk of bias on individual risk of bias criteria, and many others being rated at unclear risk of bias. GRADE assessment of the outcomes that have been pooled in this review have led to trials being downgraded for risk of bias (in particular attrition bias), and also imprecision owing to the small number of trials and small sample sizes. This makes overall interpretation of the data difficult.
Potential biases in the review process
We conducted a comprehensive search across major databases for interventions involving parent‐only interventions. In addition, we screened the reference lists of systematic reviews. Two review authors comprehensively selected, assessed trials; extracted data and assessed quality of trials for inclusion to minimise potential biases in the review processes. No decisions were made about the analysis or investigation of heterogeneity after seeing the data. Where data of relevance were missing, either to allow assessment of eligibility or at the data extraction stage, the review authors contacted the study authors for further information. Multiple groups were included in seven of the included studies and for analyses we split the shared group into two or more groups with smaller sample sizes. This approach only partially overcomes a unit of analysis error as the resulting comparisons remain correlated. Three trials are awaiting classification as information is currently unavailable to the review.
Agreements and disagreements with other studies or reviews
National Institute for Health and Care Excellence (NICE) guidance emphasises the importance of parental support in weight management services for children and young people under the age of 18 years (NICE 2013). However, parent‐only interventions are not specifically mentioned, instead family‐based interventions are advocated. The results are consistent with a previous meta‐analysis that has compared parent‐only with parent‐child (family‐focused) interventions, showing no substantial difference in the change in the BMI z score between groups (Jull 2013). The findings also agree with another systematic review that indicated that parent‐only interventions were at least as effective as parent‐child interventions, albeit showing higher drop‐out from the parent‐only interventions (Ewald 2014). Jang 2015 have also considered parent‐only interventions in a systematic review using the RE‐AIM ( Reach Effectiveness Adoption Implementation Maintenance) framework to analyse reach, adoption, implementation, efficacy/effectiveness and maintenance. They also support the effectiveness of parent‐only interventions in improving children's BMIs, but that interventions did not appear to reach higher‐risk populations. The current systematic review, as far as we are aware, is the first to analyse the parent‐only interventions by comparison group, comparing with parent‐child interventions, with waiting list and minimal contact interventions, and with different parent‐only interventions.

Study flow diagram.

Risk of bias graph: review authors' judgements about each risk of bias item presented as percentages across all included studies (blank cells indicate that the particular outcome was not investigated in some studies).
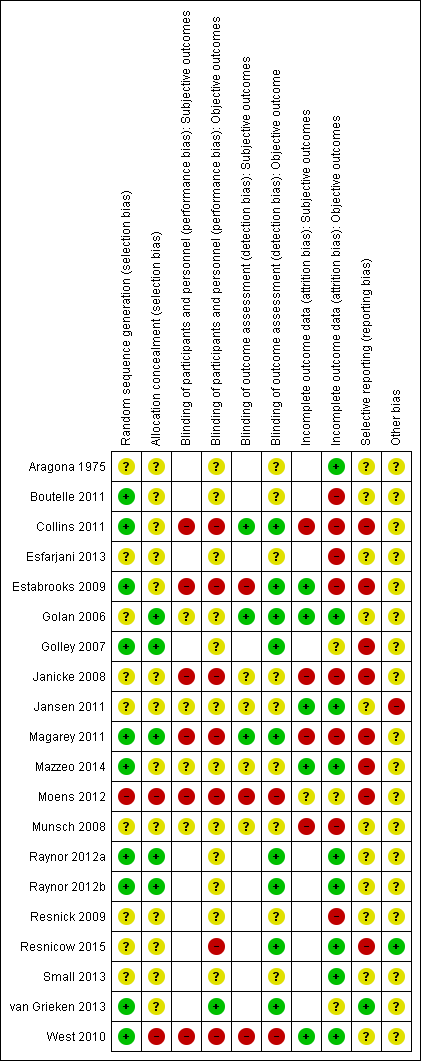
Risk of bias summary: review authors' judgements about each risk of bias item for each included study (blank cells indicate that the study did not report that particular outcome).

Comparison 1 Parent‐only interventions versus parent‐child interventions, Outcome 1 BMI z score change post intervention.
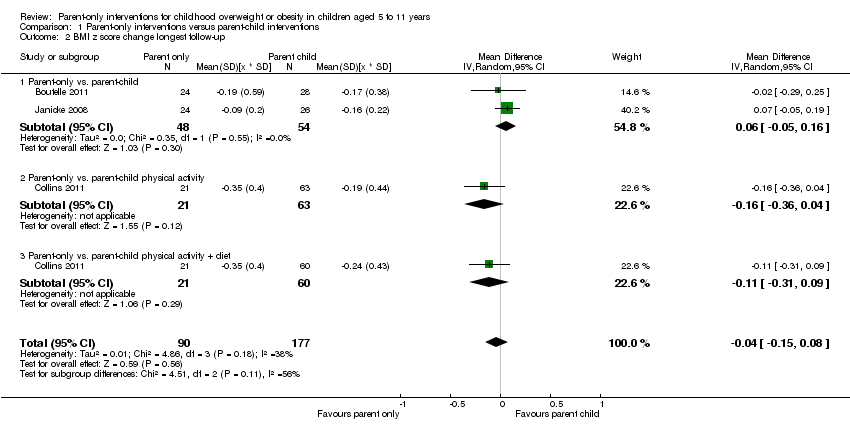
Comparison 1 Parent‐only interventions versus parent‐child interventions, Outcome 2 BMI z score change longest follow‐up.

Comparison 2 Parent‐only interventions versus waiting list interventions, Outcome 1 BMI z score change post intervention.

Comparison 2 Parent‐only interventions versus waiting list interventions, Outcome 2 BMI z score change longest follow‐up.

Comparison 2 Parent‐only interventions versus waiting list interventions, Outcome 3 BMI percentile change post intervention.
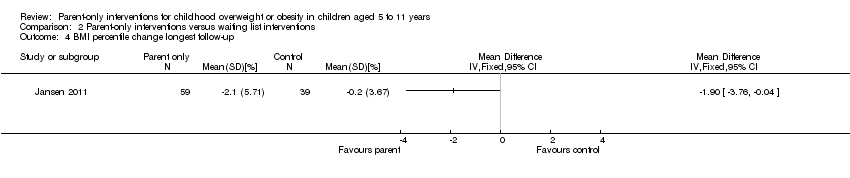
Comparison 2 Parent‐only interventions versus waiting list interventions, Outcome 4 BMI percentile change longest follow‐up.
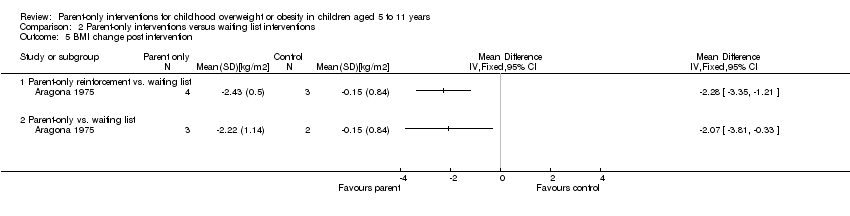
Comparison 2 Parent‐only interventions versus waiting list interventions, Outcome 5 BMI change post intervention.
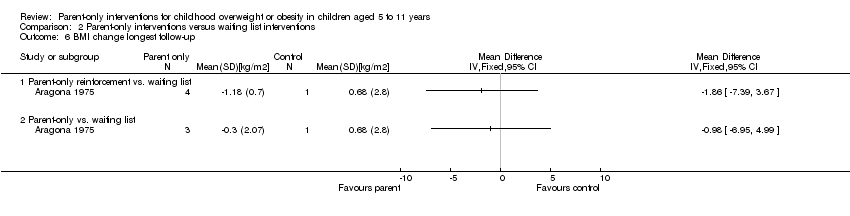
Comparison 2 Parent‐only interventions versus waiting list interventions, Outcome 6 BMI change longest follow‐up.
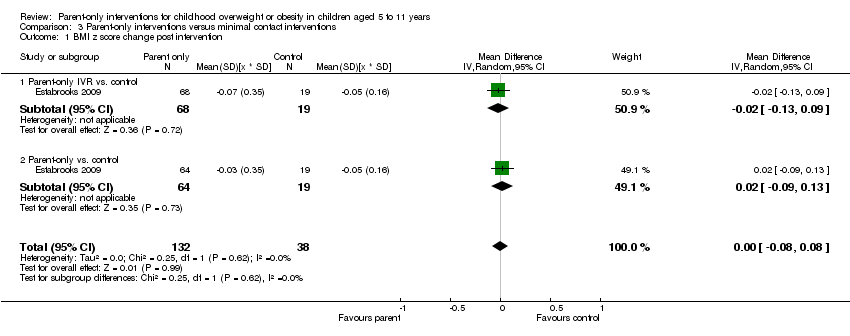
Comparison 3 Parent‐only interventions versus minimal contact interventions, Outcome 1 BMI z score change post intervention.

Comparison 3 Parent‐only interventions versus minimal contact interventions, Outcome 2 BMI z score change longest follow‐up.

Comparison 3 Parent‐only interventions versus minimal contact interventions, Outcome 3 BMI percentile change post intervention.
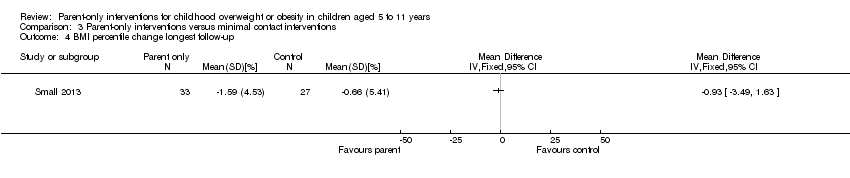
Comparison 3 Parent‐only interventions versus minimal contact interventions, Outcome 4 BMI percentile change longest follow‐up.
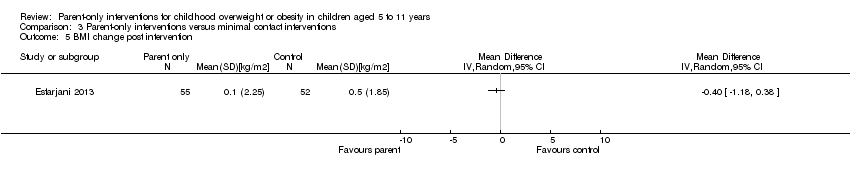
Comparison 3 Parent‐only interventions versus minimal contact interventions, Outcome 5 BMI change post intervention.

Comparison 3 Parent‐only interventions versus minimal contact interventions, Outcome 6 BMI change longest follow‐up.
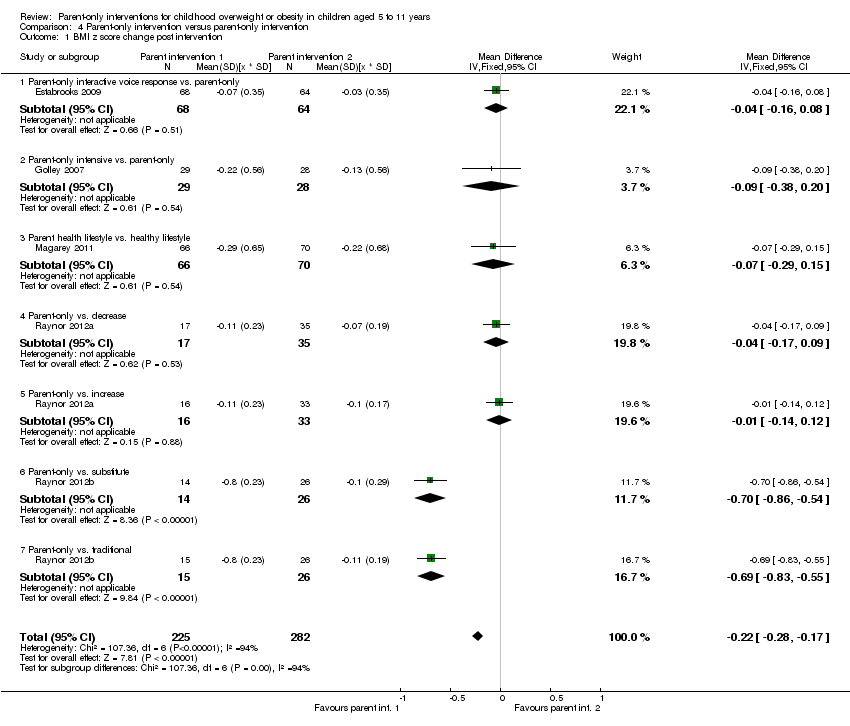
Comparison 4 Parent‐only intervention versus parent‐only intervention, Outcome 1 BMI z score change post intervention.

Comparison 4 Parent‐only intervention versus parent‐only intervention, Outcome 2 BMI z score change longest follow‐up.

Comparison 4 Parent‐only intervention versus parent‐only intervention, Outcome 3 BMI change post intervention.
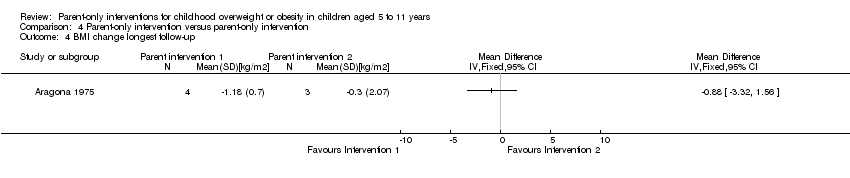
Comparison 4 Parent‐only intervention versus parent‐only intervention, Outcome 4 BMI change longest follow‐up.
![Comparison 4 Parent‐only intervention versus parent‐only intervention, Outcome 5 BMI percentile change post intervention [%].](/es/cdsr/doi/10.1002/14651858.CD012008/media/CDSR/CD012008/image_n/nCD012008-CMP-004-05.png)
Comparison 4 Parent‐only intervention versus parent‐only intervention, Outcome 5 BMI percentile change post intervention [%].
| Parent‐only interventions vs. parent‐child interventions for childhood overweight or obesity | ||||||
| Population: children with overweight or obesity Settings: outpatients; community/university Intervention: parent‐only interventions Comparison: parent‐child interventions | ||||||
| Outcomes | Parent‐child | Parent‐only | Relative effect | No of participants | Quality of the evidence | Comments |
| BMI z score change (x * SD) Follow‐up: 40‐104 weeks | The mean BMI z score change ranged across control groups from ‐0.16 to ‐0.24 | The mean BMI z score change in the intervention groups was 0.04 lower (0.15 lower to 0.08 higher) | ‐ | 267 (3) | ⊕⊕⊝⊝ | Lower scores indicate improved weight loss |
| Adverse events | See comment | See comment | See comment | See comment | See comment | No trials reported adverse events |
| Health‐related quality of life | See comment | See comment | See comment | See comment | See comment | No trials reported health‐related quality of life |
| All‐cause mortality | See comment | See comment | See comment | See comment | See comment | No trials reported all‐cause mortality |
| Morbidity | See comment | See comment | See comment | See comment | See comment | No trials reported morbidity |
| Parent‐child relationship or assessment of parenting | See comment | See comment | See comment | See comment | See comment | No trials reported outcomes assessing parent‐child relationships or an assessment of parenting |
| Socioeconomic effects | See comment | See comment | See comment | See comment | See comment | No trials reported socioeconomic effects |
| *The basis for the assumed risk (e.g. the median control group risk across trials) is provided in footnotes. The corresponding risk (and its 95% confidence interval) is based on the assumed risk in the comparison group and the relative effect of the intervention (and its 95% CI). GRADE Working Group grades of evidence | ||||||
| "A BMI z score or standard deviation score indicates how many units (of the standard deviation) a child's BMI is above or below the average BMI value for their age group and sex. For instance, a z score of 1.5 indicates that a child' is 1.5 standard deviations above the average value, and a z score of ‐1.5 indicates a child is 1.5 standard deviations below the average value" (Noo NHS 2011). aDowngraded by one level because of serious risk of attrition bias and one level for serious imprecision (see Appendix 9). | ||||||
| Parent‐only interventions vs. waiting list control for childhood overweight or obesity | ||||||
| Population: children with overweight or obesity Settings: outpatients; community Intervention: parent‐only interventions Comparison: waiting list control | ||||||
| Outcomes | Waiting list | Parent‐only | Relative effect | No of participants | Quality of the evidence | Comments |
| BMI z score change (x * SD) Follow‐up: 40‐48 weeks | The mean BMI z score change ranged across control groups from ‐0.13 to 0.02 | The mean BMI z score change in the intervention groups was 0.1 lower (0.19 lower to 0.01 lower) | ‐ | 136 (2) | ⊕⊕⊝⊝ | Lower scores indicate improved weight loss |
| Adverse events | See comment | See comment | See comment | See comment | See comment | No trials reported adverse events |
| Health‐related quality of life | See comment | See comment | See comment | See comment | See comment | No trials reported health‐related quality of life |
| All‐cause mortality | See comment | See comment | See comment | See comment | See comment | No trials reported all‐cause mortality |
| Morbidity | See comment | See comment | See comment | See comment | See comment | No trials reported morbidity |
| Parent‐child relationship or assessment of parenting (parenting scale (PS), 30 items, scored from 1 to 7; lower scores indicate more effective parental discipline practices) Follow‐up: 12 weeks | The mean PS score for the control group was 3.4 | The mean PS score in the intervention group was 0.6 points lower | ‐ | 101 (1) | ⊕⊕⊝⊝ | ‐ |
| Socioeconomic effects | See comment | See comment | See comment | See comment | See comment | No trials reported socioeconomic effects |
| *The basis for the assumed risk (e.g. the median control group risk across trials) is provided in footnotes. The corresponding risk (and its 95% confidence interval) is based on the assumed risk in the comparison group and the relative effect of the intervention (and its 95% CI). GRADE Working Group grades of evidence | ||||||
| "A BMI z score or standard deviation score indicates how many units (of the standard deviation) a child's BMI is above or below the average BMI value for their age group and sex. For instance, a z score of 1.5 indicates that a child' is 1.5 standard deviations above the average value, and a z score of ‐1.5 indicates a child is 1.5 standard deviations below the average value" (Noo NHS 2011). aDowngraded by one level because of serious risk of attrition bias and one level for serious imprecision (see Appendix 9). | ||||||
| Parent‐only interventions vs. minimal contact control for childhood overweight or obesity | ||||||
| Population: children with overweight or obesity Settings: outpatients Intervention: parent‐only interventions Comparison: minimal contact control | ||||||
| Outcomes | Minimal contact | Parent‐only | Relative effect | No of participants | Quality of the evidence | Comments |
| BMI z score change (x * SD) Follow‐up: 52 weeks | The mean BMI z score change ranged across control groups from ‐0.06 to ‐0.06 | The mean BMI z score change in the intervention group was 0.01 lower (‐0.07 lower to 0.09 higher) | ‐ | 165 (1) | ⊕⊕⊝⊝ | Lower scores indicate improved weight loss |
| Adverse events | See comment | See comment | See comment | See comment | See comment | No trials reported adverse events |
| Health‐related quality of life (Pediatric Health‐Related Quality of Life, scale from 0 to 100; higher scores indicate better HRQoL) Follow‐up: 24 weeks) | See comment | See comment | See comment | 93 (1) | See comment | No data were presented ('"no improvements in health‐related quality of life") |
| All‐cause mortality | See comment | See comment | See comment | See comment | See comment | No trials reported all‐cause mortality |
| Morbidity | See comment | See comment | See comment | See comment | See comment | No trials reported morbidity |
| Parent‐child relationship or assessment of parenting (Child Feeding Questionnaire subscale parental concern (total of 7 subscales), score range 3‐15; higher scores indicate greater parental concern) Follow‐up: 12 weeks | The mean parent concern score was 4.7 in the control group | The mean parent concern score in the intervention group was 0.1 lower. | ‐ | 93 (1) | ⊕⊕⊝⊝ | ‐ |
| Socioeconomic effects | See comment | See comment | See comment | See comment | See comment | No trials reported socioeconomic effects |
| *The basis for the assumed risk (e.g. the median control group risk across trials) is provided in footnotes. The corresponding risk (and its 95% confidence interval) is based on the assumed risk in the comparison group and the relative effect of the intervention (and its 95% CI). GRADE Working Group grades of evidence | ||||||
| "A BMI z score or standard deviation score indicates how many units (of the standard deviation) a child's BMI is above or below the average BMI value for their age group and sex. For instance, a z score of 1.5 indicates that a child' is 1.5 standard deviations above the average value, and a z score of ‐1.5 indicates a child is 1.5 standard deviations below the average value" (Noo NHS 2011). aDowngraded by one level because of serious risk of attrition bias and one level for serious imprecision (see Appendix 9). | ||||||
| Parent‐only interventions vs. parent‐only interventions for childhood overweight or obesity | ||||||
| Population: children with overweight or obesity Settings: outpatients; university + primary care Intervention: parent‐only interventions Comparison: parent‐only interventions | ||||||
| Outcomes | Parent‐only | Parent‐only | Relative effect | No of participants | Quality of the evidence | Comments |
| BMI z score change (x * SD) Follow‐up: 12‐24 months | See comment | See comment | See comment | 467 (5) | ⊕⊕⊝⊝ | No meta‐analysis because of little consistency between trial interventions and comparators; there were no substantial differences between different parent‐only interventions |
| Adverse events | See comment | See comment | See comment | See comment | See comment | Two trials reported that there were no serious adverse events (Raynor 2012a; Raynor 2012b) |
| Health‐related quality of life | See comment | See comment | See comment | See comment | See comment | No trials reported health‐related quality of life |
| All‐cause mortality | See comment | See comment | See comment | See comment | See comment | No trials reported all‐cause mortality |
| Morbidity | See comment | See comment | See comment | See comment | See comment | No trials reported morbidity |
| Parent‐child relationship or assessment of parenting (Alabama Parenting Questionnaire, 35 items; higher scores indicate improvement) Follow‐up: 24 months | See comment | See comment | See comment | 106 (1) | See comment | 1 study assessed parent‐child relationship or assessment of parenting but there were no data for comparisons between intervention groups provided |
| Socioeconomic effects | See comment | See comment | See comment | See comment | See comment | No trials reported socioeconomic effects |
| *The basis for the assumed risk (e.g. the median control group risk across trials) is provided in footnotes. The corresponding risk (and its 95% confidence interval) is based on the assumed risk in the comparison group and the relative effect of the intervention (and its 95% CI). GRADE Working Group grades of evidence | ||||||
| "A BMI z score or standard deviation score indicates how many units (of the standard deviation) a child's BMI is above or below the average BMI value for their age group and sex. For instance, a z score of 1.5 indicates that a child' is 1.5 standard deviations above the average value, and a z score of ‐1.5 indicates a child is 1.5 standard deviations below the average value" (Noo NHS 2011). aDowngraded by one level because of serious risk of attrition bias and one level for serious imprecision (see Appendix 9) | ||||||
| Intervention(s) and comparator(s) | Sample sizea | Screened/eligible | Randomised | ITT | Analysed | Finishing trial | Randomised finishing trial | Follow‐up | |
| (20) Resnicow 2015 | I1: parent‐only PCP motivational interviewing | The study was powered to detect a 3‐point difference in BMI percentile between any pair of study groups at 2‐year follow‐up, with an assumed SD for BMI percentile between 4 and 6: power of 0.80 and 2‐tailed a of 0.05. Sample size was inflated to account for practice‐level clustering, assuming an intraclass correlation between 0.01 and 0.05. On this basis and a projected 25‐30% attrition at 2‐year follow‐up, 10‐12 practices per arm (30‐36 total) and a mean of 15‐20 children per practice at baseline were required | ‐ | 16 practices 212 participants | 145 | 145 | 145 | 68 | 2 years (2 years) |
| I2: parent‐only PCP + dietician motivational interviewing | 15 practices 235 participants | 154 | 154 | 154 | 66 | ||||
| C: usual care | 11 practices 198 participants | 158 | 158 | 158 | 80 | ||||
| total: | 645 | 457 | 457 | 457 | 71 | ||||
| (19) Mazzeo 2014 | I: parent NOURISH | ‐ | 235 | 48 | ‐ | 46 | 10 | 21 | 12 weeks post 12‐week intervention (24 weeks) |
| C: parent control | 45 | ‐ | 45 | 16 | 36 | ||||
| total: | 93 | 91 | 26 | 28 | |||||
| (18) Van Grieken 2013 | I: parent‐only | Sample size was calculated taking into account the intracluster correlation coefficient (ρ = 0.1), the number of clusters (44), the expected prevalence of overweight children in the study population, the SD, expected effect (a difference in mean), and the power of the study (80%). With a participation of 50%, an expected prevalence of overweight children of 9% and a loss‐to‐follow‐up of 30%, at least 11,301 children (and their parents) should be invited by the YHC teams to participate in the study to have a final sample of about 356 overweight children (178 in both the intervention and control group). Assuming a SD of BMI to be 1.0 kg/m2, a difference in mean BMI of 0.35 kg/m2 between the children in the intervention group and the children in the control group can be established under the assumptions mentioned above | 22 clusters 7004 participants | 349 | ‐ | 21 clusters 277 participants | 277 | 79 | 2 years post up to 12‐month intervention |
| C: usual care | 22 clusters 7004 participants | 288 | ‐ | 21 clusters 230 participants | 230 | 80 | |||
| total | 637 | ‐ | 42 (507) | 507 | 80 | ||||
| (17) Small 2013 | I: parent‐only | ‐ | ‐ | 34 | 33 | 33 | 33 | 97 | 24 weeks post 16‐week intervention (41 weeks) |
| C: parent control | 33 | 27 | 27 | 27 | 82 | ||||
| total: | 67 | 60 | 60 | 60 | 90 | ||||
| (16) Esfarjani 2013 | I: parent‐only | ‐ | 550/156 | 70 | ‐ | 55 | 58 | 83 | Intervention 6 months (not reported) |
| C: parent control | 86 | ‐ | 52 | 59 | 69 | ||||
| total: | 156 | ‐ | 107 | 117 | 75 | ||||
| (15) Moens 2012 | I: parent‐only | ‐ | 80/75 | 31 | ‐ | ‐ | 31 | 100 | Immediately following 6‐month intervention |
| C: waiting list control | 19 | ‐ | ‐ | 15 | 79 | ||||
| total: | 50 | ‐ | ‐ | 46 | 92 | ||||
| (14) Raynor 2012a | I1: parent‐only | Sample size calculations presumed 2‐sided hypothesis testing at 6‐month assessment, with type 1 error rate = 0.05. To reject with 80% power the null hypothesis of no pre‐ to post‐treatment difference between intervention conditions vs. the alternative that the pre‐ to post‐treatment difference was 0.6 or greater (effect size), 24 participants per group were needed | 549 | 33 | 33 | 33 | 29 | 88 | 24 weeks post 24‐week intervention (reported as '12 months') |
| I2: parent ‐ diet decrease | 33 | 33 | 33 | 29 | 88 | ||||
| I3: parent ‐ diet increase | 35 | 35 | 35 | 32 | 91 | ||||
| total: | 101 | 101 | 101 | 90 | 89 | ||||
| (13) Raynor 2012b | I1: parent‐only | Sample size calculations presumed 2‐sided hypothesis testing at 6‐month assessment, with type 1 error rate = 0.05. To reject with 80% power the null hypothesis of no pre‐ to post‐treatment difference between intervention conditions vs. the alternative that the pre‐ to post‐treatment difference is 0.6 or greater (effect size), 24 participants per group were needed | 549 | 29 | 29 | 29 | 26 | 90 | 24 weeks post 24‐week intervention (reported as '12 months') |
| I2: parent ‐ diet and activity traditional | 26 | 26 | 26 | 24 | 92 | ||||
| I3: parent ‐ diet and activity substitute | 26 | 26 | 26 | 24 | 92 | ||||
| total: | 81 | 81 | 81 | 74 | 91 | ||||
| (12) Margarey 2011 | I: parent healthy lifestyle | Sample size calculation was based on a reduction in BMI z score of 0.26 (SD 0.49) over 12 months (power 80%, alpha = 0.05, and drop‐out rate of 30%). This represents a 50% reduction in weight velocity over 12 months and no change in height velocity. We sought 42 children per group per site (168 children) | 398 | 85 | 85 | 85 | 52 | 61 | 80 weeks post 24‐week intervention (104 weeks) |
| C: healthy lifestyle | 84 | 84 | 84 | 54 | 64 | ||||
| total: | 169 | 169 | 169 | 106 | 63 | ||||
| (11) Jansen 2011 | I: parent CBT | ‐ | 161 | 59 | ‐ | 54 | 54 | 92 | 12 weeks post 12‐week intervention (24 weeks) |
| C: waiting list control | 39 | ‐ | 34 | 34 | 87 | ||||
| total: | 98 | 88 | 88 | 90 | |||||
| (10) Collins 2011 | I: parent‐only ‐ diet | Power: 80% chance of detecting significance (2‐sided 5% level), with a 0.26 BMI z score difference from baseline to 12 months as the initial end point, with an anticipated loss to follow‐up of 20% | 505/319 | 63 | ‐ | 42 | 22 | 35 | 80 weeks post 24‐week intervention (104 weeks) |
| C1: parent‐child (physical activity) | 73 | ‐ | 63 | 35 | 48 | ||||
| C2: parent‐child (physical activity + diet) | 70 | ‐ | 60 | 36 | 51 | ||||
| total: | 206 | ‐ | 165 | 93 | 45 | ||||
| (9) Boutelle 2011 | I: parent‐only | Sample size was determined by pragmatic factors, including budget and investigator time commitments. No interim analyses were done. The hypotheses tested related to non‐inferiority of the parent treatment to the parent‐child treatment on child and parent weight loss and child daily caloric intake and physical activity. The bound for non‐inferiority hypotheses related to BMI percentile was set to 1. This is the maximum value the parent‐child group could do better than parent‐only, below which non‐inferiority would be concluded. This bound could correspond to an mean‐aged child in this sample having a BMI of 26 in the parent‐child group and 28.5 in the parent‐only group at post‐treatment/follow‐up, assuming equivalence at baseline. For a non‐inferiority bound for child BMI, which was selected post hoc, we considered choosing a BMI that would correspond to the BMI percentile non‐inferiority bound (BMI = 2.5), but instead chose a more rigorous value of BMI = 1 | 157 | 40 | ‐ | 24 | 24 | 60 | 24 weeks post 20‐week intervention (week 44) |
| C: parent‐child | 40 | ‐ | 28 | 28 | 70 | ||||
| total: | 80 | 52 | 52 | 65 | |||||
| (8) West 2010 | I: parent‐only | ‐ | 205 | 52 | 52 | 52 | 34 | 65 | 40 weeks post 12‐week intervention (52 weeks) |
| C: waiting list control | 49 | 49 | 49 | 46 | 94 | ||||
| total: | 101 | 101 | 101 | 80 | 79 | ||||
| (7) Resnick 2009 | I: educational material + personal encounters | ‐ | 84/46 | 22 | ‐ | 18 | 18 | 82 | Unclear (41 weeks between start and last mail out) |
| C: educational material | 24 | ‐ | 24 | 24 | 100 | ||||
| total: | 46 | 42 | 42 | 91 | |||||
| (6) Estabrooks 2009 | I1: parent group + IVR | Sample size calculations were completed, varying the detectable effect sizes from small to medium with a power of 0.8. The result was a need for 42 participants per intervention to detect a medium effect and 64 participants to detect a small effect | 1487/656 | 85 | ‐ | 63 | 63 | 74 | 28‐40 weeks post 12‐ to 24‐week intervention (52 weeks) |
| I2: parent group | 85 | ‐ | 56 | 56 | 66 | ||||
| C: parent workbook | 50 | ‐ | 36 | 36 | 72 | ||||
| total: | 220 | 155 | 155 | 70 | |||||
| (5) Munsch 2008 | I: mother‐only CBT | Trial authors did not reach the necessary sample size of 68 families with obese children within the given time span (the target sample size of 68 was based on a repeated‐measures analysis with alpha = 0.05, 1 ‐ beta = 0.8, and a medium effect size for the linear term of the interaction between treatment and time, assuming a drop‐out rate of 20% | 181/60 | 25 | ‐ | 7 | 7 | 28 | 24 weeks post 10‐week intervention (34 weeks) |
| C: mother‐child CBT | 31 | ‐ | 20 | 20 | 65 | ||||
| total: | 56 | 27 | 27 | 48 | |||||
| (4) Janicke 2008 | I: parent‐only | Post hoc power analyses were used to determine the detectable change in BMI z score from 0 to 10 months for the family based and parent‐only interventions relative to the waiting list control condition. Effect sizes (standardised BMI index) detectable with 80% power and 2‐sided level 0.05 tests were used. Standard deviations and sample sizes were set equal to their observed values. For comparing the family‐based and waiting list control conditions, trial authors reported 80% power to detect a shift from 0.022 to ‐0.145. For comparing the parent‐only and waiting list control conditions, trial authors reported 80% power to detect a shift from 0.022 to ‐0.135 | 111 | 34 | ‐ | 26 | 26 | 76 | 14 weeks post 16‐week intervention (40 weeks) |
| C1: parent‐child | 33 | ‐ | 24 | 24 | 73 | ||||
| C2: waiting list control | 26 | ‐ | 21 | 21 | 81 | ||||
| total: | 93 | 71 | 71 | 76 | |||||
| (3) Golley 2007 | I: parent intervention + lifestyle education | Sample size calculation was based on a fall in BMI z score reflecting a weight gain of only 50% of that expected over 12 months with normal growth. A sample size of 28 per group was estimated to have 80% power to detect a 12‐month fall in mean BMI z score from a baseline of 0.26 (SD 0.49), assuming no change in the control group, at a 2‐sided significance level of 0.05. To account for a drop‐out rate of up to one‐third (commonly 20‐50% in child weight‐management studies), 42 children per study group were sought (126 children) | 262/115 | 38 | ‐ | 31 | 31 | 82 | 24 weeks post 24‐week intervention (48 weeks) |
| C1: parent intervention | 37 | ‐ | 29 | 29 | 78 | ||||
| C2: waiting list control | 36 | ‐ | 31 | 31 | 86 | ||||
| total: | 111 | 101 | 101 | ‐ | |||||
| (2) Golan 2006 | I: parent‐only | The study was designed to detect differences of 10% weight loss with a power of 90% and a significance level of 0.05, given a drop‐out rate of 10% with a sample of 12 in each group | 102 | 14 | ‐ | 10 | 10 | 71 | 1 year post 26‐week intervention (18 months) |
| C: parent‐child | 18 | ‐ | 17 | 17 | 94 | ||||
| total: | 32 | 27 | 27 | 84 | |||||
| (1) Aragona 1975 | I1: parent‐only with reinforcement | ‐ | ‐ | 5 | ‐ | 4 | 4 | 80 | 12 weeks (51 weeks' follow‐up) |
| I2: parent‐only | 5 | ‐ | 3 | 3 | 60 | ||||
| C: waiting list control | 5 | ‐ | 5 | 2 | 40 | ||||
| total: | 15 | 12 | 9 | 60 | |||||
| Grand total | All interventions | ‐ | 1773c | 1276 | |||||
| All comparators | 1284c | 942 | |||||||
| All interventions and comparators | 3057c | 2218 | |||||||
| aAccording to power calculation in trial publication or report "‐" denotes not reported BMI: body mass index; C: comparator; CBT: cognitive behavioural therapy; I: intervention; ITT: intention‐to‐treat; IVR: interactive voice response; n: number of participants; NOURISH: nourishing our understanding of role modelling to improve support and health; PCP: primary care providers; SD: standard deviation; YHC: Youth Health Care | |||||||||
| Outcome or subgroup title | No. of studies | No. of participants | Statistical method | Effect size |
| 1 BMI z score change post intervention Show forest plot | 3 | 277 | Mean Difference (IV, Random, 95% CI) | ‐0.06 [‐0.13, 0.02] |
| 1.1 Parent‐only vs. parent‐child | 2 | 112 | Mean Difference (IV, Random, 95% CI) | ‐0.05 [‐0.13, 0.04] |
| 1.2 Parent‐only vs. parent‐child physical activity | 1 | 84 | Mean Difference (IV, Random, 95% CI) | ‐0.15 [‐0.26, ‐0.04] |
| 1.3 Parent‐only vs. parent‐child physical activity + diet | 1 | 81 | Mean Difference (IV, Random, 95% CI) | 0.0 [‐0.11, 0.11] |
| 2 BMI z score change longest follow‐up Show forest plot | 3 | 267 | Mean Difference (IV, Random, 95% CI) | ‐0.04 [‐0.15, 0.08] |
| 2.1 Parent‐only vs. parent‐child | 2 | 102 | Mean Difference (IV, Random, 95% CI) | 0.06 [‐0.05, 0.16] |
| 2.2 Parent‐only vs. parent‐child physical activity | 1 | 84 | Mean Difference (IV, Random, 95% CI) | ‐0.16 [‐0.36, 0.04] |
| 2.3 Parent‐only vs. parent‐child physical activity + diet | 1 | 81 | Mean Difference (IV, Random, 95% CI) | ‐0.11 [‐0.31, 0.09] |
| Outcome or subgroup title | No. of studies | No. of participants | Statistical method | Effect size |
| 1 BMI z score change post intervention Show forest plot | 2 | 153 | Mean Difference (IV, Random, 95% CI) | ‐0.12 [‐0.21, ‐0.04] |
| 2 BMI z score change longest follow‐up Show forest plot | 2 | 136 | Mean Difference (IV, Fixed, 95% CI) | ‐0.10 [‐0.19, ‐0.01] |
| 2.1 Parent‐only vs. waiting list | 2 | 92 | Mean Difference (IV, Fixed, 95% CI) | ‐0.11 [‐0.21, ‐0.01] |
| 2.2 Parent‐only intensive education vs. waiting list | 1 | 44 | Mean Difference (IV, Fixed, 95% CI) | ‐0.02 [‐0.29, 0.25] |
| 3 BMI percentile change post intervention Show forest plot | 1 | Mean Difference (IV, Fixed, 95% CI) | Totals not selected | |
| 4 BMI percentile change longest follow‐up Show forest plot | 1 | Mean Difference (IV, Fixed, 95% CI) | Totals not selected | |
| 5 BMI change post intervention Show forest plot | 1 | Mean Difference (IV, Fixed, 95% CI) | Totals not selected | |
| 5.1 Parent‐only reinforcement vs. waiting list | 1 | Mean Difference (IV, Fixed, 95% CI) | 0.0 [0.0, 0.0] | |
| 5.2 Parent‐only vs. waiting list | 1 | Mean Difference (IV, Fixed, 95% CI) | 0.0 [0.0, 0.0] | |
| 6 BMI change longest follow‐up Show forest plot | 1 | Mean Difference (IV, Fixed, 95% CI) | Totals not selected | |
| 6.1 Parent‐only reinforcement vs. waiting list | 1 | Mean Difference (IV, Fixed, 95% CI) | 0.0 [0.0, 0.0] | |
| 6.2 Parent‐only vs. waiting list | 1 | Mean Difference (IV, Fixed, 95% CI) | 0.0 [0.0, 0.0] | |
| Outcome or subgroup title | No. of studies | No. of participants | Statistical method | Effect size |
| 1 BMI z score change post intervention Show forest plot | 1 | 170 | Mean Difference (IV, Random, 95% CI) | ‐0.00 [‐0.08, 0.08] |
| 1.1 Parent‐only IVR vs. control | 1 | 87 | Mean Difference (IV, Random, 95% CI) | ‐0.02 [‐0.13, 0.09] |
| 1.2 Parent‐only vs. control | 1 | 83 | Mean Difference (IV, Random, 95% CI) | 0.02 [‐0.09, 0.13] |
| 2 BMI z score change longest follow‐up Show forest plot | 1 | 165 | Mean Difference (IV, Fixed, 95% CI) | 0.01 [‐0.07, 0.09] |
| 2.1 Parent‐only interactive voice response vs. control | 1 | 86 | Mean Difference (IV, Fixed, 95% CI) | ‐0.02 [‐0.13, 0.09] |
| 2.2 Parent‐only vs. control | 1 | 79 | Mean Difference (IV, Fixed, 95% CI) | 0.04 [‐0.07, 0.15] |
| 3 BMI percentile change post intervention Show forest plot | 4 | Mean Difference (IV, Random, 95% CI) | Totals not selected | |
| 3.1 Parent‐only vs. minimal contact control | 3 | Mean Difference (IV, Random, 95% CI) | 0.0 [0.0, 0.0] | |
| 3.2 Parent motivational interviewing vs. minimal contact control | 1 | Mean Difference (IV, Random, 95% CI) | 0.0 [0.0, 0.0] | |
| 3.3 Parent motivational interviewing + dietician vs. minimal contact control | 1 | Mean Difference (IV, Random, 95% CI) | 0.0 [0.0, 0.0] | |
| 4 BMI percentile change longest follow‐up Show forest plot | 1 | Mean Difference (IV, Fixed, 95% CI) | Totals not selected | |
| 5 BMI change post intervention Show forest plot | 1 | Mean Difference (IV, Random, 95% CI) | Totals not selected | |
| 6 BMI change longest follow‐up Show forest plot | 2 | 614 | Mean Difference (IV, Random, 95% CI) | ‐0.12 [‐0.39, 0.15] |
| Outcome or subgroup title | No. of studies | No. of participants | Statistical method | Effect size |
| 1 BMI z score change post intervention Show forest plot | 5 | 507 | Mean Difference (IV, Fixed, 95% CI) | ‐0.22 [‐0.28, ‐0.17] |
| 1.1 Parent‐only interactive voice response vs. parent‐only | 1 | 132 | Mean Difference (IV, Fixed, 95% CI) | ‐0.04 [‐0.16, 0.08] |
| 1.2 Parent‐only intensive vs. parent‐only | 1 | 57 | Mean Difference (IV, Fixed, 95% CI) | ‐0.09 [‐0.38, 0.20] |
| 1.3 Parent health lifestyle vs. healthy lifestyle | 1 | 136 | Mean Difference (IV, Fixed, 95% CI) | ‐0.07 [‐0.29, 0.15] |
| 1.4 Parent‐only vs. decrease | 1 | 52 | Mean Difference (IV, Fixed, 95% CI) | ‐0.04 [‐0.17, 0.09] |
| 1.5 Parent‐only vs. increase | 1 | 49 | Mean Difference (IV, Fixed, 95% CI) | ‐0.01 [‐0.14, 0.12] |
| 1.6 Parent‐only vs. substitute | 1 | 40 | Mean Difference (IV, Fixed, 95% CI) | ‐0.70 [‐0.86, ‐0.54] |
| 1.7 Parent‐only vs. traditional | 1 | 41 | Mean Difference (IV, Fixed, 95% CI) | ‐0.69 [‐0.83, ‐0.55] |
| 2 BMI z score change longest follow‐up Show forest plot | 5 | 467 | Mean Difference (IV, Fixed, 95% CI) | ‐0.03 [‐0.10, 0.03] |
| 2.1 Parent‐only interactive voice response vs. parent‐only | 1 | 119 | Mean Difference (IV, Fixed, 95% CI) | ‐0.06 [‐0.18, 0.06] |
| 2.2 Parent‐only intensive vs. parent‐only | 1 | 60 | Mean Difference (IV, Fixed, 95% CI) | ‐0.09 [‐0.32, 0.14] |
| 2.3 Parent health lifestyle vs. healthy lifestyle | 1 | 106 | Mean Difference (IV, Fixed, 95% CI) | 0.03 [‐0.24, 0.30] |
| 2.4 Parent‐only vs. decrease | 1 | 52 | Mean Difference (IV, Fixed, 95% CI) | ‐0.04 [‐0.19, 0.11] |
| 2.5 Parent‐only vs. increase | 1 | 49 | Mean Difference (IV, Fixed, 95% CI) | ‐0.02 [‐0.17, 0.13] |
| 2.6 Parent‐only vs. substitute | 1 | 41 | Mean Difference (IV, Fixed, 95% CI) | ‐0.03 [‐0.24, 0.18] |
| 2.7 Parent‐only vs. traditional | 1 | 40 | Mean Difference (IV, Fixed, 95% CI) | 0.01 [‐0.17, 0.19] |
| 3 BMI change post intervention Show forest plot | 1 | Mean Difference (IV, Fixed, 95% CI) | Totals not selected | |
| 4 BMI change longest follow‐up Show forest plot | 1 | Mean Difference (IV, Fixed, 95% CI) | Totals not selected | |
| 5 BMI percentile change post intervention [%] Show forest plot | 1 | Mean Difference (IV, Random, 95% CI) | Totals not selected | |