Analgesia controlada por la paciente con remifentanilo versus métodos parenterales alternativos para el tratamiento del dolor del trabajo de parto
Resumen
Antecedentes
Para el alivio del dolor durante el trabajo de parto están disponibles múltiples estrategias analgésicas. El remifentanilo, un opiáceo de acción corta, se ha utilizado recientemente como un analgésico alternativo debido a sus propiedades farmacológicas únicas.
Objetivos
Evaluar de forma sistemática la efectividad de la analgesia controlada por la paciente con remifentanilo intravenoso para el dolor del trabajo de parto, junto con cualquier efecto perjudicial para la madre y el neonato.
Métodos de búsqueda
Se hicieron búsquedas en el registro de ensayos del Grupo Cochrane de Embarazo y Parto (Cochrane Pregnancy and Childbirth Group) (9 diciembre 2015), ClinicalTrials.gov, en la WHO International Clinical Trials Registry Platform (ICTRP), búsquedas manuales de resúmenes de congresos (noviembre 2015), y en listas de referencias de estudios recuperados.
Criterios de selección
Ensayos controlados aleatorios (ECA) y ensayos aleatorios grupales que compararon remifentanilo (ACP) con otro opiáceo (intravenoso [IV]/intramuscular [IM]), o con otro opiáceo (ACP), o con analgesia epidural, o con remifentanilo (IV continuo), o con remifentanilo (ACP, régimen diferente), o con analgesia por inhalación, o con placebo/ningún tratamiento en todas las pacientes en trabajo de parto que incluyen grupos de alto riesgo con parto vaginal planificado.
Obtención y análisis de los datos
Dos autores de la revisión, de forma independiente, evaluaron los ensayos para la inclusión, extrajeron los datos y evaluaron la calidad de los estudios.
Se estableció contacto con los autores de los estudios para obtener información adicional diferente de los datos incompletos de los resultados. Se realizó un metanálisis de efectos aleatorios.
Para reducir el riesgo del error aleatorio en el metanálisis se realizó un análisis secuencial de ensayos. Se incluyeron ensayos con cero eventos en total y se utilizó una corrección de continuidad constante de 0,01 (ccc 0,01) para el metanálisis. Se utilizó el enfoque Grades of Recommendation, Assessment, Development and Evaluation (GRADE) para evaluar la calidad de la evidencia.
Resultados principales
Se incluyeron 20 ECA con 3569 mujeres. De estos ensayos, diez (2983 participantes) compararon remifentanilo (ACP) con una epidural, cuatro (216 participantes) con otros opiáceos (IV/IM), tres (215 participantes) con otros opiáceos (ACP), dos (135 participantes) con remifentanilo (IV continuo) y un ensayo (20 participantes) con remifentanilo (ACP, régimen diferente). No se identificaron ensayos para las comparaciones restantes.
La calidad metodológica de los estudios fue moderada a baja. El riesgo de sesgo se consideró alto en aspectos relacionados con el cegamiento y con los datos incompletos de los resultados en el 65% y el 45% de los estudios incluidos, respectivamente.
Hay evidencia de efecto en cuanto a que las pacientes del grupo de remifentanilo (ACP) estuvieron más satisfechas con el alivio del dolor que las pacientes del grupo de otros opiáceos (IV/IM) (diferencia de medias estandarizada [DME] 2,11; intervalo de confianza [IC] del 95%: 0,72 a 3,49; cuatro ensayos, evidencia de muy baja calidad) y que las pacientes estuvieron menos satisfechas en comparación con las pacientes del grupo de epidural (DME ‐0,22; IC del 95%: ‐0,40 a ‐0,04; siete ensayos, evidencia de muy baja calidad).
Hay evidencia de efecto en cuanto a que el remifentanilo (ACP) proporcionó un alivio del dolor más fuerte a la hora en comparación con otros opiáceos administrados IV/IM (DME ‐1,58; IC del 95%: ‐2,69 a ‐0,48; tres ensayos, evidencia de muy baja calidad) o mediante ACP (DME ‐0,51; IC del 95%: ‐1,01 a ‐0,00; tres ensayos, evidencia de muy baja calidad). La intensidad del dolor fue mayor en el grupo de remifentanilo (ACP) en comparación con el grupo epidural (DME 0,57; IC del 95%: 0,31 a 0,84; seis ensayos, evidencia de baja calidad).
Hubo datos limitados sobre los aspectos de seguridad de las pacientes y los neonatos. Sólo un estudio analizó la apnea materna en una comparación de remifentanilo (ACP) versus epidural e informó que la mitad de las pacientes del grupo de remifentanilo y ninguna del grupo epidural presentaron apnea (evidencia de muy baja calidad). No hay evidencia de efecto de que el remifentanilo (ACP) se asocia con un mayor riesgo de depresión respiratoria materna en comparación con la analgesia epidural (CR 0,91; IC del 95%: 0,51 a 1,62; ccc 0,01; tres ensayos, evidencia de baja calidad) y no es posible establecer una conclusión fiable al compararlo con el remifentanilo (IV continuo) (todos los brazos de estudio incluyeron cero eventos, dos ensayos, evidencia de baja calidad). En un ensayo de remifentanilo (ACP) versus otro opiáceo (IM) tres de 18 mujeres del grupo de remifentanilo y ninguna de 18 del grupo control presentaron depresión respiratoria (evidencia de muy baja calidad).
No hay evidencia de efecto de que el remifentanilo (ACP) se asocia con un mayor riesgo en los neonatos de puntuaciones de Apgar menores de 7 a los cinco minutos en comparación con la analgesia epidural (CR 1,26; IC del 95%: 0,62 a 2,57; ccc 0,01; cinco ensayos, evidencia de baja calidad) y no es posible establecer una conclusión fiable al compararlo con otro opiáceo (IV) y compararlo con el remifentanilo (ACP, régimen diferente) ambos con cero eventos en todos los brazos de estudio (un ensayo, evidencia de muy baja calidad). En un ensayo de remifentanilo (ACP) versus otro opiáceo (ACP), ninguno de los nueve neonatos del grupo de remifentanilo y tres de ocho del grupo opiáceo (ACP) tuvo puntuaciones de Apgar menores de 7 (evidencia de muy baja calidad).
Hay evidencia de que el remifentanilo (ACP) se asoció con un menor riesgo de necesidad de analgesia adicional en comparación con otros opiáceos (IV/IM) (CR 0,57; IC del 95%: 0,40 a 0,81; tres ensayos, evidencia de calidad moderada) y de que se asoció con un riesgo mayor en comparación con la analgesia epidural (CR 9,27; IC del 95%: 3,73 a 23,03; ccc 0,01; seis ensayos, evidencia de calidad moderada). No hay evidencia de efecto de que el remifentanilo (ACP) redujo la necesidad de analgesia adicional en comparación con otros opiáceos (ACP) (CR 0,76; IC del 95%: 0,45 a 1,28; tres ensayos, evidencia de baja calidad).
Hay evidencia de que no hubo diferencias en el riesgo de parto por cesárea entre el remifentanilo (ACP) y otros opiáceos (IV/IM) (CR 0,63; IC del 95%: 0,30 a 1,32; ccc 0,01; cuatro ensayos, evidencia de baja calidad) y la analgesia epidural (CR 1,0; IC del 95%: 0,82 a 1,22; ccc 0,01; nueve ensayos, evidencia de calidad moderada), respectivamente. El metanálisis agrupado mostró un aumento en el riesgo de cesárea con remifentanilo (ACP) en comparación con otros opiáceos (ACP) (CR 2,78; IC del 95%: 0,99 a 7,82; dos ensayos, evidencia de muy baja calidad). Sin embargo, con este resultado es compatible una amplia variedad de efectos clínicamente relevantes y no relevantes del tratamiento.
Conclusiones de los autores
Según la revisión sistemática actual, hay principalmente evidencia de baja calidad para informar la práctica, y los estudios de investigación futuros pueden modificar de forma significativa la situación actual. La calidad de la evidencia está limitada en general por la calidad deficiente de los estudios, la inconsistencia y la imprecisión. Se necesitan más estudios de investigación sobre resultados de seguridad maternos y neonatales (apnea y depresión respiratoria materna, puntuación de Apgar) y sobre la modalidad y el régimen óptimos de administración del remifentanilo para proporcionar una eficacia más alta con efectos adversos razonables para las madres y los neonatos.
PICO
Resumen en términos sencillos
Analgesia controlada por la paciente con remifentanilo versus métodos analgésicos alternativos para el alivio del dolor en el trabajo de parto
¿Cuál es el problema?
Durante el trabajo de parto se puede proporcionar alivio del dolor de diferentes maneras. Éstas incluyen analgesia epidural, mediante la inyección de medicación anestésica alrededor de las raíces nerviosas en la columna, opiáceos intramusculares o intravenosos continuos y analgesia por inhalación, por ejemplo con óxido nitroso. El remifentanilo es un opiáceo de acción corta, potente, de introducción relativamente reciente, que permite controlar el alivio del dolor.
¿Por qué es esto importante?
El dolor del trabajo de parto se puede asociar con efectos adversos para la madre y el recién nacido y puede dar lugar a un trabajo de parto prolongado.
Esta revisión intentó comparar el remifentanilo administrado mediante un dispositivo de analgesia controlado por la paciente (ACP) con otros opiáceos administrados de la misma manera o mediante una inyección intramuscular o intravenosa, con analgesia epidural, con regímenes diferentes de remifentanilo (ACP) o con remifentanilo como infusión intravenosa continua, con analgesia por inhalación o con ningún tratamiento en pacientes durante un parto vaginal normal. Los resultados principales de interés fueron satisfacción con el alivio del dolor, puntuaciones de dolor, efectos secundarios en las pacientes y los recién nacidos, necesidad de analgesia adicional y riesgo de cesárea.
¿Qué evidencia se encontró?
Se realizó una búsqueda en la literatura en noviembre/diciembre 2015 y se actualizó en diciembre de 2016. Se encontraron 20 ensayos controlados aleatorios con 3569 mujeres. La calidad metodológica de los estudios fue de moderada a deficiente.
Las pacientes que recibieron ACP con remifentanilo estuvieron más satisfechas con el alivio del dolor que las pacientes que recibieron otros opiáceos, ya sea por inyección intravenosa o intramuscular (cuatro ensayos, 216 pacientes, evidencia de muy baja calidad). El remifentanilo (ACP) proporcionó un alivio del dolor más fuerte a la hora que los otros opiáceos por inyección intravenosa o intramuscular (tres ensayos, 180 pacientes) y mediante ACP (tres ensayos, 215 pacientes), ambos con evidencia de muy baja calidad, pero hubo evidencia de calidad moderada de que el remifentanilo (ACP) se asoció con una disminución en la necesidad de analgesia adicional en comparación con otros opiáceos intravenosos o intramusculares (tres ensayos, 190 pacientes). El número de pacientes con necesidad de analgesia adicional no fue diferente con el remifentanilo (ACP) o los opiáceos (ACP) (tres ensayos, 215 pacientes, evidencia de baja calidad). El remifentanilo (ACP) aumentó el riesgo de depresión respiratoria materna en comparación con otros opiáceos intramusculares (un ensayo, 36 pacientes, evidencia de muy baja calidad). Los recién nacidos no tuvieron mayores probabilidades de tener puntuaciones de Apgar bajas a los cinco minutos después del parto con el remifentanilo (ACP) en comparación con otros opiáceos intravenosos o intramusculares (un ensayo, 88 recién nacidos, evidencia de muy baja calidad), pero los recién nacidos tuvieron un menor riesgo con remifentanilo (ACP) en comparación con otros opiáceos (ACP) (un ensayo, 17 recién nacidos, evidencia de muy baja calidad). El remifentanilo (ACP) no se asoció con un aumento en el riesgo de cesárea en comparación con los opiáceos intravenosos o intramusculares (cuatro ensayos, 215 pacientes, evidencia de baja calidad), pero sí en comparación con otros opiáceos (ACP) (dos ensayos, 143 pacientes, evidencia de muy baja calidad).
Las pacientes estuvieron ligeramente menos satisfechas con el remifentanilo (ACP) en comparación con la epidural para el alivio del dolor (siete ensayos, 2135 pacientes, evidencia de muy baja calidad). La intensidad del dolor fue mayor en el grupo de remifentanilo (ACP) en comparación con el grupo de epidural (seis ensayos, 235 pacientes, evidencia de baja calidad), con una mayor necesidad de analgesia adicional (seis estudios, 1037 pacientes, evidencia de calidad moderada). El remifentanilo (ACP) aumentó el riesgo de un paro respiratorio materno en comparación con la epidural (un ensayo, 38 pacientes, evidencia de muy baja calidad). El remifentanilo (ACP) no se asoció con un aumento en el riesgo de depresión respiratoria en las madres en comparación con la epidural (tres ensayos, 687 pacientes, evidencia de baja calidad). Los recién nacidos no tuvieron mayores probabilidades de tener puntuaciones de Apgar bajas a los cinco minutos después del parto (cinco ensayos, 1322 recién nacidos, evidencia de baja calidad). El número de pacientes que requirieron cesárea no fue diferente con el remifentanilo (ACP) o la analgesia epidural (evidencia de calidad moderada).
¿Qué quiere decir esto?
La confianza en los resultados de la revisión actual es limitada porque en general la calidad de la evidencia es baja. No se pueden establecer conclusiones definitivas con respecto a los efectos secundarios en las pacientes y los recién nacidos, ni con respecto a los comparadores del remifentanilo administrados mediante una infusión continua o mediante ACP con un régimen diferente ya que hay muy pocos estudios con escasas participantes que informaron sobre estos resultados. Ningún estudio elegible examinó el remifentanilo (ACP) versus la analgesia por inhalación ni ningún tratamiento. Se necesitan más estudios de investigación, especialmente sobre los efectos secundarios del remifentanilo (ACP) en las pacientes y los recién nacidos.
Authors' conclusions
Summary of findings
| Remifentanil (PCA) compared to another opioid (IV/IM) for pain management in labour | ||||||
| Patient or population: women in labour with planned vaginal delivery | ||||||
| Outcomes | Anticipated absolute effects* (95% CI) | Relative effect | № of participants | Quality of the evidence | Comments | |
| Risk with another opioid (IV/IM) | Risk with remifentanil (PCA) | |||||
| Satisfaction (overall) with pain relief (VAS 0 to 10 cm, NRS 1 to 4, NRS 0 to 10, VRS 0 to 5) | see comment | The standardised mean satisfaction score in the intervention group was 2.11 higher (0.72 higher to 3.49 higher)** | ‐ | 216 | ⊕⊝⊝⊝ | A SMD of 2.11 higher is equivalent to a range of 2.74 cm higher (SD = 1.3) to 4.68 cm higher (SD = 2.22) on a VAS 0 to 10 cm scale in the intervention group. The mean satisfaction scores in the control group range from 4.23 to 6.0 cm.# ** |
| Pain intensity 'early' (30 min/1 h) (VAS 0 to 10 cm, VAS 0 to 100 cm) | see comment | The standardised mean pain score 'early' in the intervention group was 1.58 fewer (2.69 fewer to 0.48 fewer)*** | ‐ | 180 | ⊕⊝⊝⊝ | A SMD of 1.58 fewer is equivalent to a range of 1.26 cm fewer (SD = 0.8) to 2.8 cm fewer (SD = 1.77) on a VAS 0 to 10 cm scale in the intervention group. The mean pain scores in the control group range from 3.56 to 6.3 cm (VAS 0 to 10 cm).# *** |
| Additional analgesia required (escape analgesia) | Study population | RR 0.57 | 190 | ⊕⊕⊕⊝ | ||
| 621 per 1.000 | 354 per 1.000 | |||||
| Rate of caesarean delivery | Study population | RR 0.63 | 215 | ⊕⊕⊝⊝ | Two studies includes zero events in one arm (constant continuity correction of 0.01).7 | |
| 148 per 1.000 | 93 per 1.000 | |||||
| Maternal apnoea | see comment | see comment | ‐ | (0 studies) | ‐ | No trial assessed this outcome. |
| Maternal respiratory depression (< 8 breaths/min) | None out of 18 women in the control group and three out of 18 in the remifentanil group had a respiratory depression. | not estimable | 36 | ⊕⊝⊝⊝ | Only one trial assessed this outcome. | |
| Apgar score < 7 at 5 min | None of the newborns in both groups had an Apgar score < 7 at 5 min. | not estimable | 88 | ⊕⊝⊝⊝ | Only one trial assessed this outcome. | |
| *The risk in the intervention group (and its 95% confidence interval) is based on the assumed risk in the comparison group and the relative effect of the intervention (and its 95% CI). | ||||||
| GRADE Working Group grades of evidence | ||||||
| 1 RoB ‐ downgrading (very serious): Substantial information is derived from studies at high risk of bias. After exclusion of high risk trials the CI crosses the line of no effect. 2 Inconsistency ‐ downgrading (serious): I2 > 50%. 3 Imprecision ‐ downgrading (serious): The number of women is insufficient to demonstrate the anticipated effect (OIS not reached). 4 RoB ‐ downgrading (serious): Substantial information is derived by high risk of bias studies (If more than one study: Exclusion of high risk of bias trials has no substantial effect on robustness of the results). 5 Imprecision ‐ downgrading (serious): The number of women is insufficient to demonstrate the anticipated effect (RIS not reached). The result is imprecise including appreciable benefit and harm. 6 Imprecision ‐ downgrading (very serious): Only one study with small sample size (< 150 participants) reported this outcome. 7 Estimated effect with zero/zero event handling (constant continuity correction of 1.0), Analysis 1.14: RR = 0.70 [0.34, 1.41], I2 = 1%. # The SMD was back‐transformed into the VAS 0 to 10 cm scale to facilitate the interpretation. The smallest as well as the largest SD of the studies were used for back‐transformation to reflect the range of effect. ** Higher values indicate higher levels of satisfaction. *** Lower values indicate less pain. | ||||||
| Remifentanil (PCA) compared to another opioid (PCA) for pain management in labour | ||||||
| Patient or population: women in labour with planned vaginal delivery | ||||||
| Outcomes | Anticipated absolute effects* (95% CI) | Relative effect | № of participants | Quality of the evidence | Comments | |
| Risk with another opioid (PCA) | Risk with remifentanil (PCA) | |||||
| Satisfaction (overall) with pain relief (VRS 1 to 10) | The mean satisfaction in the combined (meperidine + fentanyl) control group was 7.1 on a VRS 1 to 10 scale | Mean satisfaction in the remifentanil group was 0.92 VRS higher (0.46 to 1.39 higher).** | ‐ | 110 | ⊕⊝⊝⊝ | Only one trial assessed this outcome. |
| Pain intensity 'early' (30 min/1 h) (VAS 0 to 10 cm, VAS 0 to 100 cm) | see comment | The standardised mean pain score 'early' in the intervention group was 0.51 fewer (1.01 fewer to 0)*** | ‐ | 215 | ⊕⊝⊝⊝ | A SMD of 0.51 fewer is equivalent to a range of 1.13 cm fewer (SD = 2.22) to 1.46 cm fewer (SD = 2.875) on a VAS 0 to 10 cm scale in the intervention group. Mean pain scores in the control groups range from 5.13 cm to 7.0 cm (VAS 0 to 10 cm).# *** |
| Additional analgesia required (escape analgesia) | Study population | RR 0.76 | 215 | ⊕⊕⊝⊝ | ||
| 381 per 1.000 | 289 per 1.000 | |||||
| Rate of caesarean delivery | Study population | RR 2.78 | 143 | ⊕⊝⊝⊝ | ||
| 56 per 1.000 | 156 per 1.000 | |||||
| Maternal apnoea | see comment | see comment | ‐ | (0 studies) | ‐ | No trial assessed this outcome. |
| Maternal respiratory depression | see comment | see comment | ‐ | (0 studies) | ‐ | No trial assessed this outcome. |
| Apgar score ≤ 7 (< 7) at 5 min | Three out of eight newborns in the control group and none out of nine in the remifentanil group had an Apgar score < 7 at 5 min. | not estimable | 17 | ⊕⊝⊝⊝ | Only one trial assessed this outcome. | |
| *The risk in the intervention group (and its 95% confidence interval) is based on the assumed risk in the comparison group and the relative effect of the intervention (and its 95% CI). | ||||||
| GRADE Working Group grades of evidence | ||||||
| 1 RoB ‐ downgrading (serious): Information is derived from a high risk of bias trial. 2 RoB ‐ downgrading (serious): After exclusion of 1 high risk of bias trial (blinding) the estimated effect with CI reached clinically relevance ‐0.73 [‐1.05, ‐0.40] 3 Inconsistency ‐ downgrading (serious): I2 > 50% 4 Imprecision ‐ downgrading (serious): The number of women is insufficient to demonstrate the anticipated effect (RIS/OIS not reached). The result is imprecise including appreciable and no appreciable effect. 5 RoB ‐ downgrading (very serious): Substantial information is derived from studies at high risk of bias. Exclusion of high risk of bias trials widened the CI including appreciable benefit and harm. 6 Imprecision ‐ downgrading (very serious): Only one study with small sample size (< 150 participants) reported this outcome. 7 RoB ‐ downgrading (serious): Information is derived from a trial with unclear risk of bias. # The SMD was back‐transformed into the VAS 0 to 10 cm scale to facilitate the interpretation. The smallest as well as the largest SD of the studies were used for back‐transformation to reflect the range of effect. ** Higher values indicate higher levels of satisfaction. *** Lower values indicate less pain. | ||||||
| Remifentanil (PCA) compared to epidural/CSE for pain management in labour | ||||||
| Patient or population: women in labour with planned vaginal delivery | ||||||
| Outcomes | Anticipated absolute effects* (95% CI) | Relative effect | № of participants | Quality of the evidence | Comments | |
| Risk with epidural analgesia/central neuraxial blocks (CSE) | Risk with remifentanil (PCA) | |||||
| Satisfaction (overall) with pain relief (NRS 0 to 4, 1 to 4, 0 to 10, 1 to 10, VRS 1 to 4) | see comment | The standardised mean satisfaction score in the intervention group was 0.22 fewer (0.40 fewer to 0.04 fewer)** | ‐ | 2135 | ⊕⊝⊝⊝ | A SMD of 0.22 fewer is equivalent to a range of 0.15 cm fewer (SD = 0.7) to 0.61 cm fewer (SD = 2.78) on a VAS 0 to 10 cm scale in the intervention group. Mean satisfaction scores in the control group range from 6.7 to 9.1 cm (VAS 0 to 10 cm).# ** |
| Pain intensity 'early' (1 h) (VAS 0 to 10 cm, VAS 0 to 100 cm, NRS 0 to 10) | see comment | The standardised mean pain score 'early' in the intervention group was 0.57 higher (0.31 higher to 0.84 higher)*** | ‐ | 235 | ⊕⊕⊝⊝ | A SMD of 0.57 higher is equivalent to a range of 0.57 cm higher (SD = 1.0) to 1.43 cm higher (SD = 2.5) on a VAS 0 to 10 cm scale in the intervention group. The mean pain scores in the control group range from 1.6 to 4.14 cm (VAS 0 to 10 cm).# *** |
| Additional analgesia required | Study population | RR 9.27 | 1037 | ⊕⊕⊕⊝ | One study includes zero events in both arms; two studies include zero events in one arm (constant continuity correction of 0.01). 8 | |
| 10 per 1.000 | 93 per 1.000 | |||||
| Rate of caesarean delivery | Study population | RR 1.0 | 1578 | ⊕⊕⊕⊝ | One study includes zero events in one arm (constant continuity correction of 0.01). 9 | |
| 215 per 1.000 | 215 per 1.000 | |||||
| Maternal apnoea | None out of 19 women in the control group and nine out of 19 in the remifentanil group had an apnoea. | not estimable | 38 | ⊕⊝⊝⊝ | Only one trial assessed this outcome. | |
| Maternal respiratory depression (< 9, < 8 breaths/min) | Study population | RR 0.91 | 687 | ⊕⊕⊝⊝ | One study includes zero events in both arms; one study includes zero events in one arm (constant continuity correction of 0.01). 10 | |
| 38 per 1.000 | 35 per 1.000 | |||||
| Apgar score ≤ 7 (< 7) at 5 min | Study population | RR 1.26 | 1322 | ⊕⊕⊝⊝ | Two studies include zero events in both arms; two studies include zero events in one arm (constant continuity correction of 0.01). 11 | |
| 23 per 1.000 | 30 per 1.000 | |||||
| *The risk in the intervention group (and its 95% confidence interval) is based on the assumed risk in the comparison group and the relative effect of the intervention (and its 95% CI). | ||||||
| GRADE Working Group grades of evidence | ||||||
| 1 RoB ‐ downgrading (very serious): Substantial information is derived from studies at high risk of bias. After exclusion of high risk trials the CI crosses the line of no effect. 2 Inconsistency ‐ downgrading (serious): I2 > 50% 3 RoB ‐ downgrading (serious): Substantial information is derived from studies at high risk of bias. Exclusion of high risk of bias trials has no substantial impact on robustness of the results. 4 Imprecision ‐ downgrading (serious): The number of women is insufficient to demonstrate the anticipated effect (OIS not reached). 5 RoB ‐ downgrading (serious): Information is derived from a high risk of bias trial. 6 Imprecision ‐ downgrading (serious): The number of women is insufficient do demonstrate the anticipated effect (RIS/OIS not reached). The result is imprecise including appreciable benefit and harm. 7 Imprecision ‐ downgrading (very serious): Only one study with small sample size (< 150 participants) reported this outcome. 8 Estimated effect with zero/zero event handling (constant continuity correction of 1.0), Analysis 3.18: RR = 8.1 [3.5, 18.75], I2 = 0%. 9 Estimated effect with zero/zero event handling (constant continuity correction of 1.0), Analysis 3.19: RR = 0.99 [0.81, 1.21], I2 = 0%. 10 Estimated effect with zero/zero event handling (constant continuity correction of 1.0), Analysis 3.3: RR = 1.52 [0.23, 9.90], I2 = 50%. 11 Estimated effect with zero/zero event handling (constant continuity correction of 1.0), Analysis 3.12: RR = 1.28 [0.65, 2.51], I2 = 0%. # The SMD was back‐transformed into the VAS 0 to 10 cm scale to facilitate the interpretation. The smallest as well as the largest SD of the studies were used for back‐transformation to reflect the range of effect. ** Higher values indicate higher levels of satisfaction. *** Lower values indicate less pain. | ||||||
| Remifentanil (PCA) compared to remifentanil (continuous IV) for pain management in labour | ||||||
| Patient or population: women in labour with planned vaginal delivery | ||||||
| Outcomes | Anticipated absolute effects* (95% CI) | Relative effect | № of participants | Quality of the evidence | Comments | |
| Risk with remifentanil (continuous IV) | Risk with remifentanil (PCA) | |||||
| Satisfaction (overall) with pain relief | see comment | see comment | ‐ | (0 studies) | ‐ | No trial assessed this outcome. |
| Pain intensity 'early' (30 min/1 h) (VAS 0 to 10 cm) | The mean pain score in the remifentanil (continuous IV) group was 4.0 cm on a VAS 0 to 10 cm scale. | Mean pain score in the remifentanil (PCA) group was 1.0 cm fewer (1.8 fewer to 0.2 fewer).*** | not estimable | 53 | ⊕⊝⊝⊝ | Only one trial assessed this outcome. |
| Additional analgesia required (escape analgesia) | Two out of 29 women in the remifentanil (PCA) group and four out of 30 participants in the remifentanil (continuous IV) group required additional epidural analgesia. | not estimable | 59 (1 RCT) | ⊕⊝⊝⊝ | Only one trial assessed this outcome. | |
| Rate of caesarean delivery | see comment | see comment | ‐ | (0 studies) | ‐ | No trial assessed this outcome. |
| Maternal apnoea | see comment | see comment | ‐ | (0 studies) | ‐ | No trial assessed this outcome. |
| Maternal respiratory depression (< 8 breaths/min) | see comment | see comment | RR 0.98 | 135 | ⊕⊕⊝⊝ | All study arms include zero events (constant continuity correction of 0.01). 5 |
| Apgar score < 7 at 5 min | see comment | see comment | ‐ | (0 studies) | ‐ | No trial assessed this outcome. |
| *The risk in the intervention group (and its 95% confidence interval) is based on the assumed risk in the comparison group and the relative effect of the intervention (and its 95% CI). | ||||||
| GRADE Working Group grades of evidence | ||||||
| 1 RoB ‐ downgrading (serious): Information is derived from a high risk of bias trial. 2 Imprecision ‐ downgrading (very serious): Only one study with small sample size (< 150 participants) reported this outcome. 3 RoB ‐ downgrading (serious): Substantial information is derived from studies at high risk of bias. Exclusion of high risk of bias trials has no substantial impact on robustness of the results. 4 Imprecision ‐ downgrading (serious): The number of women is insufficient to demonstrate the anticipated effect (RIS/OIS not reached). The result is imprecise including appreciable benefit and harm. 5 Estimated effect with zero/zero event handling (constant continuity correction of 1.0), Analysis 4.1: RR = not estimable *** Lower values indicate less pain. | ||||||
| Remifentanil (PCA, increasing bolus dose) compared to remifentanil (PCA, increasing infusion dose) for pain management in labour | ||||||
| Patient or population: women in labour with planned vaginal delivery | ||||||
| Outcomes | Anticipated absolute effects* (95% CI) | Relative effect | № of participants | Quality of the evidence | Comments | |
| Risk with remifentanil (continuous IV) | Risk with remifentanil (PCA) | |||||
| Satisfaction (overall) with pain relief (VNRS 0 to 10) | The mean satisfaction scores in the remifentanil (PCA, IF) group was 8.4 on a VNRS 0 to 10 scale. | Mean satisfaction scores in the remifentanil (PCA, IB) group was 0.2 higher (0.81 fewer to 1.21 higher).** | not estimable | 20 (1 RCT) | ⊕⊕⊝⊝ | Only one trial assessed this outcome. |
| Pain intensity 'early' (30 min/1 h) | see comment | see comment | ‐ | (0 studies) | ‐ | No trial assessed this outcome. |
| Additional analgesia required (escape analgesia) | Only one out of 10 woman in the remifentanil (PCA, IF) group crossed over to the epidural group. | not estimable | 20 (1 RCT) | ⊕⊕⊝⊝ | Only one trial assessed this outcome. | |
| Rate of caesarean delivery | Four out of 10 women in each group delivered by caesarean section. | not estimable | 20 (1 RCT) | ⊕⊕⊝⊝ | Only one trial assessed this outcome. | |
| Maternal apnoea | see comment | see comment | ‐ | (0 studies) | ‐ | No trial assessed this outcome. |
| Maternal respiratory depression (< 8 breaths/min) | see comment | see comment | ‐ | (0 studies) | ‐ | No trial assessed this outcome. |
| Apgar score < 7 at 5 min | None of the newborns in both groups had an Apgar score < 7 at 5 min. | not estimable | 20 (1 RCT) | ⊕⊕⊝⊝ | Only 1 trial assessed this outcome. | |
| *The risk in the intervention group (and its 95% confidence interval) is based on the assumed risk in the comparison group and the relative effect of the intervention (and its 95% CI). | ||||||
| GRADE Working Group grades of evidence | ||||||
| 1 Imprecision ‐ downgrading (very serious): Only one study with small sample size (< 150 participants) reported this outcome. ** Higher values indicate higher levels of satisfaction. | ||||||
Background
Nowadays, multiple strategies are available to provide pain relief during labour, such as central neuraxial analgesia (e.g. epidural analgesia), parenteral opioids, and inhalational analgesia. According to the guidelines of the American Society of Anaesthesiologists (ASA) and the College of Obstetricians and Gynaecologists (ACOG), epidural analgesia is recommended as the most flexible, effective and least depressing to the central nervous system analgesic modality in obstetrics (Goetzl 2002). However, obstetric anaesthesiologists are occasionally faced with women who cannot receive this type of labour analgesia due to absolute or relative contraindications, e.g. woman receiving prophylactic anticoagulants (Moghbeli 2008), or women with significant coagulation disorders. Pregnant women may also ask for alternatives to central neuraxial analgesia for personal reasons. Moreover, central neuraxial analgesia may also technically not be possible to perform in women requesting pain relief for labour. Finally, there are many places in the world which do not offer epidural pain relief either at all, or only on a very limited basis (Saravanakumar 2007).
A common method for pain relief in labour is the use of opioids (e.g. pethidine) administered either via the intravenous (IV) or intramuscular (IM) route. In 2008, a survey in the United Kingdom on the prescription of IM opioids (e.g. pethidine) for labour analgesia concluded that pethidine lacks efficacy as an analgesic and has adverse effects on both the mother and the neonate (Tuckey 2008). Nevertheless, pethidine, morphine or diamorphine, and other long‐acting opioids are still frequently used (Tuckey 2008); a situation that does not differ markedly when compared with other European countries (Schnabel 2011).
These findings are in notable contrast to German and other European countries' guidelines on acute pain relief. Concerning the use of pethidine, the German guidelines on the management of acute pain relief in labour recommend that pethidine is not suited due to neurotoxic effects. Especially for the IM application route of pethidine, a negative recommendation (“Grade of Recommendation: A”) was stated (AWMF guidelines 2009, AWMF‐Register Nr. 001 ‐ 025, download on 29 November 2011).
Another alternative for labour analgesia is achieved by inhalational analgesia using, e.g. nitrous oxide. In principle, this method ensures that the mother stays awake and laryngeal reflexes remain intact. The fact that inhaled interventions for pain relief are usually easy to administer with limited preparation time and fast onset account for their popularity in some countries (Irestedt 1994; Kranke 2013). However, the existing body of evidence with respect to nitrous oxide and other inhaled molecules has been the subject of two systematic reviews with controversial results concerning the effectiveness as a labour analgesic (Klomp 2012; Rosen 2002).
The described discrepancy between scientific evidence and recommendations on the one hand, and the current clinical practice on the other hand, demands a closer look at the current body of evidence to discover alternative techniques that might be promising in view of efficacy (pain relief) and safety for both the mother and the neonate. For several reasons described above, there is a need for an effective and safe systemic analgesic for labour pain, which can be used as an alternative to central neuraxial analgesia in obstetrics. Due to its unique pharmacodynamic and pharmacokinetic profile (fast on‐ and offset), remifentanil might be an alternative opioid for labour analgesia (Egan 1993). Several surveys and narrative reviews focusing on opioids in obstetrics showed that remifentanil is gaining popularity (Lavand'homme 2009).
Proponents of the use of remifentanil for labour analgesia claim that it should be routinely available as an alternative for labour analgesia in those women who either do not want, can not have, or do not need, epidural analgesia (Hill 2008). However, opponents argue that not only does remifentanil produce negative respiratory effects for both the mother and the neonate, but also that the available evidence supporting the use of remifentanil is limited (Van de Velde 2008).
Therefore, it is essential to develop an evidence‐based decision basis for labour pain management and to promote a shared decision‐making process with parturients. In case of superiority of newer, more efficient and safer techniques, these techniques should be implemented when possible and safe to avoid unnecessary suffering and decrease potential negative impact on parental as well as neonatal outcomes.
Description of the condition
Pain during labour can be very intense and many pregnant women are anxious about the pain they will experience. This holds true also for women who have received prepared childbirth training (Melzack 1984). The anatomic and neurophysiologic basis underlying the pain of childbirth along with different pain‐management strategies are described in detail in an overview of systematic reviews dealing with pain management for women in labour (Jones 2012). The choice and demands of pain relief differ between countries and cultures and likewise the willingness to face and endure labour pain (Callister 2003; Callister 2010; Kartchner 2003; Semenic 2004; Weber 1996; Wilkinson 2010). Labour pain may be associated with adverse effects on both the mother and the fetus, mainly by elevated plasma catecholamine levels, respiratory changes and associated shifts in pCO2 and pH. Furthermore, intense pain may also result in prolonged labour (Reynolds 2011). Therefore, it is important to provide women with various options for pain control during labour.
Description of the intervention
Remifentanil, first described in 1991 (James 1991), is a very short‐acting opioid with an analgesic potency that is about 200 times higher compared to morphine (Westmoreland 1993). It acts as a specific agonist on the μ‐opioid‐receptor. The metabolisation of remifentanil through nonspecific tissue and plasma esterases decreases its half‐life to only a few minutes, leading to a rapid decline of action in the patient. The fast on‐ and offset of the drug action facilitates its controllability. Especially, when applied in a patient‐controlled manner, remifentanil analgesia allows enhanced flexibility and controllability for obstetrics. The action of remifentanil, as well as safety concerns are not affected by impaired liver or kidney function of the recipients (Bosilkovska 2012; Hohne 2004). Known side effects of remifentanil include respiratory depression, nausea, pruritus, and decreased heart rate and blood pressure. It is mostly used in anaesthesiology, e.g. as a component of total intravenous anaesthesia (TIVA) combined with propofol due to its predictable pharmacokinetics irrespective of organ function and the lack of accumulation. Owing to the unique pharmacodynamic and pharmacokinetic characteristics of remifentanil, it is increasingly used for labour pain relief. The comparable rapid metabolisation of IV‐administered remifentanil in adults and neonates suggests only a limited risk to cause prolonged side effects for the newborn.
How the intervention might work
Remifentanil has been used for anaesthesia for many years, providing effective and controllable analgesia for different kinds of surgical procedures by acting as a μ‐agonist. Due to its characteristics (fast onset, short half‐life), it can be administered in a patient‐controlled mode, giving the parturient the opportunity of pain relief when required. Therefore, remifentanil might be an alternative to other opioids and to epidural analgesia.
Why it is important to do this review
Remifentanil patient‐controlled analgesia (PCA) for labour analgesia is becoming increasingly popular in some countries, while in other countries there is a remaining reluctance towards its use due to the fear of possible adverse effects based on a few reported severe outcomes secondary to remifentanil administration for labour pain (Bonner 2012; Pruefer 2012). Previously, some of the published trials have been partially summarised in systematic reviews, which either deal with the comparison of remifentanil PCA versus epidural analgesia (Liu 2014), or remifentanil versus pethidine (Leong 2011), or both of those comparisons in addition to fentanyl and nitrous oxide as comparators (Schnabel 2011) in the obstetrics setting. However, none of those reviews, in contrast to the current review, defined adverse events associated with this intervention as their primary outcome. Moreover, an up‐to‐date systematic review with the comprehensive reporting and high‐quality standard of a Cochrane review, including the commitment for a subsequent update process, is still lacking.
Objectives
To systematically assess the effectiveness of remifentanil patient‐controlled analgesia (PCA) for labour analgesia, along with any potential harms to the mother and the baby.
Methods
Criteria for considering studies for this review
Types of studies
We included individually‐randomised controlled trials (RCTs) and planned to include cluster‐randomised trials. Cross‐over trials and quasi‐RCTs were not included. We planned to include trials which were only published in abstract form, if sufficient information in the abstract was available to allow an assured decision on inclusion.
Types of participants
All women in labour with planned vaginal delivery, including high‐risk groups, e.g. preterm labour or following induction of labour were eligible.
We did not include trials involving women scheduled for caesarean delivery.
Types of interventions
We compared remifentanil administered via a patient‐controlled analgesia (PCA) device versus:
-
another opioid using a different mode (nurse‐/midwife‐controlled intravenous infusion (IV)) or route (intramuscular (IM)/subcutaneous (SC)) of administration;
-
another opioid using the same mode of administration (PCA);
-
epidural analgesia or other central neuraxial blocks (e.g. combined spinal‐epidural analgesia (CSE));
-
remifentanil using a different mode (continuous IV administration) of administration;
-
remifentanil using the same mode (PCA), but different regimen (e.g. increasing bolus versus constant bolus);
-
nitrous oxide (or other forms of inhalational analgesia);
-
placebo or no treatment.
We included trials describing all modes of IV pain control with remifentanil using a PCA pump at any stage during labour. There were no restrictions regarding the lockout interval, the amount of remifentanil delivered with each bolus dose, whether adjusted doses due to the patient’s body weight, e.g. 0.5 μg/kg of actual/ideal body weight, or a dosing scheme, e.g. with increasing doses depending on the efficacy in order to find an appropriate dose. Further, we included trials investigating a regimen with only bolus doses as well as trials investigating regimen that combined a defined amount of continuous administration of remifentanil with additional bolus doses of remifentanil upon request.
Both the bolus doses as well as the basal rates could be steady or variable over the course of time. In the intervention group, no other analgesics were allowed for simultaneous administration. However, this did not exclude the prior use of other parenteral (opioid) analgesics or other methods of pain relief administered to the parturients during the conduct of the study (i.e. escape analgesia, e.g. Entonox).
Types of outcome measures
Primary outcomes
-
Satisfaction with pain relief (as defined by trialists).
-
Adverse events for women:
-
apnoea (≥ 20 s of zero respiratory rate);
-
respiratory depression (less than nine breaths/minute);
-
oxygen desaturation (SpO2 ≤ 95%, ≤ 92%);
-
hypotension;
-
bradycardia;
-
nausea;
-
vomiting;
-
pruritus;
-
postpartum haemorrhage (≥ 1000 mL);
-
sedation at one hour after onset of analgesia.
-
-
Adverse events for newborns:
-
Apgar score less than seven at five minutes;
-
Apgar score at five minutes;
-
need for naloxone;
-
depressed baby;
-
fetal heart rate (FHR)/cardiotocography (CTG) abnormalities or non‐reassuring fetal status;
-
neonatal neurologic and adaptive capacity score (NACS).
-
Secondary outcomes
-
Pain intensity (as defined by trialists) at 30 minutes to one hour ('early') and at two hours ('late')
-
Additional analgesia required (escape analgesia)
-
Rate of unscheduled caesarean delivery
-
Rate of assisted vaginal birth
-
Augmented labour (e.g. use of oxytocin)
-
Satisfaction with childbirth experience (as defined by trialists)
-
Sense of control in labour
-
Effect (negative) on mother/baby interaction
-
Breastfeeding initiation (as defined by trialists)
-
Umbilical cord base excess (arterial and venous)
-
Umbilical cord pH (arterial and venous)
-
Need for neonatal resuscitation (e.g. CPAP (continuous positive airway pressure), bag or mask ventilation, intubation)
-
Long‐term childhood development (as defined by trialists)
-
Cost (as defined by trialists
Search methods for identification of studies
The following methods section of this review is based on a standard template used by Cochrane Pregnancy and Childbirth with review‐specific modifications.
Electronic searches
We searched Cochrane Pregnancy and Childbirth’s Trials Register by contacting their Information Specialist (9 December 2015). We updated this search on 10 December 2016 and added the results to Studies awaiting classification.
The Register is a database containing over 23,000 reports of controlled trials in the field of pregnancy and childbirth. For full search methods used to populate Pregnancy and Childbirth’s Trials Register including the detailed search strategies for CENTRAL, MEDLINE, Embase and CINAHL; the list of handsearched journals and conference proceedings, and the list of journals reviewed via the current awareness service, please follow this link to the editorial information about the Cochrane Pregnancy and Childbirth in the Cochrane Library and select the ‘Specialized Register ’ section from the options on the left side of the screen.
Briefly, the Cochrane Pregnancy and Childbirth’s Trials Register is maintained by their Information Specialist and contains trials identified from:
-
monthly searches of the Cochrane Central Register of Controlled Trials (CENTRAL);
-
weekly searches of MEDLINE (Ovid);
-
weekly searches of Embase (Ovid);
-
monthly searches of CINAHL (EBSCO);
-
handsearches of 30 journals and the proceedings of major conferences;
-
weekly current awareness alerts for a further 44 journals plus monthly BioMed Central email alerts.
Search results are screened by two people and the full text of all relevant trial reports identified through the searching activities described above is reviewed. Based on the intervention described, each trial report is assigned a number that corresponds to a specific Pregnancy and Childbirth review topic (or topics), and is then added to the Register. The Information Specialist searches the Register for each review using this topic number rather than keywords. This results in a more specific search set which has been fully accounted for in the relevant review sections (Included studies; Excluded studies; Studies awaiting classification; Ongoing studies).
Search results were screened by two people (SW, YJ) and the full texts of all relevant trial reports identified through the searching activities described above were reviewed.
In addition, we searched ClinicalTrials.gov (26 November 2015) and the WHO International Clinical Trials Registry Platform (ICTRP) (27 November 2015) for unpublished, planned and ongoing trial reports. Our search terms were detailed in Appendix 1. We updated this search in December 2016 and added the results to Studies awaiting classification.
Searching other resources
We handsearched the congress abstracts of the American Society of Anesthesiologists (ASA), from 2000 to 18 November 2015, the International Anesthesia Research Society (IARS), from 2003 to 26 November 2015, and the European Society of Anaesthesiology (ESA), from 2004 to 26 November 2015. We updated this search in December 2016
We also searched the reference lists of retrieved studies. We did not apply any language or date restrictions.
Data collection and analysis
Selection of studies
Two review authors (SW, YJ) independently assessed for inclusion all the potential studies that were identified as a result of the search strategy (Appendix 2). We resolved any disagreement through discussion or, if required, we consulted a third review author (PK).
We created a study flow diagram to map the number of records identified, included and excluded.
Data extraction and management
We used a form to extract data (Appendix 3). For eligible studies, two review authors (SW, YJ) extracted the data using the agreed form. We resolved discrepancies through discussion or, if required, we consulted a third review author (PK). When information regarding any of the above was unclear, we attempted to contact authors of the original reports to provide further details. We entered data into Review Manager 5 software (RevMan 2014) and checked for accuracy. A detailed description of the included studies is provided under the section Characteristics of included studies.
Assessment of risk of bias in included studies
Two review authors (SW, YJ) independently assessed risk of bias (RoB) for each study using the criteria outlined in the Cochrane Handbook for Systematic Reviews of Interventions (Higgins 2011) (Appendix 4). We resolved any disagreement by discussion or by involving further review authors (PK, AA).
(1) Random sequence generation (checking for possible selection bias)
We described for each included study the method used to generate the allocation sequence in sufficient detail to allow an assessment of whether it should produce comparable groups.
We assessed the method as:
-
low risk of bias (any truly random process, e.g. random number table; computer random number generator);
-
high risk of bias (any non‐random process, e.g. odd or even date of birth; hospital or clinic record number);
-
unclear risk of bias.
(2) Allocation concealment (checking for possible selection bias)
We described for each included study the method used to conceal allocation to interventions prior to assignment and assessed whether the intervention allocation could have been foreseen in advance of, or during recruitment, or changed after assignment.
We assessed the methods as:
-
low risk of bias (e.g. telephone or central randomisation; sequentially numbered opaque sealed envelopes);
-
high risk of bias (open random allocation; unsealed or non‐opaque envelopes, alternation; date of birth);
-
unclear risk of bias.
(3.1) Blinding of participants and personnel (checking for possible performance bias)
We described for each included study the methods used, if any, to blind study participants and personnel from knowledge of which intervention a participant received. We considered that studies were at low risk of bias if they were efficiently blinded (methods used for blinding were plausible), or if we judged that the lack of blinding would be unlikely to affect results. We assessed blinding separately for subjective and objective outcomes. Most of the outcomes being assessed were defined as subjective outcomes with the exception of umbilical cord base excess/pH, vomiting and postpartum haemorrhage which were defined as objective outcomes. All GRADE‐relevant outcomes were subjective outcomes.
We assessed the methods as:
-
low, high or unclear risk of bias for participants;
-
low, high or unclear risk of bias for personnel.
(3.2) Blinding of outcome assessment (checking for possible detection bias)
We described for each included study the methods used, if any, to blind outcome assessors from knowledge of which intervention a participant received. We assessed blinding separately for subjective and objective outcomes.
We assessed methods used to blind outcome assessment as:
-
low, high or unclear risk of bias.
(4) Incomplete outcome data (checking for possible attrition bias due to the amount, nature and handling of incomplete outcome data)
We described for each included study, and for each outcome or class of outcomes (adverse events for mothers and newborns), the completeness of data including attrition and exclusions from the analysis. We stated whether attrition and exclusions were reported and the numbers included in the analysis at each stage (compared with the total randomised participants), reasons for attrition or exclusion where reported, and whether missing data were balanced across groups or were related to outcomes (see Characteristics of included studies, 'Risk of bias' table). We further assessed for each included study the cross‐over rates, escape rates (rescue analgesia), type of data analysis (full‐intention‐to‐treat (F‐ITT), partial‐ITT, per‐protocol‐analysis, as‐treated analysis), and the methods used for imputation of missing data. We assessed attrition bias separately for each outcome or class of outcome (Table 1).
| Study | No. randomised (Remifentanil/ control) | No. analysed (Remifentanil/ control) | Overall assessment for risk of attrition bias | Outcome level_Risk of bias | |||||
| Satisfaction with pain relief | AE for women | AE for newborns | Pain intensity | Additional analgesia | Rate of CS | ||||
| 10/ 10 | 10/ 10 | Low | Low | Low | Low | Low | Low | Low | |
| 20/ 20 | 20/ 19 | High | High | High | High | Unclear | Unclear | ||
| 12/ 12 | 12/ 12 | Low | Low | Low | Low | Low | Low | ||
| 60/ 60/ 60 | 52/ 53/ 54 | High | High | High | High | Low | Low | High | |
| 14/ 12 | 10/ 10 | High | High | Low | High | High | Low | Low | |
| 57/ 59 | 49/ 49 | High | High | High | High | Unclear | Unclear | High | |
| 15/ 15 | 15/ 15 | Low | Low | Low | Low | Low | Low | ||
| 43/ 45 | 43/ 45 | Unclear | Low | High | Low | Low | Low | Low | |
| 213 NA/ NA/ NA/ NA | 192 44/ 50/ 49/ 49 | Low | Low | Low | Low | ||||
| 709/ 705 | 687/ 671 | High | High | High | High | High | High | High | |
| 380/ 380/ 380 | 380/ 380/ 380 | Low | Low | Low | Low | Low | Low | ||
| 41/ 41 | 41/ 41 | Low | Low | Low | Low | Low | |||
| 34/ 34 | 34/ 34 | Low | Low | Low | Low | Low | Low | Low | |
| 30/ 30 | 27/ 26 | High | High | High | High | High | High | ||
| 20/ 20 | 19/ 20 | Low | Low | Low | Low | Low | Low | Low | |
| 13/ 15 | 12/ 12 | High | High | High | Low | High | Low | ||
| 18/ 18 | 18/ 18 | Unclear | Low | Low | Low | High | High | ||
| 19/ 20 | 17/ 20 | High | High | High | High | High | Low | High | |
| 9/ 8 | 9/ 8 | Low | Low | Low | Low | Low | Low | ||
| 27/ 25 | 24/ 21 | High | High | High | High | High | High | High | |
Abbreviations:
AE: adverse events, CS: caesarean section
We assessed methods as:
-
low risk of bias (e.g. no missing outcome data after randomisation; missing outcome data less than 15%, and reported, and balanced across groups, and unrelated to true outcome; full‐ and partial‐ITT);
-
high risk of bias (e.g. missing outcome data greater than 15% or numbers or reasons for missing data not reported or imbalanced across groups; ‘as‐treated’ analysis done with substantial departure of intervention received from that assigned at randomisation);
-
unclear risk of bias.
(5) Selective reporting (checking for reporting bias)
We described for each included study how we investigated the possibility of selective outcome reporting bias and what we found.
We assessed the methods as:
-
low risk of bias (if a study protocol was available and all of the study’s pre‐specified primary and secondary outcomes have been reported in the final study report);
-
high risk of bias (where not all pre‐specified primary and secondary outcomes have been reported; one or more reported primary outcomes were not pre‐specified; outcomes of interest were reported incompletely and so cannot be used; study failed to include results of a key outcome that would have been expected to have been reported);
-
unclear risk of bias (if no published study protocol was available).
(6) Other bias (checking for bias due to problems not covered by (1) to (5) above)
We described for each included study any important concerns we had about other possible sources of bias (e.g. early stopping of the trial without pre‐defined stopping rules).
We assessed whether each study was free of other problems that could put it at risk of bias:
-
low risk of other bias;
-
high risk of other bias;
-
unclear whether there is risk of other bias.
(7) Overall risk of bias
We made explicit judgements about whether studies were at high risk of bias, according to the criteria given in the Handbook (Higgins 2011). With reference to the potential biases stated above (1 to 6), we assessed the likely magnitude and direction of the bias and whether we considered it was likely to have an impact on the findings. We explored the impact of the level of bias through undertaking sensitivity analyses ‐ seeTable 2; Table 3; Table 4
| Sensitivity analysis: Selection bias | Statistical method | All studies | 'high risk of bias'‐studies excluded | Impact on robustness (95% CI) | ||
| n | Effect estimate | n | Effect estimate | |||
| 1. Remifentanil (PCA) versus another opioid (IV/IM) | ||||||
| 1.1 Satisfaction with pain relief | SMD (IV, Random), 95% CI | 4, all at low risk of bias | ||||
| 1.3 Oxygen desaturation (SpO2 < 95%) | RR (MH, Random), 95% CI | 2, all at low risk of bias | ||||
| 1.4 Nausea (and vomiting) | RR (MH, Random), 95% CI | 4, all at low risk of bias | ||||
| 1.6 Pruritus | RR (IV, Random), 95% CI, 0/0 cell counts | 2, all at low risk of bias | ||||
| 1.10 FHR/CTG abnormalities, non‐reassuring fetal status | RR (MH, Random), 95% CI | 2, all at low risk of bias | ||||
| 1.11 Pain intensity 'early' (30 min/1 h) | SMD (IV, Random), 95% CI | 3, all at low risk of bias | ||||
| 1.13 Additional analgesia required (escape analgesia) | RR (MH, Random), 95% CI | 3, all at low risk of bias | ||||
| 1.14 Rate of caesarean delivery | RR (MH, Random), 95% CI | 4, all at low risk of bias | ||||
| 2. Remifentanil (PCA) versus another opioid (PCA) | ||||||
| 2.2 Oxygen desaturation (SpO2 < 95%) | RR (MH, Random), 95% CI | 2, all at low risk of bias | ||||
| 2.10 Need for naloxone | RR (IV, Random), 95% CI, 0/0 cell counts | 2, all at low risk of bias | ||||
| 2.12 NACS at 15/30 min | MD (IV, Random), 95% CI | 2, all at low risk of bias | ||||
| 2.13 Pain intensity 'early' (30 min/1 h) | SMD (IV, Random), 95% CI | 3, all at low risk of bias | ||||
| 2.15 Additional analgesia required (escape analgesia) | RR (MH, Random), 95% CI | 3, all at low risk of bias | ||||
| 2.16 Rate of caesarean delivery | RR (MH, Random), 95% CI | 2, all at low risk of bias | ||||
| 3. Remifentanil (PCA) versus epidural/combined spinal‐epidural analgesia (CSE) | ||||||
| 3.1 Satisfaction with pain relief | SMD (IV, Random), 95% CI | 7 | ‐0.22 [‐0.40, ‐0.04] | 6 | ‐0.20 [‐0.46, 0.07] | Yes (CI includes 0) |
| 3.3 Respiratory depression (< 9, < 8 breaths/min) | RR (IV, Random), 95% CI, 0/0 cell counts | 3 | 0.91 [0.51, 1.62] | 2 | 0.91 [0.52, 1.61] | No |
| 3.4 Oxygen desaturation (SpO2 < 92%) | RR (MH, Random), 95% CI | 3 | 3.24 [1.66, 6.32] | 2 | 5.83 [0.40, 84.06] | Yes (CI includes 1) |
| 3.5 Oxygen desaturation (SpO2 < 95%) | RR (MH, Random), 95% CI | 3 | 3.27 [2.32, 4.61] | 2 | 5.44 [2.11, 14.02] | Yes (effect and CI increased) |
| 3.6 Hypotension | RR (IV, Random), 95% CI, 0/0 cell counts | 4 | 0.59 [0.37, 0.94] | 3 | 0.57 [0.00, 2.4E7] | Yes (CI includes 1) |
| 3.7 Bradycardia | RR (IV, Random), 95% CI, 0/0 cell counts | 2, all at low risk of bias | ||||
| 3.8 Nausea | RR (MH, Random), 95% CI | 8 | 1.49 [1.19, 1.86] | 7 | 1.41 [1.09, 1.83] | No |
| 3.9 Vomiting | RR (MH, Random), 95% CI | 6 | 1.63 [1.25, 2.13] | 5 | 1.82 [1.29, 2.57] | No |
| 3.10 Pruritus | RR (MH, Random), 95% CI | 7 | 0.75 [0.48, 1.18] | 6 | 0.81 [0.45, 1.45] | No |
| 3.11 Sedation (1 h) | MD (IV, Random), 95% CI | 3, all at low risk of bias | ||||
| 3.12 Apgarscore ≤ 7 (< 7) at 5 min | RR (IV, Random), 95% CI, 0/0 cell counts | 5, all at low risk of bias | ||||
| 3.13 Apgarscore at 5 min | MD (IV,), 95% CI | 3, all at low risk of bias | ||||
| 3.14 Need for naloxone | RR (IV, Random), 95% CI, 0/0 cell counts | 2, all at low risk of bias | ||||
| 3.15 FHR/CTG abnormalities, non‐reassuring fetal status | RR (MH, Random), 95% CI | 5, all at low risk of bias | ||||
| 3.16 Pain intensity 'early' (1 h) | SMD (IV, Random), 95% CI | 6, all at low risk of bias | ||||
| 3.18 Additional analgesia required | RR (IV, Random), 95% CI, 0/0 cell counts | 6 | 9.27 [3.73, 23.03] | 5 | 5.29 [1.2, 23.3] | No |
| 3.19 Rate of caesarean delivery | RR (MH, Random), 95% CI | 9, all at low risk of bias | ||||
| 4. Remifentanil (PCA) versus remifentanil (continuous IV) | ||||||
| 4.1 Respiratory depression (< 8 breaths/min) | RR (IV, Random), 95% CI, 0/0 cell counts | 2, all at low risk of bias | ||||
| 4.3 Hypotension | RR (IV, Random), 95% CI, 0/0 cell counts | 2, all at low risk of bias | ||||
| 4.4 Bradycardia | RR (IV, Random), 95% CI, 0/0 cell counts | 2, all at low risk of bias | ||||
| 4.5 Nausea (and vomiting) | RR (MH, Random), 95% CI | 2, all at low risk of bias | ||||
| 4.8 Need for naloxone | RR (IV, Random), 95% CI, 0/0 cell counts | 2, all at low risk of bias | ||||
All RR for outcomes including 0/0 cell counts (zero/zero event trials) were calculated using TSA (constant continuity correction, 0.01). Review Manager 5 produces computational errors when both the intervention and control group have zero events. By using TSA there is no possibility to choose the MH method (only IV) which may cause small deviations within results.
Abbreviations:
[95% CI]: 95% confidence interval; IV: Inverse Variance; MD: mean difference; MH: Mantel‐Haenszel; n: number of participants; RPCA: Remifentanil PCA; RR: risk ratio; SMD: standardised mean difference
| Sensitivity analysis: Blinding (performance and detection bias) | Statistical method | All studies | 'high risk of bias'‐studies excluded | Impact on robustness (95% CI) | ||
| n | Effect estimate | n | Effect estimate | |||
| 1. Remifentanil (PCA) versus another opioid (IV/IM) | ||||||
| 1.1 Satisfaction with pain relief | SMD (IV, Random), 95% CI | 4 | 2.11 [0.72, 3.49] | 2 | 2.46 [‐0.34, 5.26] | Yes (CI includes 0) |
| 1.3 Oxygen desaturation (SpO2 < 95%) | RR (MH, Random), 95% CI | 2 | 0.48 [0.00, 47.37] | 1 | 0.05 [0.00, 0.82] | Yes (CI < 1: favours RPCA) |
| 1.4 Nausea (and vomiting) | RR (MH, Random), 95% CI | 4 | 0.54 [0.29, 0.99] | 2 | 0.36 [0.06, 2.29] | Yes (CI includes 1) |
| 1.6 Pruritus | RR (IV, Random), 95% CI, 0/0 cell counts | 2, all at low risk of bias | ||||
| 1.10 FHR/CTG abnormalities, non‐reassuring fetal status | RR (MH, Random), 95% CI | 2, all at low risk of bias | ||||
| 1.11 Pain intensity 'early' (30 min/1 h) | SMD (IV, Random), 95% CI | 3 | ‐1.58 [‐2.69, ‐0.48] | 2 | ‐1.28 [‐2.62, 0.07] | Yes (CI includes 0) |
| 1.13 Additional analgesia required (escape analgesia) | RR (MH, Random), 95% CI | 3 | 0.57 [0.40, 0.81] | 2 | 0.48 [0.25, 0.91] | No |
| 1.14 Rate of caesarean delivery | RR (MH, Random), 95% CI | 4 | 0.70 [0.34, 1.41] | 2 | 0.63 [0.30, 1.31] | No |
| 2. Remifentanil (PCA) versus another opioid (PCA) | ||||||
| 2.2 Oxygen desaturation (SpO2 < 95%) | RR (MH, Random), 95% CI | 2 | 1.28 [0.49, 3.30] | 1 | 1.64 [1.25, 2.15] | Yes (CI > 1: favours opioid) |
| 2.10 Need for naloxone | RR (IV, Random), 95% CI, 0/0 cell counts | 2 | 0.03 [0.00, 1.8E8] | 1 | 0.00 [0.00, 0.06] | Yes (CI < 1: favours RPCA) |
| 2.12 NACS at 15/30 min | MD (IV, Random), 95% CI | 2 | 1.11 [‐0.65, 2.87] | 1 | 0.20 [‐0.93, 1.33] | Yes (direction of effect changed, CI decreased) |
| 2.13 Pain intensity 'early' (30 min/1 h) | SMD (IV, Random), 95% CI | 3 | ‐0.51 [‐1.01, ‐0.00] | 2 | ‐0.73 [‐1.05, ‐0.40] | Yes (lower CI: clinically relevant moderate effect) |
| 2.15 Additional analgesia required (escape analgesia) | RR (MH, Random), 95% CI | 3 | 0.76 [0.45, 1.28] | 2 | 0.65 [0.39, 1.09] | No |
| 2.16 Rate of caesarean delivery | RR (MH, Random), 95% CI | 2, all at low risk of bias | ||||
| 3. Remifentanil (PCA) versus epidural/combined spinal‐epidural analgesia (CSE) | ||||||
| 3.1 Satisfaction with pain relief | SMD (IV, Random), 95% CI | 7 | ‐0.22 [‐0.40, ‐0.04] | 1 | 0.27 [‐0.31, 0.86] | Yes (CI includes 0) |
| 3.3 Respiratory depression (< 9, < 8 breaths/min) | RR (IV, Random), 95% CI, 0/0 cell counts | 3 | 0.91 [0.51, 1.62] | 0 | Not estimable | All studies at high risk |
| 3.4 Oxygen desaturation (SpO2 < 92%) | RR (MH, Random), 95% CI | 3 | 3.24 [1.66, 6.32] | 0 | Not estimable | All studies at high risk |
| 3.5 Oxygen desaturation (SpO2 < 95%) | RR (MH, Random), 95% CI | 3 | 3.27 [2.32, 4.61] | 1 | 11.38 [1.62, 79.78] | Yes (effect and CI increased) |
| 3.6 Hypotension | RR (IV, Random), 95% CI, 0/0 cell counts | 4 | 0.59 [0.37, 0.94] | 0 | Not estimable | All studies at high risk |
| 3.7 Bradycardia | RR (IV, Random), 95% CI, 0/0 cell counts | 2 | 1.0 [0.00, 1.0E12] | 0 | Not estimable | All studies at high risk |
| 3.8 Nausea | RR (MH, Random), 95% CI | 8 | 1.49 [1.19, 1.86] | 1 | 3.94 [0.96, 16.22] | Yes (CI includes 1) |
| 3.9 Vomiting | RR (MH, Random), 95% CI | 6 | 1.63 [1.25, 2.13] | 0 | Not estimable | All studies at high risk |
| 3.10 Pruritus | RR (MH, Random), 95% CI | 7 | 0.75 [0.48, 1.18] | 0 | Not estimable | All studies at high risk |
| 3.11 Sedation (1 h) | MD (IV, Random), 95% CI | 3 | 0.71 [0.03, 1.39] | 0 | Not estimable | All studies at high risk |
| 3.12 Apgarscore ≤ 7 (< 7) at 5 min | RR (IV, Random), 95% CI, 0/0 cell counts | 5 | 1.26 [0.62, 2.57] | 0 | Not estimable | All studies at high risk |
| 3.13 Apgarscore at 5 min | MD (IV,), 95% CI | 3 | 0.06 [‐0.27, 0.39] | 0 | Not estimable | All studies at high risk |
| 3.14 Need for naloxone | RR (IV, Random), 95% CI, 0/0 cell counts | 2 | 0.02 [0.00, 1.6E8] | 0 | Not estimable | All studies at high risk |
| 3.15 FHR/CTG abnormalities, non‐reassuring fetal status | RR (MH, Random), 95% CI | 5 | 1.55 [0.49, 4.92] | 1 | 11.38 [1.62, 79.78] | Yes (CI > 1: favours epidural) |
| 3.16 Pain intensity 'early' (1 h) | SMD (IV, Random), 95% CI | 6 | 0.57 [0.31, 0.84] | 0 | Not estimable | All studies at high risk |
| 3.18 Additional analgesia required | RR (IV, Random), 95% CI, 0/0 cell counts | 6 | 9.27 [3.73, 23.07] | 0 | Not estimable | All studies at high risk |
| 3.19 Rate of caesarean delivery | RR (MH, Random), 95% CI | 9 | 0.99 [0.81, 1.21] | 1 | 0.88 [0.06, 13.14] | Yes (CI increased) |
| 4. Remifentanil (PCA) versus remifentanil (continuous IV) | ||||||
| 4.1 Respiratory depression (< 8 breaths/min) | RR (IV, Random), 95% CI, 0/0 cell counts | 2 | 0.98 [0.00, 1.0E12] | 1 | 0.98 [0.00, ∞] | No |
| 4.3 Hypotension | RR (IV, Random), 95% CI, 0/0 cell counts | 2 | 0.98 [0.00, 1.0E12] | 1 | 0.98 [0.00, ∞] | No |
| 4.4 Bradycardia | RR (IV, Random), 95% CI, 0/0 cell counts | 2 | 0.98 [0.00, 1.0E12] | 1 | 0.98 [0.00, ∞] | No |
| 4.5 Nausea (and vomiting) | RR (MH, Random), 95% CI | 2 | 0.85 [0.28, 2.54] | 1 | 0.53 [0.21, 1.39] | No |
| 4.8 Need for naloxone | RR (IV, Random), 95% CI, 0/0 cell counts | 2 | 0.98 [0.00, 1.0E12] | 1 | 0.98 [0.00, ∞] | No |
All RR for outcomes including 0/0 cell counts (zero/zero event trials) were calculated using TSA (constant continuity correction, 0.01). Review Manager 5 produces computational errors when both the intervention and control group have zero events. By using TSA there is no possibility to choose the MH method (only IV) which may cause small deviations within results.
Abbreviations:
[95% CI]: 95% confidence interval; IV: Inverse Variance; MD: mean difference; MH: Mantel‐Haenszel; n: number of participants; RPCA: Remifentanil PCA; RR: risk ratio; SMD: standardised mean difference
| Sensitivity analysis: Attrition bias | Statistical method | All studies | 'high risk of bias'‐studies excluded | Impact on robustness (95% CI) | ||
| n | Effect estimate | n | Effect estimate | |||
| 1. Remifentanil (PCA) versus another opioid (IV/IM) | ||||||
| 1.1 Satisfaction with pain relief | SMD (IV, Random), 95% CI | 4, all at low risk of bias | ||||
| 1.3 Oxygen desaturation (SpO2 < 95%) | RR (MH, Random), 95% CI | 2 | 0.48 [0.00, 47.37] | 1 | 3.50 [0.84, 14.61] | Yes (CI + effect moved to favour of opioid) |
| 1.4 Nausea (and vomiting) | RR (MH, Random), 95% CI | 4, all at low risk of bias | ||||
| 1.6 Pruritus | RR (IV, Random), 95% CI, 0/0 cell counts | 2, all at low risk of bias | ||||
| 1.10 FHR/CTG abnormalities, non‐reassuring fetal status | RR (MH, Random), 95% CI | 2, all at low risk of bias | ||||
| 1.11 Pain intensity 'early' (30 min/1 h) | SMD (IV, Random), 95% CI | 3, all at low risk of bias | ||||
| 1.13 Additional analgesia required (escape analgesia) | RR (MH, Random), 95% CI | 3 | 0.57 [0.40, 0.81] | 2 | 0.48 [0.25, 0.91] | No |
| 1.14 Rate of caesarean delivery | RR (MH, Random), 95% CI | 4 | 0.70 [0.34, 1.41] | 3 | 0.60 [0.29, 1.24] | No |
| 2. Remifentanil (PCA) versus another opioid (PCA) | ||||||
| 2.2 Oxygen desaturation (SpO2 < 95%) | RR (MH, Random), 95% CI | 2 | 1.28 [0.49, 3.30] | 0 | Not estimable | All studies at high risk |
| 2.10 Need for naloxone | RR (IV, Random), 95% CI, 0/0 cell counts | 2 | 0.03 [0.00, 1.8E8] | 1 | 0.00 [0.00, 0.06] | Yes (CI moved to favour RPCA) |
| 2.12 NACS at 15/30 min | MD (IV, Random), 95% CI | 2 | 1.11 [‐0.65, 2.87] | 0 | Not estimable | All studies at high risk |
| 2.13 Pain intensity 'early' (30 min/1 h) | SMD (IV, Random), 95% CI | 3, all at low risk of bias | ||||
| 2.15 Additional analgesia required (escape analgesia) | RR (MH, Random), 95% CI | 3, all at low risk of bias | ||||
| 2.16 Rate of caesarean delivery | RR (MH, Random), 95% CI | 2 | 2.78 [0.99, 7.82] | 1 | 1.78 [0.20, 16.10] | Yes (CI increased) |
| 3. Remifentanil (PCA) versus epidural/combined spinal‐epidural analgesia (CSE) | ||||||
| 3.1 Satisfaction with pain relief | SMD (IV, Random), 95% CI | 7 | ‐0.22 [‐0.40, ‐0.04] | 3 | ‐0.27 [‐0.64, 0.10] | Yes (CI includes 0) |
| 3.3 Respiratory depression (< 9, < 8 breaths/min) | RR (IV, Random), 95% CI, 0/0 cell counts | 3 | 0.91 [0.51, 1.62] | 1 | 0.91 [0.39, 2.10] | No |
| 3.4 Oxygen desaturation (SpO2 < 92%) | RR (MH, Random), 95% CI | 3 | 3.24 [1.66, 6.32] | 0 | Not estimable | All studies at high risk |
| 3.5 Oxygen desaturation (SpO2 < 95%) | RR (MH, Random), 95% CI | 3 | 3.27 [2.32, 4.61] | 1 | 4.33 [1.47, 12.79] | Yes (effect and CI increased) |
| 3.6 Hypotension | RR (IV, Random), 95% CI, 0/0 cell counts | 4 | 0.59 [0.37, 0.94] | 2 | 0.01 [0.00, 7.8E7] | Yes (CI includes 1) |
| 3.7 Bradycardia | RR (IV, Random), 95% CI, 0/0 cell counts | 2 | 1.0 [0.00, 1.0E12] | 1 | 1.0 [0.00, ∞] | No |
| 3.8 Nausea | RR (MH, Random), 95% CI | 8 | 1.49 [1.19, 1.86] | 4 | 1.27 [0.82, 1.98] | Yes (CI includes 1) |
| 3.9 Vomiting | RR (MH, Random), 95% CI | 6 | 1.63 [1.25, 2.13] | 3 | 1.54 [0.75, 3.14] | Yes (CI includes 1) |
| 3.10 Pruritus | RR (MH, Random), 95% CI | 7 | 0.75 [0.48, 1.18] | 5 | 0.86 [0.48, 1.56] | No |
| 3.11 Sedation (1 h) | MD (IV, Random), 95% CI | 3, all at low risk of bias | ||||
| 3.12 Apgarscore ≤ 7 (< 7) at 5 min | RR (IV, Random), 95% CI, 0/0 cell counts | 5 | 1.26 [0.62, 2.57] | 3 | 1.26 [0.62, 2.57] | No |
| 3.13 Apgarscore at 5 min | MD (IV,), 95% CI | 3 | 0.06 [‐0.27, 0.39] | 0 | Not estimable | All studies at high risk |
| 3.14 Need for naloxone | RR (IV, Random), 95% CI, 0/0 cell counts | 2, all at low risk of bias | ||||
| 3.15 FHR/CTG abnormalities, non‐reassuring fetal status | RR (MH, Random), 95% CI | 5 | 1.55 [0.49, 4.92] | 2 | 0.87 [0.41, 1.87] | Yes (CI decreased, effect changed) |
| 3.16 Pain intensity 'early' (1 h) | SMD (IV, Random), 95% CI | 6 | 0.57 [0.31, 0.84] | 3 | 0.57 [0.25, 0.89] | No |
| 3.18 Additional analgesia required | RR (IV, Random), 95% CI, 0/0 cell counts | 6 | 9.27 [3.73, 23.03] | 5 | 5.29 [1.2, 23.3] | No |
| 3.19 Rate of caesarean delivery | RR (MH, Random), 95% CI | 9 | 0.99 [0.81, 1.21] | 6 | 1.02 [0.83, 1.25] | No |
| 4. Remifentanil (PCA) versus remifentanil (continuous IV) | ||||||
| 4.1 Respiratory depression (< 8 breaths/min) | RR (IV, Random), 95% CI, 0/0 cell counts | 2 | 0.98 [0.00, 1.0E12] | 1 | 0.98 [0.00, ∞] | No |
| 4.3 Hypotension | RR (IV, Random), 95% CI, 0/0 cell counts | 2 | 0.98 [0.00, 1.0E12] | 1 | 0.98 [0.00, ∞] | No |
| 4.4 Bradycardia | RR (IV, Random), 95% CI, 0/0 cell counts | 2 | 0.98 [0.00, 1.0E12] | 1 | 0.98 [0.00, ∞] | No |
| 4.5 Nausea (and vomiting) | RR (MH, Random), 95% CI | 2 | 0.85 [0.28, 2.54] | 1 | 1.67 [0.43, 6.52] | No |
| 4.8 Need for naloxone | RR (IV, Random), 95% CI, 0/0 cell counts | 2 | 0.98 [0.00, 1.0E12] | 1 | 0.98 [0.00, ∞] | No |
All RR for outcomes including 0/0 cell counts (zero/zero event trials) were calculated using TSA (constant continuity correction, 0.01). Review Manager 5 produces computational errors when both the intervention and control group have zero events. By using TSA there is no possibility to choose the MH method (only IV) which may cause small deviations within results.
Abbreviations:
[95% CI]: 95% confidence interval; IV: Inverse Variance; MD: mean difference; MH: Mantel‐Haenszel; n: number of participants; RPCA: Remifentanil PCA; RR: risk ratio; SMD: standardised mean difference
Assessing the quality of the body of evidence using the GRADE approach
We assessed the quality of evidence using the GRADE approach as outlined in the GRADE handbook in order to assess the quality of the body of evidence for all comparisons relating to the following outcomes.
-
Satisfaction with pain relief
-
Pain intensity at 'early' (30 minutes/one hour) time points
-
Additional analgesia required (escape analgesia)
-
Conversion to caesarean delivery
-
Adverse events for women (apnoea, respiratory depression)
-
Adverse events for infants (Apgar scores less than seven at five minutes)
We used the GRADEpro Guideline Development Tool to import data from Review Manager 5 (RevMan 2014) in order to create ’Summary of findings’ tables for all main comparisons (if at least two relevant studies were available). All GRADE‐relevant outcomes were listed in the ’Summary of findings’ tables irrespective of whether data were available or not. With the GRADE approach we appraised the quality of evidence on the basis of the extent to which one can be confident that the estimate of effect reflects the item assessed. The quality of the body of evidence reflects within‐study risk of bias (methodological quality), indirectness, heterogeneity of the data (inconsistency), imprecision of effect estimates, and risk of publication bias.
For risk of bias, we judged the quality of evidence as adequate when most information was derived from studies at low risk of bias; we downgraded the quality by one level (serious) when most information was provided by studies at high or unclear risk of bias and we downgraded the quality by two levels (very serious) when the proportion of data from studies at high risk of bias was sufficient to affect interpretation of results (impact on robustness of estimated effect and confidence interval (CI); see Table 2; Table 3; Table 4: sensitivity analyses for selection bias, blinding, attrition bias) (Guyatt 2011a).
For inconsistency, we downgraded the quality of evidence by one level when the I2 statistic was 50% or higher without satisfactory explanation by subgroup analysis (Guyatt 2011b).
We judged the quality of evidence for indirectness as adequate when the outcome data were based on direct comparisons of interest, on the population of interest, and on the outcome of interest (not surrogate markers) (Guyatt 2011c). Otherwise, we downgraded for inconsistency by one level.
If the 95% CI excluded a risk ratio (RR) of 1.0 or a standardised mean difference (SMD) of 0.0, and the total number of participants exceeded the required information size (RIS, in case of RR) or optimal information size (OIS, in case of SMD) criterion (for detailed explanation on RIS and OIS see Data synthesis), precision was judged as adequate (Guyatt 2011d); we also did not downgrade, if the 95% CI was narrow (for RR: lower CI > 0.75, upper CI < 1.25), and included a RR of 1.0 or a SMD of 0.0 (no appreciable difference between treatments), and the total number of participants exceeded the RIS or OIS criterion. We downgraded the quality of evidence for imprecision by one level when the CI around the effect size was large or overlapped an absence of effect and failed to exclude an important benefit or harm and when the number of participants was lower than the required information size (RIS or OIS) or the monitoring boundaries were not crossed (see trial sequential analysis and optimal information size calculation: Data synthesis; Table 5; Table 6; Table 7; Table 8). We downgraded by two levels for very serious imprecision due to a small number of studies (n = 1) with a small sample size (< 150 participants).
| EE [95% CI], P value, I2 (%), n | TSA_Low risk of bias‐based (all low) | |||||
| RRR (%) | CER (%) | H (%) | RIS | evidence | ||
| 1.13 Additional analgesia | 0.58 [0.42, 0.79], 0.0005, 15%, 190 | 51.21 | 58 | 25 | 156 | evidence of effect (intervention) |
| low risk of bias studies: Evron 2005 + Ng 2011 (best) | ||||||
| 1.14 Rate of caesarean delivery | 0.63 [0.30, 1.32], 0.22, 0%,215 | 37.47 | 19 | 25 | 1444 | absence of evidence |
| low risk of bias studies: Evron 2005 + Ng 2011 (best) | ||||||
| 2.15 Additional analgesia | 0.87 [0.74, 1.03], 0.11, 0%, 215 | 35.21 | 28 | 25 | 1024 | absence of evidence |
| low risk of bias studies: Douma 2010 (best) + Volikas 2001 | ||||||
| 2.16 Rate of caesarean delivery | 2.78 [0.99, 7.82], 0.05, 0%, 143 | ‐77.76 | 12.5 | 25 | 852 | absence of evidence |
| only low risk of bias study: Volikas 2001 | ||||||
| 3.3 Respiratory depression | 0.91 [0.51, 1.62], 0.75, 0%,687 | 9.09 | 58 | 25 | 4986 | absence of evidence |
| best study (high risk): Stocki‐2014 | ||||||
| 3.12 Apgarscore < 7 at 5 min | 1.26 [0.62, 2.57], 0.52, 0%, 1322 | ‐26.33 | 3 | 25 | 2.9E4 | absence of evidence |
| not best study (0/0 events), but largest (high risk): Ismail 2012 | ||||||
| 3.18 Additional analgesia | 9.27 [3.73, 23.03], < 0.0001, 0%, 1037 | ‐218.8 | 5 | 25 | 449 | evidence of effect (control) |
| Not best study (0/0 events), but second best (high risk): Stocki 2014 | ||||||
| 3.19 Rate of caesarean delivery | 1.0 [0.82, 1.22], 0.9857, 0%, 1578 | ‐12.5 | 8 | 25 | 4.4E4 | absence of evidence |
| best study (high risk): Evron 2008 clinically relevant (RRR) assumptions: RRR = ‐ 50%, CER (empirical) = 22%, H (empirical) = 0% → IS = 924 (lack of effect) | ||||||
| 4.1 Respiratory depression | 0.98 [0.06, 15.37], 0.9896, 0%, 135 | 4 | 1 | 25 | 3.4E6 | absence of evidence |
| best study (high risk): Shen 2013 | ||||||
TSA (trial sequential analysis): random‐effects modelling; IV (inverse variance); (α = 0.05, power = 90% (ß = 0.10); zero event handling = constant continuity correction, 0.01; H = 25% (mild heterogeneity); calculated with TSA software (http://www.ctu.dk/tsa/)
Abbreviations:
CER: control event rate; EE [95% CI]: estimated effect with 95% confidence interval; EER: experimental event rate; H: heterogeneity adjustment factor; n: number of participants; NA: not applicable; RIS: required information size; RRR: relative risk reduction = (EER‐CER)/CER; TSMB: trial sequential monitoring boundary
| EE [95% CI], P value, I2 (%), n | TSA_Empirical (with all studies) | |||||
| RRR (%) | CER (%) | H (%) | RIS | evidence | ||
| 1.13 Additional analgesia | 0.58 [0.42, 0.79], 0.0005, 15%, 190 | 42.39 | 62 | 21.39 | 194 | evidence of effect, TSMB, (intervention) |
| 1.14 Rate of caesarean delivery | 0.63 [0.30, 1.32], 0.22, 0%,215 | 30.4 | 15 | 0 | 2245 | absence of evidence |
| 2.15 Additional analgesia | 0.87 [0.74, 1.03], 0.11, 0%, 215 | 12.58 | 38 | 0 | 4218 | absence of evidence |
| 2.16 Rate of caesarean delivery | 2.78 [0.99, 7.82], 0.05, 0%, 143 | ‐177.7 | 6 | 0 | 372 | absence of evidence |
| 3.3 Respiratory depression | 0.91 [0.51, 1.62], 0.75, 0%,687 | 2 | 4 | 0 | 2.5E6 | absence of evidence |
| 3.12 Apgarscore < 7 at 5 min | 1.26 [0.62, 2.57], 0.52, 0%, 1322 | ‐26 | 2 | 0 | 3.4E4 | absence of evidence |
| 3.18 Additional analgesia | 9.27 [3.73, 23.03], < 0.0001, 0%, 1037 | ‐665 | 1 | 0 | 394 | evidence of effect (control) |
| 3.19 Rate of caesarean delivery | 1.0 [0.82, 1.22], 0.9857, 0%, 1578 | 1.18 | 22 | 0 | 1.1E6 | absence of evidence |
| 4.1 Respiratory depression | 0.98 [0.06, 15.37], 0.9896, 0%, 135 | 2 | 1 | 0 | 1.0E7 | absence of evidence |
TSA (trial sequential analysis): random‐effects modelling; IV (inverse variance); (α = 0.05, power = 90% (ß = 0.10); zero event handling = constant continuity correction, 0.01; H = 25% (mild heterogeneity); calculated with TSA software (http://www.ctu.dk/tsa/)
Abbreviations:
CER: control event rate; EE [95% CI]: estimated effect with 95% confidence interval; EER: experimental event rate; H: heterogeneity adjustment factor; n: number of participants; NA: not applicable; RIS: required information size; RRR: relative risk reduction = (EER‐CER)/CER; TSMB: trial sequential monitoring boundary
| EE [95% CI], P value, I2, n | OIS_minimal clinically relevant difference1 | |||||
| mean1 | mean2 | SDlargest | OIS | evidence | ||
| 1.1 Satisfaction with pain relief | 2.11 [0.72, 3.49], 0.003, 93%, 216 | 7 | 6 | 2.22 | 208 | evidence of effect (intervention) |
| best low risk of bias study: Ng 2011 | ||||||
| 1.11 Pain intensity 'early' | ‐1.58 [‐2.69, ‐0.48], 0.005, 89%, 180 | 25.6 | 35.6 | 26.6 | 298 | absence of evidence |
| best low risk of bias study: Ng 2011 | ||||||
| 2.13 Pain intensity 'early' | ‐0.51 [‐1.01, ‐0.00], 0.05, 52%, 215 | 5.282 | 6.282 | 2.414 | 246 | absence of evidence |
| best low risk of bias study: Douma 2010 | ||||||
| 3.1 Satisfaction with pain relief | ‐0.22 [‐0.40, ‐0.04], 0.02, 52%, 2135 | 8.1 | 9.1 | 1.5 | 96 | evidence of effect (control) |
| best study (high risk): Stocki 2014 | ||||||
| 3.16 Pain intensity 'early' | 0.57 [0.31, 0.84], < 0.0001, 0%, 235 | 3.3 | 2.3 | 3.3 | 458 | absence of evidence |
| best study (high risk): Stocki 2014 | ||||||
The summary statistics for the GRADE‐relevant continuous outcomes was SMD (standardised mean difference). The TSA software (version 0.9 Beta) did not support trial sequential analysis of SMD. Therefore, we conducted OIS (optimal information size) calculations (http://stat.ubc.ca/˜rollin/stats/ssize/n2.html) which corresponds to a sample size calculation for an individual trial with the following general assumptions on α = 0.05 and ß = 0.10 (power = 90%).
1The assumed minimal clinically relevant difference was 1.0 cm (10 mm) on a VAS 0 to 10 cm (0 to 100 mm) scale. The mean2 was derived from the control group (low risk of bias (best) trial).
Abbreviations:
EE [95% CI]: estimated effect with 95% confidence interval; mean1: intervention group; mean2: control group; n: number of participants; SDlargest: largest standard deviation of the pooled studies was assumed
| EE [95% CI], P value, I2, n | OIS_low risk of bias‐based (best) | |||||
| mean1 | mean2 | SDlargest | OIS | evidence | ||
| 1.1 Satisfaction with pain relief | 2.11 [0.72, 3.49], 0.003, 93%, 216 | 8 | 6 | 2.22 | 52 | evidence of effect (intervention) |
| best low risk of bias study: Ng 2011 | ||||||
| 1.11 Pain intensity 'early' | ‐1.58 [‐2.69, ‐0.48], 0.005, 89%, 180 | 22.1 | 35.6 | 26.6 | 164 | evidence of effect (intervention) |
| best low risk of bias study: Ng 2011 | ||||||
| 2.13 Pain intensity 'early' | ‐0.51 [‐1.01, ‐0.00], 0.05, 52%, 215 | 4.56 | 6.282 | 2.414 | 82 | lack of effect |
| best low risk of bias study: Douma 2010 | ||||||
| 3.1 Satisfaction with pain relief | ‐0.22 [‐0.40, ‐0.04], 0.02, 52%, 2135 | 8.6 | 9.1 | 1.5 | 380 | evidence of effect (control) |
| best study (high risk): Stocki 2014 | ||||||
| 3.16 Pain intensity 'early' | 0.57 [0.31, 0.84], < 0.0001, 0%, 235 | 4 | 2.3 | 3.3 | 160 | evidence of effect (control) |
| best study (high risk): Stocki 2014 | ||||||
The summary statistics for the GRADE‐relevant continuous outcomes was SMD (standardised mean difference). The TSA software (version 0.9 Beta) did not support trial sequential analysis of SMD. Therefore, we conducted OIS (optimal information size) calculations (http://stat.ubc.ca/˜rollin/stats/ssize/n2.html) which corresponds to a sample size calculation for an individual trial with the following general assumptions on α = 0.05 and ß = 0.10 (power = 90%).
The mean2 was derived from the control group (low risk of bias (best) trial).
Abbreviations:
EE [95% CI]: estimated effect with 95% confidence interval; mean1: intervention group; mean2: control group; n: number of participants; SDlargest: largest standard deviation of the pooled studies was assumed
For publication bias (Guyatt 2011e), we downgraded the quality of evidence by one level if the statistical test for funnel plot asymmetry suggested publication bias and the adjustment for small‐study effects as assessed by Duval and Tweedie’s trim and fill analysis changed the conclusion (see Assessment of reporting biases). We downgraded the level of evidence for publication bias by two levels, if most of the trials were small and industry‐ sponsored (Guyatt 2011e).
The GRADE assessment resulted in one of four levels of 'quality', and these expressed our confidence in the estimate of effect (Balshem 2011).
-
High quality: we are very confident that the true effect lies close to that of the estimate of the effect
-
Moderate quality: we are moderately confident in the effect estimate: the true effect is likely to be close to the estimate of the effect, but there is a possibility that it is substantially different
-
Low quality: our confidence in the effect estimate is limited: the true effect may be substantially different from the estimate of the effect
-
Very low quality: we have very little confidence in the effect estimate: the true effect is likely to be substantially different from the estimate of effect
Measures of treatment effect
Dichotomous data
For dichotomous data, we presented results as summary RR with 95% CIs which were obtained from the intervention and control event rates.
Continuous data
For continuous data the mean difference (MD) was obtained from the difference between the intervention and the control group mean values with associated standard deviations (SD) if outcomes were measured the same way in the trials. We used the SMD to combine trials that measured the same outcome, but used different methods (outcomes: satisfaction with pain relief, pain intensity). Back‐transformation of SMD values into absolute values on a scale between 0 to 10 cm (visual analogue scale (VAS)) was performed for the outcomes satisfaction and pain to facilitate clinical interpretation. Therefore, the smallest as well as the largest SD of the pooled studies were used for back‐transformation (SMD * SD) to reflect the range of possible effects.
We included data reported as median and interquartile range (IQR) with a symmetric distribution (data with asymmetric distribution were not pooled) in addition to mean values and SD in the analysis. In the case of a symmetric distribution, we obtained the mean and SD from median and IQR values in accordance with Higgins 2011. If SD was missing, we calculated the SD from the CIs for group means by using the appropriate formula (Higgins 2011).
Unit of analysis issues
Cluster‐randomised trials
We planned to include cluster‐randomised trials in the analyses along with individually‐randomised trials. However, for the present review we did not identify any relevant cluster‐randomised trials. For further updates, we plan to adjust their standard errors (SE) using the methods described in the Handbook using an estimate of the intra‐cluster correlation co‐efficient (ICC) derived from the trial (if possible), from a similar trial or from a study of a similar population. If we have to use ICCs from other sources, we plan to report this and conduct sensitivity analyses to investigate the effect of variation in the ICC. If we will identify both cluster‐randomised trials and individually‐randomised trials for future updates, we plan to synthesise the relevant information. We will consider it reasonable to combine the results from both if there is little heterogeneity between the study designs and the interaction between the effect of intervention and the choice of randomisation unit is considered to be unlikely.
We also plan to acknowledge heterogeneity in the randomisation unit and will perform a sensitivity analysis to investigate the effects of the randomisation unit.
Multi‐armed studies
We overcame a unit‐of‐analysis error for studies that contributed multiple comparisons by combining groups (by using the appropriate formula for adding SDs when required) to create a single pair‐wise comparison, if the presented data in the trials allow us to do so (Higgins 2011).
Dealing with missing data
For included studies, we noted levels of attrition. We used only published data and did not contact the trials' authors for missing outcome data (e.g. reasons for missing data). We explored the impact of including studies with high levels of missing data in the overall assessment of treatment effect by using sensitivity analysis (Table 4).
For all outcomes, we carried out analyses, as far as possible, on an intention‐to‐treat (ITT) basis, i.e. we attempted to include all participants randomised to each group in the analyses, and all participants were analysed in the group to which they were allocated, regardless of whether or not they received the allocated intervention. The denominator for each outcome in each trial was the number randomised minus any participants whose outcomes are known to be missing. Full application of the ITT principle was possible only if complete outcome data were available for all randomly assigned participants.
In the case of missing data, we used an 'available‐case analysis' by excluding all participants for whom the outcome was missing from the analysis.
Assessment of heterogeneity
We assessed clinical and methodological heterogeneity of included studies to decide if the studies were sufficiently homogeneous (eligibility criteria) to be combined. We used clinical judgement, not heterogeneity statistics, to decide whether the studies could be combined.
We assessed statistical heterogeneity in each meta‐analysis using the Tau2, I2 and Chi2 statistics. We regarded heterogeneity as substantial if an I2 was greater than 50% and either a Tau2 was greater than zero, or there was a low P value (less than 0.10) in the Chi2 test for heterogeneity.
Assessment of reporting biases
We planned to investigate reporting biases (such as publication bias) using funnel plots, if there were 10 or more studies in the meta‐analysis. However, in the present review none of the outcomes included 10 or more studies. For further updates, if the number of studies increases, we plan to assess funnel plot asymmetry visually. If asymmetry is suggested by a visual assessment, we will perform exploratory analyses (e.g. Eggers regression test for continuous data, Arcsine test for dichotomous data) to further investigate funnel plot asymmetry and to adjust for small‐study effects by use of the Duval and Tweedie’s trim and fill analysis.
Data synthesis
We carried out meta‐analysis using the Review Manager software (RevMan 2014). We used the random‐effects meta‐analysis to produce an overall summary estimate since there was sufficient clinical heterogeneity to expect that the underlying treatment effects differed between trials. The random‐effects summary was treated as the average of the range of possible treatment effects and we discussed the clinical implications of treatment effects differing between trials. We performed a fixed‐effect meta‐analysis (which assumes that the pooled studies are sufficiently similar and estimating the same underlying treatment effect) as a sensitivity analysis (Table 9).
| Sensitivity analysis: Random‐effects versus fixed‐effect model | Statistical method | Random‐effects model | Fixed‐effect model | Impact on robustness (95% CI) (fixed‐effect model) | |||
| n | Effect estimate | n | Effect estimate | ||||
| 1. Remifentanil (PCA) versus another opioid (IV/IM) | |||||||
| 1.1 Satisfaction with pain relief | SMD (IV), 95% CI | 4 | 2.11 [0.72, 3.49] | 4 | 1.85 [1.51, 2.19] | Yes (CI decreased, large effect) | |
| 1.3 Oxygen desaturation (SpO2 < 95%) | RR (MH), 95% CI | 2 | 0.48 [0.00, 47.37] | 2 | 0.66 [0.28, 1.57] | Yes (CI decreased) | |
| 1.4 Nausea (and vomiting) | RR (MH), 95% CI | 4 | 0.54 [0.29, 0.99] | 4 | 0.51 [0.28, 0.95] | No | |
| 1.6 Pruritus | RR (IV), 95% CI, 0/0 cell counts | 2 | 1.02 [0.00, 1.1E12] | 2 | 1.02 [0.00, 1.1E12] | No | |
| 1.10 FHR/CTG abnormalities, non‐reassuring fetal status | RR (MH), 95% CI | 2 | 0.30 [0.10, 0.90] | 2 | 0.30 [0.10, 0.85] | No | |
| 1.11 Pain intensity 'early' (30 min/1 h) | SMD (IV), 95% CI | 3 | ‐1.58 [‐2.69, ‐0.48] | 3 | ‐1.35 [‐1.68, ‐1.01] | Yes (CI decreased, large effect) | |
| 1.13 Additional analgesia required (escape analgesia) | RR (MH), 95% CI | 3 | 0.57 [0.40, 0.81] | 3 | 0.53 [0.39, 0.71] | No | |
| 1.14 Rate of caesarean delivery | RR (MH), 95% CI | 4 | 0.70 [0.34, 1.41] | 4 | 0.77 [0.39, 1.49] | No | |
| 2. Remifentanil (PCA) versus another opioid (PCA) | |||||||
| 2.2 Oxygen desaturation (SpO2 < 95%) | RR (MH), 95% CI | 2 | 1.28 [0.49, 3.30] | 2 | 1.39 [1.16, 1.67] | Yes (CI > 1: favours opioid) | |
| 2.10 Need for naloxone | RR (IV,), 95% CI, 0/0 cell counts | 2 | 0.03 [0.00, 1.8E8] | 2 | 0.01 [0.00, 2.4E6] | No | |
| 2.12 NACS at 15/30 min | MD (IV), 95% CI | 2 | 1.11 [‐0.65, 2.87] | 2 | 1.15 [0.38, 1.93] | Yes (CI > 0: favours RPCA) | |
| 2.13 Pain intensity 'early' (30 min/1 h) | SMD (IV), 95% CI | 3 | ‐0.51 [‐1.01, ‐0.00] | 3 | ‐0.57 [‐0.86, ‐0.29] | Yes (CI < 0: favours RPCA) | |
| 2.15 Additional analgesia required (escape analgesia) | RR (MH), 95% CI | 3 | 0.76 [0.45, 1.28] | 3 | 0.74 [0.55, 1.00] | No | |
| 2.16 Rate of caesarean delivery | RR (MH), 95% CI | 2 | 2.78 [0.99, 7.82] | 2 | 2.78 [0.99, 7.77] | No | |
| 3. Remifentanil (PCA) versus epidural/combined spinal‐epidural analgesia (CSE) | |||||||
| 3.1 Satisfaction with pain relief | SMD (IV), 95% CI | 7 | ‐0.22 [‐0.40, ‐0.04] | 7 | ‐0.29 [‐0.38, ‐0.20] | No | |
| 3.3 Respiratory depression (< 9, < 8 breaths/min) | RR (IV), 95% CI, 0/0 cell counts | 3 | 0.91 [0.51, 1.62] | 3 | 1.2 [0.67, 2.17] | No | |
| 3.4 Oxygen desaturation (SpO2 < 92%) | RR (MH), 95% CI | 3 | 3.24 [1.66, 6.32] | 3 | 3.46 [2.32, 5.16] | No | |
| 3.5 Oxygen desaturation (SpO2 < 95%) | RR (MH), 95% CI | 3 | 3.27 [2.32, 4.61] | 3 | 3.30 [2.43, 4.49] | No | |
| 3.6 Hypotension | RR (IV,), 95% CI, 0/0 cell counts | 4 | 0.59 [0.37, 0.94] | 4 | 0.57 [0.36, 0.89] | No | |
| 3.7 Bradycardia | RR (IV,), 95% CI, 0/0 cell counts | 2 | 1.0 [0.00, 1.0E12] | 2 | 1.0 [0.00, 1.0E12] | No | |
| 3.8 Nausea | RR (MH), 95% CI | 8 | 1.49 [1.19, 1.86] | 8 | 1.53 [1.22, 1.91] | No | |
| 3.9 Vomiting | RR (MH), 95% CI | 6 | 1.63 [1.25, 2.13] | 6 | 1.62 [1.24, 2.10] | No | |
| 3.10 Pruritus | RR (MH), 95% CI | 7 | 0.75 [0.48, 1.18] | 7 | 0.76 [0.54, 1.07] | No | |
| 3.11 Sedation (1 h) | MD (IV), 95% CI | 3 | 0.71 [0.03, 1.39] | 3 | 0.91 [0.57, 1.25] | No | |
| 3.12 Apgarscore ≤ 7 (< 7) at 5 min | RR (IV,), 95% CI, 0/0 cell counts | 5 | 1.26 [0.62, 2.57] | 5 | 1.22 [0.67, 2.62] | No | |
| 3.13 Apgarscore at 5 min | MD (IV,), 95% CI | 3 | 0.06 [‐0.27, 0.39] | 3 | 0.06 [‐0.27, 0.39] | No | |
| 3.14 Need for naloxone | RR (IV,), 95% CI, 0/0 cell counts | 2 | 0.02 [0.00, 1.6E8] | 2 | 0.01 [0.00, 4.6E5] | No | |
| 3.15 FHR/CTG abnormalities, non‐reassuring fetal status | RR (MH), 95% CI | 5 | 1.55 [0.49, 4.92] | 5 | 1.38 [0.84, 2.25] | No | |
| 3.16 Pain intensity 'early' (1 h) | SMD (IV), 95% CI | 6 | 0.57 [0.31, 0.84] | 6 | 0.57 [0.31, 0.84] | No | |
| 3.18 Additional analgesia required | RR (IV,), 95% CI, 0/0 cell counts | 6 | 9.27 [3.73, 23.03] | 6 | 10.86 [4.37, 26.95] | No | |
| 3.19 Rate of caesarean delivery | RR (MH), 95% CI | 9 | 0.99 [0.81, 1.21] | 9 | 0.96 [0.79, 1.18] | No | |
| 4. Remifentanil (PCA) versus remifentanil (continuous IV) | |||||||
| 4.1 Respiratory depression (< 8 breaths/min) | RR (IV,), 95% CI, 0/0 cell counts | 2 | 0.98 [0.00, 1.0E12] | 2 | 0.98 [0.00, 1.0E12]] | No | |
| 4.3 Hypotension | RR (IV,), 95% CI, 0/0 cell counts | 2 | 0.98 [0.00, 1.0E12] | 2 | 0.98 [0.00, 1.0E12] | No | |
| 4.4 Bradycardia | RR (IV,), 95% CI, 0/0 cell counts | 2 | 0.98 [0.00, 1.0E12] | 2 | 0.98 [0.00, 1.0E12] | No | |
| 4.5 Nausea (and vomiting) | RR (MH), 95% CI | 2 | 0.85 [0.28, 2.54] | 2 | 0.81 [0.38, 1.73] | No | |
| 4.8 Need for naloxone | RR (IV,), 95% CI, 0/0 cell counts | 2 | 0.98 [0.00, 1.0E12] | 2 | 0.98 [0.00, 1.0E12] | No | |
All RR for outcomes including 0/0 cell counts (zero/zero event trials) were calculated using TSA (constant continuity correction, 0.01). Review Manager 5 produces computational errors when both the intervention and control group have zero events. By using TSA there is no possibility to choose the MH method (only IV) which may cause small deviations within results.
Abbreviations:
[95% CI]: 95% confidence interval; IV: Inverse Variance; MD: mean difference; MH: Mantel‐Haenszel; n: number of participants; RPCA: Remifentanil PCA; RR: risk ratio; SMD: standardised mean difference
For random‐effects analyses, the results were presented as the average treatment effect with 95% CIs, and the estimates of Tau2 and I2.
Meta‐analysis of adverse events frequently requires a synthesis of data with sparse event rates. Combining such data can be challenging especially when zero events exist in one or both arms of the study, which may lead to computational problems. Review Manager 5 (RevMan 2014) automatically checks for studies with problematic zero counts in one arm, and adds a constant value (0.5) to all cells of study results tables where the problems occur (constant continuity correction (ccc) 1.0) (Higgins 2011). However, Review Manager 5 (RevMan 2014) does not include options for analyses when included studies have zero counts in both arms. Removing these studies from the meta‐analysis creates the risk of inflating the magnitude of the pooled effect. Thus, we performed a sensitivity analysis (Table 10) applying three different approaches to implement continuity correction factors of 1.0 and 0.01 (constant, reciprocal, and empirical continuity correction) in a meta‐analysis model including studies with zero events in both arms as proposed by Sweeting and colleagues (Sweeting 2004). Briefly, the reciprocal approach adds a continuity correction factor proportional to the reciprocal of the size of the opposite treatment arm, which was found preferable when arm sizes were not balanced; with the empirical approach a continuity correction factor is calculated which 'pulls' the estimate in the direction of the pooled effect size estimate obtained in the analysis (Sweeting 2004). We used the TSA software which allows inclusion of zero/zero event trials with all three approaches for meta‐analysis with two or more trials. If there were no differences between the results of the different approaches, we reported in the Effects of interventions section only the pooled effect estimates calculated by the constant continuity correction (0.01) approach for zero event handling in both arms as single sensitivity analysis.
| Data | 0‐ and 0/0‐event trials included (TSA) | 0‐event trials included and 0/0‐event trials excluded (RevMan)1 | |||||||
| Outcome (n, studies) | 0‐events, 0/0‐events, imbalance (Yes/No) | Summary statistic | Reciprocal (1.0) | Reciprocal (0.01) | Empirical (1.0) | Empirical (0.01) | Constant (1.0) | Constant (0.01) | Constant (1.0) |
| 1.3 Oxygen desaturation (2) | 1, 0 (Yes) | RR [95% CI], P value, I2 | 0.51 [0.01, 30.22], 0.7471, 86% | 3.41 [0.82, 14.22] 0.0918, 0% | 0.57 [0.01, 24.87] 0.7699, 87% | 3.39 [0.81, 14.10], 0.0938, 0% | 0.5 [0.01, 31.95], 0.7421, 86% | 3.42 [0.82, 14.25], 0.0914, 0% | 0.5 [0.01, 31.95], 0.7421, 86% |
| 1.4 Nausea (and vomiting) (4) | 1, 0 (No) | RR [95% CI], P value, I2 | 0.54 [0.29, 0.99], 0.0460, 0% | 0.56 [0.30, 1.04], 0.0665, 0% | 0.54 [0.29, 0.99], 0.0463, 0% | 0.56 [0.30, 1.04], 0.0667, 0% | 0.54 [0.29, 0.99], 0.0461, 0% | 0.56 [0.30, 1.04], 0.0664, 0% | 0.54 [0.29, 0.99], 0.0461, 0% |
| 1.6 Pruritus (2) | 0, 2 (No) | RR [95% CI], P value, I2 | 1.0 [0.06, 15.71], 1.0, 0% | 1.0 [0.00, 1.0E12], 1.0, 0% | NA | NA | 1.02 [0.07, 16.06], 0.9874, 0% | 1.02 [0.00, 1.1E12], 0.9987, 0% | NA |
| 1.14 Rate of caesarean delivery (4) | 2, 0 (No) | RR [95% CI], P value, I2 | 0.69 [0.34, 1,40], 0.3084, 0% | 0.63 [0.30, 1.32], 0.2164, 0% | 0.7 [0.34, 1.43], 0.3268, 1% | 0.63 [0.30, 1.32], 0.2182, 0% | 0.70 [0.35, 1.40], 0.3103, 0% | 0.63 [0.30, 1.32], 0.2165, 0% | 0.70 [0.35, 1.40], 0.3103, 0% |
| 2.10 Need for naloxone (2) | 1, 1 (No) | RR [95% CI], P value, I2 | 0.49 [0.05, 5.29], 0.5580, 0%, | 0.03 [0.00, 1.1E8], 0.7484, 0% | NA | NA | 0.48 [0.04, 5.30], 0.5473, 0% | 0.03 [0.00, 1.8E8], 0.7549, 0% | 0.3 [0.03, 2.72], 0.2847, 0% |
| 3.3 Respiratory depression (3) | 1, 1 (Yes) | RR [95% CI], P value, I2 | 0.97 [0.56, 1.70] 0.9206, 0% | 0.91 [0.51, 1.62] 0.7506, 0% | 0.98 [0.57, 1.71] 0.9550, 0% | 0.91 [0.51, 1.62] 0.7532, 0% | 0.98 [0.56, 1.71] 0.9424, 0% | 0.91 [0.51, 1.62] 0.7518, 0% | 1.35 [0.30, 6.18], 0.6967, 37% |
| 3.4 Oxygen desaturation (3) | 1, 0 (Yes) | RR [95% CI], P value, I2 | 3.2 [1.72, 5.94], 0.0002, 46% | 2.88 [1.94, 4.27], < 0.0001, 0% | 3.04 [1.70, 5.43], 0.0002, 38% | 2.88 [1.94, 4.27], < 0.0001, 0% | 3.19 [1.72, 5.91], 0.0002, 46% | 2.88 [1.94, 4.27], < 0.0001, 0% | 3.19 [1.72, 5.91], 0.0002, 46% |
| 3.6 Hypotension (4) | 2, 1 (No) | RR [95% CI], P value, I2 | 0.59 [0.38, 0.93], 0.0225, 0% | 0.59 [0.37, 0.94], 0.0271, 0% | 0.59 [0.38, 0.93], 0.0219, 0% | 0.59 [0.38, 0.94], 0.0273, 0% | 0.59 [0.38, 0.93], 0.0225, 0% | 0.59 [0.37, 0.94], 0.0271, 0% | 0.58 [0.23, 1.48], 0.2517, 16% |
| 3.7 Bradycardia (2) | 0, 2 (No) | RR [95% CI], P value, I2 | 1.0 [0.07, 15.07], 1.0, 0% | 1.0 [0.00, 1.0E12], 1.0, 0% | NA | NA | 1.0 [0.07, 15.07], 1.0, 0% | 1.0 [0.00, 1.0E12], 1.0, 0% | NA |
| 3.10 Pruritus (7) | 1, 0 (Yes) | RR [95% CI], P value, I2 | 0.75 [0.48, 1.18], 0.2182, 29% | 0.78 [0.51, 1.18], 0.2366, 21% | 0.75 [0.48, 1.18], 0.2170, 29% | 0.78 [0.51, 1.18], 0.2368, 21% | 0.75 [0.48, 1.18], 0.2154, 29% | 0.78 [0.51, 1.18], 0.2370, 21% | 0.75 [0.48, 1.18], 0.2154, 29% |
| 3.12 Apgarscore < 7 at 5 min (5) | 2, 2 (No) | RR [95% CI], P value, I2 | 1.26 [0.65, 2.43], 0.4944, 0% | 1.26 [0.62, 2.57], 0.5193, 0% | 1.28 [0.66, 2.47], 0.4596, 0% | 1.26 [0.62, 2.57], 0.5209, 0% | 1.26 [0.65, 2.43], 0.4904, 0% | 1.26 [0.62, 2.57], 0.5197, 0% | 1.28 [0.65, 2.51], 0.4801, 0% |
| 3.14 Need for naloxone (2) | 1, 1 (Yes) | RR [95% CI], P value, I2 | 0.34 [0.03, 3.82], 0.3846, 0% | 0.02 [0.00, 1.6E8], 0.7247, 0% | NA | NA | 0.46 [0.04, 4.88], 0.5200, 0% | 0.02 [0.00, 1.6E8], 0.7447, 0% | 0.2 [0.03, 1.15], 0.0720, 0% |
| 3.15 FHR/CTG abnormalities (5) | 1, 0 (No) | RR [95% CI], P value, I2 | 1.54 [0.50, 4.75], 0.4499, 46% | 1.88 [0.63, 5.61], 0.2578, 35% | 1.53 [0.52, 4.54], 0.4410, 44% | 1.88 [0.63, 5.64], 0.2600, 35% | 1.54 [0.50, 4.75], 0.4499, 46% | 1.88 [0.63, 5.61], 0.2578, 35% | 1.54 [0.50, 4.75], 0.4499, 46% |
| 3.18 Additional analgesia required (6) | 2, 1 (No) | RR [95% CI], P value, I2 | 7.47 [3.28, 16.99] < 0.0001, 0% | 9.26 [3.73, 23.03] < 0.0001, 0% | 9.66 [3.97, 23.52] < 0.0001, 0% | 9.23 [3.71, 22.95] < 0.0001, 0% | 7.65 [3.37, 17.38] < 0.0001, 0% | 9.27 [3.73, 23.03] < 0.0001, 0% | 8.1 [3.5, 18.75], < 0.0001, 0% |
| 3.19 Rate of caesarean delivery (9) | 1, 0 (No) | RR [95% CI], P value, I2 | 0.99 [0.81, 1.21], 0.9076, 0% | 1.0 [0.82, 1.22], 0.9858, 0% | 0.99 [0.81, 1.21], 0.9058, 0% | 1.0 [0.82, 1.22], 0.9857, 0% | 0.99 [0.81, 1.21], 0.9067, 0% | 1.0 [0.82, 1.22], 0.9857, 0% | 0.99 [0.81, 1.21], 0.9067, 0% |
| 3.20 Rate of assisted birth (8) | 1, 0 (No) | RR [95% CI], P value, I2 | 0.92 [0.66, 1.26], 0.5914, 0% | 0.94 [0.68, 1.30], 0.6917, 0% | 0.92 [0.66, 1.26], 0.5926, 0% | 0.94 [0.68, 1.30], 0.6918, 0% | 0.92 [0.66, 1.26], 0.5914, 0% | 0.94 [0.68, 1.30], 0.6917, 0% | 0.92 [0.66, 1.26], 0.5914, 0% |
| 3.26 Neonatal resuscitation (2) | 2, 0 (No) | RR [95% CI], P value, I2 | 1.01 [0.04, 24.25], 0.9933, 57% | 1.09 [0.00, 3.1E8], 0.9929, 0% | NA | NA | 1.02 [0.04, 25.09], 0.9901, 57% | 1.03 [0.00, 3.4E8], 0.9980, 0% | 1.02 [0.04, 25.09], 0.9901, 57% |
| 4.1 Respiratory depression (2) | 0, 2 (No) | RR [95% CI], P value, I2 | 1.0 [0.06, 15.66], 1.0, 0% | 1.0 [0.00, 1.0E12], 1.0, 0% | NA | NA | 0.98 [0.06, 15.37], 0.9896, 0% | 0.98 [0.00, 1.0E12], 0.9989, 0% | NA |
| 4.3 Hypotension (2) | 0, 2 (No) | RR [95% CI], P value, I2 | 1.0 [0.06, 15.66], 1.0, 0% | 1.0 [0.00, 1.0E12], 1.0, 0% | NA | NA | 0.98 [0.06, 15.37], 0.9896, 0% | 0.98 [0.00, 1.0E12], 0.9989, 0% | NA |
| 4.4 Bradycardia (2) | 0, 2 (No) | RR [95% CI], P value, I2 | 1.0 [0.06, 15.66], 1.0, 0% | 1.0 [0.00, 1.0E12], 1.0, 0% | NA | NA | 0.98 [0.06, 15.37], 0.9896, 0% | 0.98 [0.00, 1.0E12], 0.9989, 0% | NA |
| 4.8 Need for naloxone (2) | 0, 2 (No) | RR [95% CI], P value, I2 | 1.0 [0.06, 15.66], 1.0, 0% | 1.0 [0.00, 1.0E12], 1.0, 0% | NA | NA | 0.98 [0.06, 15.37], 0.9896, 0% | 0.98 [0.00, 1.0E12], 0.9989, 0% | NA |
1Review Manager 5 ignores zero/zero events trials and uses a constant continuity correction of 0.5 for studies with zero events in 1 arm. For the reciprocal, the empirical, and the constant approach including zero/zero‐event trials we used the TSA software. By using TSA there is no possibility to choose the Mantel‐Haenszel method (only inverse variance possible) which may cause small deviations within results.
We performed sensitivity analyses by using different approaches for handling of zero event trials (reciprocal, empirical, and constant approach) in meta‐analysis with two or more studies.
A) reciprocal approach ; value (k): 1.0, 0.01
Adds a factor of the reciprocal of the size of the opposite treatment arm to the cells which accounts for imbalance in group sizes.
B) empirical approach ; value (k): 1.0, 0.01
All studies without zero events are used to calculate a pooled effect estimate. Using this effect estimate a continuity correction factor can be calculated which produces an estimated effect close to the pooled estimated effect in the studies with zero events in both arms.
C) constant approach ; value (k): 1.0, 0.01
A value of 0.5 or 0.005, respectively, is added to each group in a 2 x 2 table; thus 1 participant is added to each intervention arm.
Abbreviations:
NA: not applicable; RR: risk ratio
Meta‐analyses are at risk of producing type I errors ('false positive') and type II errors ('false negative') as a result of sparse data and repetitive significance testing following updates with new trials (Brok 2008; Thorlund 2009; Wetterslev 2008; Wetterslev 2009). Trial sequential analysis (TSA) is a statistical approach that adjusts for random‐error risk (Wetterslev 2008). TSA reveals us the required number of participants (required information size (RIS)) needed in a meta‐analysis to detect or reject a certain intervention effect, and displays the trial sequential monitoring boundaries (TSMB), which allows testing for statistical significance before the RIS has been reached. The TSMB adjust the P value that is required for obtaining statistical significance according to the number of participants and events in a meta‐analysis (the fewer participants and events, the more restrictive the TSMB are and a lower P value is required to obtain statistical significance) (Brok 2008). In a post‐hoc sensitivity analysis, we applied TSA and calculated the RIS and the TSMB for each GRADE‐relevant dichotomous outcome on the basis of a risk for a type I error of 5%, a type II error of 10% (90% power), and a relative risk reduction (RRR) and control event rate based either on the representative estimate of all 'low risk of bias' trials (TSA 'low risk of bias'‐based; Table 5), or on the empirical estimate of the meta‐analysis (TSA 'empirical'; Table 6); we further adjusted for heterogeneity by using the heterogeneity‐adjustment factor (H; Thorlund 2011) assuming mild heterogeneity (H = 25%) for TSA 'low risk of bias'‐based and a model variance‐based correction for TSA 'empirical'. TSA cannot adjust for risk of bias, therefore, generally speaking such analyses should be restricted only to low risk of bias trials. However, due to limitations in the number and quality of studies, we performed TSA on all trials (low and high risk of bias trials). TSA was performed by using TSA software.
For GRADE‐relevant continuous outcomes we calculated the optimal information size (OIS) by a traditional sample size calculation used for individual trials (http://stat.ubc.ca/˜rollin/stats/ssize/n2.html), because the TSA software does not support meta‐analyses using SMDs as summary statistics. In a post‐hoc sensitivity analysis, we calculated the OIS based on a risk for a type I error of 5%, a type II error of 10% (90% power), and a mean difference based either on the minimal clinically relevant difference (1 cm on VAS 0 to 10 cm scale for satisfaction and pain) (Table 7) or on data of the 'low risk of bias' (or best) trial (Table 8). We performed OIS calculations on all trials (low and high risk of bias trials). OIS calculations do not adjust for heterogeneity. In general, OIS considerations are less conservative than the TSA approach. We used both calculations the 'OIS_minimally clinically relevant difference' and the 'OIS_low risk of bias (or best) trial' as sensitivity analyses and used the more conservative result for judgment on imprecision (GRADE).
Both RIS/TSMB and OIS provide us relevant information to estimate the level of evidence reached for the experimental intervention.
Subgroup analysis and investigation of heterogeneity
In the event of substantial heterogeneity (I2 > 50%), we planned to investigate heterogeneity using subgroup analyses and sensitivity analyses based on the comparators described above (Types of interventions). For the present review, none of the planned subgroup analyses were carried out because of sparse data. If sufficient data in future updates are present, we plan to perform subgroup analyses and compare subgroups by a mixed‐effects meta‐regression. We plan to use the R packages Metafor 2015 for meta‐regression and mixed‐effects model analysis.
We will carry out the following subgroup analyses.
-
Different methods and doses of remifentanil patient‐controlled analgesia (bolus versus only continuous infusion, regimen with a fixed dose versus dose‐escalating regimen, etc.).
-
Different parenteral opioids (e.g. pethidine (meperidine) versus fentanyl).
Planned subgroup analysis will be restricted in future updates to the review's primary and GRADE‐relevant outcomes.
We plan to assess subgroup differences by interaction tests available within Review Manager 5 (RevMan 2014), and will report the results of subgroup analyses quoting the χ2 statistic and P value, and the interaction test I2 value.
Sensitivity analysis
We performed sensitivity analyses to assess the robustness of the pooled estimates focusing on the following issues.
-
Risk of bias: we explored the impact of studies with high risk of selection bias (Table 2), performance and detection bias (Table 3), attrition bias (Table 4) on the robustness of the estimated effect
-
TSA/OIS: information size considerations based on 'low risk of bias'‐based and empirical assumptions for all GRADE‐relevant outcomes (Table 5; Table 6; Table 7; Table 8)
-
Random‐effects model versus fixed‐effect model (Table 9)
-
Zero event handling: different approaches to implement continuity correction factors of 1.0 and 0.01 (constant, reciprocal, and empirical continuity correction) (Table 10)
-
Statistical heterogeneity (I2 > 50%): we explored the effect of exclusion of individual studies from the analysis on the I2 value
For future updates if cluster‐randomised trials are included, we plan to conduct a sensitivity analysis (see Unit of analysis issues) to investigate the robustness of the results.
All sensitivity analyses were restricted to the primary and/or the GRADE‐relevant outcomes with two or more studies. Results of sensitivity analyses were reported in the Effects of interventions section when relevant differences affecting robustness of the estimated effects were recognised.
Results
Description of studies
Results of the search
The results of our search are displayed in a PRISMA flow chart (Figure 1). The search was performed in November and December 2015 (see Methods).
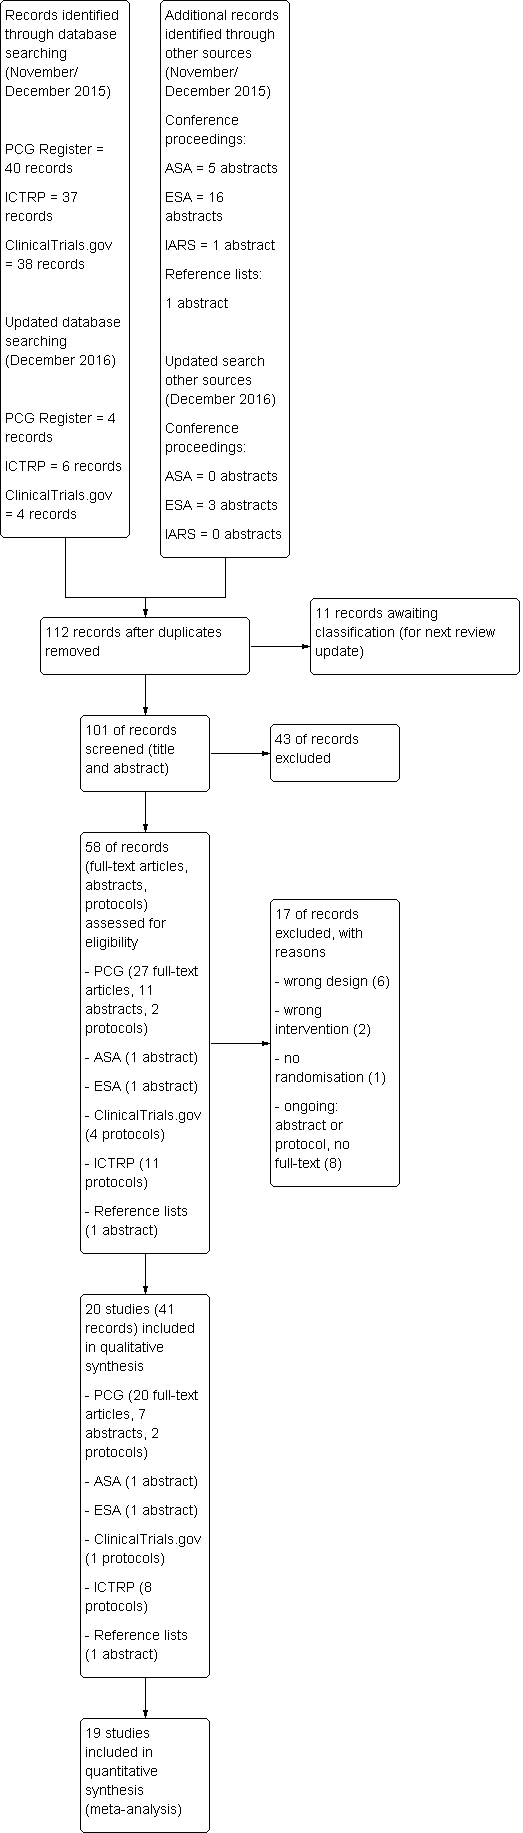
Study flow diagram.
We identified 115 records through database searching and another 23 by handsearching ASA, ESA and IARS congress abstracts as well as the reference lists of included articles. One‐hundred and one records remained after duplicates had been removed. These were screened independently by two review authors (SW, YJ) regarding title and abstract. Fifty‐eight remaining records were assessed for eligibility by reviewing the full texts and protocols. Seventeen records did not fulfil the eligibility criteria and had to be excluded. Finally, 41 records (full‐text articles, abstracts, and protocols) which could be allocated to 20 studies were included in the qualitative synthesis, and 19 of these studies were used to perform the meta‐analyses.
One trial was published in Spanish (Calderon 2006), all other studies were written in English. We did not include any abstracts or protocols without full texts in our final analysis since we could not retrieve enough information from these studies for eligibility assessment despite contacting the respective authors.
An updated search in December 2016 retrieved a further four trial reports from Cochrane Pregnancy and Childbirth's Trials Register and 13 reports (including duplicates) in ASA, ESA, IARS congress abstracts, ClinicalTrials.gov and the WHO International Clinical Trials Registry Platform (ICTRP). Eleven unique reports will be analysed for eligibility in the next review update (Abdalla 2015; Godinho 2016; Gunes 2014; Karadjova 2016; Kondoh 2016; Leong 2015; Logtenberg 2016; Moreira 2016; Pinar 2016; Pintaric 2016; Weiniger 2016).
Included studies
Trial characteristics
All included studies were published between 2001 (Volikas 2001) and 2015 (Douma 2015) and were randomised, controlled trials that reported on women in labour scheduled for vaginal delivery and requesting analgesia. In the present version of the review neither cluster‐randomised trials nor trials published in abstract form only were included. A detailed description of all included studies is presented in the Characteristics of included studies table.
Eleven trials were conducted in Europe (Blair 2005; Calderon 2006; Douma 2010; Douma 2011; Douma 2015; Freeman 2015; Stourac 2014; Thurlow 2002; Tveit 2012; Volikas 2001; Volmanen 2008), six in the Middle East (El‐Kerdawy 2010; Evron 2005; Evron 2008; Ismail 2012; Khooshideh 2015; Stocki 2014), two in Asia (Ng 2011; Shen 2013) and one in North America (Balki 2007).
A total of 3713 participants was randomised in the included studies with 3569 being analysed. Of these participants, 1523 received remifentanil patient‐controlled analgesia (PCA) and 2046 were assigned to a control intervention. The exact time point of randomisation remained unclear in some cases (Balki 2007; Blair 2005; Calderon 2006; Douma 2010; Douma 2011; El‐Kerdawy 2010; Thurlow 2002). In one trial, it is reported that randomisation took place before the start of actual labour and thus before analgesia request (Freeman 2015). In all other studies participants were assigned to the remifentanil PCA group or the control intervention as soon as labour had started and the request for analgesia was made (Douma 2015; Evron 2005; Evron 2008; Ismail 2012; Khooshideh 2015; Ng 2011; Shen 2013; Stocki 2014; Stourac 2014; Tveit 2012; Volikas 2001; Volmanen 2008).
The largest randomised sample size was 1414 (Freeman 2015) with 38% of the total number of women. Regarding this study, it has to be pointed out that this huge sample size also included women who did not receive any labour analgesia but were analysed for several important outcomes. We just considered participants with request for analgesic agents.
The smallest sample size was 17 (Volikas 2001). With the exception of three trials (Evron 2008; Freeman 2015; Ismail 2012), all studies had small sample sizes with fewer than 200 participants.
All trials except one (women with pre‐eclampsia, El‐Kerdawy 2010) excluded women and pregnancies with high risk (e.g. obesity, pre‐eclampsia, substance abuse, insulin‐dependent diabetes). Freeman 2015 and El‐Kerdawy 2010 included women from 32 weeks of gestation; in all other trials women had a term pregnancy.
All studies reported at least one outcome of interest. We could not identify any studies reporting on 'postpartum haemorrhage', 'depressed baby', 'satisfaction with childbirth experience', 'sense of control in labour', 'effect on mother/baby interaction', 'long‐term childhood development', and 'costs'.
None of the trials was funded by industry.
Comparisons and interventions
We had planned to analyse seven different comparators against remifentanil (PCA). For two of them, namely nitrous oxide (or other forms of inhalational analgesia, comparison 6) and placebo (or no treatment, comparison 7), no eligible studies could be retrieved.
Four studies investigated remifentanil (PCA) versus another opioid (IV/IM) (comparison 1, Calderon 2006; Evron 2005; Ng 2011; Thurlow 2002); three studies dealt with remifentanil (PCA) versus another opioid (PCA) (comparison 2, Blair 2005; Douma 2010; Volikas 2001); 10 studies compared remifentanil (PCA) with epidural analgesia/combined spinal‐epidural analgesia (CSE) (comparison 3, Douma 2011; Douma 2015; Evron 2008; El‐Kerdawy 2010; Freeman 2015; Ismail 2012; Stocki 2014; Stourac 2014; Tveit 2012; Volmanen 2008); two studies made a comparison between remifentanil (PCA) and remifentanil (continuous IV) (comparison 4, Khooshideh 2015; Shen 2013); and one study analysed remifentanil versus remifentanil using the same mode (PCA), but different regimen (variable bolus doses with fixed infusion dose versus variable infusion dose with fixed bolus doses) (comparison 5,Balki 2007).
With regard to comparison 1, three studies used pethidine/meperidine IM as a control intervention (Calderon 2006; Thurlow 2002; Ng 2011) and one study compared remifentanil (PCA) with meperidine infusion IV (Evron 2005). No study investigated a subcutaneous administration of other opioids as a comparator.
Looking at comparison 2, the control intervention was pethidine (PCA) for two trials (Blair 2005; Volikas 2001) whereas one trial compared remifentanil (PCA) both with meperidine (PCA) and fentanyl (PCA) (Douma 2010).
All trials in comparison 3 chose epidural analgesia in any way as the control intervention. In seven studies epidural analgesia with different combinations of opioids was offered to the participants (Douma 2011 (ropivacaine/sufentanil); Douma 2015 (ropivacaine/sufentanil); El‐Kerdawy 2010 (bupivacaine/fentanyl); Freeman 2015 (ropivacaine/sufentanil, bupivacaine/sufentanil, levobupivacaine/sufentanil, bupivacaine/fentanyl); Stourac 2014 (bupivacaine/sufentanil); Tveit 2012 (ropivacaine/fentanyl); Volmanen 2008 (levobupivacaine/fentanyl)). One study added combined spinal‐epidural as a second control intervention (Ismail 2012 (both levobupivacaine/fentanyl)). The two remaining studies compared remifentanil (PCA) with patient‐controlled epidural analgesia (PCEA) (Stocki 2014 (bupivacaine/fentanyl)) or different combinations of remifentanil (PCA) and PCEA (Evron 2008:(1) PCEA ropivacaine, (2) PCEA ropivacaine plus remifentanil (PCA), (3) PCEA ropivacaine plus acetaminophen IV)).
The investigated interventions ranged from 35 minutes (Blair 2005) to 594 minutes (Volikas 2001). The lockout times of remifentanil (PCA) used in the included trials ranged from one minute (Ismail 2012; Stocki 2014; Volmanen 2008) to 30 minutes (Calderon 2006) with bolus doses ranging from 0.1 µg/kg (Shen 2013) to 0.5 µg/kg (Volikas 2001) or from 5 µg (Thurlow 2002) to 50 µg (Calderon 2006). Supplementary remifentanil background infusion was used in four studies (Balki 2007; Calderon 2006; El‐Kerdawy 2010; Evron 2008). A detailed description is provided in Table 11.
| Study | Comparator | Analgesia duration (mean ± SD, median (range)) [min] | Background infusion [µg/(kg*min)] | Bolus dose | Bolus application speed (calculated) | Bolus dose escalation on request | Lockout time [min] | Maximum dose | Total dose administered (mean ± SD, median (range [IQR]) |
| Remifentanil variable infusion, fixed bolus | 463 | 0.025 | 0.25 µg/kg | NA | 0.5 ‐ 1 µg/kg, every 15 min | 2 | 3000 µg in 4 h | 474 (188 ‐ 925) µg/h | |
| Pethidine PCA | 147.5 ± 79 | no | 40 µg | 133.33 µg/min | no | 2 | NA | NA | |
| Meperidine IM | 280 ± 55 | 0.025 | 50 µg | 2 µg/min | no | 30 | NA | NA | |
| (1) Meperidine PCA (2) Fentanyl PCA | 234 ± 136 | no | 40 µg | NA | no | 2 | 1200 µg/h | 1840 ± 1090 µg | |
| epidural | 286 ± 145 | no | 40µg | 66.67 µg/min | no | 2 | 1200 µg/h | 2817 ± 1564 µg | |
| epidural | 192 ± 116 | no | 40µg | 66.67 µg/min | no | 2 | 1200 µg/h | 1417 µg | |
| epidural | NA | 0.0 | 0.25 µg/kg | 1.5 µg/(kg*min) | no | 5 | 3000 µg in 4 h | NA | |
| Meperidine IV | NA | no | 20 µg | NA | 5 µg increments, every 15 ‐ 20 min | 3 | 1500 µg/h | 1034.5 (133 ‐ 4021) µg | |
| epidural | NA | 0.025 | 20 µg | NA | 25% increase every 15 ‐ 20 min | 3 | NA | 8.5 ± 2.2 µg/(kg*h) | |
| epidural | 236 (128 ‐ 376) | no | 30 µg | NA | increase to 40 µg or decrease to 20 µg | 3 | 40 µg per bolus | NA | |
| epidural/CSE | NA | no | 25 µg | 25 µg/min | escalation scheme (0.1 – 0.2 – 0.3 – 0.5 – 0.7 – 0.9 µg/kg) until the maximum dose of 0.9 µg/kg | 1 | 25 µg/mL + 0.9 µg/kg per bolus | NA | |
| Remifentanil IV | NA | no | 0.25 µg/kg | NA | increased to 0.4 µg/kg (if VNRS ≥ 7) | 4 | 0.4 µg/kg per bolus | 942.6 ± 86.4 µg | |
| Pethidine IM | NA | no | 25 µg (< 60 kg) or 30 µg (≥ 60 kg) | 6.67 µg/min | no | 3.75‐4.50 | 500 µg/h (calculated) | NA | |
| Remifentanil IV | 1511 | no | 0.1 µg/kg | 0.2 µg/(kg*min) | increments of 0.1 µg/kg to 0.4 µg/kg | 2 | 0.4 µg/kg per bolus | 1340 (1220 ‐ 1480 [890 ‐ 1680]) µg | |
| epidural | NA | no | 20 µg | NA | up to 60 µg | 2 min, 1 min on request | 60 µg per bolus | 1725 ± 1392 µg | |
| epidural | 162.75 ± 77.15 | no | 20 µg | NA | 10 µg increments (if VAS decrease < 2) | 3 | NA | NA | |
| Meperidine IM | NA | no | 20 µg | 60 µg/min | NA | 3 | NA | NA | |
| epidural | 225 ± 117.2 | no | 0.15 µg/kg | 100 µg/min | 0.15 µg/kg increments every 15 min | 2 | No limit | NA | |
| Pethidine PCA | 334 ± 260 | no | 0.5 µg/kg | NA | no | 2 | No limit | 3670 (120 ‐ 4880) µg (mean (range)) | |
| epidural | Max. 60 | no | 25 µg | 25 µg/min | escalation scheme (0.1 – 0.2 – 0.33 – 0.5 – 0.7 – 0.9 µg/kg) until the maximum dose of 0.9 µg/kg | 1 | 25 µg/mL + 0.9 µg/kg per bolus | 0.14 (0.08 ‐ 0.18 [0.03 ‐ 0.32]) µg/(kg*min) |
1Time from the start of remifentanil analgesia until the final dose increment, 50% survival (Kaplan‐Meier cumulative event curve)
Abbreviations:
NA: not applicable
Co‐interventions/Co‐analgesics
In four studies additional Entonox was offered to all women in labour (Blair 2005; Ng 2011; Thurlow 2002; Volikas 2001); in one study pethidine IM was provided on top of that (Ng 2011). Epidural analgesia was used as rescue analgesia in six trials (Balki 2007; Douma 2010; Evron 2005; Thurlow 2002; Shen 2013; Volikas 2001). One trial offered unknown additional analgesia after one hour (Stocki 2014).
Excluded studies
Nine studies were excluded from qualitative analysis (Figure 1). Six of them were cross‐over trials (Jost 2013; Varposhti 2013; Volmanen 2004; Volmanen 2005; Volmanen 2009; Volmanen 2011), one study did not randomise the participants (Solek‐Pastuszka 2009), one study dealt with an intervention that was not of interest for this review (Balcioglu 2007), and one did not provide PCA (Shahriari 2007) (see Characteristics of excluded studies).
Ongoing studies
Eight trials were classified as ongoing and were therefore not included in our current review (Ongoing studies). We plan to use these data for further updates. More information is provided in Characteristics of ongoing studies.
Studies awaiting classification
There are 11 studies awaiting classification identified in our updated search from December 2016 (Abdalla 2015; Godinho 2016; Gunes 2014; Karadjova 2016; Kondoh 2016; Leong 2015; Logtenberg 2016; Moreira 2016; Pinar 2016; Pintaric 2016; Weiniger 2016). See:Characteristics of studies awaiting classification). These studies are not included in the current review.
Risk of bias in included studies
The risk of bias in each included study was rated as presented in Figure 2 and described in the Characteristics of included studies.
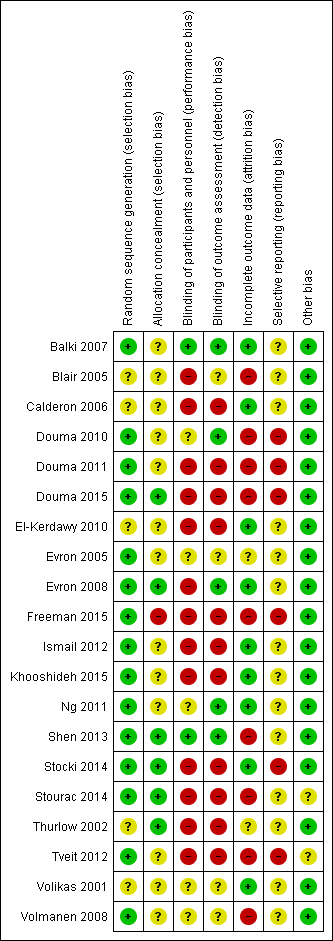
'Risk of bias' summary: review authors' judgements about each risk of bias item for each included study.
With regard to Figure 3, the categories 'random sequence generation' and 'other bias' showed low risk of bias across all included studies in 75% and 90% of cases, respectively. Selective reporting and allocation concealment remained at unclear risk of bias in most cases. In terms of blinding the majority of studies (65%) revealed high risk of bias. In the domain 'attrition bias' 45% of all studies were classified as low or high risk of bias, respectively.

'Risk of bias' graph: review authors' judgements about each risk of bias item presented as percentages across all included studies.
Allocation
Random sequence generation
In 15 studies randomisation was achieved by computer‐generated codes (Balki 2007; Douma 2010; Douma 2011; Douma 2015; Evron 2005; Evron 2008; Freeman 2015; Ismail 2012; Khooshideh 2015; Ng 2011; Shen 2013; Tveit 2012; Volmanen 2008), shuffling cards (Stocki 2014), or throwing dice (Stourac 2014). They were therefore estimated to have low risk of bias.
In five trials it was not sufficiently described which randomisation method was used (Blair 2005; Calderon 2006; El‐Kerdawy 2010; Thurlow 2002), or if the method worked appropriately (Volikas 2001), thus we considered them as having an unclear risk of bias.
No study had high risk of bias regarding random sequence generation.
Allocation concealment
Six studies were judged to have a low risk of bias since allocation concealment was achieved either by using sequentially numbered opaque sealed envelopes (SNOSE) (Douma 2015; Evron 2008; Shen 2013; Stocki 2014; Thurlow 2002), or allocation could not be foreseen due to the method used for randomisation (throwing dice) (Stourac 2014).
In 10 trials it was not clear from the description if SNOSE was correctly applied to cover allocation (Balki 2007; Douma 2010; Douma 2011; Evron 2005; Ismail 2012; Khooshideh 2015; Ng 2011; Tveit 2012; Volikas 2001; Volmanen 2008). Three trials did not describe any method for allocation concealment (Blair 2005; Calderon 2006; El‐Kerdawy 2010). Thus, we estimated these trials to have an unclear risk of bias.
One study was assigned to the category high risk of bias, because allocation concealment was uncovered for women and personnel before the start of treatment (Freeman 2015).
Blinding
Blinding of participants and personnel (performance bias)
Two trials were considered to have a low risk of bias (Balki 2007; Shen 2013) because it was clearly stated that all physicians and participants were blinded adequately.
We judged five studies to have an unclear risk of bias (Douma 2010; Evron 2005; Ng 2011; Volikas 2001; Volmanen 2008). In these trials, blinding attempts were made but we assumed that there was the possibility to uncover blinding due to the different pharmacokinetics of the compared interventions (pharmacological half‐life and clinical effects following bolus request).
Thirteen trials had high risk of bias regarding performance bias. In four of these trials it was pointed out that participants and personnel were not blinded (Douma 2015; Freeman 2015; Stocki 2014; Tveit 2012). Six of the high‐risk studies did not address this issue (Calderon 2006; Douma 2011; El‐Kerdawy 2010; Ismail 2012; Stourac 2014; Thurlow 2002), but on the basis of the methods described we assumed that blinding did not occur due to technical reasons. The remaining three trials were single‐blinded trials (Blair 2005; Evron 2008; Khooshideh 2015). Hence, either participants or personnel or even both of them were not blinded, and in addition to that it is uncertain that single‐blinding worked adequately because of the nature of the intervention.
Blinding of outcome assessor (detection bias)
Five studies were estimated to have a low risk of bias (Balki 2007; Douma 2010; Evron 2008; Ng 2011; Shen 2013) because blinding of outcome assessors was appropriate.
In four studies the risk of bias remained unclear (Blair 2005; Evron 2005; Volikas 2001; Volmanen 2008) since information was insufficient to judge whether all outcome assessments were adequately blinded or not. Blinding attempts were made for several outcomes. Nevertheless, subjective outcomes or outcome measurements could likely be influenced by lack of blinding.
The remaining 11 studies were considered having a high risk of bias. In three of them it was reported that blinding was not performed (Douma 2015; Freeman 2015; Stocki 2014). In eight studies this issue was not addressed for most relevant outcomes (Calderon 2006; Douma 2011; El‐Kerdawy 2010; Ismail 2012; Khooshideh 2015; Stourac 2014; Thurlow 2002; Tveit 2012). Due to the description of the interventions we inferred that at least subjective outcomes or outcome measurements were likely to be influenced by lack of blinding.
Incomplete outcome data
Nine studies had a low risk of bias (Balki 2007; Calderon 2006; El‐Kerdawy 2010; Evron 2008; Ismail 2012; Khooshideh 2015; Ng 2011; Stocki 2014; Volikas 2001). In seven of these trials no missing outcome data were detected (Balki 2007; Calderon 2006; El‐Kerdawy 2010; Ismail 2012; Khooshideh 2015; Ng 2011; Volikas 2001), whereas two trials described reasons for their missing data (less than 15%, respectively) that were unlikely to be related to true outcome (Evron 2008; Stocki 2014). Full‐intention‐to‐treat (ITT)/partial‐ITT analysis was used in all studies except two; in one study, data were analysed per‐protocol (Evron 2008), and the other study did not define the method of data analysis (El‐Kerdawy 2010).
In two studies attrition bias remained unclear (Evron 2005; Thurlow 2002). One trial did not report on reasons for missing data (up to 22%) with regard to the outcome adverse events for women (Evron 2005). Additionally, these missing data were imbalanced between the groups and the rate of escape analgesia amounted to 38%. As a result, it was uncertain if this outcome was biased. Similar reasons applied to the second trial (Thurlow 2002) with incomplete outcome data without reasons declared and high escape analgesia rates (up to 81%). Both trials used partial‐ITT‐analysis.
High risk of bias was assigned to nine studies (Blair 2005; Douma 2010; Douma 2011; Douma 2015; Freeman 2015; Shen 2013; Stourac 2014; Tveit 2012; Volmanen 2008). A large amount of data (more than 15%) were missing for many important outcomes, partly with reasons stated (Stourac 2014), partly without reasons declared (Blair 2005; Douma 2010; Douma 2011; Douma 2015; Freeman 2015; Shen 2013; Tveit 2012; Volmanen 2008). However, reasons for missing outcome data were likely to be related to true outcome. One study used partial‐ITT for data analysis (Freeman 2015). All other studies with high risk of bias concerning attrition bias used per‐protocol analysis.
Selective reporting
No study was considered to have a low risk of bias.
Fourteen trials were assessed having an unclear risk of bias. There were no references to trial registries and no published study protocols in 13 cases (Balki 2007; Blair 2005; Calderon 2006; El‐Kerdawy 2010; Evron 2005; Evron 2008; Ismail 2012; Ng 2011; Shen 2013; Stourac 2014; Thurlow 2002; Volikas 2001; Volmanen 2008). One retrospectively registered study protocol was available and all reported outcomes were specified. Nonetheless, several outcomes were reported that were not defined in the study protocol (Khooshideh 2015).
The remaining six studies were judged to have high risk of bias (Douma 2010; Douma 2011; Douma 2015; Freeman 2015; Stocki 2014; Tveit 2012). The corresponding protocols were available that revealed several deviations in the definitions of primary and secondary outcomes. Additionally, some pre‐defined outcomes were not reported at all. Three protocols were registered prospectively (Douma 2011; Douma 2015; Stocki 2014), two retrospectively (Douma 2010; Tveit 2012), and one study had two different protocols that were published both prospectively and retrospectively (Freeman 2015).
Other potential sources of bias
Eighteen studies appeared to be free of other sources of bias und were therefore estimated having low risk of bias (Balki 2007; Blair 2005; Calderon 2006; Douma 2010; Douma 2011; Douma 2015; El‐Kerdawy 2010; Evron 2005; Evron 2008; Freeman 2015; Ismail 2012; Khooshideh 2015; Ng 2011; Shen 2013; Stocki 2014; Thurlow 2002; Volikas 2001; Volmanen 2008).
In one study enrolment stopped early due to high participating refusal (Stourac 2014). In another trial technical problems with infusion pumps occurred and as a consequence the study had to be closed (Tveit 2012). Both studies were underpowered and were considered to have unclear risk of bias.
No study had high risk of bias.
Effects of interventions
See: Summary of findings for the main comparison Remifentanil (PCA) compared to another opioid (IV/IM) for pain management in labour; Summary of findings 2 Remifentanil (PCA) compared to another opioid (PCA) for pain management in labour; Summary of findings 3 Remifentanil (PCA) compared to epidural/CSE for pain management in labour; Summary of findings 4 Remifentanil (PCA) compared to remifentanil (continuous IV) for pain management in labour; Summary of findings 5 Remifentanil (PCA, increasing bolus dose) compared to remifentanil (PCA, increasing infusion dose) for pain management in labour
To get an overview about the meta‐analyses of all comparisons in this review, we summarised the direction of effect estimates (favours remifentanil (patient‐controlled analgesia (PCA)), favours control, no favour of remifentanil (PCA) or control) for all outcomes and the GRADE's level of evidence for the predefined GRADE‐relevant outcomes (Figure 4).
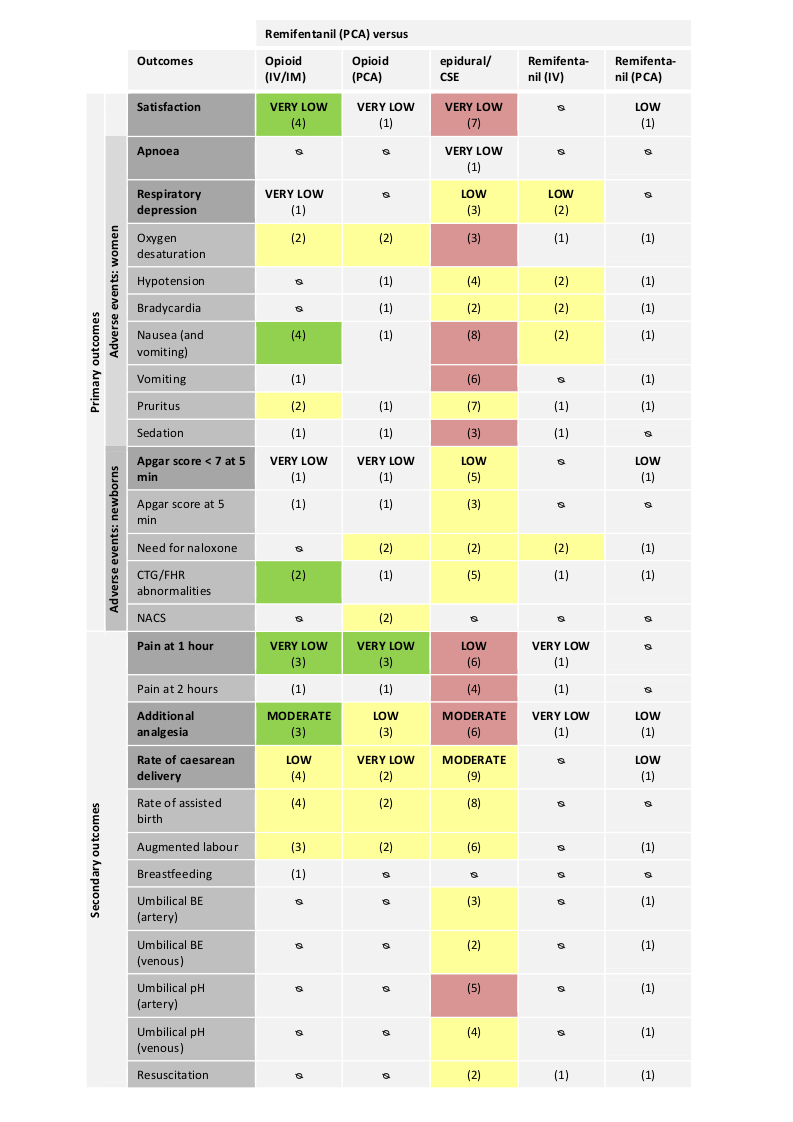
Abbreviations:
IV: intravenous; IM: intramuscular; PCA: patient‐controlled analgesia; CTG: cardiotocography; FHR: fetal heart rate; NACS: neonatal neurologic and adaptive capacity score; BE: base excess.
Direction of estimated effects (results of meta‐analyses) for all primary and secondary outcomes with two or more studies and level of evidence (GRADE) for all GRADE‐relevant, pre‐defined outcomes:
The direction of the estimated effects were labelled as green (favours remifentanil (PCA)), red (favours control), yellow (neither favour of remifentanil (PCA) nor control), (1) (only one RCT, no meta‐analysis performed), ∅ (no RCTs available).
The GRADE levels of the evidence were expressed as VERY LOW, LOW, MODERATE, and HIGH for all GRADE‐relevant outcomes (dark grey, bold). For details on GRADE levels of evidence see the summary of findings tables (summary of findings Table for the main comparison; summary of findings Table 2; summary of findings Table 3; summary of findings Table 4; summary of findings Table 5).
Remifentanil (PCA) compared to another opioid (IV/IM)
Four trials compared remifentanil (PCA) to another opioid (IV/IM) (Calderon 2006; Evron 2005; Ng 2011; Thurlow 2002).
Primary outcomes
Satisfaction with pain relief
All four trials with 216 participants reported data on overall satisfaction with pain relief (Calderon 2006; Evron 2005; Ng 2011; Thurlow 2002). Random‐effects meta‐analysis revealed a strongly increased standardised mean satisfaction score in women receiving remifentanil (PCA) when compared to another opioid (IV/IM) (standardised mean difference (SMD) 2.11, 95% confidence interval (CI) 0.72 to 3.49; I2 = 93%, Analysis 1.1; fixed‐effect model SMD 1.85, 95% CI 1.51 to 2.19, Table 9). We detected substantial statistical heterogeneity (I2 = 93%). Due to the small number of studies no subgroup analyses were performed. Excluding the trial Evron 2005 that provided another opioid intravenously and not intramuscularly like the remaining three studies decreased heterogeneity from 93% to 55%. 'Risk of bias' assessment for satisfaction with pain relief resulted in two trials at high risk of bias for blinding (Calderon 2006; Thurlow 2002). In trials with an overall low or unclear risk of bias (Evron 2005; Ng 2011), no evidence of effect for remifentanil (PCA) to increase satisfaction was found (SMD 2.46, 95% CI ‐0.34 to 5.26, Table 3). Optimal information size (OIS) considerations showed that with an anticipated minimal clinically relevant difference of 1 cm (visual analogue scale (VAS) 0 to 10 cm), and a control mean satisfaction score of 6 cm the OIS was estimated at 208 participants (Table 7). Including all four trials (n = 216), independent of the 'Risk of bias' assessment, sufficient information was retained to confirm evidence of effect for remifentanil (PCA) to increase overall satisfaction with pain relief.
We graded the quality of evidence for the outcome 'satisfaction with pain relief' as 'very low' (double‐downgrade for quality and downgrade for inconsistency; summary of findings Table for the main comparison).
Adverse events for women
We could not identify any studies reporting on 'apnoea', 'hypotension', and 'bradycardia'.
Respiratory depression
One trial reported on the incidence of women with respiratory depression (< 8 breaths/minute) (Thurlow 2002). Three out of 18 women in the remifentanil (PCA) group and none out of 18 women in the meperidine IM group had a respiratory depression during labour (Analysis 1.2). Because only one small trial (very serious imprecision) with high risk of bias assessed this outcome and evidence is strongly limited, we graded the quality of the evidence as 'very low' (summary of findings Table for the main comparison).
Oxygen desaturation
Two studies with 113 women were pooled which reported oxygen desaturation defined as SpO2 < 95% (Evron 2005; Thurlow 2002). Overall, in both trials there was no evidence of effect for a decreased risk of oxygen desaturation in the remifentanil (PCA) group when compared to the other opioid (IV/IM) group in a random‐effects model (risk ratio (RR) 0.48, 95% CI 0.00 to 47.37; I2 = 88%, Analysis 1.3; fixed‐effect model RR 0.66, 95% CI 0.28 to 1.57, Table 9). Since we detected substantial statistical heterogeneity (I2 = 88%) and the individual trials have markedly different results, this meta‐analysis was not reliable. One trial reported zero events in the remifentanil (PCA) group (Evron 2005). The estimated effect and the I2 statistic was not robust when using a constant continuity correction of 0.01 to handle zero event trials (RR 3.42, 95% CI 0.82 to 14.25; I2 = 0%, Table 10). The estimated effect was not robust in terms of risk of bias, because one trial was assessed as high risk of bias for blinding (Thurlow 2002, sensitivity analysis: RR 0.05, 95% CI 0.00 to 0.82, Table 3), and the other trial for attrition bias (Evron 2005, sensitivity analysis: RR 3.50, 95% CI 0.84 to 14.61, Table 4).
Nausea (and vomiting)
All four trials including 216 women reported either on combined nausea and vomiting (Calderon 2006; Evron 2005; Thurlow 2002) or on separate nausea or vomiting (Ng 2011). Random‐effects meta‐analysis revealed a decreased risk for women to suffer from nausea (and vomiting) in the remifentanil (PCA) group when compared to the other opioid (IV/IM) group (RR 0.54, 95% CI 0.29 to 0.99; I2 = 0%, Analysis 1.4). One trial reported zero events in the remifentanil (PCA) group (Evron 2005). The estimated effect was not robust when using a constant continuity correction of 0.01 to handle zero event trials (RR 0.56, 95% CI 0.30 to 1.04, Table 10). Two trials were assessed as high risk of bias for blinding (Calderon 2006; Thurlow 2002). Exclusion of those two trials no longer revealed evidence of effect for remifentanil (PCA) to decrease the risk for nausea (and vomiting) in women when compared with the administration of another opioid (IV/IM) (RR 0.36, 95% CI 0.06 to 2.29, Table 3).
Vomiting
One trial with 68 women reported on vomiting (Ng 2011). One out of 34 women vomited in the remifentanil (PCA) group and two out of 34 vomited in the pethidine (IM) group (P = 0.55) (Analysis 1.5).
Pruritus
Two trials including 156 participants analysed the occurrence of pruritus in both groups (Evron 2005; Ng 2011). None of the participants in either group of both trials reported to suffer from pruritus (Analysis 1.6). The pooled effect could be estimated by using the trial sequential analysis (TSA) software which allows a constant continuity correction of 0.01 for zero event handling in both arms, which yielded an unreliably wide CI (RR 1.02, 95% CI 0.00 to 1.1E12, Table 10). Both trials were assessed as low or unclear risk of bias for the domains selection bias, blinding, and attrition bias (Table 2; Table 3; Table 4).
Sedation
One trial with 77 women reported on sedation scores one hour after onset of analgesia in which women in the remifentanil (PCA) group were less sedated than women in the meperidine (IV) group (1.1 +/‐ 0.2 versus 2.6 +/‐ 0.2, mean +/‐ standard deviation (SD), Ramsay sedation score, P < 0.001) (Analysis 1.7) (Evron 2005).
Adverse events for the newborn
We could not identify any studies reporting on 'need for naloxone' and 'NACS' (neurologic and adaptive capacity score).
Apgar score less than seven at five minutes
One trial with 88 newborns assessed this outcome and none of the newborns in either group had an Apgar score less than seven at five minutes (Analysis 1.8) (Evron 2005). Because only one small trial (very serious imprecision) with unclear risk of bias reported on this outcome which strongly limited evidence, we graded the quality of the evidence as 'very low' (summary of findings Table for the main comparison).
Apgar score at five minutes
One trial with 68 newborns reported on average Apgar scores at five minutes with no difference in the remifentanil (PCA) and the meperidine (IV) group (median Apgar score of 9, IQR 9 to 9 in both groups) (Analysis 1.9) (Ng 2011).
FHR/CTG abnormalities, non‐reassuring fetal status
Two trials including 156 newborns reported on either opioid‐induced loss of fetal heart rate (FHR) (Evron 2005) or on fetal distress with impaired cardiotocography (CTG) (Ng 2011). The pooled meta‐analysis revealed evidence of effect for a decreased risk of FHR/CTG abnormalities in the remifentanil (PCA) group when compared to the other opioid (IV/IM) group (RR 0.30, 95% CI 0.10 to 0.90; I2 = 0%, Analysis 1.10). This estimated effect was robust with respect to the fixed‐effect model sensitivity analysis (Table 9). All trials were assessed as low or unclear risk for selection bias, attrition bias, and low risk of blinding (Table 2; Table 3; Table 4).
Secondary outcomes
We could not identify any studies reporting on 'umbilical cord base excess/pH' and 'need for neonatal resuscitation'.
Pain intensity (pain score 'early' at one hour)
Three trials including 180 women assessed pain intensity at one hour after onset of analgesia (Calderon 2006; Evron 2005; Ng 2011). Random‐effects meta‐analysis showed that remifentanil (PCA) had a moderate to strong effect on the reduction of standardised mean pain scores at one hour when compared to other opioids (IV/IM) (SMD ‐1.58, 95% CI ‐2.69 to ‐0.48; I2 = 89%, Analysis 1.11; fixed‐effect model SMD ‐1.35, 95% CI ‐1.68 to ‐1.01). There was substantial statistical heterogeneity (I2 = 89%). Excluding the trial Ng 2011, heterogeneity decreased to 0% without clinical explanation. One trial was assessed as high risk of bias for blinding (Calderon 2006). In trials with overall low or unclear risk of bias (Evron 2005; Ng 2011), evidence of effect was no longer present for remifentanil (PCA) to decrease pain scores when compared to other opioids (IV/IM) (SMD ‐1.28, 95% CI ‐2.62 to 0.07, Table 3). The OIS was estimated at 298 participants using optimal information size considerations anticipating a minimal clinically relevant reduction of 10 mm (VAS 0 to 100 mm), and a control mean pain score of 35.6 mm (Table 7). Including all three trials (n = 180), independent of the 'Risk of bias' assessment, sufficient information was not available to confirm evidence of effect for remifentanil (PCA) to decrease pain intensity when compared to other opioids (IV/IM).
We graded the quality of evidence for the outcome 'pain score 'early'' as 'very low' (double‐downgrade for quality, downgrade for inconsistency, and downgrade for imprecision; summary of findings Table for the main comparison).
Pain intensity (pain score 'late' at two hours)
One trial with 68 women provided data on pain scores at two hours after onset of analgesia (Ng 2011). Women receiving remifentanil (PCA) reported less pain (20.0 +/‐ 17.7, mean +/‐ SD, VAS 0 to 100 mm) compared to women receiving pethidine (IM) (36.66 +/‐ 26.66 mm, P < 0.001) (Analysis 1.12).
Additional analgesia required (escape analgesia)
Three studies including 190 women offered and reported on additional analgesia on request to women in labour. One trial offered epidural analgesia (Evron 2005), one pethidine IM and Entonox (Ng 2011), and one first Entonox and later an epidural (Thurlow 2002). Overall, in all trials the administration of remifentanil (PCA) was associated with a lower requirement for additional escape analgesia when compared to the administration of other opioids (IV/IM) in a random‐effects meta‐analysis (RR 0.57, 95% CI 0.40 to 0.81; I2 = 28%, Analysis 1.13). There was no substantial statistical heterogeneity in the analysis (I2 = 28%). One trial was assessed as high risk of bias for both blinding and incomplete outcome data (Thurlow 2002). Exclusion of this trial had no impact on the robustness of the estimated effect (RR 0.48, 95% CI 0.25 to 0.91, Table 3, Table 4). Trial sequential analysis on all three trials, independent of the 'Risk of bias' assessment, showed that with 'low risk of bias'‐based and with 'empirical' assumptions the RIS was 156 (Table 5) and 194 (Table 6) participants, respectively. In case of TSA 'empirical' the trial sequential monitoring boundaries (TSMB) was crossed (revealing statistical significance before the RIS has been reached and) indicating that sufficient information was retained to confirm evidence of effect for remifentanil (PCA) to decrease the requirements for additional analgesia compared to other opioids (IV/IM).
We graded the quality of evidence for the outcome 'additional analgesia required' as 'moderate' (downgrade for quality; summary of findings Table for the main comparison).
Rate of caesarean delivery
All four trials including 215 women reported on the rate of caesarean delivery (Calderon 2006; Evron 2005; Ng 2011; Thurlow 2002). Overall, in all trials there was no evidence of effect for remifentanil (PCA) to decrease the risk for caesarean delivery compared to the other opioid (IV/IM) group when analysed in a random‐effects meta‐analysis (RR 0.70, 95% CI 0.34 to 1.41; I2 = 1%, Analysis 1.14). There was almost no statistical heterogeneity in the analysis detectable. Two trials reported zero events in either the remifentanil (PCA) group (Calderon 2006) or the opioid (IV/IM) group (Thurlow 2002). The estimated effect was robust when using a constant continuity correction of 0.01 to handle zero event trials (RR 0.63, 95% CI 0.30 to 1.32, Table 10). Two trials were assessed as high risk of bias for blinding (Calderon 2006; Thurlow 2002) and one trial for incomplete outcome data (Thurlow 2002). Sensitivity analyses revealed no impact on the robustness of the estimated effects for both blinding (RR 0.63, 95% CI 0.30 to 1.31, Table 3) and attrition bias (RR 0.60, 95% CI 0.29 to 1.24, Table 4). Trial sequential analysis on all three trials, independent of the 'Risk of bias' assessment, showed that with 'low risk of bias'‐based and with 'empirical' assumptions the RIS was 1444 (Table 5) and 2245 participants (Table 6), respectively. Therefore, information was insufficient to demonstrate evidence of no effect.
We graded the quality of evidence for the outcome 'rate of caesarean delivery' as 'low' (downgrade for quality, downgrade for imprecision; summary of findings Table for the main comparison).
Rate of assisted birth
All four trials with 215 women reported on rate of assisted birth; two trials reported on ventouse delivery (Ng 2011; Thurlow 2002), one on non‐defined instrumental delivery (Calderon 2006), and one on vacuum extraction and forceps delivery (Evron 2005). Random‐effects meta‐analysis showed no evidence of effect for the remifentanil (PCA) group to reduce the risk for assisted birth compared to the other opioid (IV/IM) group (RR 0.82, 95% CI 0.32 to 2.09; I2 = 0%, Analysis 1.15).
Augmented labour
Three trials including 190 women analysed augmentation of labour by use of oxytocin (Evron 2005; Ng 2011; Thurlow 2002). The pooled meta‐analysis revealed no difference in the rate of augmented labour between the remifentanil (PCA) and the other opioid (IV/IM) group (RR 0.97, 95% CI 0.72 to 1.29; I2 = 17%, Analysis 1.16).
Breastfeeding initiation
One trial assessed the outcome 'breastfeeding initiation' as 'feeding difficulties' (Evron 2005). The study reported that three out of 43 women in the remifentanil (PCA) group and six out of 45 in the meperidine (IV) group had difficulties with breastfeeding (P > 0.05) (Analysis 1.17).
Remifentanil (PCA) compared to another opioid (PCA)
Three trials compared remifentanil (PCA) to another opioid (PCA) (Blair 2005; Douma 2010; Volikas 2001).
Primary outcomes
Satisfaction with pain relief
One trial including 110 women, 38 women in the remifentanil (PCA) group and 72 women in the combined control group (meperidine (PCA): 30 women, fentanyl (PCA): 42 women), provided data on overall satisfaction with pain relief (Douma 2010). Women in the remifentanil (PCA) group (8.1 +/‐ 1.1, mean +/‐ SD, verbal rating scale (VRS) 1 to 10) were more satisfied than women in the combined control group (7.175 +/‐ 1.331, Analysis 2.1) (single groups: meperidine (PCA) (7.0 +/‐ 1.5, P < 0.05) and fentanyl (PCA) group (7.3 +/‐ 1.2, P > 0.05)). Because only one small trial assessed this outcome (very serious imprecision), with high risk of attrition bias which strongly limits the evidence, we graded the quality of the evidence as 'very low' (summary of findings Table 2).
Adverse events for women
We could not identify any studies reporting on 'apnoea', and 'respiratory depression'.
Oxygen desaturation
Two studies with 190 women were pooled which reported oxygen desaturation defined as either SpO2 < 95% (Douma 2010) or SpO2 < 94% (Blair 2005). In a random‐effects meta‐analysis there was no evidence of effect that administration of remifentanil (PCA) was associated with a higher risk for oxygen desaturation when compared to other opioids (PCA) (RR 1.28, 95% CI 0.49 to 3.30; I2 = 98%, Analysis 2.2). Under the fixed‐effect model the remifentanil (PCA) group was associated with a higher risk for oxygen desaturation (RR 1.39, 95% CI 1.16 to 1.67, Table 9). However, due to substantial statistical heterogeneity (I2 = 98%), and the different results of the individual trials this meta‐analysis was not reliable. The estimated effect was not robust in terms of risk of bias, because one trial was assessed as high risk of bias for blinding (Blair 2005, sensitivity analysis: RR 1.64, 95% CI 1.25 to 2.15, Table 3), and both trials were assessed as high risk of attrition bias (Table 4).
Hypotension
One trial with 17 women assessed the outcome 'hypotension' and reported that there were no episodes of hypotension in neither the remifentanil (PCA) group nor the pethidine (PCA) group (Analysis 2.3) (Volikas 2001).
Bradycardia
One trial including 17 women assessed the outcome 'bradycardia' and reported that there were no episodes of bradycardia in either group (Analysis 2.4) (Volikas 2001).
Nausea (and vomiting)
One trial with 153 participants, 51 women in either group (remifentanil, meperidine, and fentanyl), reported on nausea and vomiting (Douma 2010). There was no difference between the groups with respect to the risk of nausea and vomiting as 20 out of 51 women in both the remifentanil and the fentanyl group, and 23 out of 51 women in the meperidine group suffered from nausea and vomiting (Analysis 2.5).
Pruritus
One trial including 152 women assessed the risk of pruritus (Douma 2010). Pruritus occurred more frequently in the remifentanil group (eight out of 51 women) than in the meperidine group (three out of 51) or the fentanyl group (one out of 50) (P < 0.05) (Analysis 2.6).
Sedation
One trial including 159 women reported on sedation scores one hour after onset of analgesia in which women in the remifentanil (PCA) group (1.85 +/‐ 0.8, mean +/‐ SD, Observer sedation score 1 to 5) were more sedated than women in the combined control group (1.42 +/‐ 1.414, Analysis 2.7), (single groups: meperidine (PCA) (1.45 +/‐ 0.5, P < 0.05) and fentanyl (PCA) group (1.39 +/‐ 0.5, P < 0.01)) (Douma 2010).
Adverse events for the newborn
Apgar score less than seven at five minutes
One trial comparing remifentanil (PCA) versus pethidine (PCA) provided data on Apgar score less than seven at five minutes (Volikas 2001). This study had been terminated after 17 participants completed the trial, on agreement with the local ethics committee, due to concerns with the poor Apgar scores in the pethidine group. None of the nine newborns in the remifentanil (PCA) group and three out of eight newborns in the pethidine (PCA) group had an Apgar score less than seven at five minutes (Analysis 2.8). Because only one small trial assessed this outcome (very serious imprecision) with unclear risk of selection bias and blinding, which strongly limits the evidence, we graded the quality of the evidence as 'very low' (summary of findings Table 2).
Apgar score at five minutes
One trial with 115 newborns reported on average Apgar score at five minutes with no difference between the remifentanil (PCA) (9.9 +/‐ 0.3, mean +/‐ SD) and the combined control group (9.642 +/‐ 0.619, Analysis 2.9), (single groups: meperidine (PCA) (9.7 +/‐ 0.6) and fentanyl (PCA) group (9.6 +/‐ 0.6)) (Douma 2010). This trial of Douma 2010 was assessed as high risk of attrition bias because about 30% of the data on newborns were not reported, without giving appropriate reasons for that.
Need for naloxone
Two trials with 55 newborns provided data on the need for naloxone (Blair 2005; Volikas 2001). Only one event for the need of naloxone was reported in the control pethidine (PCA) group of one trial (Volikas 2001); the other trial included zero events in both arms, which was not estimable with Review Manager 5 (RR 0.30, 95% CI 0.01 to 6.47; I2 = 0%, Analysis 2.10). A pooled effect could be estimated by using the TSA software, which allows a constant continuity correction of 0.01 for zero event handling in both arms, and which yielded an unreliably wide CI (RR 0.03, 95% CI 0.00 to 1.8E8, Table 10). The study from Blair 2005 was assessed as high risk of performance and attrition bias. Exclusion of this trial had no impact on robustness of the estimated effect with respect to all sensitivity analyses performed (Table 2; Table 3; Table 4).
FHR/CTG abnormalities, non‐reassuring fetal status
None of the included studies comparing remifentanil (PCA) to another opioid (PCA) assessed 'FHR/CTG abnormalities or non‐reassuring fetal status'. However, Douma 2010 reported on the incidence of newborns with reactive CTG and derived no difference between the remifentanil (44 out of 52), the meperidine (44 out of 53), and the fentanyl group (48 out of 54); vice versa 15%, 17%, and 11% of the newborns, respectively, must have shown a non‐reactive CTG (Analysis 2.11).
NACS at 15/30 minutes
Two trials including 94 newborns provided data on NACS at either 15 minutes (Douma 2010) or 30 minutes postpartum (Blair 2005). In a random‐effects meta‐analysis no evidence of effect was found that remifentanil (PCA) was associated with higher NACS compared to another opioid (PCA) (mean difference (MD) 1.11, 95% CI ‐0.65 to 2.87; I2 = 81%, Analysis 2.12). Under the fixed‐effect model the remifentanil (PCA) group was associated with a higher NACS when compared to another opioid (PCA) (MD 1.15, 95% CI 0.38 to 1.93, Table 9). However, due to substantial statistical heterogeneity (I2 = 81%) the fixed‐effect model was not reliable. 'Risk of bias' assessment for NACS resulted in one trial assessed as high risk of performance bias (Blair 2005); sensitivity analysis changed the direction of the estimated effect (RR 0.20, 95% CI ‐0.93 to 1.33, Table 3). Both trials were assessed as high risk of attrition bias.
Secondary outcomes
We could not identify any studies reporting on 'breastfeeding initiation', 'umbilical cord base excess/pH', and 'need for neonatal resuscitation'.
Pain intensity (pain score 'early' at 30 minutes/one hour)
Three trials including 215 women provided data on pain intensity at one hour after onset of analgesia (Blair 2005; Douma 2010; Volikas 2001). In the case of Blair 2005 which reported pain intensity as median with IQR, we used the '30 minutes' time point instead of the 'one hour' time point because of asymmetric data. In a random‐effects meta‐analysis remifentanil (PCA) reduced the standardised mean pain intensity when compared to other opioid (PCA), however, the upper CI limit reached the line of no effect (SMD ‐0.51, 95% CI ‐1.01 to ‐0.00; I2 = 52%, Analysis 2.13). Under the fixed‐effect model, evidence of effect was found for remifentanil (PCA) to decrease pain scores when compared to other opioids (PCA) (SMD ‐0.57, 95% CI ‐0.86 to ‐ 0.29, Table 9). However, substantial statistical heterogeneity (I2 = 52%) reduced the reliability of the fixed‐effect model. One trial was assessed as high risk of bias for blinding (Blair 2005). Exclusion of this trial revealed a moderate to strong (clinically relevant) reduction in pain intensity of women after administration of remifentanil (PCA) when compared to another opioid (PCA) (SMD ‐0.73, 95% CI ‐1.05 to ‐0.40, Table 3), and decreased the heterogeneity to I2 = 0% without any other clinical explanation. The OIS was calculated at 246 participants using optimal information size considerations anticipating a minimal clinically relevant reduction of 10 cm (VAS 0 to 10 cm) and a control mean pain score of 6.282 cm (Table 7). Including all three trials (n = 215), independent of the 'Risk of bias' assessment, sufficient information was not available to confirm evidence of effect for remifentanil (PCA) to decrease pain intensity when compared to other opioids (PCA).
We graded the quality of evidence for the outcome 'pain score 'early'' as 'very low' (downgrade for quality, downgrade for inconsistency, and downgrade for imprecision; summary of findings Table 2.
Pain intensity (pain score 'late' at two hours)
One trial with 108 women reported on pain intensity at two hours with mean pain scores in the remifentanil (PCA) group of 5.7 +/‐ 2.7 cm (mean +/‐ SD, VAS 0 to 10 cm) and the combined control group of 6.598 +/‐ 2.233 (Analysis 2.14), (single groups: meperidine (PCA) group wih6.76 +/‐ 2.3 cm and the fentanyl (PCA) group with 6.47 +/‐ 2.2 cm) (Douma 2010).
Additional analgesia required (escape analgesia)
Three studies including 215 women offered and reported on additional analgesia on request to women in labour. One trial offered Entonox (Blair 2005), one trial offered an epidural (Douma 2010), and one trial provided both Entonox and epidural analgesia (Volikas 2001). Random‐effects meta‐analysis revealed no evidence of effect for remifentanil (PCA) to reduce requirements for additional analgesia when compared to other opioids (PCA) (RR 0.76, 95% CI 0.45 to 1.28; I2 = 64%, Analysis 2.15). We detected substantial statistical heterogeneity (I2 = 64%). Excluding Blair 2005 or Douma 2010 decreased the heterogeneity to 0%, respectively, without clinical explanation. One trial was assessed as high risk of bias for blinding (Blair 2005). Exclusion of this trial had no impact on robustness of the estimated effect (Table 3). Trial sequential analysis on all three trials, independent of the 'Risk of bias' assessment, showed that with 'low risk of bias'‐based and with 'empirical' assumptions the RIS was 1024 (Table 5) and 4218 participants (Table 6), respectively. The RIS was not reached and the TSMB were not crossed indicating that insufficient information was retained to confirm evidence of no effect for remifentanil (PCA) on the requirements for additional analgesia compared to other opioids (PCA).
We graded the quality of evidence for the outcome 'additional analgesia required' as 'low' (downgrade for inconsistency and imprecision; summary of findings Table 2).
Rate of caesarean delivery
Two trials with 143 women provided data on rate of caesarean delivery (Douma 2010; Volikas 2001). Pooled meta‐analysis revealed an increased risk for caesarean section under remifentanil (PCA) analgesia when compared to other opioids (PCA) (RR 2.78, 95% CI 0.99 to 7.82; I2 = 0%, Analysis 2.16). However, the lower CI limit crossed the line of no effect whereby a wide range of treatment effects ‐ clinically relevant and non‐relevant – is compatible with this result. One trial was assessed as high risk of attrition bias (Douma 2010). Exclusion of the high risk of bias trial widened the CI including appreciable benefit and harm (RR 1.78, 95% CI 0.20 to 16.10, Table 4). Trial sequential analysis on both trials, independent of the 'Risk of bias' assessment, showed that with 'low risk of bias'‐based and with 'empirical' assumptions, the RIS was 852 (Table 5) and 372 participants (Table 6), respectively. The RIS was not reached and the TSMB were not crossed indicating that insufficient information was retained to confirm evidence of effect for remifentanil (PCA) to increase the rate of caesarean deliveries compared to other opioids (PCA).
We graded the quality of evidence for the outcome 'rate of caesarean delivery' as 'very low' (double‐downgrade for quality, and downgrade for imprecision; summary of findings Table 2).
Rate of assisted birth
Two trials with 143 women reported on rate of assisted birth; one trial by ventouse and forceps delivery (Volikas 2001) and the other one by non‐defined instrumental delivery (Douma 2010). Random‐effects meta‐analysis showed no evidence of effect for remifentanil (PCA) to increase the risk for assisted birth compared to the other opioid (PCA) group (RR 1.22, 95% CI 0.62 to 2.37; I2 = 0%, Analysis 2.17).
Augmented labour
Two trials including 152 women analysed augmentation of labour by use of oxytocin (Douma 2010; Volikas 2001). The pooled meta‐analysis revealed no evidence of effect for remifentanil (PCA) to increase the risk for augmentation of labour compared to the other opioid (PCA) group (RR 1.37, 95% CI 0.59 to 3.15; I2 = 70%, Analysis 2.18). Since we detected substantial statistical heterogeneity (I2 = 70%), and the individual trials have markedly different results, this meta‐analysis was not reliable.
Remifentanil (PCA) compared to epidural analgesia/combined spinal‐epidural analgesia (CSE)
Ten trials compared remifentanil (PCA) to either epidural analgesia (Douma 2011; Douma 2015; El‐Kerdawy 2010; Evron 2008; Freeman 2015; Stocki 2014; Stourac 2014; Tveit 2012; Volmanen 2008) or both epidural and CSE (Ismail 2012). For the latter trial, we combined both control groups (epidural and CSE) into one control group.
Primary outcomes
Satisfaction with pain relief
Seven trials including 2135 participants, with 931 in the remifentanil (PCA) and 1204 in the control epidural/CSE group provided data on overall satisfaction with pain relief (Douma 2011; Douma 2015; El‐Kerdawy 2010; Freeman 2015; Ismail 2012; Stocki 2014; Volmanen 2008). Overall, when all trials were pooled in a random‐effects meta‐analysis, women in the epidural/CSE group were slightly more satisfied with pain relief than women in the remifentanil (PCA) group (SMD ‐0.22, 95% CI ‐0.40 to ‐0.04; I2 = 52%, Analysis 3.1, fixed‐effect model SMD ‐0.29, 95% CI ‐0.38 to ‐0.20, Table 9). We detected substantial statistical heterogeneity (I2 = 52%). Excluding Ismail 2012 that not only investigated epidural analgesia but also CSE, decreased the heterogeneity to 0%. 'Risk of bias' assessment for satisfaction with pain relief resulted in one trial assessed as high risk of selection bias (Freeman 2015), six trials as high risk of bias for blinding (Douma 2011; Douma 2015; El‐Kerdawy 2010; Freeman 2015; Ismail 2012; Stocki 2014), and four trials as high risk of attrition bias (Douma 2011; Douma 2015; Freeman 2015; Volmanen 2008). In trials with low or unclear risk of bias evidence of effect for remifentanil (PCA) to decrease satisfaction was no longer found (selection bias: SMD ‐0.20, 95% CI ‐0.46 to 0.07 (Table 2), blinding: SMD 0.27, 95% CI ‐0.31 to 0.86 (Table 3), attrition bias: SMD ‐0.27, 95% CI ‐0.64 to 0.10 (Table 4)). Optimal information size considerations revealed that with an anticipated difference of 0.5 cm (VAS 0 to 10 cm) and a control mean satisfaction score of 9.1 cm (both assumptions were based on the 'best' trial), the OIS was estimated at 380 participants (Table 8). Including all trials (n = 2135), independent of the 'Risk of bias' assessment, sufficient information was retained to confirm evidence of effect for epidural analgesia to increase overall satisfaction with pain relief compared to remifentanil (PCA).
We graded the quality of evidence for the outcome 'satisfaction with pain relief' as 'very low' (double‐downgrade for quality and downgrade for inconsistency; summary of findings Table 3).
Adverse events for women
Apnoea
One trial including 38 women provided data on apnoea defined as a respiratory rate of zero for at least 20 s (Stocki 2014). The study reported that five women during the first hour of analgesia and nine out of 19 women during the whole study period in the remifentanil (PCA) group had one or more apnoea events, whereas none of the 19 women in the epidural group had an apnoea (one hour: P = 0.045) (Analysis 3.2). Because only one small trial assessed this outcome (very serious imprecision), which was assessed as high risk of bias for blinding, we graded the quality of the evidence as 'very low' (summary of findings Table 3).
Respiratory depression
Three trials with 687 women (400 remifentanil, 287 epidural) investigated the occurrence of respiratory depression defined as either less than eight breaths/minute (Freeman 2015; Stocki 2014) or less than nine breaths/minute (Tveit 2012). The trial from Tveit 2012 did not detect any event in either group and Freeman 2015 did not detect any event in the epidural group. Zero events in both arms were not estimable with Review Manager 5 and were ignored in the meta‐analysis, which revealed no evidence of effect for remifentanil to increase the risk for respiratory depression when compared to epidural analgesia (RR 1.52, 95% CI 0.23 to 9.90; I2 = 50%, Analysis 3.3). A pooled effect of all three trials that demonstrated no difference between both interventions in terms of risk of respiratory depression could be estimated by using the TSA software and the application of a constant continuity correction of 0.01 for zero event handling in both arms (RR 0.91, 95% CI 0.51 to 1.62; I2 = 0%, Table 10). 'Risk of bias' assessment resulted in one trial judged as high risk for selection bias (Freeman 2015), all trials as high risk for blinding, and two trials as high risk for attrition bias (Freeman 2015; Tveit 2012). In trials with low or unclear risk of bias, no difference between both interventions in terms of risk of respiratory depression was obtained (selection bias: RR 0.91, 95% CI 0.52 to 1.61 (Table 2) and attrition bias: RR 0.91, 95% CI 0.39 to 2.10 (Table 4)). Trial sequential analysis on all three trials, independent of the 'Risk of bias' assessment, showed that with 'low risk of bias'‐based and with 'empirical' assumptions the RIS was 4986 (Table 5) and 2.5 E6 participants (Table 6), respectively. The RIS was not reached and the TSMB were not crossed indicating that insufficient information was retained to confirm evidence of no effect.
We graded the quality of evidence for the outcome 'respiratory depression' as 'low' (downgrade for quality and downgrade for imprecision; summary of findings Table 3).
Oxygen desaturation (SpO2 < 92%)
Three trials with 774 women, 446 in the remifentanil (PCA) and 328 in the epidural group, reported on oxygen desaturation defined as SpO2 < 92% (Douma 2015; Freeman 2015; Tveit 2012). Random‐effects meta‐analysis revealed a strongly increased risk for oxygen desaturation in women with remifentanil (PCA) analgesia when compared to women with an epidural (RR 3.24, 95% CI 1.66 to 6.32; I2 = 52%, Analysis 3.4, fixed‐effect model RR 3.46, 95% CI 2.32 to 5.16, Table 9). We detected substantial statistical heterogeneity. The I2 was decreased to 24% when excluding Tveit 2012, which had no limit regarding remifentanil administration. One trial reported zero events in the epidural group (Tveit 2012). The estimated effect was robust when using a constant continuity correction of 0.01 to handle zero event trials; however, the I2 was reduced to 0% (RR 2.88, 95% CI 1.94 to 4.27; I2 = 0%, Table 10). One trial was assessed as high risk for allocation concealment (Freeman 2015). Exclusion of this trial impacted on the robustness of the results in which evidence of effect for the high risk of oxygen desaturation in the remifentanil (group) was no longer present (RR 5.83, 95% CI 0.40 to 84.06, Table 2). Moreover, all three trials were assessed as high risk of bias for blinding and incomplete outcome data (Table 3; Table 4).
Oxygen desaturation (SpO2 < 95%, < 94%)
Three trials including 800 women, 458 in the remifentanil (PCA) and 342 in the epidural group, reported on oxygen desaturation defined as either SpO2 < 94% (Stocki 2014) or SpO2 < 95% (Freeman 2015; Volmanen 2008). In Stocki 2014, all women in both groups received continuous supplementary oxygen (2 L/min) throughout the respiratory monitoring period. In a random‐effects meta‐analysis a strongly increased risk of oxygen desaturation in women with remifentanil (PCA) analgesia was found when compared to women with epidural analgesia (RR 3.27, 95% CI 2.32 to 4.61; I2 = 3%, Analysis 3.5 fixed‐effect model RR 3.30, 95% CI 2.43 to 4.49, Table 9). 'Risk of bias' assessment for oxygen desaturation resulted in one trial assessed as high risk of selection bias (Freeman 2015), two trials as high risk of bias for blinding (Freeman 2015; Stocki 2014), and two trials as high risk of attrition bias (Freeman 2015; Volmanen 2008). In trials with low or unclear risk of bias evidence of effect for remifentanil (PCA) to increase the risk of oxygen desaturation when compared to epidural/CSE was more increased (selection bias: RR 5.44, 95% CI 2.11 to 14.02 (Table 2), blinding: RR 11.38, 95% CI 1.62 to 79.78 (Table 3), attrition bias: RR 4.33, 95% CI 1.47 to 12.79 (Table 4)).
Hypotension
Four trials including 823 women (458 remifentanil, 365 epidural) reported on hypotension defined either as systolic blood pressure of < 90 mmHg (Freeman 2015) or as > 25% decrease from baseline systolic blood pressure (Stourac 2014); two trials did not define hypotension (Douma 2011; El‐Kerdawy 2010). Two trials detected events in either the remifentanil (PCA) (Stourac 2014) or the epidural group (El‐Kerdawy 2010), and one trial did not detect any event of hypotension in both arms (Douma 2011). Using Review Manager 5 which ignores studies with zero events in both arms revealed no evidence of effect that remifentanil (PCA) was associated with a decreased risk for hypotension compared to epidural analgesia (RR 0.58, 95% CI 0.22 to 1.49; I2 = 17%, Analysis 3.6). However, when meta‐analysis was performed by using the TSA software, which allows a constant continuity correction of 0.01 for zero event handling in both arms, evidence of effect was found for remifentanil (PCA) to decrease the risk for hypotension in comparison to epidural analgesia (RR 0.59, 95% CI 0.37 to 0.94, Table 10). One trial was assessed as high risk for selection and attrition bias (Freeman 2015), one for attrition bias (Stourac 2014); all trials were judged as high risk for blinding. Exclusion of high risk of bias trials revealed no evidence of effect for remifentanil (PCA) to decrease the risk for hypotension compared to epidural analgesia, however, with an unreliably wide CI (selection bias: RR 0.57, 95% CI 0.00 to 2.4E7 (Table 2), attrition bias: RR 0.01, 95% CI 0.00 to 7.8E7 (Table 4)).
Bradycardia
Two trials with 44 women reported on bradycardia defined either as a heart rate of less than 50 beats/minute (Stourac 2014) or without definition (Douma 2011). In none of the women in either group of both trials was bradycardia detected (Analysis 3.7); the pooled effect could be estimated by using the TSA software, which allows a constant continuity correction of 0.01 for zero event handling in both arms, which yielded an unreliably wide CI (RR 1.00, 95% CI 0.00 to 1.0E12, Table 10). One trial was assessed as high risk for attrition bias (Stourac 2014) and both trials were judged as high risk for blinding; the estimated effect was robust with respect to all sensitivity analyses performed (Table 9; Table 3; Table 4).
Nausea
Eight trials including 1909 women (807 remifentanil, 1102 epidural/CSE) provided data on nausea (Douma 2011; Douma 2015; El‐Kerdawy 2010; Freeman 2015; Ismail 2012; Stocki 2014; Tveit 2012; Volmanen 2008). Random‐effects meta‐analysis showed that remifentanil (PCA) was associated with a increased risk of suffering from nausea compared to epidural/CSE (RR 1.49, 95% CI 1.19 to 1.86; I2 = 0%, Analysis 3.8, fixed‐effect model RR 1.53, 95% CI 1.22 to 1.91, Table 9). 'Risk of bias' assessment resulted in one trial judged as high risk for selection bias (Freeman 2015), seven trials as high risk for blinding, (Douma 2011; Douma 2015; El‐Kerdawy 2010; Freeman 2015; Ismail 2012; Stocki 2014; Tveit 2012), and four trials as high risk for attrition bias (Douma 2015; Freeman 2015; Tveit 2012; Volmanen 2008). The effect estimate was robust with respect to the 'selection bias' sensitivity analysis (RR 1.41, 95% CI 1.09 to 1.83 (Table 2). However, evidence of effect for remifentanil (PCA) to increase the risk for nausea compared to epidural analgesia was no longer present when only trials with low or unclear risk for blinding (RR 3.94, 95% CI 0.96 to 16.22 (Table 3)) or attrition bias were pooled (RR 1.27, 95% CI 0.82 to 1.98, Table 4).
Vomiting
Six trials with 1840 women (773 remifentanil, 1067 epidural/CSE) reported data on vomiting (Douma 2011; Douma 2015; El‐Kerdawy 2010; Freeman 2015; Ismail 2012; Tveit 2012). The random‐effects meta‐analysis revealed that remifentanil (PCA) was associated with a higher risk of vomiting compared to epidural/CSE (RR 1.63, 95% CI 1.25 to 2.13; I2 = 0%, Analysis 3.9, fixed‐effect model RR 1.62, 95% CI 1.24 to 2.10, Table 9). 'Risk of bias' assessment resulted in one trial judged as high risk for selection bias (Freeman 2015), and four trials as high risk for attrition bias (Douma 2015; Freeman 2015; Tveit 2012; Volmanen 2008); all trials were assessed as high risk of bias for blinding. The effect estimate was robust with respect to the 'selection bias' sensitivity analysis (RR 1.82, 95% CI 1.29 to 2.57 (Table 2). However, evidence of effect for remifentanil (PCA) to increase the risk of vomiting compared to epidural analgesia was no longer present when only trials with low or unclear risk for attrition bias were meta‐analysed (RR 1.54, 95% CI 0.75 to 3.14, Table 4).
Pruritus
Seven trials including 1852 women (777 remifentanil, 1075 epidural/CSE) provided data on pruritus (Douma 2011; Douma 2015; El‐Kerdawy 2010; Freeman 2015; Ismail 2012; Stocki 2014; Tveit 2012). Meta‐analysis showed no evidence of effect for remifentanil (PCA) to reduce the risk to suffer from pruritus (random‐effects model RR 0.75, 95% CI 0.48 to 1.18; I2 = 29%, Analysis 3.10, fixed‐effect model RR 0.76, 95% CI 0.54 to 1.07, Table 9). One trial reported zero events in the remifentanil (PCA) group (Tveit 2012). The estimated effect was robust when using a constant continuity correction of 0.01 to handle zero event trials (RR 0.78, 95% CI 0.51 to 1.18, Table 10). 'Risk of bias' assessment for pruritus resulted in one trial assessed as high risk of selection bias (Freeman 2015) and two trials as high risk of attrition bias (Freeman 2015; Tveit 2012); sensitivity analysis has no impact on robustness of the estimated effect (Table 2; Table 4). All trials were assessed as high risk of bias for blinding (Table 3).
Sedation
Three trials including 148 women reported on sedation scores one hour after onset of analgesia (Douma 2011; Douma 2015; El‐Kerdawy 2010). Random‐effects meta‐analysis revealed evidence of effect for remifentanil (PCA) to increase mean sedation scores when compared with epidural analgesia (SMD 0.71, 95% CI 0.03 to 1.39; I2 = 68%, Analysis 3.11). Substantial statistical heterogeneity was detected (I2 = 68%) and decreased to 0% when excluding Douma 2015 without clinical explanation. All studies were assessed as low or unclear risk of bias for selection and attrition bias (Table 2; Table 4); and all trials were judged as high risk of bias for blinding (Table 3).
Adverse events for the newborn
We could not identify any studies reporting on the outcome 'NACS'.
Apgar score ≤ seven at five minutes
Five trials with 1322 newborns (470 remifentanil, 852 epidural/CSE) provided data on Apgar scores at five minutes; four of the five trials reported the number of newborns with an Apgar score ≤ seven (Douma 2011; Douma 2015; El‐Kerdawy 2010) or less than seven (Ismail 2012) at five minutes; one trial was dichotomised for the present meta‐analysis because Apgar scores at five minutes were reported as median with IQR along with the information in the text that all newborns had Apgar scores less than eight at five minutes (Stocki 2014). Two trials detected events in either the remifentanil (PCA) (Douma 2015) or the epidural group (Douma 2011) and two trials did not detect any newborn in both groups with an Apgar score ≤ seven (El‐Kerdawy 2010; Stocki 2014). Using Review Manager 5 which ignores studies with zero events in both arms, there was no evidence of effect that remifentanil (PCA) was associated with an increased risk for newborns to have Apgar scores ≤ seven compared to epidural analgesia (RR 1.28, 95% CI 0.65 to 2.51; I2 = 0%, Analysis 3.12). The estimated effect was robust with respect to inclusion of studies with zero events in both arms and a constant continuity correction of 0.01 (RR 1.26, 95% CI 0.62 to 2.57, Table 10). Two trials were assessed as high risk of attrition bias (Douma 2011; Douma 2015); sensitivity analysis did not reveal an impact on the robustness of the estimated effect (Table 4). All trials were judged as low risk for selection bias (Table 2) and as high risk of bias for blinding (Table 3).
Trial sequential analysis on all five trials, independent of the 'Risk of bias' assessment, showed that with 'low risk of bias'‐based and with 'empirical' assumptions, the RIS was 29,000 (Table 5) and 34,000 newborns (Table 6), respectively. With 1322 newborns the RIS was not reached and the TSMB were not crossed indicating that insufficient information was retained to confirm evidence of no effect.
We graded the quality of evidence for the outcome 'Apgar score ≤ seven at five minutes' as 'low' (downgrade for quality and downgrade for imprecision; summary of findings Table 3).
Apgar score at five minutes
Three trials with 137 newborns reported on mean Apgar scores at five minutes (Douma 2011; Douma 2015; Stourac 2014). When all trials were pooled in a random‐effects meta‐analysis there was no difference between remifentanil (PCA) and epidural analgesia with respect to mean Apgar scores at five minutes postpartum (MD 0.06, 95% CI ‐0.27 to 0.39; I2 = 0%, Analysis 3.13). 'Risk of bias' assessment for Apgar score at five minutes resulted in all three trials assessed as high risk of bias for blinding (Table 3) and incomplete outcome data (Table 4).
Need for naloxone
Two trials including 1170 newborns (395 remifentanil, 775 epidural/CSE) analysed the rate of need for naloxone (El‐Kerdawy 2010; Ismail 2012). One trial did not detect any event in the remifentanil group (El‐Kerdawy 2010), and the other trial did not detect any event of naloxone usage in both arms (Douma 2011), which was not estimable with Review Manager 5 (RR 0.20, 95% CI 0.01 to 3.85; I2 = 0%, Analysis 3.14). A pooled effect of both trials could be estimated by using the TSA software, which allows a constant continuity correction of 0.01 for zero event handling in both arms; there was no evidence of effect that remifentanil (PCA) was associated with a decreased risk of need for naloxone compared to epidural analgesia, however, with an unreliably wide CI (RR 0.02, 95% CI 0.00 to 1.6E8, Table 10). Both trials were assessed for 'need for naloxone' as low or unclear risk of selection and attrition bias (Table 2; Table 4); all trials were judged as high risk of bias for blinding (Table 3).
FHR/CTG abnormalities, non‐reassuring fetal status
Five studies including 1280 newborns (449 remifentanil, 831 epidural/CSE) provided data on FHR/CTG abnormalities (El‐Kerdawy 2010; Stourac 2014; Tveit 2012; Volmanen 2008) or non‐reassuring fetal status (Ismail 2012). Random‐effects meta‐analysis revealed no evidence of effect for remifentanil (PCA) to increase the risk for FHR/CTG abnormalities or non‐reassuring fetal status (RR 1.55, 95% CI 0.49 to 4.92; I2 = 48%, Analysis 3.15, fixed‐effect model RR 1.38, 95% CI 0.84 to 2.25, Table 9). One trial reported zero events in the remifentanil (PCA) group (El‐Kerdawy 2010). The estimated effect was robust when using a constant continuity correction of 0.01 to handle zero event trials (RR 1.88, 95% CI 0.63 to 5.61, Table 10). 'Risk of bias' assessment resulted in four trials assessed as high risk of bias for blinding (El‐Kerdawy 2010; Ismail 2012; Stourac 2014; Tveit 2012) and three trials as high risk for attrition bias (Stourac 2014; Tveit 2012; Volmanen 2008). The estimated effect was not robust when trials with unclear risk of bias for blinding (RR 11.38, 95% CI 1.62 to 79.78, Table 3) or low risk for attrition bias were pooled (RR 0.87, 95% CI 0.41 to 1.87, Table 4).
Secondary outcomes
We could not identify any studies reporting on 'breastfeeding initiation'.
Pain intensity (pain score 'early' at one hour)
Six trials including 235 women (115 remifentanil, 120 epidural) provided data on pain intensity at one hour after onset of analgesia (Douma 2011; Douma 2015; El‐Kerdawy 2010; Stocki 2014; Stourac 2014; Tveit 2012). Random‐effects meta‐analysis showed that epidural analgesia was more favourable in lowering the standardised mean pain scores at one hour when compared to remifentanil (PCA) analgesia (SMD 0.57, 95% CI 0.31 to 0.84; I2 = 0%, Analysis 3.16, fixed‐effect model SMD 0.57, 95% CI 0.31 to 0.84, Table 9). 'Risk of bias' assessment resulted in three trials assessed as high risk for attrition bias (Douma 2011; Stourac 2014; Tveit 2012). The effect estimate was robust with respect to sensitivity analysis (Table 4). All trials were judged as high risk of bias for blinding (Table 3). The OIS was estimated at 458 women using optimal information size considerations anticipating a minimal clinically relevant difference of 1 cm (VAS 0 to 10 cm) and a control mean pain score of 2.3 cm (Table 7). Including all six trials with 235 women, independent of the 'Risk of bias' assessment, sufficient information was not available to confirm evidence of effect for epidural analgesia to decrease pain intensity when compared to remifentanil (PCA).
We graded the quality of evidence for the outcome 'pain score 'early'' as 'low' (downgrade for quality and downgrade for imprecision; summary of findings Table 3).
Pain intensity (pain score 'late' at two hours)
Four trials with 143 women reported on pain intensity at two hours after onset of analgesia (Douma 2011; Douma 2015; Stocki 2014; Tveit 2012). In a random‐effects meta‐analysis epidural analgesia was associated with a strong effect on pain reduction when compared to remifentanil (PCA) (SMD 1.46, 95% CI 0.66 to 2.26; I2 = 71%, Analysis 3.17). There was substantial statistical heterogeneity in the analysis (I2 = 71%). Excluding Douma 2011 decreased the heterogeneity to 0% without clinical explanation.
Additional analgesia required (escape analgesia)
Six studies including 1037 women (543 remifentanil, 494 epidural) offered participants the possibility on request to cross‐over to the other treatment arm and provided data suitable for meta‐analysis (Douma 2011; Douma 2015; Evron 2008; Freeman 2015; Stocki 2014; Tveit 2012). Overall, in all trials the risk for women in the remifentanil (PCA) group was remarkably higher to cross‐over to the epidural than the other way around in a random‐effects meta‐analysis (RR 8.10, 95% CI 3.50 to 18.75; I2 = 0%, Analysis 3.18, fixed‐effect model RR 10.86, 95% CI 4.37 to 26.95, Table 9). One trial (Evron 2008) reported zero events in both arm and two trials reported zero events in the epidural group (Douma 2011; Tveit 2012); the estimated effect was robust when random‐effects meta‐analysis was performed by using the TSA software, which allows a constant continuity correction of 0.01 for zero event handling in both arms (RR 9.27, 95% CI 3.73 to 23.03, Table 10). 'Risk of bias' assessment for this outcome resulted in one trial assessed as high risk of selection and attrition bias (Freeman 2015); the estimated effect was robust with respect to corresponding sensitivity analyses (RR 5.29, 95% CI 1.2 to 23.3, Table 2; Table 4). All trials were assessed as high risk of bias for blinding (Table 3). Trial sequential analysis on all six trials, independent of the 'Risk of bias' assessment, showed that with 'low risk of bias'‐based and with 'empirical' assumptions the RIS was 449 (Table 5) and 394 participants (Table 6), respectively. In both cases the RIS was crossed with 1037 women indicating that sufficient information was retained to confirm evidence of effect for remifentanil (PCA) to be associated with a higher risk to cross‐over to the epidural group compared to cross‐over in the opposite direction.
We graded the quality of evidence for the outcome 'Additional analgesia required (escape analgesia)' as 'moderate' (downgrade for quality; summary of findings Table 3).
Rate of caesarean delivery
Nine trials with 1578 women (570 remifentanil, 1008 epidural/CSE) provided data on the rates of caesarean delivery (Douma 2011; Douma 2015; El‐Kerdawy 2010; Evron 2008; Ismail 2012; Stocki 2014; Stourac 2014; Tveit 2012; Volmanen 2008). Random‐effects meta‐analysis revealed no difference in the risk for caesarean delivery associated with both interventions (RR 0.99, 95% CI 0.81 to 1.21; I2 = 0%, Analysis 3.19, fixed‐effect model RR 0.96, 95% CI 0.79 to 1.18, Table 9). One trial reported zero events in the remifentanil (PCA) group (Stocki 2014). The estimated effect was robust when using a constant continuity correction of 0.01 to handle zero event trials (RR 1.0, 95% CI 0.82 to 1.22, Table 10). 'Risk of bias' assessment resulted in eight trials judged as high risk for blinding (Douma 2011; Douma 2015; El‐Kerdawy 2010; Evron 2008; Ismail 2012; Stocki 2014; Stourac 2014; Tveit 2012) and five trials as high risk for attrition bias (Douma 2011; Douma 2015; Stourac 2014; Tveit 2012; Volmanen 2008). The estimated effect was robust with respect to all sensitivity analyses performed (blinding: RR 0.88 95% CI 0.06 to 13.14 (Table 3); attrition bias: RR 1.02 95% CI 0.83 to 1.25 (Table 4). Trial sequential analysis on all trials, independent of the 'Risk of bias' assessment, showed that with 'clinically relevant' assumptions, the RIS was calculated to be at 924 participants (Table 5). The RIS was crossed with 1578 women indicating that sufficient information was retained to confirm lack of effect for remifentanil (PCA) to increase or decrease the rate of caesarean deliveries compared to an epidural.
We graded the quality of evidence for the outcome 'rate of caesarean delivery' as 'moderate' (downgrade for quality; summary of findings Table 3).
Rate of assisted birth
Eight trials with 1550 women (557 remifentanil, 993 epidural/CSE) reported on the rate of assisted birth; one trial reported on forceps delivery (Evron 2008), one on ventouse and forceps delivery (Tveit 2012), two on vacuum extraction (Stocki 2014; Volmanen 2008), and four on non‐defined instrumental delivery (Douma 2011; Douma 2015; El‐Kerdawy 2010; Ismail 2012). Random‐effects meta‐analysis showed no evidence of effect for remifentanil (PCA) to decrease the risk for assisted birth when compared to the epidural/CSE group (RR 0.92, 95% CI 0.66 to 1.26; I2 = 0%, Analysis 3.20). One trial reported zero events in the remifentanil (PCA) group (El‐Kerdawy 2010). The estimated effect was robust when using a constant continuity correction of 0.01 to handle zero event trials (RR 0.94, 95% CI 0.68 to 1.30, Table 10).
Augmented labour
Six trials including 1379 women analysed augmentation of labour by use of oxytocin (Douma 2011; Douma 2015; Ismail 2012; Stocki 2014; Tveit 2012; Volmanen 2008). The pooled meta‐analysis revealed no significant effect for remifentanil (PCA) to lower the risk for augmentation of labour when compared with epidural/CSE (RR 0.91, 95% CI 0.82 to 1.02; I2 = 0%, Analysis 3.21). However, the CI and the distribution of the studies in the forest plot revealed at least a good chance for a reduced risk of labour augmentation in women with remifentanil (PCA).
Umbilical cord base excess (artery)
Three trials with 75 participants reported on umbilical cord base excess (artery) (Douma 2011; Stocki 2014; Tveit 2012). The normal range of arterial cord blood base excess is defined as ‐8.6 to ‐2.6 mmol/L (base deficit: 2.6 to 8.6 mmol/L) (Victory 2004). Only one trial reported a mean base deficit outside the range (Douma 2011; remifentanil (PCA): 11.1 mmol/L, epidural: 8.8 mmol/L); all other reported data were within normal limits. Random‐effects meta‐analysis revealed a larger mean base deficit under remifentanil (PCA) when compared to epidural analgesia (MD ‐0.97, 95% CI ‐2.65 to 0.72; I2 = 29%, Analysis 3.22).
Umbilical cord base excess (venous)
Two trials with 129 women provided data on umbilical cord base excess (venous) (Douma 2015; Tveit 2012). The normal range of venous cord blood base excess is defined as ‐6.9 to ‐2.1 mmol/L (base deficit: 2.1 to 6.9 mmol/L) (Victory 2004). All reported mean base deficits were in the normal range. Random‐effects meta‐analysis revealed no difference in the mean base deficit under remifentanil (PCA) when compared to epidural analgesia with substantial statistical heterogeneity (MD ‐0.05, 95% CI ‐2.39 to 2.30; I2 = 74%, Analysis 3.23).
Umbilical cord pH (artery)
Five trials including 1245 women reported on umbilical cord pH (artery) (Douma 2011; El‐Kerdawy 2010; Ismail 2012; Stocki 2014; Tveit 2012). The normal range of arterial cord blood pH is defined as 7.17 to 7.31 (Victory 2004). Only one trial reported a mean cord blood pH outside the range (Douma 2011; remifentanil (PCA): 7.14); all other reported data lay in between. Random‐effects meta‐analysis revealed lower mean pH values under remifentanil (PCA) when compared to epidural (MD ‐0.01, 95% CI ‐0.02 to ‐0.00; I2 = 0%, Analysis 3.24). However, the upper CI reached the line of no effect and a mean difference of ‐0.01 was not considered as clinically relevant.
Umbilical cord pH (venous)
Four trials including 1299 women provided data on umbilical cord pH (venous) (Douma 2015; El‐Kerdawy 2010; Ismail 2012; Tveit 2012). The normal range of venous cord blood pH is defined as 7.27 to 7.39 (Victory 2004). Only one trial reported mean cord pH values outside the range (Douma 2011; remifentanil (PCA): 7.23, epidural: 7.21); all other reported data lay in between. Random‐effects meta‐analysis revealed no evidence of effect that mean pH values were higher under remifentanil (PCA) when compared to epidural analgesia (MD 0.01, 95% CI ‐0.01 to 0.02; I2 = 57%, Analysis 3.25). There is substantial statistical heterogeneity (I2 = 57%).
Need for neonatal resuscitation
Two trials with 69 newborns reported on neonatal resuscitation with either mechanical ventilation (El‐Kerdawy 2010) or manual ventilation (Stocki 2014). A random‐effects meta‐analysis showed no difference in the risk for neonatal resuscitation between remifentanil (PCA) and epidural analgesia (RR 1.02, 95% CI 0.04 to 25.09; I2 = 57%, Analysis 3.26). There is substantial statistical heterogeneity in the analysis (I2 = 57%). Two trials reported zero events in either the remifentanil (PCA) group (El‐Kerdawy 2010) or the epidural group (Stocki 2014). The estimated effect was robust when using a constant continuity correction of 0.01 to handle zero event trials; however, the I2 was reduced to 0% (RR 1.03, 95% CI 0.00 to 3.4E8; I2 = 0%, Table 10).
Remifentanil (PCA) compared to remifentanil (continuous IV)
Two trials compared remifentanil (PCA) to remifentanil (continuous IV) (Khooshideh 2015; Shen 2013).
Primary outcomes
Satisfaction with pain relief
None of the trials reported data on overall satisfaction with pain relief which were suitable for quantitative meta‐analysis of the present review.
Adverse events for women
We could not identify any studies reporting on 'apnoea'.
Respiratory depression
Two trials with 135 participants provided data on respiratory depression defined as a respiratory rate of less than eight breaths/minute (Khooshideh 2015; Shen 2013). Both trials reported that none of the participants in either group had a respiratory depression during the study period (Analysis 4.1); the pooled effect could be estimated by using the TSA software, which allows a constant continuity correction of 0.01 for zero event handling in both arms (RR 0.98, 95% CI 0.00 to 1.0E12, I2 = 0%, Table 10). Both trials were assessed as low or unclear risk of selection bias; one trial was at high risk of bias for blinding (Khooshideh 2015); and the other trial was assessed as high risk of attrition bias (Shen 2013); the estimated effect was robust with respect to all sensitivity analyses performed (Table 3; Table 4). Trial sequential analysis on both trials, independent of the 'Risk of bias' assessment, showed that with 'low risk of bias'‐based and with 'empirical' assumptions the RIS was 3.4 E6 (Table 5) and 1.0 E7 participants (Table 6), respectively. The RIS was not reached and the TSMB were not crossed indicating that insufficient information was retained to confirm evidence of no effect.
We graded the quality of evidence for the outcome 'respiratory depression' as 'low' (downgrade for quality, downgrade for imprecision; summary of findings Table 4).
Oxygen desaturation (SpO2 < 95%)
One trial with 53 women assessed oxygen desaturation defined as SpO2 < 95% (Shen 2013). Three out of 27 women in the remifentanil (PCA) group and five out of 26 women in the remifentanil (continuous IV) group had an oxygen saturation below 95% (P = 0.659) (Analysis 4.2).
Hypotension
Two trials with 135 women reported on hypotension defined either as a systolic blood pressure of less than 90 mm Hg (Khooshideh 2015) or without definition (Shen 2013). Both trials reported that none of the women in either group had hypotension during the study period (Analysis 4.3). The pooled effect could be estimated by using the TSA software, which allows a constant continuity correction of 0.01 for zero event handling in both arms which yielded an unreliably wide CI (RR 0.98, 95% CI 0.00 to 1.0E12, I2 = 0%, Table 10). Both trials were assessed as low or unclear risk of selection bias; one trial was at high risk of bias for blinding (Khooshideh 2015); and the other trial was assessed as high risk of attrition bias (Shen 2013); the estimated effect was robust with respect to all sensitivity analyses performed (Table 3; Table 4).
Bradycardia
Two trials including 135 women reported on bradycardia defined as a heart rate of less than 50 beats/minute (Khooshideh 2015) or without definition (Shen 2013). Both trials reported that none of the participants in either group suffered from bradycardia during the study period (Analysis 4.4). The pooled effect could be estimated by using the TSA software, which allows a constant continuity correction of 0.01 for zero event handling in both arms which yielded an unreliably wide CI (RR 0.98, 95% CI 0.00 to 1.0E12, I2 = 0%, Table 10). Both trials were assessed as low or unclear risk of selection bias; one trial was at high risk of bias for blinding (Khooshideh 2015); and the other trial was assessed as high risk of attrition bias (Shen 2013); the estimated effect was robust with respect to all sensitivity analyses performed (Table 3; Table 4).
Nausea (and vomiting)
Two studies with 135 women provided data on either nausea (Shen 2013) or (combined) nausea and vomiting (Khooshideh 2015). Random‐effects meta‐analysis revealed no evidence of effect for remifentanil (PCA) to reduce the risk for nausea (and vomiting) in women compared to remifentanil (continuous IV) (RR 0.85, 95% CI 0.28 to 2.54; I2 = 45%, Analysis 4.5). Both trials were assessed as low or unclear risk of selection bias; one trial was at high risk of bias for blinding (Khooshideh 2015); and the other trial was assessed as high risk of attrition bias (Shen 2013); the estimated effect was not robust with respect to the sensitivity analyses performed (blinding: RR 0.53, 95% CI 0.21 to 1.39, Table 3; attrition bias: RR 1.67, 95% CI 0.43 to 6.52, Table 4).
Pruritus
One trial including 53 women assessed the risk of pruritus (Shen 2013). There was no difference in the occurrence of pruritus between remifentanil (PCA) (one out of 27 women) compared to remifentanil (continuous IV) (two out of 26 women) (P = 0.973) (Analysis 4.6).
Sedation
One trial including 53 women reported on sedation scores one hour after onset of analgesia (Shen 2013). The median Ramsay sedation score with IQR in both groups was reported as 3 (3 ‐ 3) (P = 0.573) (Analysis 4.7).
Adverse events for the newborn
We could not identify any studies reporting on the outcomes 'Apgar score ≤ seven at five minutes', 'Apgar score at five minutes', and 'NACS'.
Need for naloxone
Two trials with 135 women reported on the rate of newborns with need for naloxone (Khooshideh 2015; Shen 2013). Both trials reported that none of the newborns in either group required naloxone (Analysis 4.8). Tthe pooled effect could be estimated by using the TSA software, which allows a constant continuity correction of 0.01 for zero event handling in both arms which yielded an unreliably wide CI (RR 0.98, 95% CI 0.00 to 1.0E12, I2 = 0%, Table 10). Both trials were assessed as low or unclear risk of selection bias; one trial was at high risk of bias for blinding (Khooshideh 2015); and the other trial was assessed as high risk of attrition bias (Shen 2013); the estimated effect was robust with respect to all sensitivity analyses performed (Table 3; Table 4).
FHR/CTG abnormalities, non‐reassuring fetal status
One trial with 53 newborns provided data on non‐reassuring fetal status (Shen 2013). Four cases in the remifentanil (PCA) group and five in the remifentanil (continuous IV) group had non‐reassuring FHR tracings (transient fetal bradycardia) (P = 0.950) (Analysis 4.9).
Secondary outcomes
We could not identify any studies reporting on 'rate of caesarean delivery', 'rate of assisted birth', 'breastfeeding initiation', 'umbilical cord base excess/pH', and 'augmented labour'.
Pain intensity (pain score 'early' at one hour)
One trial reported on median pain scores (with IQR) at one hour after onset of analgesia (Shen 2013). Women in the remifentanil (continuous IV) group had higher pain scores (4 (3 ‐ 5), VAS 0 to 10 cm) compared to women in the remifentanil (PCA) group (3 (2 ‐ 4)) (P < 0.01) (Analysis 4.10). Because only one small trial assessed this outcome (very serious imprecision) with high risk of attrition bias which strongly limits the evidence, we graded the quality of the evidence as 'very low' (summary of findings Table 4).
Pain intensity (pain score 'late' at two hours)
One trial with 53 women provided data on pain scores at two hours after onset of analgesia (Shen 2013). There was no significant difference in pain scores between the remifentanil (PCA) group (4 (3 ‐ 5), median (IQR), VAS 0 to 10 cm) and the remifentanil (continuous IV) group (5 (4 ‐ 6), P > 0.01) (Analysis 4.11).
Additional analgesia required (escape analgesia)
One trial with 59 women reported on the rate of women requiring additional analgesia (Shen 2013). Two women in the remifentanil (PCA) group and four women in the remifentanil (continuous IV) group required an additional epidural because of inadequate analgesia (Analysis 4.12). Because only one small trial (very serious imprecision) with high risk of attrition bias assessed this outcome which strongly limits the evidence, we graded the quality of the evidence as 'very low' (summary of findings Table 4).
Neonatal resuscitation
One study with 53 newborns assessed the outcome 'neonatal resuscitation' and reported that none of the newborns in either group required resuscitation (Analysis 4.13) (Shen 2013).
Remifentanil (PCA, increasing bolus, fixed infusion dose) compared to remifentanil (PCA, increasing infusion, fixed bolus dose)
One trial compared remifentanil (PCA, IB (increasing bolus dose, fixed infusion dose)) to remifentanil (PCA, IF (increasing infusion dose, fixed bolus dose)) (Balki 2007).
Primary outcomes
Satisfaction with pain relief
One trial with 20 women reported on overall satisfaction with pain relief (Balki 2007); woman's satisfaction scores were similar in the remifentanil (PCA, IB) group (8.6 +/‐ 1.2, verbal numerical rating scale (VNRS) 0 to 10, mean +/‐ SD) and the remifentanil (PCA, IF) group (8.4 +/‐ 1.1) (P = 0.77) (Analysis 5.1). Because only one small trial assessed this outcome (very serious imprecision), which strongly limits the evidence, we graded the quality of the evidence as 'low' (summary of findings Table 5).
Adverse events for women
We could not identify any study reporting on the outcome 'apnoea', 'respiratory depression', and 'sedation'.
Oxygen desaturation (SpO2 < 95%)
One trial with 20 women reported on oxygen desaturation defined as SpO2 < 95% (Balki 2007); six out of 10 women in the remifentanil (PCA, IB) group and four out of 10 women in the remifentanil (PCA, IF) group had oxygen saturation levels below 95% (P = 0.42) (Analysis 5.2).
Hypotension
One trial with 20 women reported on hypotension (Balki 2007); none of the women suffered from hypotension in both groups (Analysis 5.3).
Bradycardia
One trial with 20 women reported on bradycardia (Balki 2007); none of the women had bradycardia in both groups (Analysis 5.4).
Nausea
One trial with 20 women reported on nausea (Balki 2007); six out of 10 women in the remifentanil (PCA, IB) group and two out of 10 women in the remifentanil (PCA, IF) group suffered from nausea (P = 0.095) (Analysis 5.5).
Vomiting
One trial with 20 women reported on vomiting (Balki 2007); four out of 10 women in the remifentanil (PCA, IB) group and one out of 10 women in the remifentanil (PCA, IF) group vomited (P = 0.17) (Analysis 5.6).
Pruritus
One trial with 20 women reported on the occurrence of pruritus (Balki 2007); only one woman in the remifentanil (PCA, IB) group suffered from pruritus (P = 0.5) (Analysis 5.7).
Adverse events for the newborn
We could not identify any studies reporting on the outcomes 'Apgar score at five minutes' and 'NACS'.
Apgar score ≤ seven at five minutes
Balki 2007 reported that all 20 newborns had an Apgar score ≥ seven at five minutes (Analysis 5.8). Because only one small trial assessed this outcome (very serious imprecision), which strongly limits the evidence, we graded the quality of the evidence as 'low' (summary of findings Table 5).
Need for naloxone
One trial with 20 newborns reported on requirement for naloxone (Balki 2007); none of the newborns in either group required naloxone (Analysis 5.9).
FHR/CTG abnormalities, non‐reassuring fetal status
One trial with 20 women reported on non‐reassuring FHR (Balki 2007); two out of 10 newborns in the remifentanil (PCA, IB) group and one out of 10 newborns in the remifentanil (PCA, IF) group showed non‐reassuring FHR traces (P = 0.61) (Analysis 5.10).
Secondary outcomes
We could not identify any studies reporting on 'pain intensity (pain score 'early' at one hour)', 'pain intensity (pain score 'late' at two hours)', 'rate of assisted birth', and 'breastfeeding initiation'.
Additional analgesia required (escape analgesia)
One trial with 20 women reported on the need for an additional epidural (Balki 2007); only one woman in the remifentanil (PCA, IF) group crossed over to the epidural (Analysis 5.11). Because only one small trial assessed this outcome (very serious imprecision), which strongly limits the evidence, we graded the quality of the evidence as 'low' (summary of findings Table 5).
Rate of caesarean delivery
One trial with 20 women provided data on the rate of caesarean delivery (Balki 2007); four women in each group delivered by caesarean section (Analysis 5.12). Because only one small trial assessed this outcome (very serious imprecision), which strongly limits the evidence, we graded the quality of the evidence as 'low' (summary of findings Table 5).
Augmented labour
One trial with 20 women reported on augmentation of labour (Balki 2007); three out of 10 women in the remifentanil (PCA, IB) group and seven out of 10 women in the remifentanil (PCA, IF) group needed augmentation of labour (P = 0.14) (Analysis 5.13).
Umbilical cord base excess (artery)
One trial with 20 women reported on umbilical cord base excess (artery) (Balki 2007); there were no differences between the remifentanil (PCA, IB) group (‐4.3 +/‐ 3.2 mmol/L) and the remifentanil (PCA, IF) group (‐4.6 +/‐ 2.0 mmol/L) and the mean values lay in normal ranges (Victory 2004) (P = 0.60) (Analysis 5.14).
Umbilical cord base excess (venous)
One trial with 20 women reported on umbilical cord base excess (venous) (Balki 2007); there were no differences between the remifentanil (PCA, IB) group (‐4.7 +/‐ 3.5 mmol/L) and the remifentanil (PCA, IF) group (‐4.1 +/‐ 2.3 mmol/L) and the mean values lay in normal ranges (Victory 2004) (P = 0.91) (Analysis 5.15).
Umbilical cord pH (artery)
One trial with 20 women reported on umbilical cord pH (artery) (Balki 2007); there were no differences between the remifentanil (PCA, IB) group (7.24 +/‐ 0.08) and the remifentanil (PCA, IF) group (7.25 +/‐ 0.05) and the mean values lay in normal ranges (Victory 2004) (P = 0.70) (Analysis 5.16).
Umbilical cord pH (venous)
One trial with 20 women reported on umbilical cord pH (venous) (Balki 2007); there were no differences between the remifentanil (PCA, IB) group (7.27 +/‐ 0.08) and the remifentanil (PCA, IF) group (7.29 +/‐ 0.05) and the mean values lay in normal ranges (Victory 2004) (P = 0.92) (Analysis 5.17).
Need for neonatal resuscitation
One trial with 20 newborns reported on the need for neonatal resuscitation (Balki 2007); one newborn in the remifentanil (PCA, IF) group had to be resuscitated (P = 0.50) (Analysis 5.18).
Remifentanil (PCA) compared to nitrous oxide (or other forms of inhalational analgesia)
No trials were identified which compared remifentanil (PCA) to nitrous oxide (or other forms of inhalational analgesia).
Remifentanil (PCA) compared to placebo or no treatment
No trials were identified which compared remifentanil (PCA) to placebo or no treatment.
Discussion
Summary of main results
The present systematic review reveals several important findings about the administration of remifentanil (PCA) for labour analgesia when compared to different control interventions with respect to the general superiority or inferiority across all analysed outcomes. The results suggest that remifentanil (PCA) is superior to the administration of other opioids (IV/IM) or other opioids (PCA) and inferior to epidural or combined spinal‐epidural analgesia (CSE) with regard to the overall direction of estimated effects for most outcomes which are of interest for this review (Figure 4). However, there are outcome‐specific variations in the quality level of evidence (GRADE) ranging from 'very low' to 'moderate' by which the confidence in the estimated effects varies from 'very little confidence and the true effect is likely to be substantially different from the estimate of effect' to 'moderately confident that the true effect lies close the estimated effect'. In the case of the other comparators, namely remifentanil (continuous IV) and remifentanil (different administration mode) there is currently only a limited number of studies available for which reason we are not able to reliably estimate the direction of effects, which limits the quality of evidence (Figure 4). We could not identify any randomised controlled trial (RCT) eligible for inclusion that compares remifentanil (PCA) to either inhalational anaesthesia or placebo treatment. Therefore, this review does not provide reliable evidence for those comparisons.
For the main comparison of the current review, remifentanil (PCA) versus another opioid (IV/IM), we were able to include four studies and the quality levels of evidence for GRADE‐relevant outcomes ranged from 'very low' to 'moderate' (summary of findings Table for the main comparison). Satisfaction with pain relief was higher (SMD 2.11, 95% CI 0.72 to 3.49) and pain intensity 'early' was lower (SMD ‐1.58, 95% CI ‐2.69 to ‐0.48) in the remifentanil group compared to the other opioid (IV/IM) group. Superiority was clinically relevant in both cases with a SMD of 2.11 higher for satisfaction and 1.58 lower for pain intensity, which is equivalent to a range of 2.74 to 4.68 cm and 1.26 to 2.8 cm on a visual analogue scale (VAS) 0 to 10 cm scale, respectively. However, the quality of evidence was 'very low' for both satisfaction and pain intensity 'early'. Women in the remifentanil group had a reduced requirement for additional analgesia (RR 0.57, 95% CI 0.40 to 0.81) with moderate‐quality evidence. From the meta‐analysis for the risk of caesarean delivery, there was no evidence of effect for remifentanil (PCA) to reduce the risk for caesarean section (RR 0.63, 95% CI 0.30 to 1.32, constant continuity correction (ccc) = 0.01). Quality of evidence for rate of caesarean section was graded as 'low'. Sparse data (one study) were available describing adverse events for women as well as for newborns. In one trial of remifentanil (PCA) versus another opioid (IM), three out of 18 women in the remifentanil and none out of 18 in the control group had a respiratory depression. Another trial of remifentanil (PCA) compared to another opioid (IV) reported the risk for newborns with Apgar scores less than seven at five minutes with zero events in both study arms and no reliable conclusion could be reached. Quality of evidence was graded as 'very low' for both 'maternal respiratory depression' and 'Apgar score less than seven at five minutes'; no study investigating the comparison of interest reported on the risk for apnoea associated with both interventions.
For the second comparison remifentanil (PCA) versus another opioid (PCA), we included three trials and the quality levels of evidence for the GRADE‐relevant outcomes were graded as 'very low' or 'low' (summary of findings Table 2). For the outcome satisfaction with pain relief we identified only one relevant study reporting higher satisfaction under remifentanil (PCA) and the quality of evidence was graded as 'very low'. Pain intensity 'early' was lower in the remifentanil (PCA) group when compared to the other opioid (PCA) group (SMD ‐0.51, 95% CI ‐1.01 to ‐0.00). The effect was equivalent to a range of 1.13 to 1.46 cm on a VAS 0 to 10 cm scale and was assessed as clinically relevant. However, the quality of evidence was graded as 'very low'. There is no evidence of effect that remifentanil (PCA) reduced the requirements for additional analgesia when compared to other opioids (PCA) (RR 0.76, 95% CI 0.45 to 1.28). Quality of evidence was graded as 'low'. The meta‐analysis on the risk of caesarean delivery suggested that remifentanil (PCA) strongly increased the risk for caesarean sections compared to other opioids (PCA) (RR 2.78, 95% CI 0.99 to 7.82). However, the 95% CI crossed the line of no effect (RR = 1). Quality of evidence for rate of caesarean delivery was graded as 'very low'. There were very few data available on adverse events for women and newborns. No study could be identified that investigated 'apnoea' or 'maternal respiratory depression' in labouring women for this comparison. Only one trial analysed 'Apgar score less than seven at five minutes' and reported that three out of eight newborns in the pethidine (PCA) group and none in the remifentanil (PCA) group had an Apgar score of less than seven at five minutes. Quality of evidence was graded as 'very low'.
Ten trials were included in the comparison of remifentanil (PCA) versus epidural/CSE, which is the highest number of identified trials for a comparison in the current review. The quality of evidence for GRADE‐relevant outcomes ranged from 'very low' to 'moderate' (summary of findings Table 3). Satisfaction with pain relief was lower (SMD ‐0.22, 95% CI ‐0.40 to ‐0.04) and pain intensity 'early' was higher (SMD 0.57, 95% CI 0.31 to 0.84) in the remifentanil (PCA) group compared to the epidural/CSE group with a quality of evidence level of 'very low' and 'low', respectively. A SMD of 0.22 lower for satisfaction and 0.57 higher for pain intensity is equivalent to a range of 0.15 to 0.61 cm and 0.57 to 1.43 cm on a VAS 0 to 10 cm scale, respectively, which can be regarded as moderate effects at best. Women using epidural/CSE for pain relief seemed to profit longer from analgesia compared to women in the remifentanil (PCA) group since pain intensity 'late' was lower in the control group with a SMD of 1.46 (95% CI 0.66 to 2.26), which is equivalent to a range of 1.9 to 4.1 cm on a VAS 0 to 10 cm scale. Moreover, women in the remifentanil (PCA) group had a strongly increased risk for requirement of additional analgesia (escape analgesia) (RR 9.27, 95% CI 3.73 to 23.03, ccc = 0.01) moderate‐quality evidence. There was evidence of no effect for remifentanil to increase or decrease the risk for caesarean delivery when compared to epidural/CSE (RR 1.0, 95% CI 0.82 to 1.22, ccc = 0.01), and we graded the quality of evidence as 'moderate'. For the GRADE‐relevant outcomes relevant to adverse events for women, maternal apnoea and respiratory depression, we could only include one and three trials, respectively. The only available study that investigated the risk for apnoea reported that half of the women in the remifentanil and none in the epidural group had an apnoea. The quality of evidence was graded as 'very low' for apnoea. For the risk of maternal respiratory depression, when trials that reported zero events in both arms were included, there was no difference between both interventions (RR 0.91, 95% CI 0.51 to 1.62, ccc = 0.01). We graded the quality of evidence as 'low' for respiratory depression. For the outcomes 'oxygen desaturation', 'nausea', 'vomiting', and 'sedation' epidural/CSE was found to be superior to remifentanil (PCA); whereas for 'hypotension', when all trials with zero events in both arms were included, remifentanil (PCA) was superior to epidural/CSE; for 'bradycardia' and 'pruritus', there was no evidence of effect for one of the two treatment alternatives. For all outcomes relevant to assess the adverse events on newborns associated with the interventions, there was no significant difference between remifentanil (PCA) and epidural/CSE detectable. However, we graded the quality of evidence for the estimated effect on 'Apgar score less than seven at five minutes' (RR 1.26, 95% CI 0.62 to 2.57, ccc = 0.01) as 'low'.
For the comparison remifentanil (PCA) versus remifentanil (continuous IV), we identified two relevant trials and the quality levels of evidence for the GRADE‐relevant outcomes were 'very low' or 'low' (summary of findings Table 4). No trial reported on satisfaction with pain relief and only one trial provided data on both pain intensity 'early' (less pain in the remifentanil (PCA) group) and 'additional analgesia' (more women required additional analgesia in the remifentanil (continuous IV) group). For the last two outcomes the quality of evidence was graded as 'very low'. Sparse data were available describing adverse events for women as well as for newborns. No study investigating the comparison of interest reported on the risk for apnoea for women or risk for newborns to have an Apgar score less than seven at five minutes associated with both interventions. There is no difference in the risk for maternal respiratory depression between both interventions when all trials including those with zero events in both arms were meta‐analysed (RR 0.98, 95% CI 0.00 to 1.0E12, ccc = 0.01). Quality of evidence was graded as 'low' for 'respiratory depression'. For the outcomes 'hypotension', 'bradycardia', 'nausea and vomiting', and 'need for naloxone' neither of these interventions could be identified as being superior to the other.
The comparison remifentanil (PCA with increasing bolus dose) versus remifentanil (PCA with increasing infusion dose) was reported by only one small trial that suggested remifentanil (PCA with increasing infusion dose) to be associated with fewer side effects for women. Nevertheless, the quality level of evidence was 'low' for the reported outcomes 'satisfaction', 'additional analgesia', 'rate of caesarean delivery', and 'Apgar scores less than seven at five minutes' (summary of findings Table 5).
Overall completeness and applicability of evidence
The investigated groups of participants were relatively homogeneous. High‐risk parturients and pregnancies were excluded in all studies except one (women with pre‐eclampsia, El‐Kerdawy 2010) that were examined in the current review. Women had to be healthy (without systemic or serious diseases) and had to have an uncomplicated cephalic presentation. Pregnancies were all at full term with the exception of two studies that included women from 32 weeks of gestation (El‐Kerdawy 2010; Freeman 2015). Thus, results can be adapted to low‐risk, but not equally to high‐risk groups which we also planned to analyse.
Most studies were conducted in Europe (11 trials) or the Middle East (six trials). All other geographical regions were underrepresented. Results may differ across the globe due to various clinical standards and settings. More studies in other parts of the world have to be carried out to detect differences or similarities regarding outcomes with remifentanil (PCA).
In half of all studies remifentanil PCA was compared to epidural analgesia so that this comparison group provided reliable results at least for some outcomes. For other interventions results have to be considered with caution because only a few studies investigated alternatives for labour analgesia.
Furthermore, all included trials displayed many differences regarding the conduct of their studies, despite investigating the same intervention. When analysing these and comparing the conclusions it has to be taken into account that ‘remifentanil (PCA)’ may not be ‘remifentanil (PCA)’ due to widely differing dosing regimen. Bolus applications, lockout times and also concomitant medications (e.g. Entonox) varied across all studies. The discrepancies may appear small since several trials have investigated regimens for remifentanil application (e.g. dose‐finding studies) which functioned as guidance for the studies included in the current review. Nevertheless, there was heterogeneity in conducting the studies that cannot be neglected. No general conclusion can be drawn and further studies with comparable designs have to be conducted. It seems essential in order to obtain more reliable effect estimates, to include at least a core set of outcomes of interest for efficacy and harm (GRADE‐relevant outcomes), while concomitantly looking for more sophisticated study‐endpoints.
Quality of the evidence
The body of evidence identified by this review is based on 20 studies with 3569 participating women. Fifty per cent (10 studies: 2983 participants) of the identified trials compared remifentanil (PCA) to epidural/CSE, 20% (four studies: 216 parturients) to another opioid (IV/IM), 15% (three studies: 215 parturients) to another opioid (PCA), 10% (two studies: 135 parturients) to remifentanil (IV), and 5% (one study: 20 parturients) to remifentanil (different administration regimen). No trials were identified that analysed remifentanil (PCA) versus inhalational analgesia other than in a cross‐over approach or placebo/no treatment. Trial sequential analysis (TSA) and optimal information size (OIS) considerations for all analysable GRADE‐relevant outcomes across all comparisons identified five out of 14 outcomes ('1.1 Satisfaction with pain relief', '1.7 Additional analgesia required', '3.1 Satisfaction with pain relief', '3.17 Additional analgesia required', '3.18 Rate of caesarean delivery') for which sufficient information was obtained based on the assumptions made in the current review. For the remaining nine outcomes 13% to 95% of information is still lacking and, therefore, effect as well as lack of effect cannot be excluded.
From a strict methodological point of view the majority of included studies must be considered of rather poor quality. However, looking at the challenges for trials in the labour setting, many attempts need to be acknowledged to achieve as much of the suggested quality criteria as possible to reduce the risk of bias. Especially, blinding and incomplete outcome data reporting are problematic aspects, for which 65% and 45% of the included studies, respectively, were judged to be at 'high risk of bias'. When looking at the rather poor quality assessments based on the lack of efficient blinding, it has to be taken into account that the high rate of unblinded or not efficiently blinded studies is mostly attributable to the different natures of the compared interventions (e.g. IV PCA application versus epidural) and, therefore, not a direct sign for poor study quality (even though there seems to be room for improvement; see Implications for research). Nonetheless, risk of bias is present in those studies and study results may be influenced by lack of efficient blinding. Selection bias plays a role for the largest study (Freeman 2015), because allocation concealment was uncovered for participants and personnel before the start of treatment. To take into account the limitations in study quality, we performed sensitivity analyses for selection bias, performance and detection bias, as well as for attrition bias and downgraded the quality of evidence for GRADE‐relevant outcomes by one level if substantial information was derived from studies at high risk of bias, and by two levels if there also was an impact on the robustness of the estimated effect.
Substantial statistical heterogeneity (I2 > 50%) between studies was detected in 11 out of 36 (30%) primary and GRADE‐relevant outcomes with at least two included trials across all comparisons. As only one of those outcomes included seven studies and all other outcomes included ≤ four studies, we decided not to perform subgroup analyses as an attempt to explain heterogeneity because we wanted to avoid spurious findings. In all cases of substantial statistical heterogeneity of GRADE‐relevant outcomes we downgraded the quality of evidence for inconsistency.
Publication bias could not be investigated in the current version of this review since the largest number of studies included in a single outcome was nine ('rate of caesarean delivery'). The predefined requirement in the protocol to perform further analysis on publication bias and small‐study effects was a number of at least 10 studies per outcome. For future updates, if the number of included studies is increased, we will analyse publication bias with funnel plots and regression tests.
Potential biases in the review process
This review was performed according to procedures described in the Cochrane Handbook for Systematic Reviews of Interventions (Higgins 2011). In addition to the search of the Cochrane Pregnancy and Childbirth Group’s Trials Register, we searched ClinicalTrials.gov, the WHO International Clinical Trials Registry Platform (ICTRP) and congress proceedings for unpublished, planned and ongoing trial reports and abstracts. We contacted authors with published study protocols and asked for the actual status and if there were data available for inclusion in the current review. Therefore, we can be confident that all trials that fit our criteria were identified.
All processes in the review were checked twice by two independent authors. In case of disagreement, a third and fourth review author were involved. The author review group consists of several experts in the field (PK, LE, AA, NP) who are in contact with those performing clinical research in the field. The two authors who were responsible for independent data extraction and critical appraisal (SW, YJ) come from various areas of research which are not directly related to interventions of interest (research associate, physician), whereby potential prejudice was minimised. All authors were not blinded regarding authorship of the included trials.
If there were missing outcome data in the trial without reasons declared, we did not contact the authors for further information (e.g. reasons for missing outcome data) since we wanted to prevent reporting bias. We just used published outcome data. Contact with authors was made in case of unknown sample sizes (e.g. sample size was not reported for satisfaction or pain scores at one hour or two hours).
Several studies reported their data as median and interquartile ranges rather than as mean and standard deviation. We included these data if they were symmetric and converted them to mean and standard deviation by using the calculation described in the Cochrane Handbook for Systematic Reviews of Interventions (Higgins 2011).
Some data had to be extracted graphically (satisfaction, pain scores) and were checked independently by two review authors for correctness to ensure that deviations from actual findings were minimised.
At the protocol stage we did not plan to perform trial sequential analysis (TSA) and optimal information size (OIS) considerations to calculate the required information size (RIS) or OIS, respectively. However, we believe that those considerations help us to more reliably assess the quality of the evidence, especially in view of rather limited numbers of trials and participants which introduce a risk for spurious findings in the meta‐analyses. Therefore, we have incorporated the TSA and OIS approach into the assessment of 'imprecision' (GRADE). Since the assumptions for TSA and OIS calculations were made in a post‐hoc manner, we adopted the assumptions from the pooled estimates obtained from either 'low risk of bias' trials or all meta‐analysed trials ('empirical'). The assumptions may not perfectly meet the clinical practice and relevant differences in outcomes in every case, and occasionally may take into account a too large difference between the groups which does not match clinical experience. However, we considered it to be the most objective approach to set the basic conditions, especially in view of the fact that we retrospectively decided to include measures to assess the OIS.
Moreover, TSA or OIS considerations cannot consider risks of bias, wherefore trials at 'high risk of bias' should ideally not be included in the analyses. Due to the limited number of studies in this review in general and with a high proportion of studies at 'high risk of bias' (mainly performance, detection, and attrition bias), we decided to include all available studies independent of their risks of bias in the meta‐analysis. Furthermore, TSA in this review was based on assumptions gained from either all 'low risk of bias' studies or from the 'best' study (overall risk of bias) if no 'low risk of bias' study was available, and from all studies ('empirical') available for the respective outcome. Therefore, assumptions may itself be affected by bias and it is possible that smaller intervention effects may be more realistic whereby the required information sizes would be increased. These are undoubtedly limitations of the current review.
In the current review, we included all studies into meta‐analyses even if they had reported zero events in both arms. By inclusion of those studies we wanted to avoid creating a risk of inflating the magnitude of the pooled effect. The inclusion of zero total event trials enabled the estimation of a pooled effect by using the TSA software for six outcomes ('1.4 Pruritus', '3.6 Bradycardia', '4.1 Respiratory depression', '4.2 Hypotension', '4.3 Bradycardia', '4.5 Need for naloxone'), which were not estimable using Review Manager 5 (RevMan 2014). For two outcomes, either the 95% CI and the P value ('3.5 Hypotension') or the direction of the estimated effect ('3.4 Respiratory depression') were noticeably changed by inclusion of zero total event trials.
Agreements and disagreements with other studies or reviews
There are five other systematic reviews with or without meta‐analysis dealing with remifentanil for labour analgesia which have been published up to March 2016 (Leong 2011; Liu 2014; Schnabel 2011; Stourac 2016; Van de Velde 2015).
Leong 2011 searched five databases (MEDLINE, CINAHL, Embase, CENTRAL and Maternity and Infant Care databases) and handsearched from 1998 to 2010 for RCTs with women in labour comparing remifentanil (patient‐controlled or physician‐controlled) with meperidine (IM, IV or PCA). In contrast to the current review, no distinction was made regarding the way of remifentanil or meperidine administration. Reduction in pain scores was selected as the primary outcome (VAS 0 to 100 mm). Further outcomes were maternal side effects (sedation, oxygen desaturation, bradypnoea) and effects on the neonate (Apgar scores, umbilical cord pH, neurologic and adaptive capacity score (NACS)). Seven studies with 349 women met the inclusion criteria and three studies with 233 participants were meta‐analysed. All studies except one (Shahriari 2007), which dealt with anaesthetist‐administered remifentanil were also included in the present review. As a result Leong and colleagues reported that remifentanil decreased the mean VAS score at one hour by 25 mm compared to meperidine. This corresponds with the current result (summary of findings Table for the main comparison), which revealed a pain reduction of 1.26 cm to 2.8 cm on a VAS 0 to 10 cm scale at 30 minutes/one hour. Both Leong's and the present review could not draw definite conclusions with regard to maternal and neonatal side effects due to insufficient data. Leong and colleagues performed qualitative analysis while the current review conducted quantitative analysis. The authors also used the 'Risk of bias' assessment according to the Cochrane Handbook, therefore the current review contains a more critical judgement of 'Risk of bias'.
Liu 2014 performed a search in three databases (PubMed, Embase, and the Cochrane Library), as well as a handsearch until November 2012 for RCTs with women in labour comparing remifentanil (PCA) with epidural analgesia. The primary outcomes were pain scores at one and two hours. Nausea, vomiting, pruritus and umbilical cord artery pH values were defined as secondary outcomes. Five studies with 886 participants were included in qualitative and quantitative analyses, which were all the subject of the current review. The authors concluded that epidural analgesia led to greater pain relief than remifentanil (mean difference at one hour: 1.9 cm on a VAS 0 to 10 cm), but for secondary outcomes no definite results could be presented. The results on pain relief are more optimistic than the results in the present review with a range of pain increase from 0.57 cm to 1.43 cm on a VAS 0 to 10 cm when looking at remifentanil (PCA). The Cochrane 'Risk of bias' assessment as well as GRADE was performed. In these cases judgement of risk of bias as well as the quality of evidence was more critical in the current review.
Schnabel 2011 conducted a systematic search in two databases (the Cochrane Library and MEDLINE) until August 2011 for RCTs comparing remifentanil (PCA) with any other labour analgesia. The primary outcome was conversion to epidural analgesia. Pain scores after one hour were defined as secondary outcomes. Additionally, type of delivery, maternal satisfaction, and maternal and neonatal adverse events were examined. Twelve RCTs with 593 participants were included in the systematic review and 11 studies were subject to meta‐analyses. Two of the 12 trials were not included in the current review because of the cross‐over design (Volmanen 2005) and no patient‐controlled analgesia (Shahriari 2007). The authors drew the conclusion that remifentanil administration correlated with lower rates of conversion to epidural analgesia, lower mean pain scores at one hour (mean difference ‐2.17 cm) and higher satisfaction scores when compared to pethidine administration which was also shown in the current review. In comparison to epidural analgesia, remifentanil (PCA) was associated with higher pain scores after one hour (mean difference 1.89 cm), which is more optimistic than the results in the present review with a pain increase of 0.57 cm to 1.43 cm on a VAS 0 to 10 cm when looking at remifentanil (PCA). For all other outcomes mentioned above, no definite result could be found. Critical appraisal was made with the Oxford scale which has several drawbacks compared to the Cochrane 'Risk of bias' assessment tool.
Stourac 2016 searched four databases (US National Library of Medicine, PubMed, SCOPUS and Web of Science database) until December 2014 for RCTs that reported on remifentanil administration (PCA or continuous IV). There were 44 articles eligible and included in the review; 15 RCTs which reported VAS pain scores at 0 and one hours after the start of analgesia were analysed. Two of the 15 randomised trials were not included in the present review because of wrong intervention (PCA versus PCA, Balcioglu 2007) and cross‐over design (Volmanen 2005). Stourac's meta‐analysis revealed a significant decrease in VAS from 0 to one hour in the remifentanil group (summary fixed model ‐2.8). There was no comparison drawn between remifentanil and other interventions. There were no other outcomes meta‐analysed. It is not possible to make a point regarding agreements or disagreements with the current review.
Van de Velde 2015 found 36 studies which investigated remifentanil (PCA) for labour analgesia when performing a search in January 2015. No meta‐analysis was conducted, but results regarding analgesic efficacy, modalities of PCA delivery and maternal safety were qualitatively described. Three of the already mentioned reviews were included (Leong 2011; Liu 2014; Schnabel 2011) together with two RCTs (Shen 2013; Stocki 2014) which were also analysed in the present review. It was concluded that remifentanil PCA provided better pain relief than other opioids but was inferior to epidural analgesia. This result is consistent with the findings we made with quantitative analysis.
In summary, the previous reviews revealed similar effects of interventions (direction of estimated effects). However, the current review is more critical concerning the quality of the available evidence than any other previous review.
Inclusion of more recent studies on remifentanil for labour analgesia improved the precision and the external validity of the present review. In addition, the current review included zero total event trials into the meta‐analyses, analysed imprecision for each GRADE‐relevant outcome by TSA or OIS considerations, investigated robustness of the estimated effects by sensitivity analyses based on the result of the 'Risk of bias' assessment, and provides sufficient background information to the studies' details.

Study flow diagram.

'Risk of bias' summary: review authors' judgements about each risk of bias item for each included study.

'Risk of bias' graph: review authors' judgements about each risk of bias item presented as percentages across all included studies.

Abbreviations:
IV: intravenous; IM: intramuscular; PCA: patient‐controlled analgesia; CTG: cardiotocography; FHR: fetal heart rate; NACS: neonatal neurologic and adaptive capacity score; BE: base excess.
Direction of estimated effects (results of meta‐analyses) for all primary and secondary outcomes with two or more studies and level of evidence (GRADE) for all GRADE‐relevant, pre‐defined outcomes:
The direction of the estimated effects were labelled as green (favours remifentanil (PCA)), red (favours control), yellow (neither favour of remifentanil (PCA) nor control), (1) (only one RCT, no meta‐analysis performed), ∅ (no RCTs available).
The GRADE levels of the evidence were expressed as VERY LOW, LOW, MODERATE, and HIGH for all GRADE‐relevant outcomes (dark grey, bold). For details on GRADE levels of evidence see the summary of findings tables (summary of findings Table for the main comparison; summary of findings Table 2; summary of findings Table 3; summary of findings Table 4; summary of findings Table 5).
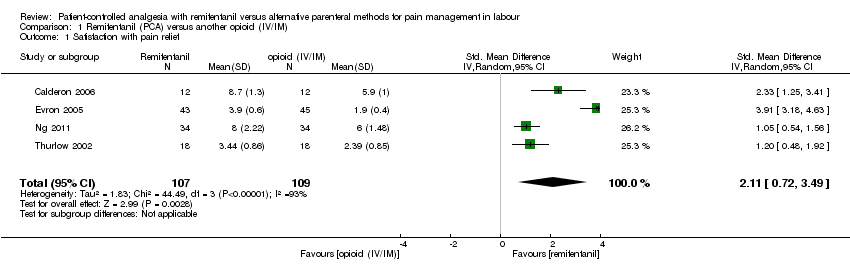
Comparison 1 Remifentanil (PCA) versus another opioid (IV/IM), Outcome 1 Satisfaction with pain relief.

Comparison 1 Remifentanil (PCA) versus another opioid (IV/IM), Outcome 2 Respiratory depression (< 8 breaths/min).
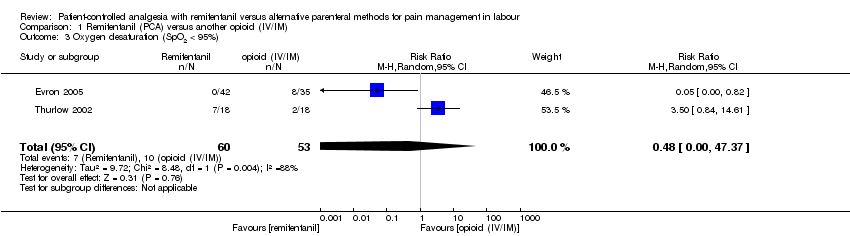
Comparison 1 Remifentanil (PCA) versus another opioid (IV/IM), Outcome 3 Oxygen desaturation (SpO2 < 95%).
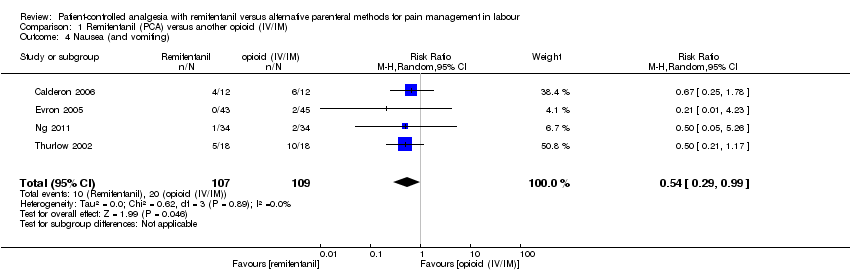
Comparison 1 Remifentanil (PCA) versus another opioid (IV/IM), Outcome 4 Nausea (and vomiting).

Comparison 1 Remifentanil (PCA) versus another opioid (IV/IM), Outcome 5 Vomiting.

Comparison 1 Remifentanil (PCA) versus another opioid (IV/IM), Outcome 6 Pruritus.

Comparison 1 Remifentanil (PCA) versus another opioid (IV/IM), Outcome 7 Sedation (1 h).

Comparison 1 Remifentanil (PCA) versus another opioid (IV/IM), Outcome 8 Apgar score < 7 at 5 min.

Comparison 1 Remifentanil (PCA) versus another opioid (IV/IM), Outcome 9 Apgar score at 5 min.
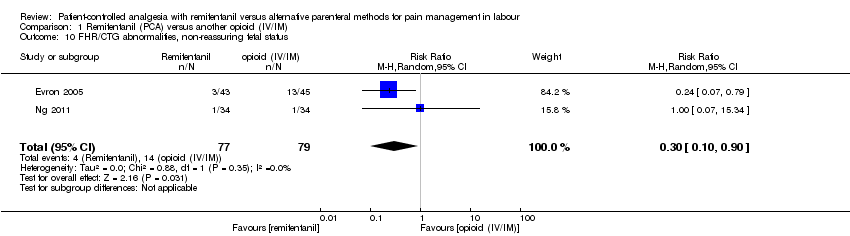
Comparison 1 Remifentanil (PCA) versus another opioid (IV/IM), Outcome 10 FHR/CTG abnormalities, non‐reassuring fetal status.
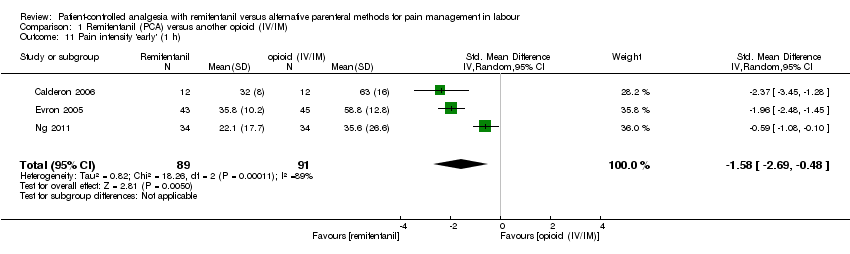
Comparison 1 Remifentanil (PCA) versus another opioid (IV/IM), Outcome 11 Pain intensity 'early' (1 h).

Comparison 1 Remifentanil (PCA) versus another opioid (IV/IM), Outcome 12 Pain intensity 'late' (2 h).

Comparison 1 Remifentanil (PCA) versus another opioid (IV/IM), Outcome 13 Additional analgesia required (escape analgesia).

Comparison 1 Remifentanil (PCA) versus another opioid (IV/IM), Outcome 14 Rate of caesarean delivery.
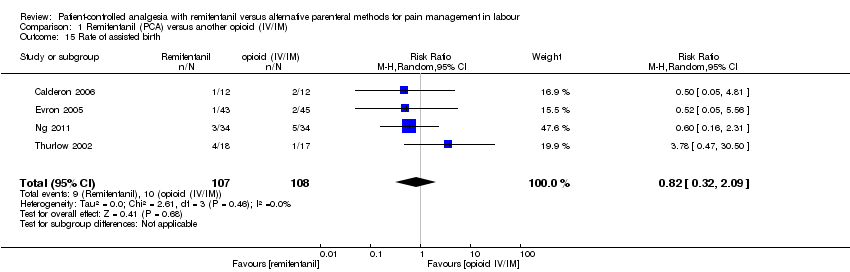
Comparison 1 Remifentanil (PCA) versus another opioid (IV/IM), Outcome 15 Rate of assisted birth.
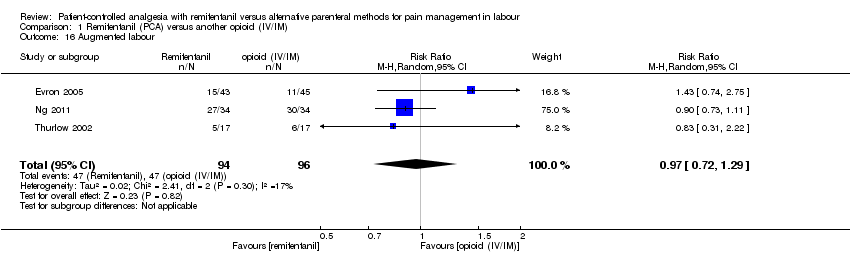
Comparison 1 Remifentanil (PCA) versus another opioid (IV/IM), Outcome 16 Augmented labour.

Comparison 1 Remifentanil (PCA) versus another opioid (IV/IM), Outcome 17 Breastfeeding initiation (feeding difficulties).

Comparison 2 Remifentanil (PCA) versus another opioid (PCA), Outcome 1 Satisfaction with pain relief.
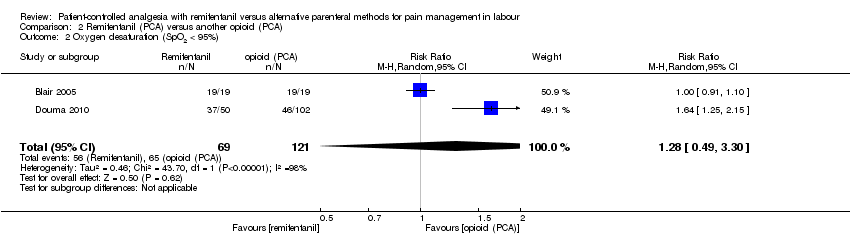
Comparison 2 Remifentanil (PCA) versus another opioid (PCA), Outcome 2 Oxygen desaturation (SpO2 < 95%).
Comparison 2 Remifentanil (PCA) versus another opioid (PCA), Outcome 3 Hypotension.

Comparison 2 Remifentanil (PCA) versus another opioid (PCA), Outcome 4 Bradycardia.
Comparison 2 Remifentanil (PCA) versus another opioid (PCA), Outcome 5 Nausea (and vomiting).

Comparison 2 Remifentanil (PCA) versus another opioid (PCA), Outcome 6 Pruritus.
Comparison 2 Remifentanil (PCA) versus another opioid (PCA), Outcome 7 Sedation (1 h).

Comparison 2 Remifentanil (PCA) versus another opioid (PCA), Outcome 8 Apgar score < 7 at 5 min.
Comparison 2 Remifentanil (PCA) versus another opioid (PCA), Outcome 9 Apgar score at 5 min.
Comparison 2 Remifentanil (PCA) versus another opioid (PCA), Outcome 10 Need for naloxone.

Comparison 2 Remifentanil (PCA) versus another opioid (PCA), Outcome 11 FHR/CTG abnormalities, non‐reassuring fetal status.

Comparison 2 Remifentanil (PCA) versus another opioid (PCA), Outcome 12 NACS at 15/30 min.

Comparison 2 Remifentanil (PCA) versus another opioid (PCA), Outcome 13 Pain intensity 'early' (30 min/1 h).
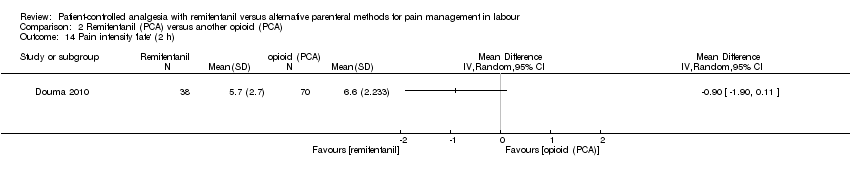
Comparison 2 Remifentanil (PCA) versus another opioid (PCA), Outcome 14 Pain intensity 'late' (2 h).
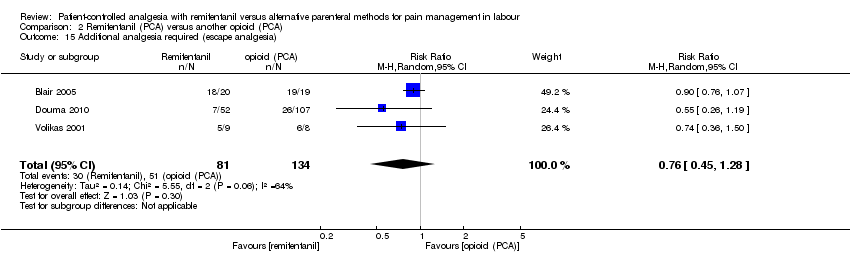
Comparison 2 Remifentanil (PCA) versus another opioid (PCA), Outcome 15 Additional analgesia required (escape analgesia).

Comparison 2 Remifentanil (PCA) versus another opioid (PCA), Outcome 16 Rate of caesarean delivery.

Comparison 2 Remifentanil (PCA) versus another opioid (PCA), Outcome 17 Rate of assisted birth.

Comparison 2 Remifentanil (PCA) versus another opioid (PCA), Outcome 18 Augmented labour.

Comparison 3 Remifentanil (PCA) versus epidural/combined spinal‐epidural analgesia (CSE), Outcome 1 Satisfaction with pain relief.
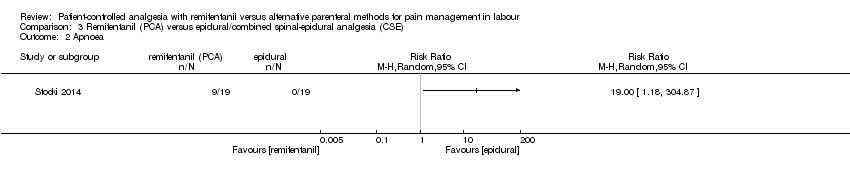
Comparison 3 Remifentanil (PCA) versus epidural/combined spinal‐epidural analgesia (CSE), Outcome 2 Apnoea.

Comparison 3 Remifentanil (PCA) versus epidural/combined spinal‐epidural analgesia (CSE), Outcome 3 Respiratory depression (< 9, < 8 breaths/min).
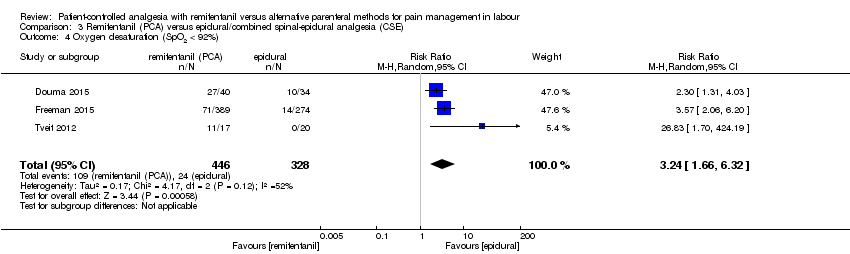
Comparison 3 Remifentanil (PCA) versus epidural/combined spinal‐epidural analgesia (CSE), Outcome 4 Oxygen desaturation (SpO2 < 92%).

Comparison 3 Remifentanil (PCA) versus epidural/combined spinal‐epidural analgesia (CSE), Outcome 5 Oxygen desaturation (SpO2 < 95%).

Comparison 3 Remifentanil (PCA) versus epidural/combined spinal‐epidural analgesia (CSE), Outcome 6 Hypotension.

Comparison 3 Remifentanil (PCA) versus epidural/combined spinal‐epidural analgesia (CSE), Outcome 7 Bradycardia.

Comparison 3 Remifentanil (PCA) versus epidural/combined spinal‐epidural analgesia (CSE), Outcome 8 Nausea.

Comparison 3 Remifentanil (PCA) versus epidural/combined spinal‐epidural analgesia (CSE), Outcome 9 Vomiting.

Comparison 3 Remifentanil (PCA) versus epidural/combined spinal‐epidural analgesia (CSE), Outcome 10 Pruritus.

Comparison 3 Remifentanil (PCA) versus epidural/combined spinal‐epidural analgesia (CSE), Outcome 11 Sedation (1 h).

Comparison 3 Remifentanil (PCA) versus epidural/combined spinal‐epidural analgesia (CSE), Outcome 12 Apgar score ≤ 7 (< 7) at 5 min.
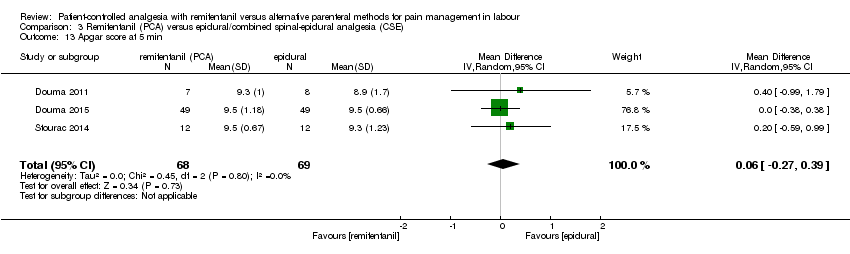
Comparison 3 Remifentanil (PCA) versus epidural/combined spinal‐epidural analgesia (CSE), Outcome 13 Apgar score at 5 min.

Comparison 3 Remifentanil (PCA) versus epidural/combined spinal‐epidural analgesia (CSE), Outcome 14 Need for naloxone.
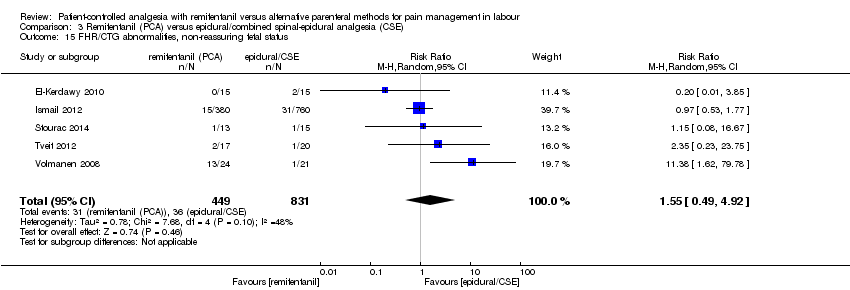
Comparison 3 Remifentanil (PCA) versus epidural/combined spinal‐epidural analgesia (CSE), Outcome 15 FHR/CTG abnormalities, non‐reassuring fetal status.

Comparison 3 Remifentanil (PCA) versus epidural/combined spinal‐epidural analgesia (CSE), Outcome 16 Pain intensity 'early' (1 h).
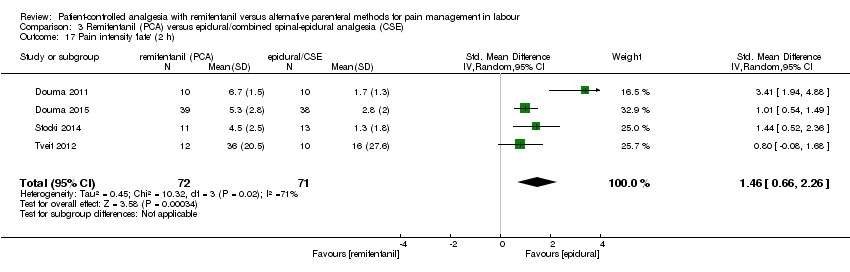
Comparison 3 Remifentanil (PCA) versus epidural/combined spinal‐epidural analgesia (CSE), Outcome 17 Pain intensity 'late' (2 h).

Comparison 3 Remifentanil (PCA) versus epidural/combined spinal‐epidural analgesia (CSE), Outcome 18 Additional analgesia required.

Comparison 3 Remifentanil (PCA) versus epidural/combined spinal‐epidural analgesia (CSE), Outcome 19 Rate of caesarean delivery.

Comparison 3 Remifentanil (PCA) versus epidural/combined spinal‐epidural analgesia (CSE), Outcome 20 Rate of assisted birth.

Comparison 3 Remifentanil (PCA) versus epidural/combined spinal‐epidural analgesia (CSE), Outcome 21 Augmented labour.
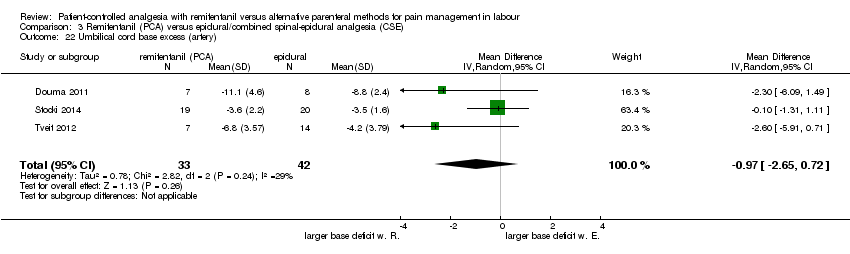
Comparison 3 Remifentanil (PCA) versus epidural/combined spinal‐epidural analgesia (CSE), Outcome 22 Umbilical cord base excess (artery).
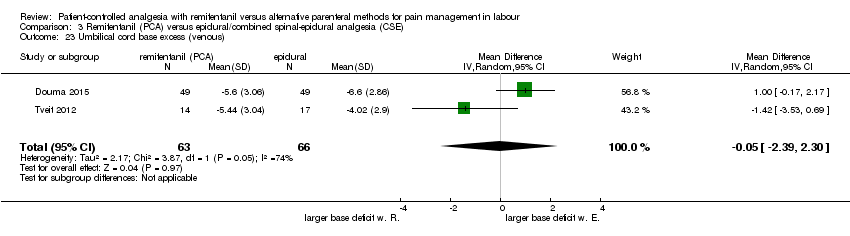
Comparison 3 Remifentanil (PCA) versus epidural/combined spinal‐epidural analgesia (CSE), Outcome 23 Umbilical cord base excess (venous).
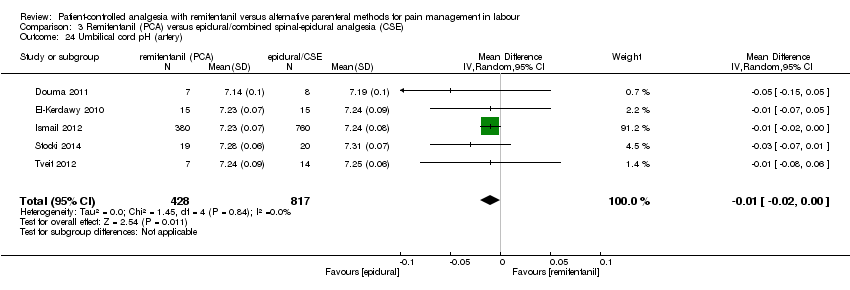
Comparison 3 Remifentanil (PCA) versus epidural/combined spinal‐epidural analgesia (CSE), Outcome 24 Umbilical cord pH (artery).

Comparison 3 Remifentanil (PCA) versus epidural/combined spinal‐epidural analgesia (CSE), Outcome 25 Umbilical cord pH (venous).

Comparison 3 Remifentanil (PCA) versus epidural/combined spinal‐epidural analgesia (CSE), Outcome 26 Neonatal resuscitation.

Comparison 4 Remifentanil (PCA) versus remifentanil (continuous IV), Outcome 1 Respiratory depression (< 8 breaths/min).
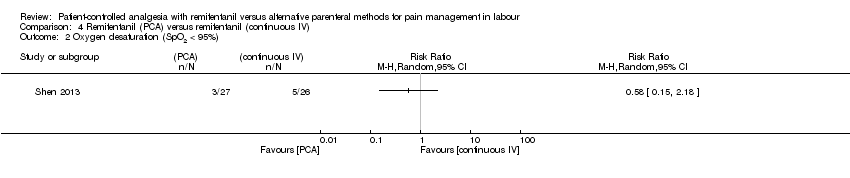
Comparison 4 Remifentanil (PCA) versus remifentanil (continuous IV), Outcome 2 Oxygen desaturation (SpO2 < 95%).

Comparison 4 Remifentanil (PCA) versus remifentanil (continuous IV), Outcome 3 Hypotension.

Comparison 4 Remifentanil (PCA) versus remifentanil (continuous IV), Outcome 4 Bradycardia.
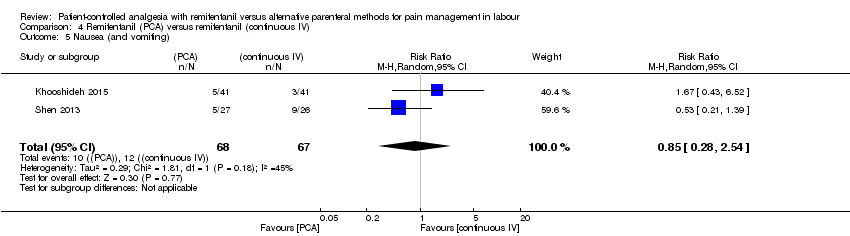
Comparison 4 Remifentanil (PCA) versus remifentanil (continuous IV), Outcome 5 Nausea (and vomiting).
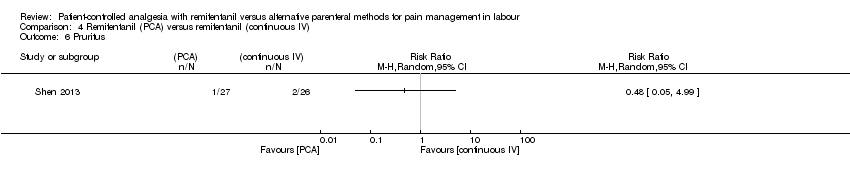
Comparison 4 Remifentanil (PCA) versus remifentanil (continuous IV), Outcome 6 Pruritus.
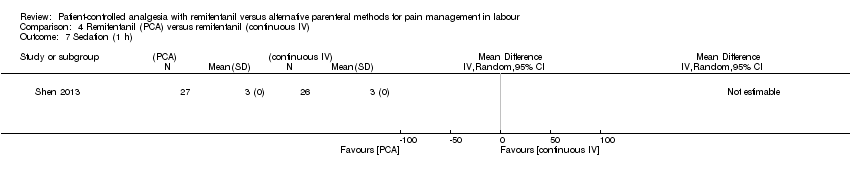
Comparison 4 Remifentanil (PCA) versus remifentanil (continuous IV), Outcome 7 Sedation (1 h).
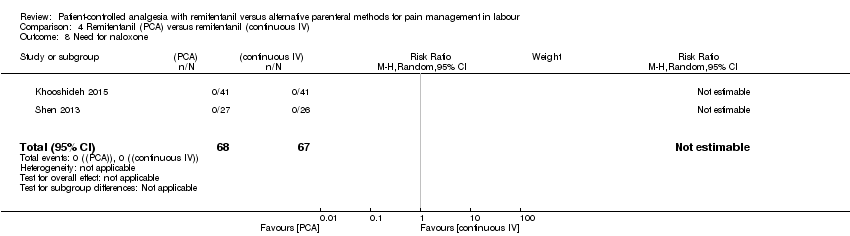
Comparison 4 Remifentanil (PCA) versus remifentanil (continuous IV), Outcome 8 Need for naloxone.

Comparison 4 Remifentanil (PCA) versus remifentanil (continuous IV), Outcome 9 FHR/CTG abnormalities, non‐reassuring fetal status.
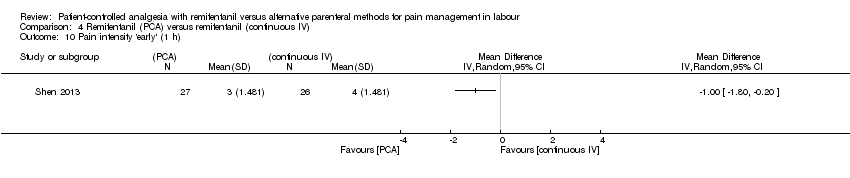
Comparison 4 Remifentanil (PCA) versus remifentanil (continuous IV), Outcome 10 Pain intensity 'early' (1 h).
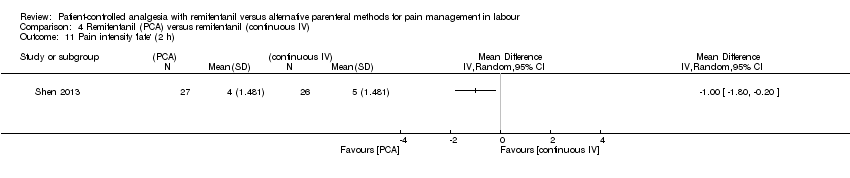
Comparison 4 Remifentanil (PCA) versus remifentanil (continuous IV), Outcome 11 Pain intensity 'late' (2 h).
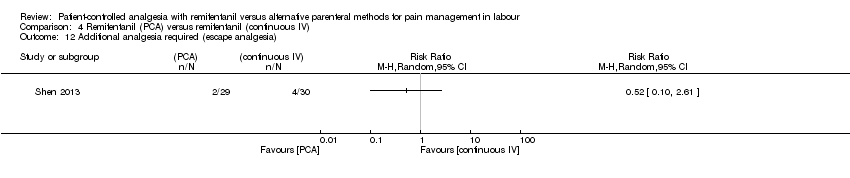
Comparison 4 Remifentanil (PCA) versus remifentanil (continuous IV), Outcome 12 Additional analgesia required (escape analgesia).
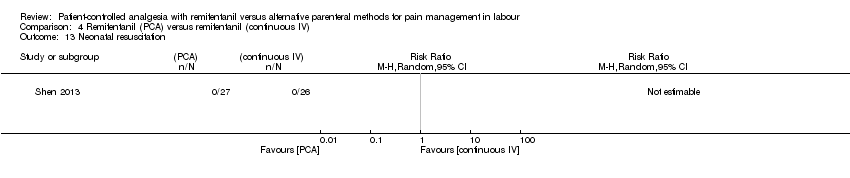
Comparison 4 Remifentanil (PCA) versus remifentanil (continuous IV), Outcome 13 Neonatal resuscitation.

Comparison 5 Remifentanil (PCA, increasing bolus, fixed infusion dose) versus remifentanil (PCA, increasing infusion, fixed bolus dose), Outcome 1 Satisfaction with pain relief.

Comparison 5 Remifentanil (PCA, increasing bolus, fixed infusion dose) versus remifentanil (PCA, increasing infusion, fixed bolus dose), Outcome 2 Oxygen desaturation (SpO2 < 95%).
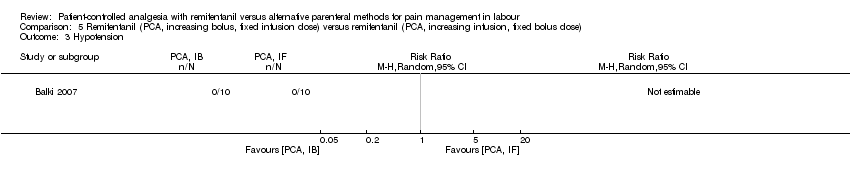
Comparison 5 Remifentanil (PCA, increasing bolus, fixed infusion dose) versus remifentanil (PCA, increasing infusion, fixed bolus dose), Outcome 3 Hypotension.

Comparison 5 Remifentanil (PCA, increasing bolus, fixed infusion dose) versus remifentanil (PCA, increasing infusion, fixed bolus dose), Outcome 4 Bradycardia.

Comparison 5 Remifentanil (PCA, increasing bolus, fixed infusion dose) versus remifentanil (PCA, increasing infusion, fixed bolus dose), Outcome 5 Nausea.

Comparison 5 Remifentanil (PCA, increasing bolus, fixed infusion dose) versus remifentanil (PCA, increasing infusion, fixed bolus dose), Outcome 6 Vomiting.

Comparison 5 Remifentanil (PCA, increasing bolus, fixed infusion dose) versus remifentanil (PCA, increasing infusion, fixed bolus dose), Outcome 7 Pruritus.

Comparison 5 Remifentanil (PCA, increasing bolus, fixed infusion dose) versus remifentanil (PCA, increasing infusion, fixed bolus dose), Outcome 8 Apgar score < 7 at 5 min.

Comparison 5 Remifentanil (PCA, increasing bolus, fixed infusion dose) versus remifentanil (PCA, increasing infusion, fixed bolus dose), Outcome 9 Need for naloxone.

Comparison 5 Remifentanil (PCA, increasing bolus, fixed infusion dose) versus remifentanil (PCA, increasing infusion, fixed bolus dose), Outcome 10 FHR/CTG abnormalities, non‐reassuring fetal status.

Comparison 5 Remifentanil (PCA, increasing bolus, fixed infusion dose) versus remifentanil (PCA, increasing infusion, fixed bolus dose), Outcome 11 Additional analgesia required (escape analgesia).
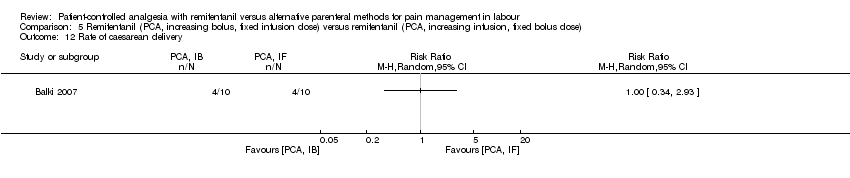
Comparison 5 Remifentanil (PCA, increasing bolus, fixed infusion dose) versus remifentanil (PCA, increasing infusion, fixed bolus dose), Outcome 12 Rate of caesarean delivery.
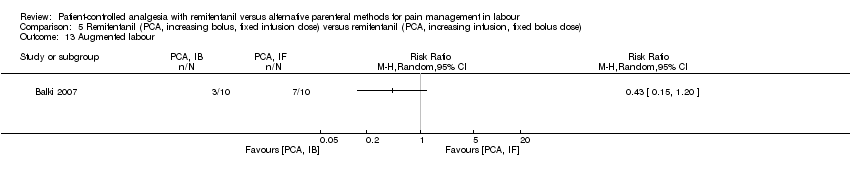
Comparison 5 Remifentanil (PCA, increasing bolus, fixed infusion dose) versus remifentanil (PCA, increasing infusion, fixed bolus dose), Outcome 13 Augmented labour.
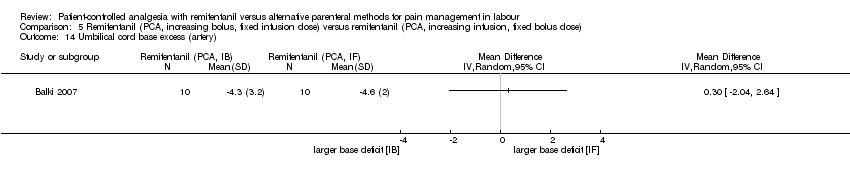
Comparison 5 Remifentanil (PCA, increasing bolus, fixed infusion dose) versus remifentanil (PCA, increasing infusion, fixed bolus dose), Outcome 14 Umbilical cord base excess (artery).

Comparison 5 Remifentanil (PCA, increasing bolus, fixed infusion dose) versus remifentanil (PCA, increasing infusion, fixed bolus dose), Outcome 15 Umbilical cord base excess (venous).

Comparison 5 Remifentanil (PCA, increasing bolus, fixed infusion dose) versus remifentanil (PCA, increasing infusion, fixed bolus dose), Outcome 16 Umbilical cord pH (artery).

Comparison 5 Remifentanil (PCA, increasing bolus, fixed infusion dose) versus remifentanil (PCA, increasing infusion, fixed bolus dose), Outcome 17 Umbilical cord pH (venous).

Comparison 5 Remifentanil (PCA, increasing bolus, fixed infusion dose) versus remifentanil (PCA, increasing infusion, fixed bolus dose), Outcome 18 Neonatal resuscitation.
| Remifentanil (PCA) compared to another opioid (IV/IM) for pain management in labour | ||||||
| Patient or population: women in labour with planned vaginal delivery | ||||||
| Outcomes | Anticipated absolute effects* (95% CI) | Relative effect | № of participants | Quality of the evidence | Comments | |
| Risk with another opioid (IV/IM) | Risk with remifentanil (PCA) | |||||
| Satisfaction (overall) with pain relief (VAS 0 to 10 cm, NRS 1 to 4, NRS 0 to 10, VRS 0 to 5) | see comment | The standardised mean satisfaction score in the intervention group was 2.11 higher (0.72 higher to 3.49 higher)** | ‐ | 216 | ⊕⊝⊝⊝ | A SMD of 2.11 higher is equivalent to a range of 2.74 cm higher (SD = 1.3) to 4.68 cm higher (SD = 2.22) on a VAS 0 to 10 cm scale in the intervention group. The mean satisfaction scores in the control group range from 4.23 to 6.0 cm.# ** |
| Pain intensity 'early' (30 min/1 h) (VAS 0 to 10 cm, VAS 0 to 100 cm) | see comment | The standardised mean pain score 'early' in the intervention group was 1.58 fewer (2.69 fewer to 0.48 fewer)*** | ‐ | 180 | ⊕⊝⊝⊝ | A SMD of 1.58 fewer is equivalent to a range of 1.26 cm fewer (SD = 0.8) to 2.8 cm fewer (SD = 1.77) on a VAS 0 to 10 cm scale in the intervention group. The mean pain scores in the control group range from 3.56 to 6.3 cm (VAS 0 to 10 cm).# *** |
| Additional analgesia required (escape analgesia) | Study population | RR 0.57 | 190 | ⊕⊕⊕⊝ | ||
| 621 per 1.000 | 354 per 1.000 | |||||
| Rate of caesarean delivery | Study population | RR 0.63 | 215 | ⊕⊕⊝⊝ | Two studies includes zero events in one arm (constant continuity correction of 0.01).7 | |
| 148 per 1.000 | 93 per 1.000 | |||||
| Maternal apnoea | see comment | see comment | ‐ | (0 studies) | ‐ | No trial assessed this outcome. |
| Maternal respiratory depression (< 8 breaths/min) | None out of 18 women in the control group and three out of 18 in the remifentanil group had a respiratory depression. | not estimable | 36 | ⊕⊝⊝⊝ | Only one trial assessed this outcome. | |
| Apgar score < 7 at 5 min | None of the newborns in both groups had an Apgar score < 7 at 5 min. | not estimable | 88 | ⊕⊝⊝⊝ | Only one trial assessed this outcome. | |
| *The risk in the intervention group (and its 95% confidence interval) is based on the assumed risk in the comparison group and the relative effect of the intervention (and its 95% CI). | ||||||
| GRADE Working Group grades of evidence | ||||||
| 1 RoB ‐ downgrading (very serious): Substantial information is derived from studies at high risk of bias. After exclusion of high risk trials the CI crosses the line of no effect. 2 Inconsistency ‐ downgrading (serious): I2 > 50%. 3 Imprecision ‐ downgrading (serious): The number of women is insufficient to demonstrate the anticipated effect (OIS not reached). 4 RoB ‐ downgrading (serious): Substantial information is derived by high risk of bias studies (If more than one study: Exclusion of high risk of bias trials has no substantial effect on robustness of the results). 5 Imprecision ‐ downgrading (serious): The number of women is insufficient to demonstrate the anticipated effect (RIS not reached). The result is imprecise including appreciable benefit and harm. 6 Imprecision ‐ downgrading (very serious): Only one study with small sample size (< 150 participants) reported this outcome. 7 Estimated effect with zero/zero event handling (constant continuity correction of 1.0), Analysis 1.14: RR = 0.70 [0.34, 1.41], I2 = 1%. # The SMD was back‐transformed into the VAS 0 to 10 cm scale to facilitate the interpretation. The smallest as well as the largest SD of the studies were used for back‐transformation to reflect the range of effect. ** Higher values indicate higher levels of satisfaction. *** Lower values indicate less pain. | ||||||
| Remifentanil (PCA) compared to another opioid (PCA) for pain management in labour | ||||||
| Patient or population: women in labour with planned vaginal delivery | ||||||
| Outcomes | Anticipated absolute effects* (95% CI) | Relative effect | № of participants | Quality of the evidence | Comments | |
| Risk with another opioid (PCA) | Risk with remifentanil (PCA) | |||||
| Satisfaction (overall) with pain relief (VRS 1 to 10) | The mean satisfaction in the combined (meperidine + fentanyl) control group was 7.1 on a VRS 1 to 10 scale | Mean satisfaction in the remifentanil group was 0.92 VRS higher (0.46 to 1.39 higher).** | ‐ | 110 | ⊕⊝⊝⊝ | Only one trial assessed this outcome. |
| Pain intensity 'early' (30 min/1 h) (VAS 0 to 10 cm, VAS 0 to 100 cm) | see comment | The standardised mean pain score 'early' in the intervention group was 0.51 fewer (1.01 fewer to 0)*** | ‐ | 215 | ⊕⊝⊝⊝ | A SMD of 0.51 fewer is equivalent to a range of 1.13 cm fewer (SD = 2.22) to 1.46 cm fewer (SD = 2.875) on a VAS 0 to 10 cm scale in the intervention group. Mean pain scores in the control groups range from 5.13 cm to 7.0 cm (VAS 0 to 10 cm).# *** |
| Additional analgesia required (escape analgesia) | Study population | RR 0.76 | 215 | ⊕⊕⊝⊝ | ||
| 381 per 1.000 | 289 per 1.000 | |||||
| Rate of caesarean delivery | Study population | RR 2.78 | 143 | ⊕⊝⊝⊝ | ||
| 56 per 1.000 | 156 per 1.000 | |||||
| Maternal apnoea | see comment | see comment | ‐ | (0 studies) | ‐ | No trial assessed this outcome. |
| Maternal respiratory depression | see comment | see comment | ‐ | (0 studies) | ‐ | No trial assessed this outcome. |
| Apgar score ≤ 7 (< 7) at 5 min | Three out of eight newborns in the control group and none out of nine in the remifentanil group had an Apgar score < 7 at 5 min. | not estimable | 17 | ⊕⊝⊝⊝ | Only one trial assessed this outcome. | |
| *The risk in the intervention group (and its 95% confidence interval) is based on the assumed risk in the comparison group and the relative effect of the intervention (and its 95% CI). | ||||||
| GRADE Working Group grades of evidence | ||||||
| 1 RoB ‐ downgrading (serious): Information is derived from a high risk of bias trial. 2 RoB ‐ downgrading (serious): After exclusion of 1 high risk of bias trial (blinding) the estimated effect with CI reached clinically relevance ‐0.73 [‐1.05, ‐0.40] 3 Inconsistency ‐ downgrading (serious): I2 > 50% 4 Imprecision ‐ downgrading (serious): The number of women is insufficient to demonstrate the anticipated effect (RIS/OIS not reached). The result is imprecise including appreciable and no appreciable effect. 5 RoB ‐ downgrading (very serious): Substantial information is derived from studies at high risk of bias. Exclusion of high risk of bias trials widened the CI including appreciable benefit and harm. 6 Imprecision ‐ downgrading (very serious): Only one study with small sample size (< 150 participants) reported this outcome. 7 RoB ‐ downgrading (serious): Information is derived from a trial with unclear risk of bias. # The SMD was back‐transformed into the VAS 0 to 10 cm scale to facilitate the interpretation. The smallest as well as the largest SD of the studies were used for back‐transformation to reflect the range of effect. ** Higher values indicate higher levels of satisfaction. *** Lower values indicate less pain. | ||||||
| Remifentanil (PCA) compared to epidural/CSE for pain management in labour | ||||||
| Patient or population: women in labour with planned vaginal delivery | ||||||
| Outcomes | Anticipated absolute effects* (95% CI) | Relative effect | № of participants | Quality of the evidence | Comments | |
| Risk with epidural analgesia/central neuraxial blocks (CSE) | Risk with remifentanil (PCA) | |||||
| Satisfaction (overall) with pain relief (NRS 0 to 4, 1 to 4, 0 to 10, 1 to 10, VRS 1 to 4) | see comment | The standardised mean satisfaction score in the intervention group was 0.22 fewer (0.40 fewer to 0.04 fewer)** | ‐ | 2135 | ⊕⊝⊝⊝ | A SMD of 0.22 fewer is equivalent to a range of 0.15 cm fewer (SD = 0.7) to 0.61 cm fewer (SD = 2.78) on a VAS 0 to 10 cm scale in the intervention group. Mean satisfaction scores in the control group range from 6.7 to 9.1 cm (VAS 0 to 10 cm).# ** |
| Pain intensity 'early' (1 h) (VAS 0 to 10 cm, VAS 0 to 100 cm, NRS 0 to 10) | see comment | The standardised mean pain score 'early' in the intervention group was 0.57 higher (0.31 higher to 0.84 higher)*** | ‐ | 235 | ⊕⊕⊝⊝ | A SMD of 0.57 higher is equivalent to a range of 0.57 cm higher (SD = 1.0) to 1.43 cm higher (SD = 2.5) on a VAS 0 to 10 cm scale in the intervention group. The mean pain scores in the control group range from 1.6 to 4.14 cm (VAS 0 to 10 cm).# *** |
| Additional analgesia required | Study population | RR 9.27 | 1037 | ⊕⊕⊕⊝ | One study includes zero events in both arms; two studies include zero events in one arm (constant continuity correction of 0.01). 8 | |
| 10 per 1.000 | 93 per 1.000 | |||||
| Rate of caesarean delivery | Study population | RR 1.0 | 1578 | ⊕⊕⊕⊝ | One study includes zero events in one arm (constant continuity correction of 0.01). 9 | |
| 215 per 1.000 | 215 per 1.000 | |||||
| Maternal apnoea | None out of 19 women in the control group and nine out of 19 in the remifentanil group had an apnoea. | not estimable | 38 | ⊕⊝⊝⊝ | Only one trial assessed this outcome. | |
| Maternal respiratory depression (< 9, < 8 breaths/min) | Study population | RR 0.91 | 687 | ⊕⊕⊝⊝ | One study includes zero events in both arms; one study includes zero events in one arm (constant continuity correction of 0.01). 10 | |
| 38 per 1.000 | 35 per 1.000 | |||||
| Apgar score ≤ 7 (< 7) at 5 min | Study population | RR 1.26 | 1322 | ⊕⊕⊝⊝ | Two studies include zero events in both arms; two studies include zero events in one arm (constant continuity correction of 0.01). 11 | |
| 23 per 1.000 | 30 per 1.000 | |||||
| *The risk in the intervention group (and its 95% confidence interval) is based on the assumed risk in the comparison group and the relative effect of the intervention (and its 95% CI). | ||||||
| GRADE Working Group grades of evidence | ||||||
| 1 RoB ‐ downgrading (very serious): Substantial information is derived from studies at high risk of bias. After exclusion of high risk trials the CI crosses the line of no effect. 2 Inconsistency ‐ downgrading (serious): I2 > 50% 3 RoB ‐ downgrading (serious): Substantial information is derived from studies at high risk of bias. Exclusion of high risk of bias trials has no substantial impact on robustness of the results. 4 Imprecision ‐ downgrading (serious): The number of women is insufficient to demonstrate the anticipated effect (OIS not reached). 5 RoB ‐ downgrading (serious): Information is derived from a high risk of bias trial. 6 Imprecision ‐ downgrading (serious): The number of women is insufficient do demonstrate the anticipated effect (RIS/OIS not reached). The result is imprecise including appreciable benefit and harm. 7 Imprecision ‐ downgrading (very serious): Only one study with small sample size (< 150 participants) reported this outcome. 8 Estimated effect with zero/zero event handling (constant continuity correction of 1.0), Analysis 3.18: RR = 8.1 [3.5, 18.75], I2 = 0%. 9 Estimated effect with zero/zero event handling (constant continuity correction of 1.0), Analysis 3.19: RR = 0.99 [0.81, 1.21], I2 = 0%. 10 Estimated effect with zero/zero event handling (constant continuity correction of 1.0), Analysis 3.3: RR = 1.52 [0.23, 9.90], I2 = 50%. 11 Estimated effect with zero/zero event handling (constant continuity correction of 1.0), Analysis 3.12: RR = 1.28 [0.65, 2.51], I2 = 0%. # The SMD was back‐transformed into the VAS 0 to 10 cm scale to facilitate the interpretation. The smallest as well as the largest SD of the studies were used for back‐transformation to reflect the range of effect. ** Higher values indicate higher levels of satisfaction. *** Lower values indicate less pain. | ||||||
| Remifentanil (PCA) compared to remifentanil (continuous IV) for pain management in labour | ||||||
| Patient or population: women in labour with planned vaginal delivery | ||||||
| Outcomes | Anticipated absolute effects* (95% CI) | Relative effect | № of participants | Quality of the evidence | Comments | |
| Risk with remifentanil (continuous IV) | Risk with remifentanil (PCA) | |||||
| Satisfaction (overall) with pain relief | see comment | see comment | ‐ | (0 studies) | ‐ | No trial assessed this outcome. |
| Pain intensity 'early' (30 min/1 h) (VAS 0 to 10 cm) | The mean pain score in the remifentanil (continuous IV) group was 4.0 cm on a VAS 0 to 10 cm scale. | Mean pain score in the remifentanil (PCA) group was 1.0 cm fewer (1.8 fewer to 0.2 fewer).*** | not estimable | 53 | ⊕⊝⊝⊝ | Only one trial assessed this outcome. |
| Additional analgesia required (escape analgesia) | Two out of 29 women in the remifentanil (PCA) group and four out of 30 participants in the remifentanil (continuous IV) group required additional epidural analgesia. | not estimable | 59 (1 RCT) | ⊕⊝⊝⊝ | Only one trial assessed this outcome. | |
| Rate of caesarean delivery | see comment | see comment | ‐ | (0 studies) | ‐ | No trial assessed this outcome. |
| Maternal apnoea | see comment | see comment | ‐ | (0 studies) | ‐ | No trial assessed this outcome. |
| Maternal respiratory depression (< 8 breaths/min) | see comment | see comment | RR 0.98 | 135 | ⊕⊕⊝⊝ | All study arms include zero events (constant continuity correction of 0.01). 5 |
| Apgar score < 7 at 5 min | see comment | see comment | ‐ | (0 studies) | ‐ | No trial assessed this outcome. |
| *The risk in the intervention group (and its 95% confidence interval) is based on the assumed risk in the comparison group and the relative effect of the intervention (and its 95% CI). | ||||||
| GRADE Working Group grades of evidence | ||||||
| 1 RoB ‐ downgrading (serious): Information is derived from a high risk of bias trial. 2 Imprecision ‐ downgrading (very serious): Only one study with small sample size (< 150 participants) reported this outcome. 3 RoB ‐ downgrading (serious): Substantial information is derived from studies at high risk of bias. Exclusion of high risk of bias trials has no substantial impact on robustness of the results. 4 Imprecision ‐ downgrading (serious): The number of women is insufficient to demonstrate the anticipated effect (RIS/OIS not reached). The result is imprecise including appreciable benefit and harm. 5 Estimated effect with zero/zero event handling (constant continuity correction of 1.0), Analysis 4.1: RR = not estimable *** Lower values indicate less pain. | ||||||
| Remifentanil (PCA, increasing bolus dose) compared to remifentanil (PCA, increasing infusion dose) for pain management in labour | ||||||
| Patient or population: women in labour with planned vaginal delivery | ||||||
| Outcomes | Anticipated absolute effects* (95% CI) | Relative effect | № of participants | Quality of the evidence | Comments | |
| Risk with remifentanil (continuous IV) | Risk with remifentanil (PCA) | |||||
| Satisfaction (overall) with pain relief (VNRS 0 to 10) | The mean satisfaction scores in the remifentanil (PCA, IF) group was 8.4 on a VNRS 0 to 10 scale. | Mean satisfaction scores in the remifentanil (PCA, IB) group was 0.2 higher (0.81 fewer to 1.21 higher).** | not estimable | 20 (1 RCT) | ⊕⊕⊝⊝ | Only one trial assessed this outcome. |
| Pain intensity 'early' (30 min/1 h) | see comment | see comment | ‐ | (0 studies) | ‐ | No trial assessed this outcome. |
| Additional analgesia required (escape analgesia) | Only one out of 10 woman in the remifentanil (PCA, IF) group crossed over to the epidural group. | not estimable | 20 (1 RCT) | ⊕⊕⊝⊝ | Only one trial assessed this outcome. | |
| Rate of caesarean delivery | Four out of 10 women in each group delivered by caesarean section. | not estimable | 20 (1 RCT) | ⊕⊕⊝⊝ | Only one trial assessed this outcome. | |
| Maternal apnoea | see comment | see comment | ‐ | (0 studies) | ‐ | No trial assessed this outcome. |
| Maternal respiratory depression (< 8 breaths/min) | see comment | see comment | ‐ | (0 studies) | ‐ | No trial assessed this outcome. |
| Apgar score < 7 at 5 min | None of the newborns in both groups had an Apgar score < 7 at 5 min. | not estimable | 20 (1 RCT) | ⊕⊕⊝⊝ | Only 1 trial assessed this outcome. | |
| *The risk in the intervention group (and its 95% confidence interval) is based on the assumed risk in the comparison group and the relative effect of the intervention (and its 95% CI). | ||||||
| GRADE Working Group grades of evidence | ||||||
| 1 Imprecision ‐ downgrading (very serious): Only one study with small sample size (< 150 participants) reported this outcome. ** Higher values indicate higher levels of satisfaction. | ||||||
| Study | No. randomised (Remifentanil/ control) | No. analysed (Remifentanil/ control) | Overall assessment for risk of attrition bias | Outcome level_Risk of bias | |||||
| Satisfaction with pain relief | AE for women | AE for newborns | Pain intensity | Additional analgesia | Rate of CS | ||||
| 10/ 10 | 10/ 10 | Low | Low | Low | Low | Low | Low | Low | |
| 20/ 20 | 20/ 19 | High | High | High | High | Unclear | Unclear | ||
| 12/ 12 | 12/ 12 | Low | Low | Low | Low | Low | Low | ||
| 60/ 60/ 60 | 52/ 53/ 54 | High | High | High | High | Low | Low | High | |
| 14/ 12 | 10/ 10 | High | High | Low | High | High | Low | Low | |
| 57/ 59 | 49/ 49 | High | High | High | High | Unclear | Unclear | High | |
| 15/ 15 | 15/ 15 | Low | Low | Low | Low | Low | Low | ||
| 43/ 45 | 43/ 45 | Unclear | Low | High | Low | Low | Low | Low | |
| 213 NA/ NA/ NA/ NA | 192 44/ 50/ 49/ 49 | Low | Low | Low | Low | ||||
| 709/ 705 | 687/ 671 | High | High | High | High | High | High | High | |
| 380/ 380/ 380 | 380/ 380/ 380 | Low | Low | Low | Low | Low | Low | ||
| 41/ 41 | 41/ 41 | Low | Low | Low | Low | Low | |||
| 34/ 34 | 34/ 34 | Low | Low | Low | Low | Low | Low | Low | |
| 30/ 30 | 27/ 26 | High | High | High | High | High | High | ||
| 20/ 20 | 19/ 20 | Low | Low | Low | Low | Low | Low | Low | |
| 13/ 15 | 12/ 12 | High | High | High | Low | High | Low | ||
| 18/ 18 | 18/ 18 | Unclear | Low | Low | Low | High | High | ||
| 19/ 20 | 17/ 20 | High | High | High | High | High | Low | High | |
| 9/ 8 | 9/ 8 | Low | Low | Low | Low | Low | Low | ||
| 27/ 25 | 24/ 21 | High | High | High | High | High | High | High | |
| Abbreviations: AE: adverse events, CS: caesarean section | |||||||||
| Sensitivity analysis: Selection bias | Statistical method | All studies | 'high risk of bias'‐studies excluded | Impact on robustness (95% CI) | ||
| n | Effect estimate | n | Effect estimate | |||
| 1. Remifentanil (PCA) versus another opioid (IV/IM) | ||||||
| 1.1 Satisfaction with pain relief | SMD (IV, Random), 95% CI | 4, all at low risk of bias | ||||
| 1.3 Oxygen desaturation (SpO2 < 95%) | RR (MH, Random), 95% CI | 2, all at low risk of bias | ||||
| 1.4 Nausea (and vomiting) | RR (MH, Random), 95% CI | 4, all at low risk of bias | ||||
| 1.6 Pruritus | RR (IV, Random), 95% CI, 0/0 cell counts | 2, all at low risk of bias | ||||
| 1.10 FHR/CTG abnormalities, non‐reassuring fetal status | RR (MH, Random), 95% CI | 2, all at low risk of bias | ||||
| 1.11 Pain intensity 'early' (30 min/1 h) | SMD (IV, Random), 95% CI | 3, all at low risk of bias | ||||
| 1.13 Additional analgesia required (escape analgesia) | RR (MH, Random), 95% CI | 3, all at low risk of bias | ||||
| 1.14 Rate of caesarean delivery | RR (MH, Random), 95% CI | 4, all at low risk of bias | ||||
| 2. Remifentanil (PCA) versus another opioid (PCA) | ||||||
| 2.2 Oxygen desaturation (SpO2 < 95%) | RR (MH, Random), 95% CI | 2, all at low risk of bias | ||||
| 2.10 Need for naloxone | RR (IV, Random), 95% CI, 0/0 cell counts | 2, all at low risk of bias | ||||
| 2.12 NACS at 15/30 min | MD (IV, Random), 95% CI | 2, all at low risk of bias | ||||
| 2.13 Pain intensity 'early' (30 min/1 h) | SMD (IV, Random), 95% CI | 3, all at low risk of bias | ||||
| 2.15 Additional analgesia required (escape analgesia) | RR (MH, Random), 95% CI | 3, all at low risk of bias | ||||
| 2.16 Rate of caesarean delivery | RR (MH, Random), 95% CI | 2, all at low risk of bias | ||||
| 3. Remifentanil (PCA) versus epidural/combined spinal‐epidural analgesia (CSE) | ||||||
| 3.1 Satisfaction with pain relief | SMD (IV, Random), 95% CI | 7 | ‐0.22 [‐0.40, ‐0.04] | 6 | ‐0.20 [‐0.46, 0.07] | Yes (CI includes 0) |
| 3.3 Respiratory depression (< 9, < 8 breaths/min) | RR (IV, Random), 95% CI, 0/0 cell counts | 3 | 0.91 [0.51, 1.62] | 2 | 0.91 [0.52, 1.61] | No |
| 3.4 Oxygen desaturation (SpO2 < 92%) | RR (MH, Random), 95% CI | 3 | 3.24 [1.66, 6.32] | 2 | 5.83 [0.40, 84.06] | Yes (CI includes 1) |
| 3.5 Oxygen desaturation (SpO2 < 95%) | RR (MH, Random), 95% CI | 3 | 3.27 [2.32, 4.61] | 2 | 5.44 [2.11, 14.02] | Yes (effect and CI increased) |
| 3.6 Hypotension | RR (IV, Random), 95% CI, 0/0 cell counts | 4 | 0.59 [0.37, 0.94] | 3 | 0.57 [0.00, 2.4E7] | Yes (CI includes 1) |
| 3.7 Bradycardia | RR (IV, Random), 95% CI, 0/0 cell counts | 2, all at low risk of bias | ||||
| 3.8 Nausea | RR (MH, Random), 95% CI | 8 | 1.49 [1.19, 1.86] | 7 | 1.41 [1.09, 1.83] | No |
| 3.9 Vomiting | RR (MH, Random), 95% CI | 6 | 1.63 [1.25, 2.13] | 5 | 1.82 [1.29, 2.57] | No |
| 3.10 Pruritus | RR (MH, Random), 95% CI | 7 | 0.75 [0.48, 1.18] | 6 | 0.81 [0.45, 1.45] | No |
| 3.11 Sedation (1 h) | MD (IV, Random), 95% CI | 3, all at low risk of bias | ||||
| 3.12 Apgarscore ≤ 7 (< 7) at 5 min | RR (IV, Random), 95% CI, 0/0 cell counts | 5, all at low risk of bias | ||||
| 3.13 Apgarscore at 5 min | MD (IV,), 95% CI | 3, all at low risk of bias | ||||
| 3.14 Need for naloxone | RR (IV, Random), 95% CI, 0/0 cell counts | 2, all at low risk of bias | ||||
| 3.15 FHR/CTG abnormalities, non‐reassuring fetal status | RR (MH, Random), 95% CI | 5, all at low risk of bias | ||||
| 3.16 Pain intensity 'early' (1 h) | SMD (IV, Random), 95% CI | 6, all at low risk of bias | ||||
| 3.18 Additional analgesia required | RR (IV, Random), 95% CI, 0/0 cell counts | 6 | 9.27 [3.73, 23.03] | 5 | 5.29 [1.2, 23.3] | No |
| 3.19 Rate of caesarean delivery | RR (MH, Random), 95% CI | 9, all at low risk of bias | ||||
| 4. Remifentanil (PCA) versus remifentanil (continuous IV) | ||||||
| 4.1 Respiratory depression (< 8 breaths/min) | RR (IV, Random), 95% CI, 0/0 cell counts | 2, all at low risk of bias | ||||
| 4.3 Hypotension | RR (IV, Random), 95% CI, 0/0 cell counts | 2, all at low risk of bias | ||||
| 4.4 Bradycardia | RR (IV, Random), 95% CI, 0/0 cell counts | 2, all at low risk of bias | ||||
| 4.5 Nausea (and vomiting) | RR (MH, Random), 95% CI | 2, all at low risk of bias | ||||
| 4.8 Need for naloxone | RR (IV, Random), 95% CI, 0/0 cell counts | 2, all at low risk of bias | ||||
| All RR for outcomes including 0/0 cell counts (zero/zero event trials) were calculated using TSA (constant continuity correction, 0.01). Review Manager 5 produces computational errors when both the intervention and control group have zero events. By using TSA there is no possibility to choose the MH method (only IV) which may cause small deviations within results. Abbreviations: [95% CI]: 95% confidence interval; IV: Inverse Variance; MD: mean difference; MH: Mantel‐Haenszel; n: number of participants; RPCA: Remifentanil PCA; RR: risk ratio; SMD: standardised mean difference | ||||||
| Sensitivity analysis: Blinding (performance and detection bias) | Statistical method | All studies | 'high risk of bias'‐studies excluded | Impact on robustness (95% CI) | ||
| n | Effect estimate | n | Effect estimate | |||
| 1. Remifentanil (PCA) versus another opioid (IV/IM) | ||||||
| 1.1 Satisfaction with pain relief | SMD (IV, Random), 95% CI | 4 | 2.11 [0.72, 3.49] | 2 | 2.46 [‐0.34, 5.26] | Yes (CI includes 0) |
| 1.3 Oxygen desaturation (SpO2 < 95%) | RR (MH, Random), 95% CI | 2 | 0.48 [0.00, 47.37] | 1 | 0.05 [0.00, 0.82] | Yes (CI < 1: favours RPCA) |
| 1.4 Nausea (and vomiting) | RR (MH, Random), 95% CI | 4 | 0.54 [0.29, 0.99] | 2 | 0.36 [0.06, 2.29] | Yes (CI includes 1) |
| 1.6 Pruritus | RR (IV, Random), 95% CI, 0/0 cell counts | 2, all at low risk of bias | ||||
| 1.10 FHR/CTG abnormalities, non‐reassuring fetal status | RR (MH, Random), 95% CI | 2, all at low risk of bias | ||||
| 1.11 Pain intensity 'early' (30 min/1 h) | SMD (IV, Random), 95% CI | 3 | ‐1.58 [‐2.69, ‐0.48] | 2 | ‐1.28 [‐2.62, 0.07] | Yes (CI includes 0) |
| 1.13 Additional analgesia required (escape analgesia) | RR (MH, Random), 95% CI | 3 | 0.57 [0.40, 0.81] | 2 | 0.48 [0.25, 0.91] | No |
| 1.14 Rate of caesarean delivery | RR (MH, Random), 95% CI | 4 | 0.70 [0.34, 1.41] | 2 | 0.63 [0.30, 1.31] | No |
| 2. Remifentanil (PCA) versus another opioid (PCA) | ||||||
| 2.2 Oxygen desaturation (SpO2 < 95%) | RR (MH, Random), 95% CI | 2 | 1.28 [0.49, 3.30] | 1 | 1.64 [1.25, 2.15] | Yes (CI > 1: favours opioid) |
| 2.10 Need for naloxone | RR (IV, Random), 95% CI, 0/0 cell counts | 2 | 0.03 [0.00, 1.8E8] | 1 | 0.00 [0.00, 0.06] | Yes (CI < 1: favours RPCA) |
| 2.12 NACS at 15/30 min | MD (IV, Random), 95% CI | 2 | 1.11 [‐0.65, 2.87] | 1 | 0.20 [‐0.93, 1.33] | Yes (direction of effect changed, CI decreased) |
| 2.13 Pain intensity 'early' (30 min/1 h) | SMD (IV, Random), 95% CI | 3 | ‐0.51 [‐1.01, ‐0.00] | 2 | ‐0.73 [‐1.05, ‐0.40] | Yes (lower CI: clinically relevant moderate effect) |
| 2.15 Additional analgesia required (escape analgesia) | RR (MH, Random), 95% CI | 3 | 0.76 [0.45, 1.28] | 2 | 0.65 [0.39, 1.09] | No |
| 2.16 Rate of caesarean delivery | RR (MH, Random), 95% CI | 2, all at low risk of bias | ||||
| 3. Remifentanil (PCA) versus epidural/combined spinal‐epidural analgesia (CSE) | ||||||
| 3.1 Satisfaction with pain relief | SMD (IV, Random), 95% CI | 7 | ‐0.22 [‐0.40, ‐0.04] | 1 | 0.27 [‐0.31, 0.86] | Yes (CI includes 0) |
| 3.3 Respiratory depression (< 9, < 8 breaths/min) | RR (IV, Random), 95% CI, 0/0 cell counts | 3 | 0.91 [0.51, 1.62] | 0 | Not estimable | All studies at high risk |
| 3.4 Oxygen desaturation (SpO2 < 92%) | RR (MH, Random), 95% CI | 3 | 3.24 [1.66, 6.32] | 0 | Not estimable | All studies at high risk |
| 3.5 Oxygen desaturation (SpO2 < 95%) | RR (MH, Random), 95% CI | 3 | 3.27 [2.32, 4.61] | 1 | 11.38 [1.62, 79.78] | Yes (effect and CI increased) |
| 3.6 Hypotension | RR (IV, Random), 95% CI, 0/0 cell counts | 4 | 0.59 [0.37, 0.94] | 0 | Not estimable | All studies at high risk |
| 3.7 Bradycardia | RR (IV, Random), 95% CI, 0/0 cell counts | 2 | 1.0 [0.00, 1.0E12] | 0 | Not estimable | All studies at high risk |
| 3.8 Nausea | RR (MH, Random), 95% CI | 8 | 1.49 [1.19, 1.86] | 1 | 3.94 [0.96, 16.22] | Yes (CI includes 1) |
| 3.9 Vomiting | RR (MH, Random), 95% CI | 6 | 1.63 [1.25, 2.13] | 0 | Not estimable | All studies at high risk |
| 3.10 Pruritus | RR (MH, Random), 95% CI | 7 | 0.75 [0.48, 1.18] | 0 | Not estimable | All studies at high risk |
| 3.11 Sedation (1 h) | MD (IV, Random), 95% CI | 3 | 0.71 [0.03, 1.39] | 0 | Not estimable | All studies at high risk |
| 3.12 Apgarscore ≤ 7 (< 7) at 5 min | RR (IV, Random), 95% CI, 0/0 cell counts | 5 | 1.26 [0.62, 2.57] | 0 | Not estimable | All studies at high risk |
| 3.13 Apgarscore at 5 min | MD (IV,), 95% CI | 3 | 0.06 [‐0.27, 0.39] | 0 | Not estimable | All studies at high risk |
| 3.14 Need for naloxone | RR (IV, Random), 95% CI, 0/0 cell counts | 2 | 0.02 [0.00, 1.6E8] | 0 | Not estimable | All studies at high risk |
| 3.15 FHR/CTG abnormalities, non‐reassuring fetal status | RR (MH, Random), 95% CI | 5 | 1.55 [0.49, 4.92] | 1 | 11.38 [1.62, 79.78] | Yes (CI > 1: favours epidural) |
| 3.16 Pain intensity 'early' (1 h) | SMD (IV, Random), 95% CI | 6 | 0.57 [0.31, 0.84] | 0 | Not estimable | All studies at high risk |
| 3.18 Additional analgesia required | RR (IV, Random), 95% CI, 0/0 cell counts | 6 | 9.27 [3.73, 23.07] | 0 | Not estimable | All studies at high risk |
| 3.19 Rate of caesarean delivery | RR (MH, Random), 95% CI | 9 | 0.99 [0.81, 1.21] | 1 | 0.88 [0.06, 13.14] | Yes (CI increased) |
| 4. Remifentanil (PCA) versus remifentanil (continuous IV) | ||||||
| 4.1 Respiratory depression (< 8 breaths/min) | RR (IV, Random), 95% CI, 0/0 cell counts | 2 | 0.98 [0.00, 1.0E12] | 1 | 0.98 [0.00, ∞] | No |
| 4.3 Hypotension | RR (IV, Random), 95% CI, 0/0 cell counts | 2 | 0.98 [0.00, 1.0E12] | 1 | 0.98 [0.00, ∞] | No |
| 4.4 Bradycardia | RR (IV, Random), 95% CI, 0/0 cell counts | 2 | 0.98 [0.00, 1.0E12] | 1 | 0.98 [0.00, ∞] | No |
| 4.5 Nausea (and vomiting) | RR (MH, Random), 95% CI | 2 | 0.85 [0.28, 2.54] | 1 | 0.53 [0.21, 1.39] | No |
| 4.8 Need for naloxone | RR (IV, Random), 95% CI, 0/0 cell counts | 2 | 0.98 [0.00, 1.0E12] | 1 | 0.98 [0.00, ∞] | No |
| All RR for outcomes including 0/0 cell counts (zero/zero event trials) were calculated using TSA (constant continuity correction, 0.01). Review Manager 5 produces computational errors when both the intervention and control group have zero events. By using TSA there is no possibility to choose the MH method (only IV) which may cause small deviations within results. Abbreviations: [95% CI]: 95% confidence interval; IV: Inverse Variance; MD: mean difference; MH: Mantel‐Haenszel; n: number of participants; RPCA: Remifentanil PCA; RR: risk ratio; SMD: standardised mean difference | ||||||
| Sensitivity analysis: Attrition bias | Statistical method | All studies | 'high risk of bias'‐studies excluded | Impact on robustness (95% CI) | ||
| n | Effect estimate | n | Effect estimate | |||
| 1. Remifentanil (PCA) versus another opioid (IV/IM) | ||||||
| 1.1 Satisfaction with pain relief | SMD (IV, Random), 95% CI | 4, all at low risk of bias | ||||
| 1.3 Oxygen desaturation (SpO2 < 95%) | RR (MH, Random), 95% CI | 2 | 0.48 [0.00, 47.37] | 1 | 3.50 [0.84, 14.61] | Yes (CI + effect moved to favour of opioid) |
| 1.4 Nausea (and vomiting) | RR (MH, Random), 95% CI | 4, all at low risk of bias | ||||
| 1.6 Pruritus | RR (IV, Random), 95% CI, 0/0 cell counts | 2, all at low risk of bias | ||||
| 1.10 FHR/CTG abnormalities, non‐reassuring fetal status | RR (MH, Random), 95% CI | 2, all at low risk of bias | ||||
| 1.11 Pain intensity 'early' (30 min/1 h) | SMD (IV, Random), 95% CI | 3, all at low risk of bias | ||||
| 1.13 Additional analgesia required (escape analgesia) | RR (MH, Random), 95% CI | 3 | 0.57 [0.40, 0.81] | 2 | 0.48 [0.25, 0.91] | No |
| 1.14 Rate of caesarean delivery | RR (MH, Random), 95% CI | 4 | 0.70 [0.34, 1.41] | 3 | 0.60 [0.29, 1.24] | No |
| 2. Remifentanil (PCA) versus another opioid (PCA) | ||||||
| 2.2 Oxygen desaturation (SpO2 < 95%) | RR (MH, Random), 95% CI | 2 | 1.28 [0.49, 3.30] | 0 | Not estimable | All studies at high risk |
| 2.10 Need for naloxone | RR (IV, Random), 95% CI, 0/0 cell counts | 2 | 0.03 [0.00, 1.8E8] | 1 | 0.00 [0.00, 0.06] | Yes (CI moved to favour RPCA) |
| 2.12 NACS at 15/30 min | MD (IV, Random), 95% CI | 2 | 1.11 [‐0.65, 2.87] | 0 | Not estimable | All studies at high risk |
| 2.13 Pain intensity 'early' (30 min/1 h) | SMD (IV, Random), 95% CI | 3, all at low risk of bias | ||||
| 2.15 Additional analgesia required (escape analgesia) | RR (MH, Random), 95% CI | 3, all at low risk of bias | ||||
| 2.16 Rate of caesarean delivery | RR (MH, Random), 95% CI | 2 | 2.78 [0.99, 7.82] | 1 | 1.78 [0.20, 16.10] | Yes (CI increased) |
| 3. Remifentanil (PCA) versus epidural/combined spinal‐epidural analgesia (CSE) | ||||||
| 3.1 Satisfaction with pain relief | SMD (IV, Random), 95% CI | 7 | ‐0.22 [‐0.40, ‐0.04] | 3 | ‐0.27 [‐0.64, 0.10] | Yes (CI includes 0) |
| 3.3 Respiratory depression (< 9, < 8 breaths/min) | RR (IV, Random), 95% CI, 0/0 cell counts | 3 | 0.91 [0.51, 1.62] | 1 | 0.91 [0.39, 2.10] | No |
| 3.4 Oxygen desaturation (SpO2 < 92%) | RR (MH, Random), 95% CI | 3 | 3.24 [1.66, 6.32] | 0 | Not estimable | All studies at high risk |
| 3.5 Oxygen desaturation (SpO2 < 95%) | RR (MH, Random), 95% CI | 3 | 3.27 [2.32, 4.61] | 1 | 4.33 [1.47, 12.79] | Yes (effect and CI increased) |
| 3.6 Hypotension | RR (IV, Random), 95% CI, 0/0 cell counts | 4 | 0.59 [0.37, 0.94] | 2 | 0.01 [0.00, 7.8E7] | Yes (CI includes 1) |
| 3.7 Bradycardia | RR (IV, Random), 95% CI, 0/0 cell counts | 2 | 1.0 [0.00, 1.0E12] | 1 | 1.0 [0.00, ∞] | No |
| 3.8 Nausea | RR (MH, Random), 95% CI | 8 | 1.49 [1.19, 1.86] | 4 | 1.27 [0.82, 1.98] | Yes (CI includes 1) |
| 3.9 Vomiting | RR (MH, Random), 95% CI | 6 | 1.63 [1.25, 2.13] | 3 | 1.54 [0.75, 3.14] | Yes (CI includes 1) |
| 3.10 Pruritus | RR (MH, Random), 95% CI | 7 | 0.75 [0.48, 1.18] | 5 | 0.86 [0.48, 1.56] | No |
| 3.11 Sedation (1 h) | MD (IV, Random), 95% CI | 3, all at low risk of bias | ||||
| 3.12 Apgarscore ≤ 7 (< 7) at 5 min | RR (IV, Random), 95% CI, 0/0 cell counts | 5 | 1.26 [0.62, 2.57] | 3 | 1.26 [0.62, 2.57] | No |
| 3.13 Apgarscore at 5 min | MD (IV,), 95% CI | 3 | 0.06 [‐0.27, 0.39] | 0 | Not estimable | All studies at high risk |
| 3.14 Need for naloxone | RR (IV, Random), 95% CI, 0/0 cell counts | 2, all at low risk of bias | ||||
| 3.15 FHR/CTG abnormalities, non‐reassuring fetal status | RR (MH, Random), 95% CI | 5 | 1.55 [0.49, 4.92] | 2 | 0.87 [0.41, 1.87] | Yes (CI decreased, effect changed) |
| 3.16 Pain intensity 'early' (1 h) | SMD (IV, Random), 95% CI | 6 | 0.57 [0.31, 0.84] | 3 | 0.57 [0.25, 0.89] | No |
| 3.18 Additional analgesia required | RR (IV, Random), 95% CI, 0/0 cell counts | 6 | 9.27 [3.73, 23.03] | 5 | 5.29 [1.2, 23.3] | No |
| 3.19 Rate of caesarean delivery | RR (MH, Random), 95% CI | 9 | 0.99 [0.81, 1.21] | 6 | 1.02 [0.83, 1.25] | No |
| 4. Remifentanil (PCA) versus remifentanil (continuous IV) | ||||||
| 4.1 Respiratory depression (< 8 breaths/min) | RR (IV, Random), 95% CI, 0/0 cell counts | 2 | 0.98 [0.00, 1.0E12] | 1 | 0.98 [0.00, ∞] | No |
| 4.3 Hypotension | RR (IV, Random), 95% CI, 0/0 cell counts | 2 | 0.98 [0.00, 1.0E12] | 1 | 0.98 [0.00, ∞] | No |
| 4.4 Bradycardia | RR (IV, Random), 95% CI, 0/0 cell counts | 2 | 0.98 [0.00, 1.0E12] | 1 | 0.98 [0.00, ∞] | No |
| 4.5 Nausea (and vomiting) | RR (MH, Random), 95% CI | 2 | 0.85 [0.28, 2.54] | 1 | 1.67 [0.43, 6.52] | No |
| 4.8 Need for naloxone | RR (IV, Random), 95% CI, 0/0 cell counts | 2 | 0.98 [0.00, 1.0E12] | 1 | 0.98 [0.00, ∞] | No |
| All RR for outcomes including 0/0 cell counts (zero/zero event trials) were calculated using TSA (constant continuity correction, 0.01). Review Manager 5 produces computational errors when both the intervention and control group have zero events. By using TSA there is no possibility to choose the MH method (only IV) which may cause small deviations within results. Abbreviations: [95% CI]: 95% confidence interval; IV: Inverse Variance; MD: mean difference; MH: Mantel‐Haenszel; n: number of participants; RPCA: Remifentanil PCA; RR: risk ratio; SMD: standardised mean difference | ||||||
| EE [95% CI], P value, I2 (%), n | TSA_Low risk of bias‐based (all low) | |||||
| RRR (%) | CER (%) | H (%) | RIS | evidence | ||
| 1.13 Additional analgesia | 0.58 [0.42, 0.79], 0.0005, 15%, 190 | 51.21 | 58 | 25 | 156 | evidence of effect (intervention) |
| low risk of bias studies: Evron 2005 + Ng 2011 (best) | ||||||
| 1.14 Rate of caesarean delivery | 0.63 [0.30, 1.32], 0.22, 0%,215 | 37.47 | 19 | 25 | 1444 | absence of evidence |
| low risk of bias studies: Evron 2005 + Ng 2011 (best) | ||||||
| 2.15 Additional analgesia | 0.87 [0.74, 1.03], 0.11, 0%, 215 | 35.21 | 28 | 25 | 1024 | absence of evidence |
| low risk of bias studies: Douma 2010 (best) + Volikas 2001 | ||||||
| 2.16 Rate of caesarean delivery | 2.78 [0.99, 7.82], 0.05, 0%, 143 | ‐77.76 | 12.5 | 25 | 852 | absence of evidence |
| only low risk of bias study: Volikas 2001 | ||||||
| 3.3 Respiratory depression | 0.91 [0.51, 1.62], 0.75, 0%,687 | 9.09 | 58 | 25 | 4986 | absence of evidence |
| best study (high risk): Stocki‐2014 | ||||||
| 3.12 Apgarscore < 7 at 5 min | 1.26 [0.62, 2.57], 0.52, 0%, 1322 | ‐26.33 | 3 | 25 | 2.9E4 | absence of evidence |
| not best study (0/0 events), but largest (high risk): Ismail 2012 | ||||||
| 3.18 Additional analgesia | 9.27 [3.73, 23.03], < 0.0001, 0%, 1037 | ‐218.8 | 5 | 25 | 449 | evidence of effect (control) |
| Not best study (0/0 events), but second best (high risk): Stocki 2014 | ||||||
| 3.19 Rate of caesarean delivery | 1.0 [0.82, 1.22], 0.9857, 0%, 1578 | ‐12.5 | 8 | 25 | 4.4E4 | absence of evidence |
| best study (high risk): Evron 2008 clinically relevant (RRR) assumptions: RRR = ‐ 50%, CER (empirical) = 22%, H (empirical) = 0% → IS = 924 (lack of effect) | ||||||
| 4.1 Respiratory depression | 0.98 [0.06, 15.37], 0.9896, 0%, 135 | 4 | 1 | 25 | 3.4E6 | absence of evidence |
| best study (high risk): Shen 2013 | ||||||
| TSA (trial sequential analysis): random‐effects modelling; IV (inverse variance); (α = 0.05, power = 90% (ß = 0.10); zero event handling = constant continuity correction, 0.01; H = 25% (mild heterogeneity); calculated with TSA software (http://www.ctu.dk/tsa/) Abbreviations: CER: control event rate; EE [95% CI]: estimated effect with 95% confidence interval; EER: experimental event rate; H: heterogeneity adjustment factor; n: number of participants; NA: not applicable; RIS: required information size; RRR: relative risk reduction = (EER‐CER)/CER; TSMB: trial sequential monitoring boundary | ||||||
| EE [95% CI], P value, I2 (%), n | TSA_Empirical (with all studies) | |||||
| RRR (%) | CER (%) | H (%) | RIS | evidence | ||
| 1.13 Additional analgesia | 0.58 [0.42, 0.79], 0.0005, 15%, 190 | 42.39 | 62 | 21.39 | 194 | evidence of effect, TSMB, (intervention) |
| 1.14 Rate of caesarean delivery | 0.63 [0.30, 1.32], 0.22, 0%,215 | 30.4 | 15 | 0 | 2245 | absence of evidence |
| 2.15 Additional analgesia | 0.87 [0.74, 1.03], 0.11, 0%, 215 | 12.58 | 38 | 0 | 4218 | absence of evidence |
| 2.16 Rate of caesarean delivery | 2.78 [0.99, 7.82], 0.05, 0%, 143 | ‐177.7 | 6 | 0 | 372 | absence of evidence |
| 3.3 Respiratory depression | 0.91 [0.51, 1.62], 0.75, 0%,687 | 2 | 4 | 0 | 2.5E6 | absence of evidence |
| 3.12 Apgarscore < 7 at 5 min | 1.26 [0.62, 2.57], 0.52, 0%, 1322 | ‐26 | 2 | 0 | 3.4E4 | absence of evidence |
| 3.18 Additional analgesia | 9.27 [3.73, 23.03], < 0.0001, 0%, 1037 | ‐665 | 1 | 0 | 394 | evidence of effect (control) |
| 3.19 Rate of caesarean delivery | 1.0 [0.82, 1.22], 0.9857, 0%, 1578 | 1.18 | 22 | 0 | 1.1E6 | absence of evidence |
| 4.1 Respiratory depression | 0.98 [0.06, 15.37], 0.9896, 0%, 135 | 2 | 1 | 0 | 1.0E7 | absence of evidence |
| TSA (trial sequential analysis): random‐effects modelling; IV (inverse variance); (α = 0.05, power = 90% (ß = 0.10); zero event handling = constant continuity correction, 0.01; H = 25% (mild heterogeneity); calculated with TSA software (http://www.ctu.dk/tsa/) Abbreviations: CER: control event rate; EE [95% CI]: estimated effect with 95% confidence interval; EER: experimental event rate; H: heterogeneity adjustment factor; n: number of participants; NA: not applicable; RIS: required information size; RRR: relative risk reduction = (EER‐CER)/CER; TSMB: trial sequential monitoring boundary | ||||||
| EE [95% CI], P value, I2, n | OIS_minimal clinically relevant difference1 | |||||
| mean1 | mean2 | SDlargest | OIS | evidence | ||
| 1.1 Satisfaction with pain relief | 2.11 [0.72, 3.49], 0.003, 93%, 216 | 7 | 6 | 2.22 | 208 | evidence of effect (intervention) |
| best low risk of bias study: Ng 2011 | ||||||
| 1.11 Pain intensity 'early' | ‐1.58 [‐2.69, ‐0.48], 0.005, 89%, 180 | 25.6 | 35.6 | 26.6 | 298 | absence of evidence |
| best low risk of bias study: Ng 2011 | ||||||
| 2.13 Pain intensity 'early' | ‐0.51 [‐1.01, ‐0.00], 0.05, 52%, 215 | 5.282 | 6.282 | 2.414 | 246 | absence of evidence |
| best low risk of bias study: Douma 2010 | ||||||
| 3.1 Satisfaction with pain relief | ‐0.22 [‐0.40, ‐0.04], 0.02, 52%, 2135 | 8.1 | 9.1 | 1.5 | 96 | evidence of effect (control) |
| best study (high risk): Stocki 2014 | ||||||
| 3.16 Pain intensity 'early' | 0.57 [0.31, 0.84], < 0.0001, 0%, 235 | 3.3 | 2.3 | 3.3 | 458 | absence of evidence |
| best study (high risk): Stocki 2014 | ||||||
| The summary statistics for the GRADE‐relevant continuous outcomes was SMD (standardised mean difference). The TSA software (version 0.9 Beta) did not support trial sequential analysis of SMD. Therefore, we conducted OIS (optimal information size) calculations (http://stat.ubc.ca/˜rollin/stats/ssize/n2.html) which corresponds to a sample size calculation for an individual trial with the following general assumptions on α = 0.05 and ß = 0.10 (power = 90%). 1The assumed minimal clinically relevant difference was 1.0 cm (10 mm) on a VAS 0 to 10 cm (0 to 100 mm) scale. The mean2 was derived from the control group (low risk of bias (best) trial). Abbreviations: EE [95% CI]: estimated effect with 95% confidence interval; mean1: intervention group; mean2: control group; n: number of participants; SDlargest: largest standard deviation of the pooled studies was assumed | ||||||
| EE [95% CI], P value, I2, n | OIS_low risk of bias‐based (best) | |||||
| mean1 | mean2 | SDlargest | OIS | evidence | ||
| 1.1 Satisfaction with pain relief | 2.11 [0.72, 3.49], 0.003, 93%, 216 | 8 | 6 | 2.22 | 52 | evidence of effect (intervention) |
| best low risk of bias study: Ng 2011 | ||||||
| 1.11 Pain intensity 'early' | ‐1.58 [‐2.69, ‐0.48], 0.005, 89%, 180 | 22.1 | 35.6 | 26.6 | 164 | evidence of effect (intervention) |
| best low risk of bias study: Ng 2011 | ||||||
| 2.13 Pain intensity 'early' | ‐0.51 [‐1.01, ‐0.00], 0.05, 52%, 215 | 4.56 | 6.282 | 2.414 | 82 | lack of effect |
| best low risk of bias study: Douma 2010 | ||||||
| 3.1 Satisfaction with pain relief | ‐0.22 [‐0.40, ‐0.04], 0.02, 52%, 2135 | 8.6 | 9.1 | 1.5 | 380 | evidence of effect (control) |
| best study (high risk): Stocki 2014 | ||||||
| 3.16 Pain intensity 'early' | 0.57 [0.31, 0.84], < 0.0001, 0%, 235 | 4 | 2.3 | 3.3 | 160 | evidence of effect (control) |
| best study (high risk): Stocki 2014 | ||||||
| The summary statistics for the GRADE‐relevant continuous outcomes was SMD (standardised mean difference). The TSA software (version 0.9 Beta) did not support trial sequential analysis of SMD. Therefore, we conducted OIS (optimal information size) calculations (http://stat.ubc.ca/˜rollin/stats/ssize/n2.html) which corresponds to a sample size calculation for an individual trial with the following general assumptions on α = 0.05 and ß = 0.10 (power = 90%). The mean2 was derived from the control group (low risk of bias (best) trial). Abbreviations: EE [95% CI]: estimated effect with 95% confidence interval; mean1: intervention group; mean2: control group; n: number of participants; SDlargest: largest standard deviation of the pooled studies was assumed | ||||||
| Sensitivity analysis: Random‐effects versus fixed‐effect model | Statistical method | Random‐effects model | Fixed‐effect model | Impact on robustness (95% CI) (fixed‐effect model) | |||
| n | Effect estimate | n | Effect estimate | ||||
| 1. Remifentanil (PCA) versus another opioid (IV/IM) | |||||||
| 1.1 Satisfaction with pain relief | SMD (IV), 95% CI | 4 | 2.11 [0.72, 3.49] | 4 | 1.85 [1.51, 2.19] | Yes (CI decreased, large effect) | |
| 1.3 Oxygen desaturation (SpO2 < 95%) | RR (MH), 95% CI | 2 | 0.48 [0.00, 47.37] | 2 | 0.66 [0.28, 1.57] | Yes (CI decreased) | |
| 1.4 Nausea (and vomiting) | RR (MH), 95% CI | 4 | 0.54 [0.29, 0.99] | 4 | 0.51 [0.28, 0.95] | No | |
| 1.6 Pruritus | RR (IV), 95% CI, 0/0 cell counts | 2 | 1.02 [0.00, 1.1E12] | 2 | 1.02 [0.00, 1.1E12] | No | |
| 1.10 FHR/CTG abnormalities, non‐reassuring fetal status | RR (MH), 95% CI | 2 | 0.30 [0.10, 0.90] | 2 | 0.30 [0.10, 0.85] | No | |
| 1.11 Pain intensity 'early' (30 min/1 h) | SMD (IV), 95% CI | 3 | ‐1.58 [‐2.69, ‐0.48] | 3 | ‐1.35 [‐1.68, ‐1.01] | Yes (CI decreased, large effect) | |
| 1.13 Additional analgesia required (escape analgesia) | RR (MH), 95% CI | 3 | 0.57 [0.40, 0.81] | 3 | 0.53 [0.39, 0.71] | No | |
| 1.14 Rate of caesarean delivery | RR (MH), 95% CI | 4 | 0.70 [0.34, 1.41] | 4 | 0.77 [0.39, 1.49] | No | |
| 2. Remifentanil (PCA) versus another opioid (PCA) | |||||||
| 2.2 Oxygen desaturation (SpO2 < 95%) | RR (MH), 95% CI | 2 | 1.28 [0.49, 3.30] | 2 | 1.39 [1.16, 1.67] | Yes (CI > 1: favours opioid) | |
| 2.10 Need for naloxone | RR (IV,), 95% CI, 0/0 cell counts | 2 | 0.03 [0.00, 1.8E8] | 2 | 0.01 [0.00, 2.4E6] | No | |
| 2.12 NACS at 15/30 min | MD (IV), 95% CI | 2 | 1.11 [‐0.65, 2.87] | 2 | 1.15 [0.38, 1.93] | Yes (CI > 0: favours RPCA) | |
| 2.13 Pain intensity 'early' (30 min/1 h) | SMD (IV), 95% CI | 3 | ‐0.51 [‐1.01, ‐0.00] | 3 | ‐0.57 [‐0.86, ‐0.29] | Yes (CI < 0: favours RPCA) | |
| 2.15 Additional analgesia required (escape analgesia) | RR (MH), 95% CI | 3 | 0.76 [0.45, 1.28] | 3 | 0.74 [0.55, 1.00] | No | |
| 2.16 Rate of caesarean delivery | RR (MH), 95% CI | 2 | 2.78 [0.99, 7.82] | 2 | 2.78 [0.99, 7.77] | No | |
| 3. Remifentanil (PCA) versus epidural/combined spinal‐epidural analgesia (CSE) | |||||||
| 3.1 Satisfaction with pain relief | SMD (IV), 95% CI | 7 | ‐0.22 [‐0.40, ‐0.04] | 7 | ‐0.29 [‐0.38, ‐0.20] | No | |
| 3.3 Respiratory depression (< 9, < 8 breaths/min) | RR (IV), 95% CI, 0/0 cell counts | 3 | 0.91 [0.51, 1.62] | 3 | 1.2 [0.67, 2.17] | No | |
| 3.4 Oxygen desaturation (SpO2 < 92%) | RR (MH), 95% CI | 3 | 3.24 [1.66, 6.32] | 3 | 3.46 [2.32, 5.16] | No | |
| 3.5 Oxygen desaturation (SpO2 < 95%) | RR (MH), 95% CI | 3 | 3.27 [2.32, 4.61] | 3 | 3.30 [2.43, 4.49] | No | |
| 3.6 Hypotension | RR (IV,), 95% CI, 0/0 cell counts | 4 | 0.59 [0.37, 0.94] | 4 | 0.57 [0.36, 0.89] | No | |
| 3.7 Bradycardia | RR (IV,), 95% CI, 0/0 cell counts | 2 | 1.0 [0.00, 1.0E12] | 2 | 1.0 [0.00, 1.0E12] | No | |
| 3.8 Nausea | RR (MH), 95% CI | 8 | 1.49 [1.19, 1.86] | 8 | 1.53 [1.22, 1.91] | No | |
| 3.9 Vomiting | RR (MH), 95% CI | 6 | 1.63 [1.25, 2.13] | 6 | 1.62 [1.24, 2.10] | No | |
| 3.10 Pruritus | RR (MH), 95% CI | 7 | 0.75 [0.48, 1.18] | 7 | 0.76 [0.54, 1.07] | No | |
| 3.11 Sedation (1 h) | MD (IV), 95% CI | 3 | 0.71 [0.03, 1.39] | 3 | 0.91 [0.57, 1.25] | No | |
| 3.12 Apgarscore ≤ 7 (< 7) at 5 min | RR (IV,), 95% CI, 0/0 cell counts | 5 | 1.26 [0.62, 2.57] | 5 | 1.22 [0.67, 2.62] | No | |
| 3.13 Apgarscore at 5 min | MD (IV,), 95% CI | 3 | 0.06 [‐0.27, 0.39] | 3 | 0.06 [‐0.27, 0.39] | No | |
| 3.14 Need for naloxone | RR (IV,), 95% CI, 0/0 cell counts | 2 | 0.02 [0.00, 1.6E8] | 2 | 0.01 [0.00, 4.6E5] | No | |
| 3.15 FHR/CTG abnormalities, non‐reassuring fetal status | RR (MH), 95% CI | 5 | 1.55 [0.49, 4.92] | 5 | 1.38 [0.84, 2.25] | No | |
| 3.16 Pain intensity 'early' (1 h) | SMD (IV), 95% CI | 6 | 0.57 [0.31, 0.84] | 6 | 0.57 [0.31, 0.84] | No | |
| 3.18 Additional analgesia required | RR (IV,), 95% CI, 0/0 cell counts | 6 | 9.27 [3.73, 23.03] | 6 | 10.86 [4.37, 26.95] | No | |
| 3.19 Rate of caesarean delivery | RR (MH), 95% CI | 9 | 0.99 [0.81, 1.21] | 9 | 0.96 [0.79, 1.18] | No | |
| 4. Remifentanil (PCA) versus remifentanil (continuous IV) | |||||||
| 4.1 Respiratory depression (< 8 breaths/min) | RR (IV,), 95% CI, 0/0 cell counts | 2 | 0.98 [0.00, 1.0E12] | 2 | 0.98 [0.00, 1.0E12]] | No | |
| 4.3 Hypotension | RR (IV,), 95% CI, 0/0 cell counts | 2 | 0.98 [0.00, 1.0E12] | 2 | 0.98 [0.00, 1.0E12] | No | |
| 4.4 Bradycardia | RR (IV,), 95% CI, 0/0 cell counts | 2 | 0.98 [0.00, 1.0E12] | 2 | 0.98 [0.00, 1.0E12] | No | |
| 4.5 Nausea (and vomiting) | RR (MH), 95% CI | 2 | 0.85 [0.28, 2.54] | 2 | 0.81 [0.38, 1.73] | No | |
| 4.8 Need for naloxone | RR (IV,), 95% CI, 0/0 cell counts | 2 | 0.98 [0.00, 1.0E12] | 2 | 0.98 [0.00, 1.0E12] | No | |
| All RR for outcomes including 0/0 cell counts (zero/zero event trials) were calculated using TSA (constant continuity correction, 0.01). Review Manager 5 produces computational errors when both the intervention and control group have zero events. By using TSA there is no possibility to choose the MH method (only IV) which may cause small deviations within results. Abbreviations: [95% CI]: 95% confidence interval; IV: Inverse Variance; MD: mean difference; MH: Mantel‐Haenszel; n: number of participants; RPCA: Remifentanil PCA; RR: risk ratio; SMD: standardised mean difference | |||||||
| Data | 0‐ and 0/0‐event trials included (TSA) | 0‐event trials included and 0/0‐event trials excluded (RevMan)1 | |||||||
| Outcome (n, studies) | 0‐events, 0/0‐events, imbalance (Yes/No) | Summary statistic | Reciprocal (1.0) | Reciprocal (0.01) | Empirical (1.0) | Empirical (0.01) | Constant (1.0) | Constant (0.01) | Constant (1.0) |
| 1.3 Oxygen desaturation (2) | 1, 0 (Yes) | RR [95% CI], P value, I2 | 0.51 [0.01, 30.22], 0.7471, 86% | 3.41 [0.82, 14.22] 0.0918, 0% | 0.57 [0.01, 24.87] 0.7699, 87% | 3.39 [0.81, 14.10], 0.0938, 0% | 0.5 [0.01, 31.95], 0.7421, 86% | 3.42 [0.82, 14.25], 0.0914, 0% | 0.5 [0.01, 31.95], 0.7421, 86% |
| 1.4 Nausea (and vomiting) (4) | 1, 0 (No) | RR [95% CI], P value, I2 | 0.54 [0.29, 0.99], 0.0460, 0% | 0.56 [0.30, 1.04], 0.0665, 0% | 0.54 [0.29, 0.99], 0.0463, 0% | 0.56 [0.30, 1.04], 0.0667, 0% | 0.54 [0.29, 0.99], 0.0461, 0% | 0.56 [0.30, 1.04], 0.0664, 0% | 0.54 [0.29, 0.99], 0.0461, 0% |
| 1.6 Pruritus (2) | 0, 2 (No) | RR [95% CI], P value, I2 | 1.0 [0.06, 15.71], 1.0, 0% | 1.0 [0.00, 1.0E12], 1.0, 0% | NA | NA | 1.02 [0.07, 16.06], 0.9874, 0% | 1.02 [0.00, 1.1E12], 0.9987, 0% | NA |
| 1.14 Rate of caesarean delivery (4) | 2, 0 (No) | RR [95% CI], P value, I2 | 0.69 [0.34, 1,40], 0.3084, 0% | 0.63 [0.30, 1.32], 0.2164, 0% | 0.7 [0.34, 1.43], 0.3268, 1% | 0.63 [0.30, 1.32], 0.2182, 0% | 0.70 [0.35, 1.40], 0.3103, 0% | 0.63 [0.30, 1.32], 0.2165, 0% | 0.70 [0.35, 1.40], 0.3103, 0% |
| 2.10 Need for naloxone (2) | 1, 1 (No) | RR [95% CI], P value, I2 | 0.49 [0.05, 5.29], 0.5580, 0%, | 0.03 [0.00, 1.1E8], 0.7484, 0% | NA | NA | 0.48 [0.04, 5.30], 0.5473, 0% | 0.03 [0.00, 1.8E8], 0.7549, 0% | 0.3 [0.03, 2.72], 0.2847, 0% |
| 3.3 Respiratory depression (3) | 1, 1 (Yes) | RR [95% CI], P value, I2 | 0.97 [0.56, 1.70] 0.9206, 0% | 0.91 [0.51, 1.62] 0.7506, 0% | 0.98 [0.57, 1.71] 0.9550, 0% | 0.91 [0.51, 1.62] 0.7532, 0% | 0.98 [0.56, 1.71] 0.9424, 0% | 0.91 [0.51, 1.62] 0.7518, 0% | 1.35 [0.30, 6.18], 0.6967, 37% |
| 3.4 Oxygen desaturation (3) | 1, 0 (Yes) | RR [95% CI], P value, I2 | 3.2 [1.72, 5.94], 0.0002, 46% | 2.88 [1.94, 4.27], < 0.0001, 0% | 3.04 [1.70, 5.43], 0.0002, 38% | 2.88 [1.94, 4.27], < 0.0001, 0% | 3.19 [1.72, 5.91], 0.0002, 46% | 2.88 [1.94, 4.27], < 0.0001, 0% | 3.19 [1.72, 5.91], 0.0002, 46% |
| 3.6 Hypotension (4) | 2, 1 (No) | RR [95% CI], P value, I2 | 0.59 [0.38, 0.93], 0.0225, 0% | 0.59 [0.37, 0.94], 0.0271, 0% | 0.59 [0.38, 0.93], 0.0219, 0% | 0.59 [0.38, 0.94], 0.0273, 0% | 0.59 [0.38, 0.93], 0.0225, 0% | 0.59 [0.37, 0.94], 0.0271, 0% | 0.58 [0.23, 1.48], 0.2517, 16% |
| 3.7 Bradycardia (2) | 0, 2 (No) | RR [95% CI], P value, I2 | 1.0 [0.07, 15.07], 1.0, 0% | 1.0 [0.00, 1.0E12], 1.0, 0% | NA | NA | 1.0 [0.07, 15.07], 1.0, 0% | 1.0 [0.00, 1.0E12], 1.0, 0% | NA |
| 3.10 Pruritus (7) | 1, 0 (Yes) | RR [95% CI], P value, I2 | 0.75 [0.48, 1.18], 0.2182, 29% | 0.78 [0.51, 1.18], 0.2366, 21% | 0.75 [0.48, 1.18], 0.2170, 29% | 0.78 [0.51, 1.18], 0.2368, 21% | 0.75 [0.48, 1.18], 0.2154, 29% | 0.78 [0.51, 1.18], 0.2370, 21% | 0.75 [0.48, 1.18], 0.2154, 29% |
| 3.12 Apgarscore < 7 at 5 min (5) | 2, 2 (No) | RR [95% CI], P value, I2 | 1.26 [0.65, 2.43], 0.4944, 0% | 1.26 [0.62, 2.57], 0.5193, 0% | 1.28 [0.66, 2.47], 0.4596, 0% | 1.26 [0.62, 2.57], 0.5209, 0% | 1.26 [0.65, 2.43], 0.4904, 0% | 1.26 [0.62, 2.57], 0.5197, 0% | 1.28 [0.65, 2.51], 0.4801, 0% |
| 3.14 Need for naloxone (2) | 1, 1 (Yes) | RR [95% CI], P value, I2 | 0.34 [0.03, 3.82], 0.3846, 0% | 0.02 [0.00, 1.6E8], 0.7247, 0% | NA | NA | 0.46 [0.04, 4.88], 0.5200, 0% | 0.02 [0.00, 1.6E8], 0.7447, 0% | 0.2 [0.03, 1.15], 0.0720, 0% |
| 3.15 FHR/CTG abnormalities (5) | 1, 0 (No) | RR [95% CI], P value, I2 | 1.54 [0.50, 4.75], 0.4499, 46% | 1.88 [0.63, 5.61], 0.2578, 35% | 1.53 [0.52, 4.54], 0.4410, 44% | 1.88 [0.63, 5.64], 0.2600, 35% | 1.54 [0.50, 4.75], 0.4499, 46% | 1.88 [0.63, 5.61], 0.2578, 35% | 1.54 [0.50, 4.75], 0.4499, 46% |
| 3.18 Additional analgesia required (6) | 2, 1 (No) | RR [95% CI], P value, I2 | 7.47 [3.28, 16.99] < 0.0001, 0% | 9.26 [3.73, 23.03] < 0.0001, 0% | 9.66 [3.97, 23.52] < 0.0001, 0% | 9.23 [3.71, 22.95] < 0.0001, 0% | 7.65 [3.37, 17.38] < 0.0001, 0% | 9.27 [3.73, 23.03] < 0.0001, 0% | 8.1 [3.5, 18.75], < 0.0001, 0% |
| 3.19 Rate of caesarean delivery (9) | 1, 0 (No) | RR [95% CI], P value, I2 | 0.99 [0.81, 1.21], 0.9076, 0% | 1.0 [0.82, 1.22], 0.9858, 0% | 0.99 [0.81, 1.21], 0.9058, 0% | 1.0 [0.82, 1.22], 0.9857, 0% | 0.99 [0.81, 1.21], 0.9067, 0% | 1.0 [0.82, 1.22], 0.9857, 0% | 0.99 [0.81, 1.21], 0.9067, 0% |
| 3.20 Rate of assisted birth (8) | 1, 0 (No) | RR [95% CI], P value, I2 | 0.92 [0.66, 1.26], 0.5914, 0% | 0.94 [0.68, 1.30], 0.6917, 0% | 0.92 [0.66, 1.26], 0.5926, 0% | 0.94 [0.68, 1.30], 0.6918, 0% | 0.92 [0.66, 1.26], 0.5914, 0% | 0.94 [0.68, 1.30], 0.6917, 0% | 0.92 [0.66, 1.26], 0.5914, 0% |
| 3.26 Neonatal resuscitation (2) | 2, 0 (No) | RR [95% CI], P value, I2 | 1.01 [0.04, 24.25], 0.9933, 57% | 1.09 [0.00, 3.1E8], 0.9929, 0% | NA | NA | 1.02 [0.04, 25.09], 0.9901, 57% | 1.03 [0.00, 3.4E8], 0.9980, 0% | 1.02 [0.04, 25.09], 0.9901, 57% |
| 4.1 Respiratory depression (2) | 0, 2 (No) | RR [95% CI], P value, I2 | 1.0 [0.06, 15.66], 1.0, 0% | 1.0 [0.00, 1.0E12], 1.0, 0% | NA | NA | 0.98 [0.06, 15.37], 0.9896, 0% | 0.98 [0.00, 1.0E12], 0.9989, 0% | NA |
| 4.3 Hypotension (2) | 0, 2 (No) | RR [95% CI], P value, I2 | 1.0 [0.06, 15.66], 1.0, 0% | 1.0 [0.00, 1.0E12], 1.0, 0% | NA | NA | 0.98 [0.06, 15.37], 0.9896, 0% | 0.98 [0.00, 1.0E12], 0.9989, 0% | NA |
| 4.4 Bradycardia (2) | 0, 2 (No) | RR [95% CI], P value, I2 | 1.0 [0.06, 15.66], 1.0, 0% | 1.0 [0.00, 1.0E12], 1.0, 0% | NA | NA | 0.98 [0.06, 15.37], 0.9896, 0% | 0.98 [0.00, 1.0E12], 0.9989, 0% | NA |
| 4.8 Need for naloxone (2) | 0, 2 (No) | RR [95% CI], P value, I2 | 1.0 [0.06, 15.66], 1.0, 0% | 1.0 [0.00, 1.0E12], 1.0, 0% | NA | NA | 0.98 [0.06, 15.37], 0.9896, 0% | 0.98 [0.00, 1.0E12], 0.9989, 0% | NA |
| 1Review Manager 5 ignores zero/zero events trials and uses a constant continuity correction of 0.5 for studies with zero events in 1 arm. For the reciprocal, the empirical, and the constant approach including zero/zero‐event trials we used the TSA software. By using TSA there is no possibility to choose the Mantel‐Haenszel method (only inverse variance possible) which may cause small deviations within results. We performed sensitivity analyses by using different approaches for handling of zero event trials (reciprocal, empirical, and constant approach) in meta‐analysis with two or more studies. A) reciprocal approach ; value (k): 1.0, 0.01 Adds a factor of the reciprocal of the size of the opposite treatment arm to the cells which accounts for imbalance in group sizes. B) empirical approach ; value (k): 1.0, 0.01 All studies without zero events are used to calculate a pooled effect estimate. Using this effect estimate a continuity correction factor can be calculated which produces an estimated effect close to the pooled estimated effect in the studies with zero events in both arms. C) constant approach ; value (k): 1.0, 0.01 A value of 0.5 or 0.005, respectively, is added to each group in a 2 x 2 table; thus 1 participant is added to each intervention arm. Abbreviations: NA: not applicable; RR: risk ratio | |||||||||
| Study | Comparator | Analgesia duration (mean ± SD, median (range)) [min] | Background infusion [µg/(kg*min)] | Bolus dose | Bolus application speed (calculated) | Bolus dose escalation on request | Lockout time [min] | Maximum dose | Total dose administered (mean ± SD, median (range [IQR]) |
| Remifentanil variable infusion, fixed bolus | 463 | 0.025 | 0.25 µg/kg | NA | 0.5 ‐ 1 µg/kg, every 15 min | 2 | 3000 µg in 4 h | 474 (188 ‐ 925) µg/h | |
| Pethidine PCA | 147.5 ± 79 | no | 40 µg | 133.33 µg/min | no | 2 | NA | NA | |
| Meperidine IM | 280 ± 55 | 0.025 | 50 µg | 2 µg/min | no | 30 | NA | NA | |
| (1) Meperidine PCA (2) Fentanyl PCA | 234 ± 136 | no | 40 µg | NA | no | 2 | 1200 µg/h | 1840 ± 1090 µg | |
| epidural | 286 ± 145 | no | 40µg | 66.67 µg/min | no | 2 | 1200 µg/h | 2817 ± 1564 µg | |
| epidural | 192 ± 116 | no | 40µg | 66.67 µg/min | no | 2 | 1200 µg/h | 1417 µg | |
| epidural | NA | 0.0 | 0.25 µg/kg | 1.5 µg/(kg*min) | no | 5 | 3000 µg in 4 h | NA | |
| Meperidine IV | NA | no | 20 µg | NA | 5 µg increments, every 15 ‐ 20 min | 3 | 1500 µg/h | 1034.5 (133 ‐ 4021) µg | |
| epidural | NA | 0.025 | 20 µg | NA | 25% increase every 15 ‐ 20 min | 3 | NA | 8.5 ± 2.2 µg/(kg*h) | |
| epidural | 236 (128 ‐ 376) | no | 30 µg | NA | increase to 40 µg or decrease to 20 µg | 3 | 40 µg per bolus | NA | |
| epidural/CSE | NA | no | 25 µg | 25 µg/min | escalation scheme (0.1 – 0.2 – 0.3 – 0.5 – 0.7 – 0.9 µg/kg) until the maximum dose of 0.9 µg/kg | 1 | 25 µg/mL + 0.9 µg/kg per bolus | NA | |
| Remifentanil IV | NA | no | 0.25 µg/kg | NA | increased to 0.4 µg/kg (if VNRS ≥ 7) | 4 | 0.4 µg/kg per bolus | 942.6 ± 86.4 µg | |
| Pethidine IM | NA | no | 25 µg (< 60 kg) or 30 µg (≥ 60 kg) | 6.67 µg/min | no | 3.75‐4.50 | 500 µg/h (calculated) | NA | |
| Remifentanil IV | 1511 | no | 0.1 µg/kg | 0.2 µg/(kg*min) | increments of 0.1 µg/kg to 0.4 µg/kg | 2 | 0.4 µg/kg per bolus | 1340 (1220 ‐ 1480 [890 ‐ 1680]) µg | |
| epidural | NA | no | 20 µg | NA | up to 60 µg | 2 min, 1 min on request | 60 µg per bolus | 1725 ± 1392 µg | |
| epidural | 162.75 ± 77.15 | no | 20 µg | NA | 10 µg increments (if VAS decrease < 2) | 3 | NA | NA | |
| Meperidine IM | NA | no | 20 µg | 60 µg/min | NA | 3 | NA | NA | |
| epidural | 225 ± 117.2 | no | 0.15 µg/kg | 100 µg/min | 0.15 µg/kg increments every 15 min | 2 | No limit | NA | |
| Pethidine PCA | 334 ± 260 | no | 0.5 µg/kg | NA | no | 2 | No limit | 3670 (120 ‐ 4880) µg (mean (range)) | |
| epidural | Max. 60 | no | 25 µg | 25 µg/min | escalation scheme (0.1 – 0.2 – 0.33 – 0.5 – 0.7 – 0.9 µg/kg) until the maximum dose of 0.9 µg/kg | 1 | 25 µg/mL + 0.9 µg/kg per bolus | 0.14 (0.08 ‐ 0.18 [0.03 ‐ 0.32]) µg/(kg*min) | |
| 1Time from the start of remifentanil analgesia until the final dose increment, 50% survival (Kaplan‐Meier cumulative event curve) Abbreviations: NA: not applicable | |||||||||
| Outcome or subgroup title | No. of studies | No. of participants | Statistical method | Effect size |
| 1 Satisfaction with pain relief Show forest plot | 4 | 216 | Std. Mean Difference (IV, Random, 95% CI) | 2.11 [0.72, 3.49] |
| 2 Respiratory depression (< 8 breaths/min) Show forest plot | 1 | Risk Ratio (M‐H, Random, 95% CI) | Totals not selected | |
| 3 Oxygen desaturation (SpO2 < 95%) Show forest plot | 2 | 113 | Risk Ratio (M‐H, Random, 95% CI) | 0.48 [0.00, 47.37] |
| 4 Nausea (and vomiting) Show forest plot | 4 | 216 | Risk Ratio (M‐H, Random, 95% CI) | 0.54 [0.29, 0.99] |
| 5 Vomiting Show forest plot | 1 | Risk Ratio (M‐H, Random, 95% CI) | Totals not selected | |
| 6 Pruritus Show forest plot | 2 | 156 | Risk Ratio (M‐H, Random, 95% CI) | 0.0 [0.0, 0.0] |
| 7 Sedation (1 h) Show forest plot | 1 | Mean Difference (IV, Random, 95% CI) | Totals not selected | |
| 8 Apgar score < 7 at 5 min Show forest plot | 1 | Risk Ratio (M‐H, Random, 95% CI) | Totals not selected | |
| 9 Apgar score at 5 min Show forest plot | 1 | Mean Difference (IV, Random, 95% CI) | Totals not selected | |
| 10 FHR/CTG abnormalities, non‐reassuring fetal status Show forest plot | 2 | 156 | Risk Ratio (M‐H, Random, 95% CI) | 0.30 [0.10, 0.90] |
| 11 Pain intensity 'early' (1 h) Show forest plot | 3 | 180 | Std. Mean Difference (IV, Random, 95% CI) | ‐1.58 [‐2.69, ‐0.48] |
| 12 Pain intensity 'late' (2 h) Show forest plot | 1 | Mean Difference (IV, Random, 95% CI) | Totals not selected | |
| 13 Additional analgesia required (escape analgesia) Show forest plot | 3 | 190 | Risk Ratio (M‐H, Random, 95% CI) | 0.57 [0.40, 0.81] |
| 14 Rate of caesarean delivery Show forest plot | 4 | 215 | Risk Ratio (M‐H, Random, 95% CI) | 0.70 [0.34, 1.41] |
| 15 Rate of assisted birth Show forest plot | 4 | 215 | Risk Ratio (M‐H, Random, 95% CI) | 0.82 [0.32, 2.09] |
| 16 Augmented labour Show forest plot | 3 | 190 | Risk Ratio (M‐H, Random, 95% CI) | 0.97 [0.72, 1.29] |
| 17 Breastfeeding initiation (feeding difficulties) Show forest plot | 1 | Risk Ratio (M‐H, Random, 95% CI) | Totals not selected | |
| Outcome or subgroup title | No. of studies | No. of participants | Statistical method | Effect size |
| 1 Satisfaction with pain relief Show forest plot | 1 | Mean Difference (IV, Random, 95% CI) | Totals not selected | |
| 2 Oxygen desaturation (SpO2 < 95%) Show forest plot | 2 | 190 | Risk Ratio (M‐H, Random, 95% CI) | 1.28 [0.49, 3.30] |
| 3 Hypotension Show forest plot | 1 | Risk Ratio (M‐H, Random, 95% CI) | Totals not selected | |
| 4 Bradycardia Show forest plot | 1 | Risk Ratio (M‐H, Random, 95% CI) | Totals not selected | |
| 5 Nausea (and vomiting) Show forest plot | 1 | Risk Ratio (M‐H, Random, 95% CI) | Totals not selected | |
| 6 Pruritus Show forest plot | 1 | Risk Ratio (M‐H, Random, 95% CI) | Totals not selected | |
| 7 Sedation (1 h) Show forest plot | 1 | Mean Difference (IV, Random, 95% CI) | Totals not selected | |
| 8 Apgar score < 7 at 5 min Show forest plot | 1 | Risk Ratio (M‐H, Random, 95% CI) | Totals not selected | |
| 9 Apgar score at 5 min Show forest plot | 1 | Mean Difference (IV, Random, 95% CI) | Totals not selected | |
| 10 Need for naloxone Show forest plot | 2 | 55 | Risk Ratio (M‐H, Random, 95% CI) | 0.30 [0.01, 6.47] |
| 11 FHR/CTG abnormalities, non‐reassuring fetal status Show forest plot | 1 | Risk Ratio (M‐H, Random, 95% CI) | Totals not selected | |
| 12 NACS at 15/30 min Show forest plot | 2 | 94 | Mean Difference (IV, Random, 95% CI) | 1.11 [‐0.65, 2.87] |
| 13 Pain intensity 'early' (30 min/1 h) Show forest plot | 3 | 215 | Std. Mean Difference (IV, Random, 95% CI) | ‐0.51 [‐1.01, ‐0.00] |
| 14 Pain intensity 'late' (2 h) Show forest plot | 1 | Mean Difference (IV, Random, 95% CI) | Totals not selected | |
| 15 Additional analgesia required (escape analgesia) Show forest plot | 3 | 215 | Risk Ratio (M‐H, Random, 95% CI) | 0.76 [0.45, 1.28] |
| 16 Rate of caesarean delivery Show forest plot | 2 | 143 | Risk Ratio (M‐H, Random, 95% CI) | 2.78 [0.99, 7.82] |
| 17 Rate of assisted birth Show forest plot | 2 | 143 | Risk Ratio (M‐H, Random, 95% CI) | 1.22 [0.62, 2.37] |
| 18 Augmented labour Show forest plot | 2 | 152 | Risk Ratio (M‐H, Random, 95% CI) | 1.37 [0.59, 3.15] |
| Outcome or subgroup title | No. of studies | No. of participants | Statistical method | Effect size |
| 1 Satisfaction with pain relief Show forest plot | 7 | 2135 | Std. Mean Difference (IV, Random, 95% CI) | ‐0.22 [‐0.40, ‐0.04] |
| 2 Apnoea Show forest plot | 1 | Risk Ratio (M‐H, Random, 95% CI) | Totals not selected | |
| 3 Respiratory depression (< 9, < 8 breaths/min) Show forest plot | 3 | 687 | Risk Ratio (M‐H, Random, 95% CI) | 1.52 [0.23, 9.90] |
| 4 Oxygen desaturation (SpO2 < 92%) Show forest plot | 3 | 774 | Risk Ratio (M‐H, Random, 95% CI) | 3.24 [1.66, 6.32] |
| 5 Oxygen desaturation (SpO2 < 95%) Show forest plot | 3 | 800 | Risk Ratio (M‐H, Random, 95% CI) | 3.27 [2.32, 4.61] |
| 6 Hypotension Show forest plot | 4 | 823 | Risk Ratio (M‐H, Random, 95% CI) | 0.58 [0.22, 1.49] |
| 7 Bradycardia Show forest plot | 2 | 44 | Risk Ratio (M‐H, Random, 95% CI) | 0.0 [0.0, 0.0] |
| 8 Nausea Show forest plot | 8 | 1909 | Risk Ratio (M‐H, Random, 95% CI) | 1.49 [1.19, 1.86] |
| 9 Vomiting Show forest plot | 6 | 1840 | Risk Ratio (M‐H, Random, 95% CI) | 1.63 [1.25, 2.13] |
| 10 Pruritus Show forest plot | 7 | 1852 | Risk Ratio (M‐H, Random, 95% CI) | 0.75 [0.48, 1.18] |
| 11 Sedation (1 h) Show forest plot | 3 | 148 | Std. Mean Difference (IV, Random, 95% CI) | 0.71 [0.03, 1.39] |
| 12 Apgar score ≤ 7 (< 7) at 5 min Show forest plot | 5 | 1322 | Risk Ratio (M‐H, Random, 95% CI) | 1.28 [0.65, 2.51] |
| 13 Apgar score at 5 min Show forest plot | 3 | 137 | Mean Difference (IV, Random, 95% CI) | 0.06 [‐0.27, 0.39] |
| 14 Need for naloxone Show forest plot | 2 | 1170 | Risk Ratio (M‐H, Random, 95% CI) | 0.20 [0.01, 3.85] |
| 15 FHR/CTG abnormalities, non‐reassuring fetal status Show forest plot | 5 | 1280 | Risk Ratio (M‐H, Random, 95% CI) | 1.55 [0.49, 4.92] |
| 16 Pain intensity 'early' (1 h) Show forest plot | 6 | 235 | Std. Mean Difference (IV, Random, 95% CI) | 0.57 [0.31, 0.84] |
| 17 Pain intensity 'late' (2 h) Show forest plot | 4 | 143 | Std. Mean Difference (IV, Random, 95% CI) | 1.46 [0.66, 2.26] |
| 18 Additional analgesia required Show forest plot | 6 | 1037 | Risk Ratio (M‐H, Random, 95% CI) | 8.10 [3.50, 18.75] |
| 19 Rate of caesarean delivery Show forest plot | 9 | 1578 | Risk Ratio (M‐H, Random, 95% CI) | 0.99 [0.81, 1.21] |
| 20 Rate of assisted birth Show forest plot | 8 | 1550 | Risk Ratio (M‐H, Random, 95% CI) | 0.92 [0.66, 1.26] |
| 21 Augmented labour Show forest plot | 6 | 1379 | Risk Ratio (M‐H, Random, 95% CI) | 0.91 [0.82, 1.02] |
| 22 Umbilical cord base excess (artery) Show forest plot | 3 | 75 | Mean Difference (IV, Random, 95% CI) | ‐0.97 [‐2.65, 0.72] |
| 23 Umbilical cord base excess (venous) Show forest plot | 2 | 129 | Mean Difference (IV, Random, 95% CI) | ‐0.05 [‐2.39, 2.30] |
| 24 Umbilical cord pH (artery) Show forest plot | 5 | 1245 | Mean Difference (IV, Random, 95% CI) | ‐0.01 [‐0.02, ‐0.00] |
| 25 Umbilical cord pH (venous) Show forest plot | 4 | 1299 | Mean Difference (IV, Random, 95% CI) | 0.01 [‐0.01, 0.02] |
| 26 Neonatal resuscitation Show forest plot | 2 | 69 | Risk Ratio (M‐H, Random, 95% CI) | 1.02 [0.04, 25.09] |
| Outcome or subgroup title | No. of studies | No. of participants | Statistical method | Effect size |
| 1 Respiratory depression (< 8 breaths/min) Show forest plot | 2 | 135 | Risk Ratio (M‐H, Random, 95% CI) | 0.0 [0.0, 0.0] |
| 2 Oxygen desaturation (SpO2 < 95%) Show forest plot | 1 | Risk Ratio (M‐H, Random, 95% CI) | Totals not selected | |
| 3 Hypotension Show forest plot | 2 | 135 | Risk Ratio (M‐H, Random, 95% CI) | 0.0 [0.0, 0.0] |
| 4 Bradycardia Show forest plot | 2 | 135 | Risk Ratio (M‐H, Random, 95% CI) | 0.0 [0.0, 0.0] |
| 5 Nausea (and vomiting) Show forest plot | 2 | 135 | Risk Ratio (M‐H, Random, 95% CI) | 0.85 [0.28, 2.54] |
| 6 Pruritus Show forest plot | 1 | Risk Ratio (M‐H, Random, 95% CI) | Totals not selected | |
| 7 Sedation (1 h) Show forest plot | 1 | Mean Difference (IV, Random, 95% CI) | Totals not selected | |
| 8 Need for naloxone Show forest plot | 2 | 135 | Risk Ratio (M‐H, Random, 95% CI) | 0.0 [0.0, 0.0] |
| 9 FHR/CTG abnormalities, non‐reassuring fetal status Show forest plot | 1 | Risk Ratio (M‐H, Random, 95% CI) | Totals not selected | |
| 10 Pain intensity 'early' (1 h) Show forest plot | 1 | Mean Difference (IV, Random, 95% CI) | Totals not selected | |
| 11 Pain intensity 'late' (2 h) Show forest plot | 1 | Mean Difference (IV, Random, 95% CI) | Totals not selected | |
| 12 Additional analgesia required (escape analgesia) Show forest plot | 1 | Risk Ratio (M‐H, Random, 95% CI) | Totals not selected | |
| 13 Neonatal resuscitation Show forest plot | 1 | Risk Ratio (M‐H, Random, 95% CI) | Totals not selected | |
| Outcome or subgroup title | No. of studies | No. of participants | Statistical method | Effect size |
| 1 Satisfaction with pain relief Show forest plot | 1 | Mean Difference (IV, Random, 95% CI) | Totals not selected | |
| 2 Oxygen desaturation (SpO2 < 95%) Show forest plot | 1 | Risk Ratio (M‐H, Random, 95% CI) | Totals not selected | |
| 3 Hypotension Show forest plot | 1 | Risk Ratio (M‐H, Random, 95% CI) | Totals not selected | |
| 4 Bradycardia Show forest plot | 1 | Risk Ratio (M‐H, Random, 95% CI) | Totals not selected | |
| 5 Nausea Show forest plot | 1 | Risk Ratio (M‐H, Random, 95% CI) | Totals not selected | |
| 6 Vomiting Show forest plot | 1 | Risk Ratio (M‐H, Random, 95% CI) | Totals not selected | |
| 7 Pruritus Show forest plot | 1 | Risk Ratio (M‐H, Random, 95% CI) | Totals not selected | |
| 8 Apgar score < 7 at 5 min Show forest plot | 1 | Risk Ratio (M‐H, Random, 95% CI) | Totals not selected | |
| 9 Need for naloxone Show forest plot | 1 | Risk Ratio (M‐H, Random, 95% CI) | Totals not selected | |
| 10 FHR/CTG abnormalities, non‐reassuring fetal status Show forest plot | 1 | Risk Ratio (M‐H, Random, 95% CI) | Totals not selected | |
| 11 Additional analgesia required (escape analgesia) Show forest plot | 1 | Risk Ratio (M‐H, Random, 95% CI) | Totals not selected | |
| 12 Rate of caesarean delivery Show forest plot | 1 | Risk Ratio (M‐H, Random, 95% CI) | Totals not selected | |
| 13 Augmented labour Show forest plot | 1 | Risk Ratio (M‐H, Random, 95% CI) | Totals not selected | |
| 14 Umbilical cord base excess (artery) Show forest plot | 1 | Mean Difference (IV, Random, 95% CI) | Totals not selected | |
| 15 Umbilical cord base excess (venous) Show forest plot | 1 | Mean Difference (IV, Random, 95% CI) | Totals not selected | |
| 16 Umbilical cord pH (artery) Show forest plot | 1 | Mean Difference (IV, Random, 95% CI) | Totals not selected | |
| 17 Umbilical cord pH (venous) Show forest plot | 1 | Mean Difference (IV, Random, 95% CI) | Totals not selected | |
| 18 Neonatal resuscitation Show forest plot | 1 | Risk Ratio (M‐H, Random, 95% CI) | Totals not selected | |