Analgesia controlada por la paciente con remifentanilo versus métodos parenterales alternativos para el tratamiento del dolor del trabajo de parto
Information
- DOI:
- https://doi.org/10.1002/14651858.CD011989.pub2Copy DOI

- Database:
-
- Cochrane Database of Systematic Reviews
- Version published:
-
- 13 April 2017see what's new
- Type:
-
- Intervention
- Stage:
-
- Review
- Cochrane Editorial Group:
-
Cochrane Pregnancy and Childbirth Group
- Copyright:
-
- Copyright © 2017 The Cochrane Collaboration. Published by John Wiley & Sons, Ltd.
Article metrics
Altmetric:
Cited by:
Authors
Contributions of authors
Stephanie Weibel (SW), Yvonne Jelting (YJ), Arash Afshari (AA), Nathan Leon Pace (NLP), Leopold HJ Eberhart (LE), Johanna Jokinen (JJ), Thorsten Artmann (TA), Peter Kranke (PK)
Conceiving the review: PK
Co‐ordinating the review: PK, SW, YJ
Undertaking manual searches: YJ, SW
Screening search results: SW, YJ
Organizing retrieval of papers: SW, YJ
Screening retrieved papers against inclusion criteria: SW, YJ
Appraising quality of papers: SW, YJ, PK, AA
Abstracting data from papers: SW, YJ
Writing to authors of papers for additional information: YJ, SW
Data management for the review: SW
Entering data into Review Manager 5 (RevMan 5.3): SW
RevMan statistical data: SW, NLP
Other statistical analysis not using RevMan: SW, NLP, AA
Double entry of data: (data entered by person one: SW; data checked by person two: YJ)
Interpretation of data: PK, SW, YJ, AA, NLP, LE, JJ, TA
Statistical inferences: SW, PK, NLP, AA
Writing the review: SW, YJ, PK
Securing funding for the review: PK
Performing previous work that was the foundation of the present study: PK, JJ, TA
Guarantor for the review (one author): PK
Person responsible for reading and checking review before submission: PK
All authors reviewed the final and previous drafts.
Sources of support
Internal sources
-
Stephanie Weibel, Germany.
Department of Anaesthesia and Critical Care, University of Wuerzburg
-
Yvonne Jelting, Germany.
Department of Anaesthesia and Critical Care, University of Wuerzburg
-
Arash Afshari, Denmark.
Juliane Marie Centre ‐ Anaesthesia and Surgical Clinic Department 4013, Copenhagen University Hospital
-
Nathan L Pace, USA.
Department of Anesthesiology, University of Utah
-
Leopold HJ Eberhart, Germany.
Department of Anaesthesiology & Intensive Care Medicine, Philipps‐University Marburg
-
Johanna Jokinen, Germany.
Department of Anaesthesia and Critical Care, University of Wuerzburg
-
Thorsten Artmann, Germany.
Department of Anaesthesia and Intensive Care Medicine, Cnopf Children´s Hospital, Hospital Hallerwiese, Nuernberg
-
Peter Kranke, Germany.
Department of Anaesthesia and Critical Care, University of Wuerzburg
External sources
-
Meta‐Analysis Grant of the European Society of Anaesthesiology, Belgium.
Peter Kranke received a grant supporting this review from the European Society of Anaesthesiology
Declarations of interest
Stephanie Weibel: has no conflict of interest regarding the topic of this review. Stephanie Weibel is an academic researcher. She has received personal payments for consultancies and lecture fees from Genelux Corporation, San Diego, USA (ended March 2014). Genelux Corp does not produce any products of the intervention of interest of this review.
Yvonne Jelting: none known.
Arash Afshari: none known.
Nathan L Pace: has no conflict of interest regarding the topic of this review. Nathan L Pace has received payment for development of educational presentations (Barash, Cullen, Stoelting Clinical Anesthesia 8th edition) and provided consultancy (St Marks Hospital, Salt Lake City, UT) on topics not related to the current review. He has received supplements to attend Cochrane meetings. He also has stocks and shares in companies which have no interest in the topic of this review (TIAA‐CREF, Fidelity, Vanguard, USAA, MorganStanley).
Leopold HJ Eberhart: has no conflict of interest regarding the topic of this review. Leopold HJ Eberhart has received lecture fees (from Baxter GmbH and Fresenius GmbH), payment for lectures (from Grünenthal GmbH, Baxter GmbH and Fresenius, GmbH) and has provided consultancy (for Grünenthal GmbH, Baxter GmbH, ratiopharm GmbH) for topics not related to the current review. He holds a board membership (with Grünenthal GmbH Deutschland) who do not have an interest in the topic of this review.
Johanna Jokinen: none known.
Thorsten Artmann: none known.
Peter Kranke: has no conflict of interest regarding the topic of this review. Peter Kranke has received lecture fees (from FreseniusKabi, MSD, Ratiopharm, Covidien) and has provided consultancy (to MSD, FreseniusKabi, Ratiopharm, Covidien) on topics not related to the current review. He has been involved in the conduct of Phase II and phase III clinical trials not related to the current review. He has published a case series on remifentanil for labour analgesia and has published research reports and editorial views on the topic under review. He has received a Meta‐Analysis grant supporting this review from the European Society of Anaesthesiology (ESA).
Acknowledgements
We would like to thank Elisabeth Friedrich‐Würstlein (University library, Wuerzburg) for her assistance during the literature search and organising full texts of the relevant publications.
This project was supported by the National Institute for Health Research, via Cochrane Infrastructure funding to Cochrane Pregnancy and Childbirth. The views and opinions expressed therein are those of the authors and do not necessarily reflect those of the Systematic Reviews Programme, NIHR, NHS or the Department of Health.
As part of the pre‐publication editorial process, this review has been commented on by three peers (an editor and two referees who are external to the editorial team) and the Group's Statistical Adviser.
Peter Kranke: received a Meta‐Analysis grant supporting this review from the European Society of Anaesthesiology.
Version history
| Published | Title | Stage | Authors | Version |
| 2017 Apr 13 | Patient‐controlled analgesia with remifentanil versus alternative parenteral methods for pain management in labour | Review | Stephanie Weibel, Yvonne Jelting, Arash Afshari, Nathan Leon Pace, Leopold HJ Eberhart, Johanna Jokinen, Thorsten Artmann, Peter Kranke | |
| 2015 Dec 12 | Patient‐controlled analgesia with remifentanil versus alternative parenteral methods for pain management in labour | Protocol | Johanna Jokinen, Stephanie Weibel, Arash Afshari, Thorsten Artmann, Leopold HJ Eberhart, Nathan Leon Pace, Yvonne Jelting, Peter Kranke | |
Differences between protocol and review
Change to the authors of the review since publication of the protocol (Jokinen 2015)
The order of the authors list was changed in the current review in accordance to their contributions as described in the Contributions of authors section.
Difference in the methods used between the protocol and the review
1. One comparison was introduced: we have introduced as a new comparator 'remifentanil using the same mode (PCA), but different regimen (e.g. increasing bolus versus constant bolus)' since we could identify one relevant trial and we believe that the administration regimen of remifentanil (PCA) might be relevant for several safety aspects of this intervention.
2. Order of comparisons was changed: we re‐ordered the comparators. In the protocol 'placebo or no treatment' was set as the main comparator. However, studies for this comparison were not available and were also considered to be ethically not feasible. 'Remifentanil (PCA)' versus 'another opioid (IV/IM)' was set as main comparison since the usage of other opioids administered either IV or IM was from the global point of view the most used analgesia for labour pain today.
2. Two outcomes were introduced: we introduced 'neonatal neurologic and adaptive score (NACS)' as an outcome within the domain 'adverse events for newborns' and 'augmented labour (e.g. use of oxytocin)'.
3. GRADE approach: a detailed description of applying the GRADE approach was not given at the protocol stage. However, assessment of the quality of evidence in the current review followed the GRADE guidelines and is now described in detail in the Assessment of risk of bias in included studies section.
4. Handling of median and IQR was changed: at the protocol stage we planned to include all data reported as median with IQR and transform those into mean with SD in accordance to Higgins 2011 followed by a sensitivity analysis to test robustness of the estimated effect with respect to exclusion of trials reporting median and IQR data. In the current review, we decided to include only median and IQR values with a symmetric distribution and data with an asymmetric distribution were not included into the meta‐analysis. Since under a symmetric situation the assumption of 'the median is equal to the mean' is given, we renounced performing a sensitivity analysis.
5. Handling of zero total event trials: we did not plan to include trials reporting zero events in both arms at the protocol stage. However, we think that inclusion of trials with total zero events reduces the risk of inflating the magnitude of the pooled effect. We performed a sensitivity analysis to investigate the impact of inclusion of total zero event trials by different approaches on the robustness of the estimated effects. Handling of zero event trials is described in detail in the Data synthesis section.
5. Trial sequential analysis (TSA) and OIS considerations were introduced: at the protocol stage we did not plan to perform TSA or OIS considerations to calculate the required or optimal information size, respectively. However, we think that those considerations help us to more reliably assess the quality of the evidence. Therefore, we have incorporated the TSA and OIS approach into the assessment of 'imprecision' (GRADE). Since the assumptions for TSA and OIS calculations were made in a post‐hoc manner, we adopted the assumptions from the pooled estimates obtained from either 'low risk of bias' trials or all meta‐analysed trials ('empirical'). The assumptions may not in every case perfectly meet the clinical practice, however, it seems to us to be the most objective approach to set the basic conditions.
6. Restriction of subgroup and sensitivity analyses on designated outcomes was extended: in the protocol we specified that all subgroup and sensitivity analyses should be restricted to the primary outcomes. During preparation of the review we extended the restriction to all GRADE‐relevant outcomes from which two are secondary outcomes. Sensitivity analyses are essential for the assessment of the quality of evidence by the GRADE approach.
Keywords
MeSH
Medical Subject Headings (MeSH) Keywords
- *Analgesics, Opioid [administration & dosage, adverse effects];
- *Piperidines [administration & dosage, adverse effects];
- Analgesia, Epidural [adverse effects];
- Analgesia, Obstetrical [*methods];
- Analgesia, Patient‐Controlled [*methods];
- Apnea [chemically induced];
- Cesarean Section [statistics & numerical data];
- Labor Pain [*drug therapy];
- Pain Measurement;
- Patient Satisfaction;
- Randomized Controlled Trials as Topic;
- Remifentanil;
Medical Subject Headings Check Words
Female; Humans; Infant, Newborn; Pregnancy;
PICOs
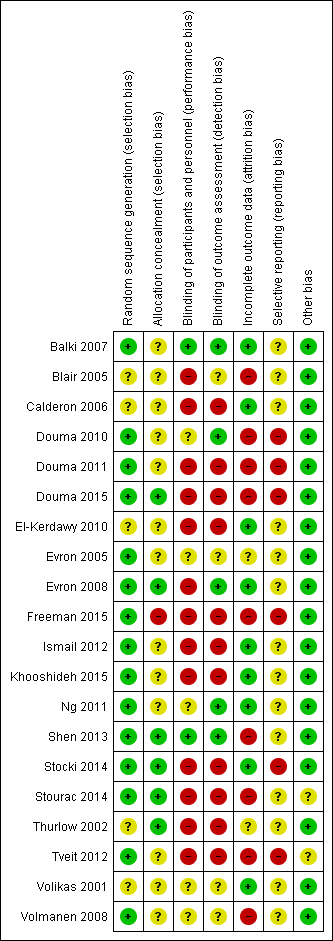
'Risk of bias' summary: review authors' judgements about each risk of bias item for each included study.

'Risk of bias' graph: review authors' judgements about each risk of bias item presented as percentages across all included studies.
Abbreviations:
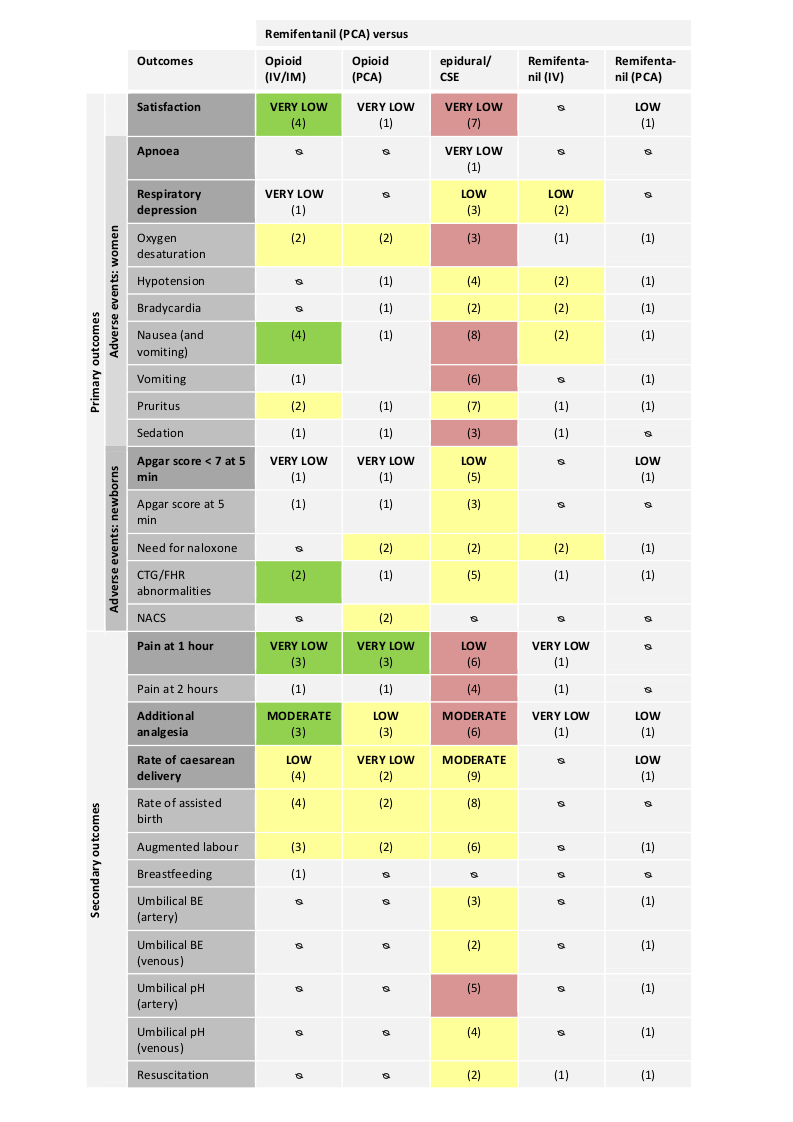
IV: intravenous; IM: intramuscular; PCA: patient‐controlled analgesia; CTG: cardiotocography; FHR: fetal heart rate; NACS: neonatal neurologic and adaptive capacity score; BE: base excess.
Direction of estimated effects (results of meta‐analyses) for all primary and secondary outcomes with two or more studies and level of evidence (GRADE) for all GRADE‐relevant, pre‐defined outcomes:
The direction of the estimated effects were labelled as green (favours remifentanil (PCA)), red (favours control), yellow (neither favour of remifentanil (PCA) nor control), (1) (only one RCT, no meta‐analysis performed), ∅ (no RCTs available).
The GRADE levels of the evidence were expressed as VERY LOW, LOW, MODERATE, and HIGH for all GRADE‐relevant outcomes (dark grey, bold). For details on GRADE levels of evidence see the summary of findings tables (summary of findings Table for the main comparison; summary of findings Table 2; summary of findings Table 3; summary of findings Table 4; summary of findings Table 5).

Comparison 1 Remifentanil (PCA) versus another opioid (IV/IM), Outcome 1 Satisfaction with pain relief.

Comparison 1 Remifentanil (PCA) versus another opioid (IV/IM), Outcome 2 Respiratory depression (< 8 breaths/min).

Comparison 1 Remifentanil (PCA) versus another opioid (IV/IM), Outcome 3 Oxygen desaturation (SpO2 < 95%).

Comparison 1 Remifentanil (PCA) versus another opioid (IV/IM), Outcome 4 Nausea (and vomiting).

Comparison 1 Remifentanil (PCA) versus another opioid (IV/IM), Outcome 5 Vomiting.

Comparison 1 Remifentanil (PCA) versus another opioid (IV/IM), Outcome 6 Pruritus.

Comparison 1 Remifentanil (PCA) versus another opioid (IV/IM), Outcome 7 Sedation (1 h).

Comparison 1 Remifentanil (PCA) versus another opioid (IV/IM), Outcome 8 Apgar score < 7 at 5 min.

Comparison 1 Remifentanil (PCA) versus another opioid (IV/IM), Outcome 9 Apgar score at 5 min.

Comparison 1 Remifentanil (PCA) versus another opioid (IV/IM), Outcome 10 FHR/CTG abnormalities, non‐reassuring fetal status.

Comparison 1 Remifentanil (PCA) versus another opioid (IV/IM), Outcome 11 Pain intensity 'early' (1 h).

Comparison 1 Remifentanil (PCA) versus another opioid (IV/IM), Outcome 12 Pain intensity 'late' (2 h).

Comparison 1 Remifentanil (PCA) versus another opioid (IV/IM), Outcome 13 Additional analgesia required (escape analgesia).

Comparison 1 Remifentanil (PCA) versus another opioid (IV/IM), Outcome 14 Rate of caesarean delivery.

Comparison 1 Remifentanil (PCA) versus another opioid (IV/IM), Outcome 15 Rate of assisted birth.

Comparison 1 Remifentanil (PCA) versus another opioid (IV/IM), Outcome 16 Augmented labour.

Comparison 1 Remifentanil (PCA) versus another opioid (IV/IM), Outcome 17 Breastfeeding initiation (feeding difficulties).

Comparison 2 Remifentanil (PCA) versus another opioid (PCA), Outcome 1 Satisfaction with pain relief.

Comparison 2 Remifentanil (PCA) versus another opioid (PCA), Outcome 2 Oxygen desaturation (SpO2 < 95%).

Comparison 2 Remifentanil (PCA) versus another opioid (PCA), Outcome 3 Hypotension.

Comparison 2 Remifentanil (PCA) versus another opioid (PCA), Outcome 4 Bradycardia.

Comparison 2 Remifentanil (PCA) versus another opioid (PCA), Outcome 5 Nausea (and vomiting).

Comparison 2 Remifentanil (PCA) versus another opioid (PCA), Outcome 6 Pruritus.

Comparison 2 Remifentanil (PCA) versus another opioid (PCA), Outcome 7 Sedation (1 h).

Comparison 2 Remifentanil (PCA) versus another opioid (PCA), Outcome 8 Apgar score < 7 at 5 min.

Comparison 2 Remifentanil (PCA) versus another opioid (PCA), Outcome 9 Apgar score at 5 min.

Comparison 2 Remifentanil (PCA) versus another opioid (PCA), Outcome 10 Need for naloxone.

Comparison 2 Remifentanil (PCA) versus another opioid (PCA), Outcome 11 FHR/CTG abnormalities, non‐reassuring fetal status.

Comparison 2 Remifentanil (PCA) versus another opioid (PCA), Outcome 12 NACS at 15/30 min.

Comparison 2 Remifentanil (PCA) versus another opioid (PCA), Outcome 13 Pain intensity 'early' (30 min/1 h).

Comparison 2 Remifentanil (PCA) versus another opioid (PCA), Outcome 14 Pain intensity 'late' (2 h).

Comparison 2 Remifentanil (PCA) versus another opioid (PCA), Outcome 15 Additional analgesia required (escape analgesia).

Comparison 2 Remifentanil (PCA) versus another opioid (PCA), Outcome 16 Rate of caesarean delivery.

Comparison 2 Remifentanil (PCA) versus another opioid (PCA), Outcome 17 Rate of assisted birth.

Comparison 2 Remifentanil (PCA) versus another opioid (PCA), Outcome 18 Augmented labour.

Comparison 3 Remifentanil (PCA) versus epidural/combined spinal‐epidural analgesia (CSE), Outcome 1 Satisfaction with pain relief.

Comparison 3 Remifentanil (PCA) versus epidural/combined spinal‐epidural analgesia (CSE), Outcome 2 Apnoea.

Comparison 3 Remifentanil (PCA) versus epidural/combined spinal‐epidural analgesia (CSE), Outcome 3 Respiratory depression (< 9, < 8 breaths/min).

Comparison 3 Remifentanil (PCA) versus epidural/combined spinal‐epidural analgesia (CSE), Outcome 4 Oxygen desaturation (SpO2 < 92%).

Comparison 3 Remifentanil (PCA) versus epidural/combined spinal‐epidural analgesia (CSE), Outcome 5 Oxygen desaturation (SpO2 < 95%).

Comparison 3 Remifentanil (PCA) versus epidural/combined spinal‐epidural analgesia (CSE), Outcome 6 Hypotension.

Comparison 3 Remifentanil (PCA) versus epidural/combined spinal‐epidural analgesia (CSE), Outcome 7 Bradycardia.

Comparison 3 Remifentanil (PCA) versus epidural/combined spinal‐epidural analgesia (CSE), Outcome 8 Nausea.

Comparison 3 Remifentanil (PCA) versus epidural/combined spinal‐epidural analgesia (CSE), Outcome 9 Vomiting.

Comparison 3 Remifentanil (PCA) versus epidural/combined spinal‐epidural analgesia (CSE), Outcome 10 Pruritus.

Comparison 3 Remifentanil (PCA) versus epidural/combined spinal‐epidural analgesia (CSE), Outcome 11 Sedation (1 h).

Comparison 3 Remifentanil (PCA) versus epidural/combined spinal‐epidural analgesia (CSE), Outcome 12 Apgar score ≤ 7 (< 7) at 5 min.

Comparison 3 Remifentanil (PCA) versus epidural/combined spinal‐epidural analgesia (CSE), Outcome 13 Apgar score at 5 min.

Comparison 3 Remifentanil (PCA) versus epidural/combined spinal‐epidural analgesia (CSE), Outcome 14 Need for naloxone.

Comparison 3 Remifentanil (PCA) versus epidural/combined spinal‐epidural analgesia (CSE), Outcome 15 FHR/CTG abnormalities, non‐reassuring fetal status.

Comparison 3 Remifentanil (PCA) versus epidural/combined spinal‐epidural analgesia (CSE), Outcome 16 Pain intensity 'early' (1 h).

Comparison 3 Remifentanil (PCA) versus epidural/combined spinal‐epidural analgesia (CSE), Outcome 17 Pain intensity 'late' (2 h).

Comparison 3 Remifentanil (PCA) versus epidural/combined spinal‐epidural analgesia (CSE), Outcome 18 Additional analgesia required.

Comparison 3 Remifentanil (PCA) versus epidural/combined spinal‐epidural analgesia (CSE), Outcome 19 Rate of caesarean delivery.

Comparison 3 Remifentanil (PCA) versus epidural/combined spinal‐epidural analgesia (CSE), Outcome 20 Rate of assisted birth.

Comparison 3 Remifentanil (PCA) versus epidural/combined spinal‐epidural analgesia (CSE), Outcome 21 Augmented labour.

Comparison 3 Remifentanil (PCA) versus epidural/combined spinal‐epidural analgesia (CSE), Outcome 22 Umbilical cord base excess (artery).

Comparison 3 Remifentanil (PCA) versus epidural/combined spinal‐epidural analgesia (CSE), Outcome 23 Umbilical cord base excess (venous).

Comparison 3 Remifentanil (PCA) versus epidural/combined spinal‐epidural analgesia (CSE), Outcome 24 Umbilical cord pH (artery).

Comparison 3 Remifentanil (PCA) versus epidural/combined spinal‐epidural analgesia (CSE), Outcome 25 Umbilical cord pH (venous).

Comparison 3 Remifentanil (PCA) versus epidural/combined spinal‐epidural analgesia (CSE), Outcome 26 Neonatal resuscitation.

Comparison 4 Remifentanil (PCA) versus remifentanil (continuous IV), Outcome 1 Respiratory depression (< 8 breaths/min).

Comparison 4 Remifentanil (PCA) versus remifentanil (continuous IV), Outcome 2 Oxygen desaturation (SpO2 < 95%).

Comparison 4 Remifentanil (PCA) versus remifentanil (continuous IV), Outcome 3 Hypotension.

Comparison 4 Remifentanil (PCA) versus remifentanil (continuous IV), Outcome 4 Bradycardia.

Comparison 4 Remifentanil (PCA) versus remifentanil (continuous IV), Outcome 5 Nausea (and vomiting).

Comparison 4 Remifentanil (PCA) versus remifentanil (continuous IV), Outcome 6 Pruritus.

Comparison 4 Remifentanil (PCA) versus remifentanil (continuous IV), Outcome 7 Sedation (1 h).

Comparison 4 Remifentanil (PCA) versus remifentanil (continuous IV), Outcome 8 Need for naloxone.

Comparison 4 Remifentanil (PCA) versus remifentanil (continuous IV), Outcome 9 FHR/CTG abnormalities, non‐reassuring fetal status.

Comparison 4 Remifentanil (PCA) versus remifentanil (continuous IV), Outcome 10 Pain intensity 'early' (1 h).

Comparison 4 Remifentanil (PCA) versus remifentanil (continuous IV), Outcome 11 Pain intensity 'late' (2 h).

Comparison 4 Remifentanil (PCA) versus remifentanil (continuous IV), Outcome 12 Additional analgesia required (escape analgesia).

Comparison 4 Remifentanil (PCA) versus remifentanil (continuous IV), Outcome 13 Neonatal resuscitation.

Comparison 5 Remifentanil (PCA, increasing bolus, fixed infusion dose) versus remifentanil (PCA, increasing infusion, fixed bolus dose), Outcome 1 Satisfaction with pain relief.

Comparison 5 Remifentanil (PCA, increasing bolus, fixed infusion dose) versus remifentanil (PCA, increasing infusion, fixed bolus dose), Outcome 2 Oxygen desaturation (SpO2 < 95%).

Comparison 5 Remifentanil (PCA, increasing bolus, fixed infusion dose) versus remifentanil (PCA, increasing infusion, fixed bolus dose), Outcome 3 Hypotension.

Comparison 5 Remifentanil (PCA, increasing bolus, fixed infusion dose) versus remifentanil (PCA, increasing infusion, fixed bolus dose), Outcome 4 Bradycardia.

Comparison 5 Remifentanil (PCA, increasing bolus, fixed infusion dose) versus remifentanil (PCA, increasing infusion, fixed bolus dose), Outcome 5 Nausea.

Comparison 5 Remifentanil (PCA, increasing bolus, fixed infusion dose) versus remifentanil (PCA, increasing infusion, fixed bolus dose), Outcome 6 Vomiting.

Comparison 5 Remifentanil (PCA, increasing bolus, fixed infusion dose) versus remifentanil (PCA, increasing infusion, fixed bolus dose), Outcome 7 Pruritus.

Comparison 5 Remifentanil (PCA, increasing bolus, fixed infusion dose) versus remifentanil (PCA, increasing infusion, fixed bolus dose), Outcome 8 Apgar score < 7 at 5 min.

Comparison 5 Remifentanil (PCA, increasing bolus, fixed infusion dose) versus remifentanil (PCA, increasing infusion, fixed bolus dose), Outcome 9 Need for naloxone.

Comparison 5 Remifentanil (PCA, increasing bolus, fixed infusion dose) versus remifentanil (PCA, increasing infusion, fixed bolus dose), Outcome 10 FHR/CTG abnormalities, non‐reassuring fetal status.

Comparison 5 Remifentanil (PCA, increasing bolus, fixed infusion dose) versus remifentanil (PCA, increasing infusion, fixed bolus dose), Outcome 11 Additional analgesia required (escape analgesia).

Comparison 5 Remifentanil (PCA, increasing bolus, fixed infusion dose) versus remifentanil (PCA, increasing infusion, fixed bolus dose), Outcome 12 Rate of caesarean delivery.

Comparison 5 Remifentanil (PCA, increasing bolus, fixed infusion dose) versus remifentanil (PCA, increasing infusion, fixed bolus dose), Outcome 13 Augmented labour.

Comparison 5 Remifentanil (PCA, increasing bolus, fixed infusion dose) versus remifentanil (PCA, increasing infusion, fixed bolus dose), Outcome 14 Umbilical cord base excess (artery).

Comparison 5 Remifentanil (PCA, increasing bolus, fixed infusion dose) versus remifentanil (PCA, increasing infusion, fixed bolus dose), Outcome 15 Umbilical cord base excess (venous).

Comparison 5 Remifentanil (PCA, increasing bolus, fixed infusion dose) versus remifentanil (PCA, increasing infusion, fixed bolus dose), Outcome 16 Umbilical cord pH (artery).

Comparison 5 Remifentanil (PCA, increasing bolus, fixed infusion dose) versus remifentanil (PCA, increasing infusion, fixed bolus dose), Outcome 17 Umbilical cord pH (venous).

Comparison 5 Remifentanil (PCA, increasing bolus, fixed infusion dose) versus remifentanil (PCA, increasing infusion, fixed bolus dose), Outcome 18 Neonatal resuscitation.
| Remifentanil (PCA) compared to another opioid (IV/IM) for pain management in labour | ||||||
| Patient or population: women in labour with planned vaginal delivery | ||||||
| Outcomes | Anticipated absolute effects* (95% CI) | Relative effect | № of participants | Quality of the evidence | Comments | |
| Risk with another opioid (IV/IM) | Risk with remifentanil (PCA) | |||||
| Satisfaction (overall) with pain relief (VAS 0 to 10 cm, NRS 1 to 4, NRS 0 to 10, VRS 0 to 5) | see comment | The standardised mean satisfaction score in the intervention group was 2.11 higher (0.72 higher to 3.49 higher)** | ‐ | 216 | ⊕⊝⊝⊝ | A SMD of 2.11 higher is equivalent to a range of 2.74 cm higher (SD = 1.3) to 4.68 cm higher (SD = 2.22) on a VAS 0 to 10 cm scale in the intervention group. The mean satisfaction scores in the control group range from 4.23 to 6.0 cm.# ** |
| Pain intensity 'early' (30 min/1 h) (VAS 0 to 10 cm, VAS 0 to 100 cm) | see comment | The standardised mean pain score 'early' in the intervention group was 1.58 fewer (2.69 fewer to 0.48 fewer)*** | ‐ | 180 | ⊕⊝⊝⊝ | A SMD of 1.58 fewer is equivalent to a range of 1.26 cm fewer (SD = 0.8) to 2.8 cm fewer (SD = 1.77) on a VAS 0 to 10 cm scale in the intervention group. The mean pain scores in the control group range from 3.56 to 6.3 cm (VAS 0 to 10 cm).# *** |
| Additional analgesia required (escape analgesia) | Study population | RR 0.57 | 190 | ⊕⊕⊕⊝ | ||
| 621 per 1.000 | 354 per 1.000 | |||||
| Rate of caesarean delivery | Study population | RR 0.63 | 215 | ⊕⊕⊝⊝ | Two studies includes zero events in one arm (constant continuity correction of 0.01).7 | |
| 148 per 1.000 | 93 per 1.000 | |||||
| Maternal apnoea | see comment | see comment | ‐ | (0 studies) | ‐ | No trial assessed this outcome. |
| Maternal respiratory depression (< 8 breaths/min) | None out of 18 women in the control group and three out of 18 in the remifentanil group had a respiratory depression. | not estimable | 36 | ⊕⊝⊝⊝ | Only one trial assessed this outcome. | |
| Apgar score < 7 at 5 min | None of the newborns in both groups had an Apgar score < 7 at 5 min. | not estimable | 88 | ⊕⊝⊝⊝ | Only one trial assessed this outcome. | |
| *The risk in the intervention group (and its 95% confidence interval) is based on the assumed risk in the comparison group and the relative effect of the intervention (and its 95% CI). | ||||||
| GRADE Working Group grades of evidence | ||||||
| 1 RoB ‐ downgrading (very serious): Substantial information is derived from studies at high risk of bias. After exclusion of high risk trials the CI crosses the line of no effect. 2 Inconsistency ‐ downgrading (serious): I2 > 50%. 3 Imprecision ‐ downgrading (serious): The number of women is insufficient to demonstrate the anticipated effect (OIS not reached). 4 RoB ‐ downgrading (serious): Substantial information is derived by high risk of bias studies (If more than one study: Exclusion of high risk of bias trials has no substantial effect on robustness of the results). 5 Imprecision ‐ downgrading (serious): The number of women is insufficient to demonstrate the anticipated effect (RIS not reached). The result is imprecise including appreciable benefit and harm. 6 Imprecision ‐ downgrading (very serious): Only one study with small sample size (< 150 participants) reported this outcome. 7 Estimated effect with zero/zero event handling (constant continuity correction of 1.0), Analysis 1.14: RR = 0.70 [0.34, 1.41], I2 = 1%. # The SMD was back‐transformed into the VAS 0 to 10 cm scale to facilitate the interpretation. The smallest as well as the largest SD of the studies were used for back‐transformation to reflect the range of effect. ** Higher values indicate higher levels of satisfaction. *** Lower values indicate less pain. | ||||||
| Remifentanil (PCA) compared to another opioid (PCA) for pain management in labour | ||||||
| Patient or population: women in labour with planned vaginal delivery | ||||||
| Outcomes | Anticipated absolute effects* (95% CI) | Relative effect | № of participants | Quality of the evidence | Comments | |
| Risk with another opioid (PCA) | Risk with remifentanil (PCA) | |||||
| Satisfaction (overall) with pain relief (VRS 1 to 10) | The mean satisfaction in the combined (meperidine + fentanyl) control group was 7.1 on a VRS 1 to 10 scale | Mean satisfaction in the remifentanil group was 0.92 VRS higher (0.46 to 1.39 higher).** | ‐ | 110 | ⊕⊝⊝⊝ | Only one trial assessed this outcome. |
| Pain intensity 'early' (30 min/1 h) (VAS 0 to 10 cm, VAS 0 to 100 cm) | see comment | The standardised mean pain score 'early' in the intervention group was 0.51 fewer (1.01 fewer to 0)*** | ‐ | 215 | ⊕⊝⊝⊝ | A SMD of 0.51 fewer is equivalent to a range of 1.13 cm fewer (SD = 2.22) to 1.46 cm fewer (SD = 2.875) on a VAS 0 to 10 cm scale in the intervention group. Mean pain scores in the control groups range from 5.13 cm to 7.0 cm (VAS 0 to 10 cm).# *** |
| Additional analgesia required (escape analgesia) | Study population | RR 0.76 | 215 | ⊕⊕⊝⊝ | ||
| 381 per 1.000 | 289 per 1.000 | |||||
| Rate of caesarean delivery | Study population | RR 2.78 | 143 | ⊕⊝⊝⊝ | ||
| 56 per 1.000 | 156 per 1.000 | |||||
| Maternal apnoea | see comment | see comment | ‐ | (0 studies) | ‐ | No trial assessed this outcome. |
| Maternal respiratory depression | see comment | see comment | ‐ | (0 studies) | ‐ | No trial assessed this outcome. |
| Apgar score ≤ 7 (< 7) at 5 min | Three out of eight newborns in the control group and none out of nine in the remifentanil group had an Apgar score < 7 at 5 min. | not estimable | 17 | ⊕⊝⊝⊝ | Only one trial assessed this outcome. | |
| *The risk in the intervention group (and its 95% confidence interval) is based on the assumed risk in the comparison group and the relative effect of the intervention (and its 95% CI). | ||||||
| GRADE Working Group grades of evidence | ||||||
| 1 RoB ‐ downgrading (serious): Information is derived from a high risk of bias trial. 2 RoB ‐ downgrading (serious): After exclusion of 1 high risk of bias trial (blinding) the estimated effect with CI reached clinically relevance ‐0.73 [‐1.05, ‐0.40] 3 Inconsistency ‐ downgrading (serious): I2 > 50% 4 Imprecision ‐ downgrading (serious): The number of women is insufficient to demonstrate the anticipated effect (RIS/OIS not reached). The result is imprecise including appreciable and no appreciable effect. 5 RoB ‐ downgrading (very serious): Substantial information is derived from studies at high risk of bias. Exclusion of high risk of bias trials widened the CI including appreciable benefit and harm. 6 Imprecision ‐ downgrading (very serious): Only one study with small sample size (< 150 participants) reported this outcome. 7 RoB ‐ downgrading (serious): Information is derived from a trial with unclear risk of bias. # The SMD was back‐transformed into the VAS 0 to 10 cm scale to facilitate the interpretation. The smallest as well as the largest SD of the studies were used for back‐transformation to reflect the range of effect. ** Higher values indicate higher levels of satisfaction. *** Lower values indicate less pain. | ||||||
| Remifentanil (PCA) compared to epidural/CSE for pain management in labour | ||||||
| Patient or population: women in labour with planned vaginal delivery | ||||||
| Outcomes | Anticipated absolute effects* (95% CI) | Relative effect | № of participants | Quality of the evidence | Comments | |
| Risk with epidural analgesia/central neuraxial blocks (CSE) | Risk with remifentanil (PCA) | |||||
| Satisfaction (overall) with pain relief (NRS 0 to 4, 1 to 4, 0 to 10, 1 to 10, VRS 1 to 4) | see comment | The standardised mean satisfaction score in the intervention group was 0.22 fewer (0.40 fewer to 0.04 fewer)** | ‐ | 2135 | ⊕⊝⊝⊝ | A SMD of 0.22 fewer is equivalent to a range of 0.15 cm fewer (SD = 0.7) to 0.61 cm fewer (SD = 2.78) on a VAS 0 to 10 cm scale in the intervention group. Mean satisfaction scores in the control group range from 6.7 to 9.1 cm (VAS 0 to 10 cm).# ** |
| Pain intensity 'early' (1 h) (VAS 0 to 10 cm, VAS 0 to 100 cm, NRS 0 to 10) | see comment | The standardised mean pain score 'early' in the intervention group was 0.57 higher (0.31 higher to 0.84 higher)*** | ‐ | 235 | ⊕⊕⊝⊝ | A SMD of 0.57 higher is equivalent to a range of 0.57 cm higher (SD = 1.0) to 1.43 cm higher (SD = 2.5) on a VAS 0 to 10 cm scale in the intervention group. The mean pain scores in the control group range from 1.6 to 4.14 cm (VAS 0 to 10 cm).# *** |
| Additional analgesia required | Study population | RR 9.27 | 1037 | ⊕⊕⊕⊝ | One study includes zero events in both arms; two studies include zero events in one arm (constant continuity correction of 0.01). 8 | |
| 10 per 1.000 | 93 per 1.000 | |||||
| Rate of caesarean delivery | Study population | RR 1.0 | 1578 | ⊕⊕⊕⊝ | One study includes zero events in one arm (constant continuity correction of 0.01). 9 | |
| 215 per 1.000 | 215 per 1.000 | |||||
| Maternal apnoea | None out of 19 women in the control group and nine out of 19 in the remifentanil group had an apnoea. | not estimable | 38 | ⊕⊝⊝⊝ | Only one trial assessed this outcome. | |
| Maternal respiratory depression (< 9, < 8 breaths/min) | Study population | RR 0.91 | 687 | ⊕⊕⊝⊝ | One study includes zero events in both arms; one study includes zero events in one arm (constant continuity correction of 0.01). 10 | |
| 38 per 1.000 | 35 per 1.000 | |||||
| Apgar score ≤ 7 (< 7) at 5 min | Study population | RR 1.26 | 1322 | ⊕⊕⊝⊝ | Two studies include zero events in both arms; two studies include zero events in one arm (constant continuity correction of 0.01). 11 | |
| 23 per 1.000 | 30 per 1.000 | |||||
| *The risk in the intervention group (and its 95% confidence interval) is based on the assumed risk in the comparison group and the relative effect of the intervention (and its 95% CI). | ||||||
| GRADE Working Group grades of evidence | ||||||
| 1 RoB ‐ downgrading (very serious): Substantial information is derived from studies at high risk of bias. After exclusion of high risk trials the CI crosses the line of no effect. 2 Inconsistency ‐ downgrading (serious): I2 > 50% 3 RoB ‐ downgrading (serious): Substantial information is derived from studies at high risk of bias. Exclusion of high risk of bias trials has no substantial impact on robustness of the results. 4 Imprecision ‐ downgrading (serious): The number of women is insufficient to demonstrate the anticipated effect (OIS not reached). 5 RoB ‐ downgrading (serious): Information is derived from a high risk of bias trial. 6 Imprecision ‐ downgrading (serious): The number of women is insufficient do demonstrate the anticipated effect (RIS/OIS not reached). The result is imprecise including appreciable benefit and harm. 7 Imprecision ‐ downgrading (very serious): Only one study with small sample size (< 150 participants) reported this outcome. 8 Estimated effect with zero/zero event handling (constant continuity correction of 1.0), Analysis 3.18: RR = 8.1 [3.5, 18.75], I2 = 0%. 9 Estimated effect with zero/zero event handling (constant continuity correction of 1.0), Analysis 3.19: RR = 0.99 [0.81, 1.21], I2 = 0%. 10 Estimated effect with zero/zero event handling (constant continuity correction of 1.0), Analysis 3.3: RR = 1.52 [0.23, 9.90], I2 = 50%. 11 Estimated effect with zero/zero event handling (constant continuity correction of 1.0), Analysis 3.12: RR = 1.28 [0.65, 2.51], I2 = 0%. # The SMD was back‐transformed into the VAS 0 to 10 cm scale to facilitate the interpretation. The smallest as well as the largest SD of the studies were used for back‐transformation to reflect the range of effect. ** Higher values indicate higher levels of satisfaction. *** Lower values indicate less pain. | ||||||
| Remifentanil (PCA) compared to remifentanil (continuous IV) for pain management in labour | ||||||
| Patient or population: women in labour with planned vaginal delivery | ||||||
| Outcomes | Anticipated absolute effects* (95% CI) | Relative effect | № of participants | Quality of the evidence | Comments | |
| Risk with remifentanil (continuous IV) | Risk with remifentanil (PCA) | |||||
| Satisfaction (overall) with pain relief | see comment | see comment | ‐ | (0 studies) | ‐ | No trial assessed this outcome. |
| Pain intensity 'early' (30 min/1 h) (VAS 0 to 10 cm) | The mean pain score in the remifentanil (continuous IV) group was 4.0 cm on a VAS 0 to 10 cm scale. | Mean pain score in the remifentanil (PCA) group was 1.0 cm fewer (1.8 fewer to 0.2 fewer).*** | not estimable | 53 | ⊕⊝⊝⊝ | Only one trial assessed this outcome. |
| Additional analgesia required (escape analgesia) | Two out of 29 women in the remifentanil (PCA) group and four out of 30 participants in the remifentanil (continuous IV) group required additional epidural analgesia. | not estimable | 59 (1 RCT) | ⊕⊝⊝⊝ | Only one trial assessed this outcome. | |
| Rate of caesarean delivery | see comment | see comment | ‐ | (0 studies) | ‐ | No trial assessed this outcome. |
| Maternal apnoea | see comment | see comment | ‐ | (0 studies) | ‐ | No trial assessed this outcome. |
| Maternal respiratory depression (< 8 breaths/min) | see comment | see comment | RR 0.98 | 135 | ⊕⊕⊝⊝ | All study arms include zero events (constant continuity correction of 0.01). 5 |
| Apgar score < 7 at 5 min | see comment | see comment | ‐ | (0 studies) | ‐ | No trial assessed this outcome. |
| *The risk in the intervention group (and its 95% confidence interval) is based on the assumed risk in the comparison group and the relative effect of the intervention (and its 95% CI). | ||||||
| GRADE Working Group grades of evidence | ||||||
| 1 RoB ‐ downgrading (serious): Information is derived from a high risk of bias trial. 2 Imprecision ‐ downgrading (very serious): Only one study with small sample size (< 150 participants) reported this outcome. 3 RoB ‐ downgrading (serious): Substantial information is derived from studies at high risk of bias. Exclusion of high risk of bias trials has no substantial impact on robustness of the results. 4 Imprecision ‐ downgrading (serious): The number of women is insufficient to demonstrate the anticipated effect (RIS/OIS not reached). The result is imprecise including appreciable benefit and harm. 5 Estimated effect with zero/zero event handling (constant continuity correction of 1.0), Analysis 4.1: RR = not estimable *** Lower values indicate less pain. | ||||||
| Remifentanil (PCA, increasing bolus dose) compared to remifentanil (PCA, increasing infusion dose) for pain management in labour | ||||||
| Patient or population: women in labour with planned vaginal delivery | ||||||
| Outcomes | Anticipated absolute effects* (95% CI) | Relative effect | № of participants | Quality of the evidence | Comments | |
| Risk with remifentanil (continuous IV) | Risk with remifentanil (PCA) | |||||
| Satisfaction (overall) with pain relief (VNRS 0 to 10) | The mean satisfaction scores in the remifentanil (PCA, IF) group was 8.4 on a VNRS 0 to 10 scale. | Mean satisfaction scores in the remifentanil (PCA, IB) group was 0.2 higher (0.81 fewer to 1.21 higher).** | not estimable | 20 (1 RCT) | ⊕⊕⊝⊝ | Only one trial assessed this outcome. |
| Pain intensity 'early' (30 min/1 h) | see comment | see comment | ‐ | (0 studies) | ‐ | No trial assessed this outcome. |
| Additional analgesia required (escape analgesia) | Only one out of 10 woman in the remifentanil (PCA, IF) group crossed over to the epidural group. | not estimable | 20 (1 RCT) | ⊕⊕⊝⊝ | Only one trial assessed this outcome. | |
| Rate of caesarean delivery | Four out of 10 women in each group delivered by caesarean section. | not estimable | 20 (1 RCT) | ⊕⊕⊝⊝ | Only one trial assessed this outcome. | |
| Maternal apnoea | see comment | see comment | ‐ | (0 studies) | ‐ | No trial assessed this outcome. |
| Maternal respiratory depression (< 8 breaths/min) | see comment | see comment | ‐ | (0 studies) | ‐ | No trial assessed this outcome. |
| Apgar score < 7 at 5 min | None of the newborns in both groups had an Apgar score < 7 at 5 min. | not estimable | 20 (1 RCT) | ⊕⊕⊝⊝ | Only 1 trial assessed this outcome. | |
| *The risk in the intervention group (and its 95% confidence interval) is based on the assumed risk in the comparison group and the relative effect of the intervention (and its 95% CI). | ||||||
| GRADE Working Group grades of evidence | ||||||
| 1 Imprecision ‐ downgrading (very serious): Only one study with small sample size (< 150 participants) reported this outcome. ** Higher values indicate higher levels of satisfaction. | ||||||
| Study | No. randomised (Remifentanil/ control) | No. analysed (Remifentanil/ control) | Overall assessment for risk of attrition bias | Outcome level_Risk of bias | |||||
| Satisfaction with pain relief | AE for women | AE for newborns | Pain intensity | Additional analgesia | Rate of CS | ||||
| 10/ 10 | 10/ 10 | Low | Low | Low | Low | Low | Low | Low | |
| 20/ 20 | 20/ 19 | High | High | High | High | Unclear | Unclear | ||
| 12/ 12 | 12/ 12 | Low | Low | Low | Low | Low | Low | ||
| 60/ 60/ 60 | 52/ 53/ 54 | High | High | High | High | Low | Low | High | |
| 14/ 12 | 10/ 10 | High | High | Low | High | High | Low | Low | |
| 57/ 59 | 49/ 49 | High | High | High | High | Unclear | Unclear | High | |
| 15/ 15 | 15/ 15 | Low | Low | Low | Low | Low | Low | ||
| 43/ 45 | 43/ 45 | Unclear | Low | High | Low | Low | Low | Low | |
| 213 NA/ NA/ NA/ NA | 192 44/ 50/ 49/ 49 | Low | Low | Low | Low | ||||
| 709/ 705 | 687/ 671 | High | High | High | High | High | High | High | |
| 380/ 380/ 380 | 380/ 380/ 380 | Low | Low | Low | Low | Low | Low | ||
| 41/ 41 | 41/ 41 | Low | Low | Low | Low | Low | |||
| 34/ 34 | 34/ 34 | Low | Low | Low | Low | Low | Low | Low | |
| 30/ 30 | 27/ 26 | High | High | High | High | High | High | ||
| 20/ 20 | 19/ 20 | Low | Low | Low | Low | Low | Low | Low | |
| 13/ 15 | 12/ 12 | High | High | High | Low | High | Low | ||
| 18/ 18 | 18/ 18 | Unclear | Low | Low | Low | High | High | ||
| 19/ 20 | 17/ 20 | High | High | High | High | High | Low | High | |
| 9/ 8 | 9/ 8 | Low | Low | Low | Low | Low | Low | ||
| 27/ 25 | 24/ 21 | High | High | High | High | High | High | High | |
| Abbreviations: AE: adverse events, CS: caesarean section | |||||||||
| Sensitivity analysis: Selection bias | Statistical method | All studies | 'high risk of bias'‐studies excluded | Impact on robustness (95% CI) | ||
| n | Effect estimate | n | Effect estimate | |||
| 1. Remifentanil (PCA) versus another opioid (IV/IM) | ||||||
| 1.1 Satisfaction with pain relief | SMD (IV, Random), 95% CI | 4, all at low risk of bias | ||||
| 1.3 Oxygen desaturation (SpO2 < 95%) | RR (MH, Random), 95% CI | 2, all at low risk of bias | ||||
| 1.4 Nausea (and vomiting) | RR (MH, Random), 95% CI | 4, all at low risk of bias | ||||
| 1.6 Pruritus | RR (IV, Random), 95% CI, 0/0 cell counts | 2, all at low risk of bias | ||||
| 1.10 FHR/CTG abnormalities, non‐reassuring fetal status | RR (MH, Random), 95% CI | 2, all at low risk of bias | ||||
| 1.11 Pain intensity 'early' (30 min/1 h) | SMD (IV, Random), 95% CI | 3, all at low risk of bias | ||||
| 1.13 Additional analgesia required (escape analgesia) | RR (MH, Random), 95% CI | 3, all at low risk of bias | ||||
| 1.14 Rate of caesarean delivery | RR (MH, Random), 95% CI | 4, all at low risk of bias | ||||
| 2. Remifentanil (PCA) versus another opioid (PCA) | ||||||
| 2.2 Oxygen desaturation (SpO2 < 95%) | RR (MH, Random), 95% CI | 2, all at low risk of bias | ||||
| 2.10 Need for naloxone | RR (IV, Random), 95% CI, 0/0 cell counts | 2, all at low risk of bias | ||||
| 2.12 NACS at 15/30 min | MD (IV, Random), 95% CI | 2, all at low risk of bias | ||||
| 2.13 Pain intensity 'early' (30 min/1 h) | SMD (IV, Random), 95% CI | 3, all at low risk of bias | ||||
| 2.15 Additional analgesia required (escape analgesia) | RR (MH, Random), 95% CI | 3, all at low risk of bias | ||||
| 2.16 Rate of caesarean delivery | RR (MH, Random), 95% CI | 2, all at low risk of bias | ||||
| 3. Remifentanil (PCA) versus epidural/combined spinal‐epidural analgesia (CSE) | ||||||
| 3.1 Satisfaction with pain relief | SMD (IV, Random), 95% CI | 7 | ‐0.22 [‐0.40, ‐0.04] | 6 | ‐0.20 [‐0.46, 0.07] | Yes (CI includes 0) |
| 3.3 Respiratory depression (< 9, < 8 breaths/min) | RR (IV, Random), 95% CI, 0/0 cell counts | 3 | 0.91 [0.51, 1.62] | 2 | 0.91 [0.52, 1.61] | No |
| 3.4 Oxygen desaturation (SpO2 < 92%) | RR (MH, Random), 95% CI | 3 | 3.24 [1.66, 6.32] | 2 | 5.83 [0.40, 84.06] | Yes (CI includes 1) |
| 3.5 Oxygen desaturation (SpO2 < 95%) | RR (MH, Random), 95% CI | 3 | 3.27 [2.32, 4.61] | 2 | 5.44 [2.11, 14.02] | Yes (effect and CI increased) |
| 3.6 Hypotension | RR (IV, Random), 95% CI, 0/0 cell counts | 4 | 0.59 [0.37, 0.94] | 3 | 0.57 [0.00, 2.4E7] | Yes (CI includes 1) |
| 3.7 Bradycardia | RR (IV, Random), 95% CI, 0/0 cell counts | 2, all at low risk of bias | ||||
| 3.8 Nausea | RR (MH, Random), 95% CI | 8 | 1.49 [1.19, 1.86] | 7 | 1.41 [1.09, 1.83] | No |
| 3.9 Vomiting | RR (MH, Random), 95% CI | 6 | 1.63 [1.25, 2.13] | 5 | 1.82 [1.29, 2.57] | No |
| 3.10 Pruritus | RR (MH, Random), 95% CI | 7 | 0.75 [0.48, 1.18] | 6 | 0.81 [0.45, 1.45] | No |
| 3.11 Sedation (1 h) | MD (IV, Random), 95% CI | 3, all at low risk of bias | ||||
| 3.12 Apgarscore ≤ 7 (< 7) at 5 min | RR (IV, Random), 95% CI, 0/0 cell counts | 5, all at low risk of bias | ||||
| 3.13 Apgarscore at 5 min | MD (IV,), 95% CI | 3, all at low risk of bias | ||||
| 3.14 Need for naloxone | RR (IV, Random), 95% CI, 0/0 cell counts | 2, all at low risk of bias | ||||
| 3.15 FHR/CTG abnormalities, non‐reassuring fetal status | RR (MH, Random), 95% CI | 5, all at low risk of bias | ||||
| 3.16 Pain intensity 'early' (1 h) | SMD (IV, Random), 95% CI | 6, all at low risk of bias | ||||
| 3.18 Additional analgesia required | RR (IV, Random), 95% CI, 0/0 cell counts | 6 | 9.27 [3.73, 23.03] | 5 | 5.29 [1.2, 23.3] | No |
| 3.19 Rate of caesarean delivery | RR (MH, Random), 95% CI | 9, all at low risk of bias | ||||
| 4. Remifentanil (PCA) versus remifentanil (continuous IV) | ||||||
| 4.1 Respiratory depression (< 8 breaths/min) | RR (IV, Random), 95% CI, 0/0 cell counts | 2, all at low risk of bias | ||||
| 4.3 Hypotension | RR (IV, Random), 95% CI, 0/0 cell counts | 2, all at low risk of bias | ||||
| 4.4 Bradycardia | RR (IV, Random), 95% CI, 0/0 cell counts | 2, all at low risk of bias | ||||
| 4.5 Nausea (and vomiting) | RR (MH, Random), 95% CI | 2, all at low risk of bias | ||||
| 4.8 Need for naloxone | RR (IV, Random), 95% CI, 0/0 cell counts | 2, all at low risk of bias | ||||
| All RR for outcomes including 0/0 cell counts (zero/zero event trials) were calculated using TSA (constant continuity correction, 0.01). Review Manager 5 produces computational errors when both the intervention and control group have zero events. By using TSA there is no possibility to choose the MH method (only IV) which may cause small deviations within results. Abbreviations: [95% CI]: 95% confidence interval; IV: Inverse Variance; MD: mean difference; MH: Mantel‐Haenszel; n: number of participants; RPCA: Remifentanil PCA; RR: risk ratio; SMD: standardised mean difference | ||||||
| Sensitivity analysis: Blinding (performance and detection bias) | Statistical method | All studies | 'high risk of bias'‐studies excluded | Impact on robustness (95% CI) | ||
| n | Effect estimate | n | Effect estimate | |||
| 1. Remifentanil (PCA) versus another opioid (IV/IM) | ||||||
| 1.1 Satisfaction with pain relief | SMD (IV, Random), 95% CI | 4 | 2.11 [0.72, 3.49] | 2 | 2.46 [‐0.34, 5.26] | Yes (CI includes 0) |
| 1.3 Oxygen desaturation (SpO2 < 95%) | RR (MH, Random), 95% CI | 2 | 0.48 [0.00, 47.37] | 1 | 0.05 [0.00, 0.82] | Yes (CI < 1: favours RPCA) |
| 1.4 Nausea (and vomiting) | RR (MH, Random), 95% CI | 4 | 0.54 [0.29, 0.99] | 2 | 0.36 [0.06, 2.29] | Yes (CI includes 1) |
| 1.6 Pruritus | RR (IV, Random), 95% CI, 0/0 cell counts | 2, all at low risk of bias | ||||
| 1.10 FHR/CTG abnormalities, non‐reassuring fetal status | RR (MH, Random), 95% CI | 2, all at low risk of bias | ||||
| 1.11 Pain intensity 'early' (30 min/1 h) | SMD (IV, Random), 95% CI | 3 | ‐1.58 [‐2.69, ‐0.48] | 2 | ‐1.28 [‐2.62, 0.07] | Yes (CI includes 0) |
| 1.13 Additional analgesia required (escape analgesia) | RR (MH, Random), 95% CI | 3 | 0.57 [0.40, 0.81] | 2 | 0.48 [0.25, 0.91] | No |
| 1.14 Rate of caesarean delivery | RR (MH, Random), 95% CI | 4 | 0.70 [0.34, 1.41] | 2 | 0.63 [0.30, 1.31] | No |
| 2. Remifentanil (PCA) versus another opioid (PCA) | ||||||
| 2.2 Oxygen desaturation (SpO2 < 95%) | RR (MH, Random), 95% CI | 2 | 1.28 [0.49, 3.30] | 1 | 1.64 [1.25, 2.15] | Yes (CI > 1: favours opioid) |
| 2.10 Need for naloxone | RR (IV, Random), 95% CI, 0/0 cell counts | 2 | 0.03 [0.00, 1.8E8] | 1 | 0.00 [0.00, 0.06] | Yes (CI < 1: favours RPCA) |
| 2.12 NACS at 15/30 min | MD (IV, Random), 95% CI | 2 | 1.11 [‐0.65, 2.87] | 1 | 0.20 [‐0.93, 1.33] | Yes (direction of effect changed, CI decreased) |
| 2.13 Pain intensity 'early' (30 min/1 h) | SMD (IV, Random), 95% CI | 3 | ‐0.51 [‐1.01, ‐0.00] | 2 | ‐0.73 [‐1.05, ‐0.40] | Yes (lower CI: clinically relevant moderate effect) |
| 2.15 Additional analgesia required (escape analgesia) | RR (MH, Random), 95% CI | 3 | 0.76 [0.45, 1.28] | 2 | 0.65 [0.39, 1.09] | No |
| 2.16 Rate of caesarean delivery | RR (MH, Random), 95% CI | 2, all at low risk of bias | ||||
| 3. Remifentanil (PCA) versus epidural/combined spinal‐epidural analgesia (CSE) | ||||||
| 3.1 Satisfaction with pain relief | SMD (IV, Random), 95% CI | 7 | ‐0.22 [‐0.40, ‐0.04] | 1 | 0.27 [‐0.31, 0.86] | Yes (CI includes 0) |
| 3.3 Respiratory depression (< 9, < 8 breaths/min) | RR (IV, Random), 95% CI, 0/0 cell counts | 3 | 0.91 [0.51, 1.62] | 0 | Not estimable | All studies at high risk |
| 3.4 Oxygen desaturation (SpO2 < 92%) | RR (MH, Random), 95% CI | 3 | 3.24 [1.66, 6.32] | 0 | Not estimable | All studies at high risk |
| 3.5 Oxygen desaturation (SpO2 < 95%) | RR (MH, Random), 95% CI | 3 | 3.27 [2.32, 4.61] | 1 | 11.38 [1.62, 79.78] | Yes (effect and CI increased) |
| 3.6 Hypotension | RR (IV, Random), 95% CI, 0/0 cell counts | 4 | 0.59 [0.37, 0.94] | 0 | Not estimable | All studies at high risk |
| 3.7 Bradycardia | RR (IV, Random), 95% CI, 0/0 cell counts | 2 | 1.0 [0.00, 1.0E12] | 0 | Not estimable | All studies at high risk |
| 3.8 Nausea | RR (MH, Random), 95% CI | 8 | 1.49 [1.19, 1.86] | 1 | 3.94 [0.96, 16.22] | Yes (CI includes 1) |
| 3.9 Vomiting | RR (MH, Random), 95% CI | 6 | 1.63 [1.25, 2.13] | 0 | Not estimable | All studies at high risk |
| 3.10 Pruritus | RR (MH, Random), 95% CI | 7 | 0.75 [0.48, 1.18] | 0 | Not estimable | All studies at high risk |
| 3.11 Sedation (1 h) | MD (IV, Random), 95% CI | 3 | 0.71 [0.03, 1.39] | 0 | Not estimable | All studies at high risk |
| 3.12 Apgarscore ≤ 7 (< 7) at 5 min | RR (IV, Random), 95% CI, 0/0 cell counts | 5 | 1.26 [0.62, 2.57] | 0 | Not estimable | All studies at high risk |
| 3.13 Apgarscore at 5 min | MD (IV,), 95% CI | 3 | 0.06 [‐0.27, 0.39] | 0 | Not estimable | All studies at high risk |
| 3.14 Need for naloxone | RR (IV, Random), 95% CI, 0/0 cell counts | 2 | 0.02 [0.00, 1.6E8] | 0 | Not estimable | All studies at high risk |
| 3.15 FHR/CTG abnormalities, non‐reassuring fetal status | RR (MH, Random), 95% CI | 5 | 1.55 [0.49, 4.92] | 1 | 11.38 [1.62, 79.78] | Yes (CI > 1: favours epidural) |
| 3.16 Pain intensity 'early' (1 h) | SMD (IV, Random), 95% CI | 6 | 0.57 [0.31, 0.84] | 0 | Not estimable | All studies at high risk |
| 3.18 Additional analgesia required | RR (IV, Random), 95% CI, 0/0 cell counts | 6 | 9.27 [3.73, 23.07] | 0 | Not estimable | All studies at high risk |
| 3.19 Rate of caesarean delivery | RR (MH, Random), 95% CI | 9 | 0.99 [0.81, 1.21] | 1 | 0.88 [0.06, 13.14] | Yes (CI increased) |
| 4. Remifentanil (PCA) versus remifentanil (continuous IV) | ||||||
| 4.1 Respiratory depression (< 8 breaths/min) | RR (IV, Random), 95% CI, 0/0 cell counts | 2 | 0.98 [0.00, 1.0E12] | 1 | 0.98 [0.00, ∞] | No |
| 4.3 Hypotension | RR (IV, Random), 95% CI, 0/0 cell counts | 2 | 0.98 [0.00, 1.0E12] | 1 | 0.98 [0.00, ∞] | No |
| 4.4 Bradycardia | RR (IV, Random), 95% CI, 0/0 cell counts | 2 | 0.98 [0.00, 1.0E12] | 1 | 0.98 [0.00, ∞] | No |
| 4.5 Nausea (and vomiting) | RR (MH, Random), 95% CI | 2 | 0.85 [0.28, 2.54] | 1 | 0.53 [0.21, 1.39] | No |
| 4.8 Need for naloxone | RR (IV, Random), 95% CI, 0/0 cell counts | 2 | 0.98 [0.00, 1.0E12] | 1 | 0.98 [0.00, ∞] | No |
| All RR for outcomes including 0/0 cell counts (zero/zero event trials) were calculated using TSA (constant continuity correction, 0.01). Review Manager 5 produces computational errors when both the intervention and control group have zero events. By using TSA there is no possibility to choose the MH method (only IV) which may cause small deviations within results. Abbreviations: [95% CI]: 95% confidence interval; IV: Inverse Variance; MD: mean difference; MH: Mantel‐Haenszel; n: number of participants; RPCA: Remifentanil PCA; RR: risk ratio; SMD: standardised mean difference | ||||||
| Sensitivity analysis: Attrition bias | Statistical method | All studies | 'high risk of bias'‐studies excluded | Impact on robustness (95% CI) | ||
| n | Effect estimate | n | Effect estimate | |||
| 1. Remifentanil (PCA) versus another opioid (IV/IM) | ||||||
| 1.1 Satisfaction with pain relief | SMD (IV, Random), 95% CI | 4, all at low risk of bias | ||||
| 1.3 Oxygen desaturation (SpO2 < 95%) | RR (MH, Random), 95% CI | 2 | 0.48 [0.00, 47.37] | 1 | 3.50 [0.84, 14.61] | Yes (CI + effect moved to favour of opioid) |
| 1.4 Nausea (and vomiting) | RR (MH, Random), 95% CI | 4, all at low risk of bias | ||||
| 1.6 Pruritus | RR (IV, Random), 95% CI, 0/0 cell counts | 2, all at low risk of bias | ||||
| 1.10 FHR/CTG abnormalities, non‐reassuring fetal status | RR (MH, Random), 95% CI | 2, all at low risk of bias | ||||
| 1.11 Pain intensity 'early' (30 min/1 h) | SMD (IV, Random), 95% CI | 3, all at low risk of bias | ||||
| 1.13 Additional analgesia required (escape analgesia) | RR (MH, Random), 95% CI | 3 | 0.57 [0.40, 0.81] | 2 | 0.48 [0.25, 0.91] | No |
| 1.14 Rate of caesarean delivery | RR (MH, Random), 95% CI | 4 | 0.70 [0.34, 1.41] | 3 | 0.60 [0.29, 1.24] | No |
| 2. Remifentanil (PCA) versus another opioid (PCA) | ||||||
| 2.2 Oxygen desaturation (SpO2 < 95%) | RR (MH, Random), 95% CI | 2 | 1.28 [0.49, 3.30] | 0 | Not estimable | All studies at high risk |
| 2.10 Need for naloxone | RR (IV, Random), 95% CI, 0/0 cell counts | 2 | 0.03 [0.00, 1.8E8] | 1 | 0.00 [0.00, 0.06] | Yes (CI moved to favour RPCA) |
| 2.12 NACS at 15/30 min | MD (IV, Random), 95% CI | 2 | 1.11 [‐0.65, 2.87] | 0 | Not estimable | All studies at high risk |
| 2.13 Pain intensity 'early' (30 min/1 h) | SMD (IV, Random), 95% CI | 3, all at low risk of bias | ||||
| 2.15 Additional analgesia required (escape analgesia) | RR (MH, Random), 95% CI | 3, all at low risk of bias | ||||
| 2.16 Rate of caesarean delivery | RR (MH, Random), 95% CI | 2 | 2.78 [0.99, 7.82] | 1 | 1.78 [0.20, 16.10] | Yes (CI increased) |
| 3. Remifentanil (PCA) versus epidural/combined spinal‐epidural analgesia (CSE) | ||||||
| 3.1 Satisfaction with pain relief | SMD (IV, Random), 95% CI | 7 | ‐0.22 [‐0.40, ‐0.04] | 3 | ‐0.27 [‐0.64, 0.10] | Yes (CI includes 0) |
| 3.3 Respiratory depression (< 9, < 8 breaths/min) | RR (IV, Random), 95% CI, 0/0 cell counts | 3 | 0.91 [0.51, 1.62] | 1 | 0.91 [0.39, 2.10] | No |
| 3.4 Oxygen desaturation (SpO2 < 92%) | RR (MH, Random), 95% CI | 3 | 3.24 [1.66, 6.32] | 0 | Not estimable | All studies at high risk |
| 3.5 Oxygen desaturation (SpO2 < 95%) | RR (MH, Random), 95% CI | 3 | 3.27 [2.32, 4.61] | 1 | 4.33 [1.47, 12.79] | Yes (effect and CI increased) |
| 3.6 Hypotension | RR (IV, Random), 95% CI, 0/0 cell counts | 4 | 0.59 [0.37, 0.94] | 2 | 0.01 [0.00, 7.8E7] | Yes (CI includes 1) |
| 3.7 Bradycardia | RR (IV, Random), 95% CI, 0/0 cell counts | 2 | 1.0 [0.00, 1.0E12] | 1 | 1.0 [0.00, ∞] | No |
| 3.8 Nausea | RR (MH, Random), 95% CI | 8 | 1.49 [1.19, 1.86] | 4 | 1.27 [0.82, 1.98] | Yes (CI includes 1) |
| 3.9 Vomiting | RR (MH, Random), 95% CI | 6 | 1.63 [1.25, 2.13] | 3 | 1.54 [0.75, 3.14] | Yes (CI includes 1) |
| 3.10 Pruritus | RR (MH, Random), 95% CI | 7 | 0.75 [0.48, 1.18] | 5 | 0.86 [0.48, 1.56] | No |
| 3.11 Sedation (1 h) | MD (IV, Random), 95% CI | 3, all at low risk of bias | ||||
| 3.12 Apgarscore ≤ 7 (< 7) at 5 min | RR (IV, Random), 95% CI, 0/0 cell counts | 5 | 1.26 [0.62, 2.57] | 3 | 1.26 [0.62, 2.57] | No |
| 3.13 Apgarscore at 5 min | MD (IV,), 95% CI | 3 | 0.06 [‐0.27, 0.39] | 0 | Not estimable | All studies at high risk |
| 3.14 Need for naloxone | RR (IV, Random), 95% CI, 0/0 cell counts | 2, all at low risk of bias | ||||
| 3.15 FHR/CTG abnormalities, non‐reassuring fetal status | RR (MH, Random), 95% CI | 5 | 1.55 [0.49, 4.92] | 2 | 0.87 [0.41, 1.87] | Yes (CI decreased, effect changed) |
| 3.16 Pain intensity 'early' (1 h) | SMD (IV, Random), 95% CI | 6 | 0.57 [0.31, 0.84] | 3 | 0.57 [0.25, 0.89] | No |
| 3.18 Additional analgesia required | RR (IV, Random), 95% CI, 0/0 cell counts | 6 | 9.27 [3.73, 23.03] | 5 | 5.29 [1.2, 23.3] | No |
| 3.19 Rate of caesarean delivery | RR (MH, Random), 95% CI | 9 | 0.99 [0.81, 1.21] | 6 | 1.02 [0.83, 1.25] | No |
| 4. Remifentanil (PCA) versus remifentanil (continuous IV) | ||||||
| 4.1 Respiratory depression (< 8 breaths/min) | RR (IV, Random), 95% CI, 0/0 cell counts | 2 | 0.98 [0.00, 1.0E12] | 1 | 0.98 [0.00, ∞] | No |
| 4.3 Hypotension | RR (IV, Random), 95% CI, 0/0 cell counts | 2 | 0.98 [0.00, 1.0E12] | 1 | 0.98 [0.00, ∞] | No |
| 4.4 Bradycardia | RR (IV, Random), 95% CI, 0/0 cell counts | 2 | 0.98 [0.00, 1.0E12] | 1 | 0.98 [0.00, ∞] | No |
| 4.5 Nausea (and vomiting) | RR (MH, Random), 95% CI | 2 | 0.85 [0.28, 2.54] | 1 | 1.67 [0.43, 6.52] | No |
| 4.8 Need for naloxone | RR (IV, Random), 95% CI, 0/0 cell counts | 2 | 0.98 [0.00, 1.0E12] | 1 | 0.98 [0.00, ∞] | No |
| All RR for outcomes including 0/0 cell counts (zero/zero event trials) were calculated using TSA (constant continuity correction, 0.01). Review Manager 5 produces computational errors when both the intervention and control group have zero events. By using TSA there is no possibility to choose the MH method (only IV) which may cause small deviations within results. Abbreviations: [95% CI]: 95% confidence interval; IV: Inverse Variance; MD: mean difference; MH: Mantel‐Haenszel; n: number of participants; RPCA: Remifentanil PCA; RR: risk ratio; SMD: standardised mean difference | ||||||
| EE [95% CI], P value, I2 (%), n | TSA_Low risk of bias‐based (all low) | |||||
| RRR (%) | CER (%) | H (%) | RIS | evidence | ||
| 1.13 Additional analgesia | 0.58 [0.42, 0.79], 0.0005, 15%, 190 | 51.21 | 58 | 25 | 156 | evidence of effect (intervention) |
| low risk of bias studies: Evron 2005 + Ng 2011 (best) | ||||||
| 1.14 Rate of caesarean delivery | 0.63 [0.30, 1.32], 0.22, 0%,215 | 37.47 | 19 | 25 | 1444 | absence of evidence |
| low risk of bias studies: Evron 2005 + Ng 2011 (best) | ||||||
| 2.15 Additional analgesia | 0.87 [0.74, 1.03], 0.11, 0%, 215 | 35.21 | 28 | 25 | 1024 | absence of evidence |
| low risk of bias studies: Douma 2010 (best) + Volikas 2001 | ||||||
| 2.16 Rate of caesarean delivery | 2.78 [0.99, 7.82], 0.05, 0%, 143 | ‐77.76 | 12.5 | 25 | 852 | absence of evidence |
| only low risk of bias study: Volikas 2001 | ||||||
| 3.3 Respiratory depression | 0.91 [0.51, 1.62], 0.75, 0%,687 | 9.09 | 58 | 25 | 4986 | absence of evidence |
| best study (high risk): Stocki‐2014 | ||||||
| 3.12 Apgarscore < 7 at 5 min | 1.26 [0.62, 2.57], 0.52, 0%, 1322 | ‐26.33 | 3 | 25 | 2.9E4 | absence of evidence |
| not best study (0/0 events), but largest (high risk): Ismail 2012 | ||||||
| 3.18 Additional analgesia | 9.27 [3.73, 23.03], < 0.0001, 0%, 1037 | ‐218.8 | 5 | 25 | 449 | evidence of effect (control) |
| Not best study (0/0 events), but second best (high risk): Stocki 2014 | ||||||
| 3.19 Rate of caesarean delivery | 1.0 [0.82, 1.22], 0.9857, 0%, 1578 | ‐12.5 | 8 | 25 | 4.4E4 | absence of evidence |
| best study (high risk): Evron 2008 clinically relevant (RRR) assumptions: RRR = ‐ 50%, CER (empirical) = 22%, H (empirical) = 0% → IS = 924 (lack of effect) | ||||||
| 4.1 Respiratory depression | 0.98 [0.06, 15.37], 0.9896, 0%, 135 | 4 | 1 | 25 | 3.4E6 | absence of evidence |
| best study (high risk): Shen 2013 | ||||||
| TSA (trial sequential analysis): random‐effects modelling; IV (inverse variance); (α = 0.05, power = 90% (ß = 0.10); zero event handling = constant continuity correction, 0.01; H = 25% (mild heterogeneity); calculated with TSA software (http://www.ctu.dk/tsa/) Abbreviations: CER: control event rate; EE [95% CI]: estimated effect with 95% confidence interval; EER: experimental event rate; H: heterogeneity adjustment factor; n: number of participants; NA: not applicable; RIS: required information size; RRR: relative risk reduction = (EER‐CER)/CER; TSMB: trial sequential monitoring boundary | ||||||
| EE [95% CI], P value, I2 (%), n | TSA_Empirical (with all studies) | |||||
| RRR (%) | CER (%) | H (%) | RIS | evidence | ||
| 1.13 Additional analgesia | 0.58 [0.42, 0.79], 0.0005, 15%, 190 | 42.39 | 62 | 21.39 | 194 | evidence of effect, TSMB, (intervention) |
| 1.14 Rate of caesarean delivery | 0.63 [0.30, 1.32], 0.22, 0%,215 | 30.4 | 15 | 0 | 2245 | absence of evidence |
| 2.15 Additional analgesia | 0.87 [0.74, 1.03], 0.11, 0%, 215 | 12.58 | 38 | 0 | 4218 | absence of evidence |
| 2.16 Rate of caesarean delivery | 2.78 [0.99, 7.82], 0.05, 0%, 143 | ‐177.7 | 6 | 0 | 372 | absence of evidence |
| 3.3 Respiratory depression | 0.91 [0.51, 1.62], 0.75, 0%,687 | 2 | 4 | 0 | 2.5E6 | absence of evidence |
| 3.12 Apgarscore < 7 at 5 min | 1.26 [0.62, 2.57], 0.52, 0%, 1322 | ‐26 | 2 | 0 | 3.4E4 | absence of evidence |
| 3.18 Additional analgesia | 9.27 [3.73, 23.03], < 0.0001, 0%, 1037 | ‐665 | 1 | 0 | 394 | evidence of effect (control) |
| 3.19 Rate of caesarean delivery | 1.0 [0.82, 1.22], 0.9857, 0%, 1578 | 1.18 | 22 | 0 | 1.1E6 | absence of evidence |
| 4.1 Respiratory depression | 0.98 [0.06, 15.37], 0.9896, 0%, 135 | 2 | 1 | 0 | 1.0E7 | absence of evidence |
| TSA (trial sequential analysis): random‐effects modelling; IV (inverse variance); (α = 0.05, power = 90% (ß = 0.10); zero event handling = constant continuity correction, 0.01; H = 25% (mild heterogeneity); calculated with TSA software (http://www.ctu.dk/tsa/) Abbreviations: CER: control event rate; EE [95% CI]: estimated effect with 95% confidence interval; EER: experimental event rate; H: heterogeneity adjustment factor; n: number of participants; NA: not applicable; RIS: required information size; RRR: relative risk reduction = (EER‐CER)/CER; TSMB: trial sequential monitoring boundary | ||||||
| EE [95% CI], P value, I2, n | OIS_minimal clinically relevant difference1 | |||||
| mean1 | mean2 | SDlargest | OIS | evidence | ||
| 1.1 Satisfaction with pain relief | 2.11 [0.72, 3.49], 0.003, 93%, 216 | 7 | 6 | 2.22 | 208 | evidence of effect (intervention) |
| best low risk of bias study: Ng 2011 | ||||||
| 1.11 Pain intensity 'early' | ‐1.58 [‐2.69, ‐0.48], 0.005, 89%, 180 | 25.6 | 35.6 | 26.6 | 298 | absence of evidence |
| best low risk of bias study: Ng 2011 | ||||||
| 2.13 Pain intensity 'early' | ‐0.51 [‐1.01, ‐0.00], 0.05, 52%, 215 | 5.282 | 6.282 | 2.414 | 246 | absence of evidence |
| best low risk of bias study: Douma 2010 | ||||||
| 3.1 Satisfaction with pain relief | ‐0.22 [‐0.40, ‐0.04], 0.02, 52%, 2135 | 8.1 | 9.1 | 1.5 | 96 | evidence of effect (control) |
| best study (high risk): Stocki 2014 | ||||||
| 3.16 Pain intensity 'early' | 0.57 [0.31, 0.84], < 0.0001, 0%, 235 | 3.3 | 2.3 | 3.3 | 458 | absence of evidence |
| best study (high risk): Stocki 2014 | ||||||
| The summary statistics for the GRADE‐relevant continuous outcomes was SMD (standardised mean difference). The TSA software (version 0.9 Beta) did not support trial sequential analysis of SMD. Therefore, we conducted OIS (optimal information size) calculations (http://stat.ubc.ca/˜rollin/stats/ssize/n2.html) which corresponds to a sample size calculation for an individual trial with the following general assumptions on α = 0.05 and ß = 0.10 (power = 90%). 1The assumed minimal clinically relevant difference was 1.0 cm (10 mm) on a VAS 0 to 10 cm (0 to 100 mm) scale. The mean2 was derived from the control group (low risk of bias (best) trial). Abbreviations: EE [95% CI]: estimated effect with 95% confidence interval; mean1: intervention group; mean2: control group; n: number of participants; SDlargest: largest standard deviation of the pooled studies was assumed | ||||||
| EE [95% CI], P value, I2, n | OIS_low risk of bias‐based (best) | |||||
| mean1 | mean2 | SDlargest | OIS | evidence | ||
| 1.1 Satisfaction with pain relief | 2.11 [0.72, 3.49], 0.003, 93%, 216 | 8 | 6 | 2.22 | 52 | evidence of effect (intervention) |
| best low risk of bias study: Ng 2011 | ||||||
| 1.11 Pain intensity 'early' | ‐1.58 [‐2.69, ‐0.48], 0.005, 89%, 180 | 22.1 | 35.6 | 26.6 | 164 | evidence of effect (intervention) |
| best low risk of bias study: Ng 2011 | ||||||
| 2.13 Pain intensity 'early' | ‐0.51 [‐1.01, ‐0.00], 0.05, 52%, 215 | 4.56 | 6.282 | 2.414 | 82 | lack of effect |
| best low risk of bias study: Douma 2010 | ||||||
| 3.1 Satisfaction with pain relief | ‐0.22 [‐0.40, ‐0.04], 0.02, 52%, 2135 | 8.6 | 9.1 | 1.5 | 380 | evidence of effect (control) |
| best study (high risk): Stocki 2014 | ||||||
| 3.16 Pain intensity 'early' | 0.57 [0.31, 0.84], < 0.0001, 0%, 235 | 4 | 2.3 | 3.3 | 160 | evidence of effect (control) |
| best study (high risk): Stocki 2014 | ||||||
| The summary statistics for the GRADE‐relevant continuous outcomes was SMD (standardised mean difference). The TSA software (version 0.9 Beta) did not support trial sequential analysis of SMD. Therefore, we conducted OIS (optimal information size) calculations (http://stat.ubc.ca/˜rollin/stats/ssize/n2.html) which corresponds to a sample size calculation for an individual trial with the following general assumptions on α = 0.05 and ß = 0.10 (power = 90%). The mean2 was derived from the control group (low risk of bias (best) trial). Abbreviations: EE [95% CI]: estimated effect with 95% confidence interval; mean1: intervention group; mean2: control group; n: number of participants; SDlargest: largest standard deviation of the pooled studies was assumed | ||||||
| Sensitivity analysis: Random‐effects versus fixed‐effect model | Statistical method | Random‐effects model | Fixed‐effect model | Impact on robustness (95% CI) (fixed‐effect model) | |||
| n | Effect estimate | n | Effect estimate | ||||
| 1. Remifentanil (PCA) versus another opioid (IV/IM) | |||||||
| 1.1 Satisfaction with pain relief | SMD (IV), 95% CI | 4 | 2.11 [0.72, 3.49] | 4 | 1.85 [1.51, 2.19] | Yes (CI decreased, large effect) | |
| 1.3 Oxygen desaturation (SpO2 < 95%) | RR (MH), 95% CI | 2 | 0.48 [0.00, 47.37] | 2 | 0.66 [0.28, 1.57] | Yes (CI decreased) | |
| 1.4 Nausea (and vomiting) | RR (MH), 95% CI | 4 | 0.54 [0.29, 0.99] | 4 | 0.51 [0.28, 0.95] | No | |
| 1.6 Pruritus | RR (IV), 95% CI, 0/0 cell counts | 2 | 1.02 [0.00, 1.1E12] | 2 | 1.02 [0.00, 1.1E12] | No | |
| 1.10 FHR/CTG abnormalities, non‐reassuring fetal status | RR (MH), 95% CI | 2 | 0.30 [0.10, 0.90] | 2 | 0.30 [0.10, 0.85] | No | |
| 1.11 Pain intensity 'early' (30 min/1 h) | SMD (IV), 95% CI | 3 | ‐1.58 [‐2.69, ‐0.48] | 3 | ‐1.35 [‐1.68, ‐1.01] | Yes (CI decreased, large effect) | |
| 1.13 Additional analgesia required (escape analgesia) | RR (MH), 95% CI | 3 | 0.57 [0.40, 0.81] | 3 | 0.53 [0.39, 0.71] | No | |
| 1.14 Rate of caesarean delivery | RR (MH), 95% CI | 4 | 0.70 [0.34, 1.41] | 4 | 0.77 [0.39, 1.49] | No | |
| 2. Remifentanil (PCA) versus another opioid (PCA) | |||||||
| 2.2 Oxygen desaturation (SpO2 < 95%) | RR (MH), 95% CI | 2 | 1.28 [0.49, 3.30] | 2 | 1.39 [1.16, 1.67] | Yes (CI > 1: favours opioid) | |
| 2.10 Need for naloxone | RR (IV,), 95% CI, 0/0 cell counts | 2 | 0.03 [0.00, 1.8E8] | 2 | 0.01 [0.00, 2.4E6] | No | |
| 2.12 NACS at 15/30 min | MD (IV), 95% CI | 2 | 1.11 [‐0.65, 2.87] | 2 | 1.15 [0.38, 1.93] | Yes (CI > 0: favours RPCA) | |
| 2.13 Pain intensity 'early' (30 min/1 h) | SMD (IV), 95% CI | 3 | ‐0.51 [‐1.01, ‐0.00] | 3 | ‐0.57 [‐0.86, ‐0.29] | Yes (CI < 0: favours RPCA) | |
| 2.15 Additional analgesia required (escape analgesia) | RR (MH), 95% CI | 3 | 0.76 [0.45, 1.28] | 3 | 0.74 [0.55, 1.00] | No | |
| 2.16 Rate of caesarean delivery | RR (MH), 95% CI | 2 | 2.78 [0.99, 7.82] | 2 | 2.78 [0.99, 7.77] | No | |
| 3. Remifentanil (PCA) versus epidural/combined spinal‐epidural analgesia (CSE) | |||||||
| 3.1 Satisfaction with pain relief | SMD (IV), 95% CI | 7 | ‐0.22 [‐0.40, ‐0.04] | 7 | ‐0.29 [‐0.38, ‐0.20] | No | |
| 3.3 Respiratory depression (< 9, < 8 breaths/min) | RR (IV), 95% CI, 0/0 cell counts | 3 | 0.91 [0.51, 1.62] | 3 | 1.2 [0.67, 2.17] | No | |
| 3.4 Oxygen desaturation (SpO2 < 92%) | RR (MH), 95% CI | 3 | 3.24 [1.66, 6.32] | 3 | 3.46 [2.32, 5.16] | No | |
| 3.5 Oxygen desaturation (SpO2 < 95%) | RR (MH), 95% CI | 3 | 3.27 [2.32, 4.61] | 3 | 3.30 [2.43, 4.49] | No | |
| 3.6 Hypotension | RR (IV,), 95% CI, 0/0 cell counts | 4 | 0.59 [0.37, 0.94] | 4 | 0.57 [0.36, 0.89] | No | |
| 3.7 Bradycardia | RR (IV,), 95% CI, 0/0 cell counts | 2 | 1.0 [0.00, 1.0E12] | 2 | 1.0 [0.00, 1.0E12] | No | |
| 3.8 Nausea | RR (MH), 95% CI | 8 | 1.49 [1.19, 1.86] | 8 | 1.53 [1.22, 1.91] | No | |
| 3.9 Vomiting | RR (MH), 95% CI | 6 | 1.63 [1.25, 2.13] | 6 | 1.62 [1.24, 2.10] | No | |
| 3.10 Pruritus | RR (MH), 95% CI | 7 | 0.75 [0.48, 1.18] | 7 | 0.76 [0.54, 1.07] | No | |
| 3.11 Sedation (1 h) | MD (IV), 95% CI | 3 | 0.71 [0.03, 1.39] | 3 | 0.91 [0.57, 1.25] | No | |
| 3.12 Apgarscore ≤ 7 (< 7) at 5 min | RR (IV,), 95% CI, 0/0 cell counts | 5 | 1.26 [0.62, 2.57] | 5 | 1.22 [0.67, 2.62] | No | |
| 3.13 Apgarscore at 5 min | MD (IV,), 95% CI | 3 | 0.06 [‐0.27, 0.39] | 3 | 0.06 [‐0.27, 0.39] | No | |
| 3.14 Need for naloxone | RR (IV,), 95% CI, 0/0 cell counts | 2 | 0.02 [0.00, 1.6E8] | 2 | 0.01 [0.00, 4.6E5] | No | |
| 3.15 FHR/CTG abnormalities, non‐reassuring fetal status | RR (MH), 95% CI | 5 | 1.55 [0.49, 4.92] | 5 | 1.38 [0.84, 2.25] | No | |
| 3.16 Pain intensity 'early' (1 h) | SMD (IV), 95% CI | 6 | 0.57 [0.31, 0.84] | 6 | 0.57 [0.31, 0.84] | No | |
| 3.18 Additional analgesia required | RR (IV,), 95% CI, 0/0 cell counts | 6 | 9.27 [3.73, 23.03] | 6 | 10.86 [4.37, 26.95] | No | |
| 3.19 Rate of caesarean delivery | RR (MH), 95% CI | 9 | 0.99 [0.81, 1.21] | 9 | 0.96 [0.79, 1.18] | No | |
| 4. Remifentanil (PCA) versus remifentanil (continuous IV) | |||||||
| 4.1 Respiratory depression (< 8 breaths/min) | RR (IV,), 95% CI, 0/0 cell counts | 2 | 0.98 [0.00, 1.0E12] | 2 | 0.98 [0.00, 1.0E12]] | No | |
| 4.3 Hypotension | RR (IV,), 95% CI, 0/0 cell counts | 2 | 0.98 [0.00, 1.0E12] | 2 | 0.98 [0.00, 1.0E12] | No | |
| 4.4 Bradycardia | RR (IV,), 95% CI, 0/0 cell counts | 2 | 0.98 [0.00, 1.0E12] | 2 | 0.98 [0.00, 1.0E12] | No | |
| 4.5 Nausea (and vomiting) | RR (MH), 95% CI | 2 | 0.85 [0.28, 2.54] | 2 | 0.81 [0.38, 1.73] | No | |
| 4.8 Need for naloxone | RR (IV,), 95% CI, 0/0 cell counts | 2 | 0.98 [0.00, 1.0E12] | 2 | 0.98 [0.00, 1.0E12] | No | |
| All RR for outcomes including 0/0 cell counts (zero/zero event trials) were calculated using TSA (constant continuity correction, 0.01). Review Manager 5 produces computational errors when both the intervention and control group have zero events. By using TSA there is no possibility to choose the MH method (only IV) which may cause small deviations within results. Abbreviations: [95% CI]: 95% confidence interval; IV: Inverse Variance; MD: mean difference; MH: Mantel‐Haenszel; n: number of participants; RPCA: Remifentanil PCA; RR: risk ratio; SMD: standardised mean difference | |||||||
| Data | 0‐ and 0/0‐event trials included (TSA) | 0‐event trials included and 0/0‐event trials excluded (RevMan)1 | |||||||
| Outcome (n, studies) | 0‐events, 0/0‐events, imbalance (Yes/No) | Summary statistic | Reciprocal (1.0) | Reciprocal (0.01) | Empirical (1.0) | Empirical (0.01) | Constant (1.0) | Constant (0.01) | Constant (1.0) |
| 1.3 Oxygen desaturation (2) | 1, 0 (Yes) | RR [95% CI], P value, I2 | 0.51 [0.01, 30.22], 0.7471, 86% | 3.41 [0.82, 14.22] 0.0918, 0% | 0.57 [0.01, 24.87] 0.7699, 87% | 3.39 [0.81, 14.10], 0.0938, 0% | 0.5 [0.01, 31.95], 0.7421, 86% | 3.42 [0.82, 14.25], 0.0914, 0% | 0.5 [0.01, 31.95], 0.7421, 86% |
| 1.4 Nausea (and vomiting) (4) | 1, 0 (No) | RR [95% CI], P value, I2 | 0.54 [0.29, 0.99], 0.0460, 0% | 0.56 [0.30, 1.04], 0.0665, 0% | 0.54 [0.29, 0.99], 0.0463, 0% | 0.56 [0.30, 1.04], 0.0667, 0% | 0.54 [0.29, 0.99], 0.0461, 0% | 0.56 [0.30, 1.04], 0.0664, 0% | 0.54 [0.29, 0.99], 0.0461, 0% |
| 1.6 Pruritus (2) | 0, 2 (No) | RR [95% CI], P value, I2 | 1.0 [0.06, 15.71], 1.0, 0% | 1.0 [0.00, 1.0E12], 1.0, 0% | NA | NA | 1.02 [0.07, 16.06], 0.9874, 0% | 1.02 [0.00, 1.1E12], 0.9987, 0% | NA |
| 1.14 Rate of caesarean delivery (4) | 2, 0 (No) | RR [95% CI], P value, I2 | 0.69 [0.34, 1,40], 0.3084, 0% | 0.63 [0.30, 1.32], 0.2164, 0% | 0.7 [0.34, 1.43], 0.3268, 1% | 0.63 [0.30, 1.32], 0.2182, 0% | 0.70 [0.35, 1.40], 0.3103, 0% | 0.63 [0.30, 1.32], 0.2165, 0% | 0.70 [0.35, 1.40], 0.3103, 0% |
| 2.10 Need for naloxone (2) | 1, 1 (No) | RR [95% CI], P value, I2 | 0.49 [0.05, 5.29], 0.5580, 0%, | 0.03 [0.00, 1.1E8], 0.7484, 0% | NA | NA | 0.48 [0.04, 5.30], 0.5473, 0% | 0.03 [0.00, 1.8E8], 0.7549, 0% | 0.3 [0.03, 2.72], 0.2847, 0% |
| 3.3 Respiratory depression (3) | 1, 1 (Yes) | RR [95% CI], P value, I2 | 0.97 [0.56, 1.70] 0.9206, 0% | 0.91 [0.51, 1.62] 0.7506, 0% | 0.98 [0.57, 1.71] 0.9550, 0% | 0.91 [0.51, 1.62] 0.7532, 0% | 0.98 [0.56, 1.71] 0.9424, 0% | 0.91 [0.51, 1.62] 0.7518, 0% | 1.35 [0.30, 6.18], 0.6967, 37% |
| 3.4 Oxygen desaturation (3) | 1, 0 (Yes) | RR [95% CI], P value, I2 | 3.2 [1.72, 5.94], 0.0002, 46% | 2.88 [1.94, 4.27], < 0.0001, 0% | 3.04 [1.70, 5.43], 0.0002, 38% | 2.88 [1.94, 4.27], < 0.0001, 0% | 3.19 [1.72, 5.91], 0.0002, 46% | 2.88 [1.94, 4.27], < 0.0001, 0% | 3.19 [1.72, 5.91], 0.0002, 46% |
| 3.6 Hypotension (4) | 2, 1 (No) | RR [95% CI], P value, I2 | 0.59 [0.38, 0.93], 0.0225, 0% | 0.59 [0.37, 0.94], 0.0271, 0% | 0.59 [0.38, 0.93], 0.0219, 0% | 0.59 [0.38, 0.94], 0.0273, 0% | 0.59 [0.38, 0.93], 0.0225, 0% | 0.59 [0.37, 0.94], 0.0271, 0% | 0.58 [0.23, 1.48], 0.2517, 16% |
| 3.7 Bradycardia (2) | 0, 2 (No) | RR [95% CI], P value, I2 | 1.0 [0.07, 15.07], 1.0, 0% | 1.0 [0.00, 1.0E12], 1.0, 0% | NA | NA | 1.0 [0.07, 15.07], 1.0, 0% | 1.0 [0.00, 1.0E12], 1.0, 0% | NA |
| 3.10 Pruritus (7) | 1, 0 (Yes) | RR [95% CI], P value, I2 | 0.75 [0.48, 1.18], 0.2182, 29% | 0.78 [0.51, 1.18], 0.2366, 21% | 0.75 [0.48, 1.18], 0.2170, 29% | 0.78 [0.51, 1.18], 0.2368, 21% | 0.75 [0.48, 1.18], 0.2154, 29% | 0.78 [0.51, 1.18], 0.2370, 21% | 0.75 [0.48, 1.18], 0.2154, 29% |
| 3.12 Apgarscore < 7 at 5 min (5) | 2, 2 (No) | RR [95% CI], P value, I2 | 1.26 [0.65, 2.43], 0.4944, 0% | 1.26 [0.62, 2.57], 0.5193, 0% | 1.28 [0.66, 2.47], 0.4596, 0% | 1.26 [0.62, 2.57], 0.5209, 0% | 1.26 [0.65, 2.43], 0.4904, 0% | 1.26 [0.62, 2.57], 0.5197, 0% | 1.28 [0.65, 2.51], 0.4801, 0% |
| 3.14 Need for naloxone (2) | 1, 1 (Yes) | RR [95% CI], P value, I2 | 0.34 [0.03, 3.82], 0.3846, 0% | 0.02 [0.00, 1.6E8], 0.7247, 0% | NA | NA | 0.46 [0.04, 4.88], 0.5200, 0% | 0.02 [0.00, 1.6E8], 0.7447, 0% | 0.2 [0.03, 1.15], 0.0720, 0% |
| 3.15 FHR/CTG abnormalities (5) | 1, 0 (No) | RR [95% CI], P value, I2 | 1.54 [0.50, 4.75], 0.4499, 46% | 1.88 [0.63, 5.61], 0.2578, 35% | 1.53 [0.52, 4.54], 0.4410, 44% | 1.88 [0.63, 5.64], 0.2600, 35% | 1.54 [0.50, 4.75], 0.4499, 46% | 1.88 [0.63, 5.61], 0.2578, 35% | 1.54 [0.50, 4.75], 0.4499, 46% |
| 3.18 Additional analgesia required (6) | 2, 1 (No) | RR [95% CI], P value, I2 | 7.47 [3.28, 16.99] < 0.0001, 0% | 9.26 [3.73, 23.03] < 0.0001, 0% | 9.66 [3.97, 23.52] < 0.0001, 0% | 9.23 [3.71, 22.95] < 0.0001, 0% | 7.65 [3.37, 17.38] < 0.0001, 0% | 9.27 [3.73, 23.03] < 0.0001, 0% | 8.1 [3.5, 18.75], < 0.0001, 0% |
| 3.19 Rate of caesarean delivery (9) | 1, 0 (No) | RR [95% CI], P value, I2 | 0.99 [0.81, 1.21], 0.9076, 0% | 1.0 [0.82, 1.22], 0.9858, 0% | 0.99 [0.81, 1.21], 0.9058, 0% | 1.0 [0.82, 1.22], 0.9857, 0% | 0.99 [0.81, 1.21], 0.9067, 0% | 1.0 [0.82, 1.22], 0.9857, 0% | 0.99 [0.81, 1.21], 0.9067, 0% |
| 3.20 Rate of assisted birth (8) | 1, 0 (No) | RR [95% CI], P value, I2 | 0.92 [0.66, 1.26], 0.5914, 0% | 0.94 [0.68, 1.30], 0.6917, 0% | 0.92 [0.66, 1.26], 0.5926, 0% | 0.94 [0.68, 1.30], 0.6918, 0% | 0.92 [0.66, 1.26], 0.5914, 0% | 0.94 [0.68, 1.30], 0.6917, 0% | 0.92 [0.66, 1.26], 0.5914, 0% |
| 3.26 Neonatal resuscitation (2) | 2, 0 (No) | RR [95% CI], P value, I2 | 1.01 [0.04, 24.25], 0.9933, 57% | 1.09 [0.00, 3.1E8], 0.9929, 0% | NA | NA | 1.02 [0.04, 25.09], 0.9901, 57% | 1.03 [0.00, 3.4E8], 0.9980, 0% | 1.02 [0.04, 25.09], 0.9901, 57% |
| 4.1 Respiratory depression (2) | 0, 2 (No) | RR [95% CI], P value, I2 | 1.0 [0.06, 15.66], 1.0, 0% | 1.0 [0.00, 1.0E12], 1.0, 0% | NA | NA | 0.98 [0.06, 15.37], 0.9896, 0% | 0.98 [0.00, 1.0E12], 0.9989, 0% | NA |
| 4.3 Hypotension (2) | 0, 2 (No) | RR [95% CI], P value, I2 | 1.0 [0.06, 15.66], 1.0, 0% | 1.0 [0.00, 1.0E12], 1.0, 0% | NA | NA | 0.98 [0.06, 15.37], 0.9896, 0% | 0.98 [0.00, 1.0E12], 0.9989, 0% | NA |
| 4.4 Bradycardia (2) | 0, 2 (No) | RR [95% CI], P value, I2 | 1.0 [0.06, 15.66], 1.0, 0% | 1.0 [0.00, 1.0E12], 1.0, 0% | NA | NA | 0.98 [0.06, 15.37], 0.9896, 0% | 0.98 [0.00, 1.0E12], 0.9989, 0% | NA |
| 4.8 Need for naloxone (2) | 0, 2 (No) | RR [95% CI], P value, I2 | 1.0 [0.06, 15.66], 1.0, 0% | 1.0 [0.00, 1.0E12], 1.0, 0% | NA | NA | 0.98 [0.06, 15.37], 0.9896, 0% | 0.98 [0.00, 1.0E12], 0.9989, 0% | NA |
| 1Review Manager 5 ignores zero/zero events trials and uses a constant continuity correction of 0.5 for studies with zero events in 1 arm. For the reciprocal, the empirical, and the constant approach including zero/zero‐event trials we used the TSA software. By using TSA there is no possibility to choose the Mantel‐Haenszel method (only inverse variance possible) which may cause small deviations within results. We performed sensitivity analyses by using different approaches for handling of zero event trials (reciprocal, empirical, and constant approach) in meta‐analysis with two or more studies. A) reciprocal approach ; value (k): 1.0, 0.01 Adds a factor of the reciprocal of the size of the opposite treatment arm to the cells which accounts for imbalance in group sizes. B) empirical approach ; value (k): 1.0, 0.01 All studies without zero events are used to calculate a pooled effect estimate. Using this effect estimate a continuity correction factor can be calculated which produces an estimated effect close to the pooled estimated effect in the studies with zero events in both arms. C) constant approach ; value (k): 1.0, 0.01 A value of 0.5 or 0.005, respectively, is added to each group in a 2 x 2 table; thus 1 participant is added to each intervention arm. Abbreviations: NA: not applicable; RR: risk ratio | |||||||||
| Study | Comparator | Analgesia duration (mean ± SD, median (range)) [min] | Background infusion [µg/(kg*min)] | Bolus dose | Bolus application speed (calculated) | Bolus dose escalation on request | Lockout time [min] | Maximum dose | Total dose administered (mean ± SD, median (range [IQR]) |
| Remifentanil variable infusion, fixed bolus | 463 | 0.025 | 0.25 µg/kg | NA | 0.5 ‐ 1 µg/kg, every 15 min | 2 | 3000 µg in 4 h | 474 (188 ‐ 925) µg/h | |
| Pethidine PCA | 147.5 ± 79 | no | 40 µg | 133.33 µg/min | no | 2 | NA | NA | |
| Meperidine IM | 280 ± 55 | 0.025 | 50 µg | 2 µg/min | no | 30 | NA | NA | |
| (1) Meperidine PCA (2) Fentanyl PCA | 234 ± 136 | no | 40 µg | NA | no | 2 | 1200 µg/h | 1840 ± 1090 µg | |
| epidural | 286 ± 145 | no | 40µg | 66.67 µg/min | no | 2 | 1200 µg/h | 2817 ± 1564 µg | |
| epidural | 192 ± 116 | no | 40µg | 66.67 µg/min | no | 2 | 1200 µg/h | 1417 µg | |
| epidural | NA | 0.0 | 0.25 µg/kg | 1.5 µg/(kg*min) | no | 5 | 3000 µg in 4 h | NA | |
| Meperidine IV | NA | no | 20 µg | NA | 5 µg increments, every 15 ‐ 20 min | 3 | 1500 µg/h | 1034.5 (133 ‐ 4021) µg | |
| epidural | NA | 0.025 | 20 µg | NA | 25% increase every 15 ‐ 20 min | 3 | NA | 8.5 ± 2.2 µg/(kg*h) | |
| epidural | 236 (128 ‐ 376) | no | 30 µg | NA | increase to 40 µg or decrease to 20 µg | 3 | 40 µg per bolus | NA | |
| epidural/CSE | NA | no | 25 µg | 25 µg/min | escalation scheme (0.1 – 0.2 – 0.3 – 0.5 – 0.7 – 0.9 µg/kg) until the maximum dose of 0.9 µg/kg | 1 | 25 µg/mL + 0.9 µg/kg per bolus | NA | |
| Remifentanil IV | NA | no | 0.25 µg/kg | NA | increased to 0.4 µg/kg (if VNRS ≥ 7) | 4 | 0.4 µg/kg per bolus | 942.6 ± 86.4 µg | |
| Pethidine IM | NA | no | 25 µg (< 60 kg) or 30 µg (≥ 60 kg) | 6.67 µg/min | no | 3.75‐4.50 | 500 µg/h (calculated) | NA | |
| Remifentanil IV | 1511 | no | 0.1 µg/kg | 0.2 µg/(kg*min) | increments of 0.1 µg/kg to 0.4 µg/kg | 2 | 0.4 µg/kg per bolus | 1340 (1220 ‐ 1480 [890 ‐ 1680]) µg | |
| epidural | NA | no | 20 µg | NA | up to 60 µg | 2 min, 1 min on request | 60 µg per bolus | 1725 ± 1392 µg | |
| epidural | 162.75 ± 77.15 | no | 20 µg | NA | 10 µg increments (if VAS decrease < 2) | 3 | NA | NA | |
| Meperidine IM | NA | no | 20 µg | 60 µg/min | NA | 3 | NA | NA | |
| epidural | 225 ± 117.2 | no | 0.15 µg/kg | 100 µg/min | 0.15 µg/kg increments every 15 min | 2 | No limit | NA | |
| Pethidine PCA | 334 ± 260 | no | 0.5 µg/kg | NA | no | 2 | No limit | 3670 (120 ‐ 4880) µg (mean (range)) | |
| epidural | Max. 60 | no | 25 µg | 25 µg/min | escalation scheme (0.1 – 0.2 – 0.33 – 0.5 – 0.7 – 0.9 µg/kg) until the maximum dose of 0.9 µg/kg | 1 | 25 µg/mL + 0.9 µg/kg per bolus | 0.14 (0.08 ‐ 0.18 [0.03 ‐ 0.32]) µg/(kg*min) | |
| 1Time from the start of remifentanil analgesia until the final dose increment, 50% survival (Kaplan‐Meier cumulative event curve) Abbreviations: NA: not applicable | |||||||||
| Outcome or subgroup title | No. of studies | No. of participants | Statistical method | Effect size |
| 1 Satisfaction with pain relief Show forest plot | 4 | 216 | Std. Mean Difference (IV, Random, 95% CI) | 2.11 [0.72, 3.49] |
| 2 Respiratory depression (< 8 breaths/min) Show forest plot | 1 | Risk Ratio (M‐H, Random, 95% CI) | Totals not selected | |
| 3 Oxygen desaturation (SpO2 < 95%) Show forest plot | 2 | 113 | Risk Ratio (M‐H, Random, 95% CI) | 0.48 [0.00, 47.37] |
| 4 Nausea (and vomiting) Show forest plot | 4 | 216 | Risk Ratio (M‐H, Random, 95% CI) | 0.54 [0.29, 0.99] |
| 5 Vomiting Show forest plot | 1 | Risk Ratio (M‐H, Random, 95% CI) | Totals not selected | |
| 6 Pruritus Show forest plot | 2 | 156 | Risk Ratio (M‐H, Random, 95% CI) | 0.0 [0.0, 0.0] |
| 7 Sedation (1 h) Show forest plot | 1 | Mean Difference (IV, Random, 95% CI) | Totals not selected | |
| 8 Apgar score < 7 at 5 min Show forest plot | 1 | Risk Ratio (M‐H, Random, 95% CI) | Totals not selected | |
| 9 Apgar score at 5 min Show forest plot | 1 | Mean Difference (IV, Random, 95% CI) | Totals not selected | |
| 10 FHR/CTG abnormalities, non‐reassuring fetal status Show forest plot | 2 | 156 | Risk Ratio (M‐H, Random, 95% CI) | 0.30 [0.10, 0.90] |
| 11 Pain intensity 'early' (1 h) Show forest plot | 3 | 180 | Std. Mean Difference (IV, Random, 95% CI) | ‐1.58 [‐2.69, ‐0.48] |
| 12 Pain intensity 'late' (2 h) Show forest plot | 1 | Mean Difference (IV, Random, 95% CI) | Totals not selected | |
| 13 Additional analgesia required (escape analgesia) Show forest plot | 3 | 190 | Risk Ratio (M‐H, Random, 95% CI) | 0.57 [0.40, 0.81] |
| 14 Rate of caesarean delivery Show forest plot | 4 | 215 | Risk Ratio (M‐H, Random, 95% CI) | 0.70 [0.34, 1.41] |
| 15 Rate of assisted birth Show forest plot | 4 | 215 | Risk Ratio (M‐H, Random, 95% CI) | 0.82 [0.32, 2.09] |
| 16 Augmented labour Show forest plot | 3 | 190 | Risk Ratio (M‐H, Random, 95% CI) | 0.97 [0.72, 1.29] |
| 17 Breastfeeding initiation (feeding difficulties) Show forest plot | 1 | Risk Ratio (M‐H, Random, 95% CI) | Totals not selected | |
| Outcome or subgroup title | No. of studies | No. of participants | Statistical method | Effect size |
| 1 Satisfaction with pain relief Show forest plot | 1 | Mean Difference (IV, Random, 95% CI) | Totals not selected | |
| 2 Oxygen desaturation (SpO2 < 95%) Show forest plot | 2 | 190 | Risk Ratio (M‐H, Random, 95% CI) | 1.28 [0.49, 3.30] |
| 3 Hypotension Show forest plot | 1 | Risk Ratio (M‐H, Random, 95% CI) | Totals not selected | |
| 4 Bradycardia Show forest plot | 1 | Risk Ratio (M‐H, Random, 95% CI) | Totals not selected | |
| 5 Nausea (and vomiting) Show forest plot | 1 | Risk Ratio (M‐H, Random, 95% CI) | Totals not selected | |
| 6 Pruritus Show forest plot | 1 | Risk Ratio (M‐H, Random, 95% CI) | Totals not selected | |
| 7 Sedation (1 h) Show forest plot | 1 | Mean Difference (IV, Random, 95% CI) | Totals not selected | |
| 8 Apgar score < 7 at 5 min Show forest plot | 1 | Risk Ratio (M‐H, Random, 95% CI) | Totals not selected | |
| 9 Apgar score at 5 min Show forest plot | 1 | Mean Difference (IV, Random, 95% CI) | Totals not selected | |
| 10 Need for naloxone Show forest plot | 2 | 55 | Risk Ratio (M‐H, Random, 95% CI) | 0.30 [0.01, 6.47] |
| 11 FHR/CTG abnormalities, non‐reassuring fetal status Show forest plot | 1 | Risk Ratio (M‐H, Random, 95% CI) | Totals not selected | |
| 12 NACS at 15/30 min Show forest plot | 2 | 94 | Mean Difference (IV, Random, 95% CI) | 1.11 [‐0.65, 2.87] |
| 13 Pain intensity 'early' (30 min/1 h) Show forest plot | 3 | 215 | Std. Mean Difference (IV, Random, 95% CI) | ‐0.51 [‐1.01, ‐0.00] |
| 14 Pain intensity 'late' (2 h) Show forest plot | 1 | Mean Difference (IV, Random, 95% CI) | Totals not selected | |
| 15 Additional analgesia required (escape analgesia) Show forest plot | 3 | 215 | Risk Ratio (M‐H, Random, 95% CI) | 0.76 [0.45, 1.28] |
| 16 Rate of caesarean delivery Show forest plot | 2 | 143 | Risk Ratio (M‐H, Random, 95% CI) | 2.78 [0.99, 7.82] |
| 17 Rate of assisted birth Show forest plot | 2 | 143 | Risk Ratio (M‐H, Random, 95% CI) | 1.22 [0.62, 2.37] |
| 18 Augmented labour Show forest plot | 2 | 152 | Risk Ratio (M‐H, Random, 95% CI) | 1.37 [0.59, 3.15] |
| Outcome or subgroup title | No. of studies | No. of participants | Statistical method | Effect size |
| 1 Satisfaction with pain relief Show forest plot | 7 | 2135 | Std. Mean Difference (IV, Random, 95% CI) | ‐0.22 [‐0.40, ‐0.04] |
| 2 Apnoea Show forest plot | 1 | Risk Ratio (M‐H, Random, 95% CI) | Totals not selected | |
| 3 Respiratory depression (< 9, < 8 breaths/min) Show forest plot | 3 | 687 | Risk Ratio (M‐H, Random, 95% CI) | 1.52 [0.23, 9.90] |
| 4 Oxygen desaturation (SpO2 < 92%) Show forest plot | 3 | 774 | Risk Ratio (M‐H, Random, 95% CI) | 3.24 [1.66, 6.32] |
| 5 Oxygen desaturation (SpO2 < 95%) Show forest plot | 3 | 800 | Risk Ratio (M‐H, Random, 95% CI) | 3.27 [2.32, 4.61] |
| 6 Hypotension Show forest plot | 4 | 823 | Risk Ratio (M‐H, Random, 95% CI) | 0.58 [0.22, 1.49] |
| 7 Bradycardia Show forest plot | 2 | 44 | Risk Ratio (M‐H, Random, 95% CI) | 0.0 [0.0, 0.0] |
| 8 Nausea Show forest plot | 8 | 1909 | Risk Ratio (M‐H, Random, 95% CI) | 1.49 [1.19, 1.86] |
| 9 Vomiting Show forest plot | 6 | 1840 | Risk Ratio (M‐H, Random, 95% CI) | 1.63 [1.25, 2.13] |
| 10 Pruritus Show forest plot | 7 | 1852 | Risk Ratio (M‐H, Random, 95% CI) | 0.75 [0.48, 1.18] |
| 11 Sedation (1 h) Show forest plot | 3 | 148 | Std. Mean Difference (IV, Random, 95% CI) | 0.71 [0.03, 1.39] |
| 12 Apgar score ≤ 7 (< 7) at 5 min Show forest plot | 5 | 1322 | Risk Ratio (M‐H, Random, 95% CI) | 1.28 [0.65, 2.51] |
| 13 Apgar score at 5 min Show forest plot | 3 | 137 | Mean Difference (IV, Random, 95% CI) | 0.06 [‐0.27, 0.39] |
| 14 Need for naloxone Show forest plot | 2 | 1170 | Risk Ratio (M‐H, Random, 95% CI) | 0.20 [0.01, 3.85] |
| 15 FHR/CTG abnormalities, non‐reassuring fetal status Show forest plot | 5 | 1280 | Risk Ratio (M‐H, Random, 95% CI) | 1.55 [0.49, 4.92] |
| 16 Pain intensity 'early' (1 h) Show forest plot | 6 | 235 | Std. Mean Difference (IV, Random, 95% CI) | 0.57 [0.31, 0.84] |
| 17 Pain intensity 'late' (2 h) Show forest plot | 4 | 143 | Std. Mean Difference (IV, Random, 95% CI) | 1.46 [0.66, 2.26] |
| 18 Additional analgesia required Show forest plot | 6 | 1037 | Risk Ratio (M‐H, Random, 95% CI) | 8.10 [3.50, 18.75] |
| 19 Rate of caesarean delivery Show forest plot | 9 | 1578 | Risk Ratio (M‐H, Random, 95% CI) | 0.99 [0.81, 1.21] |
| 20 Rate of assisted birth Show forest plot | 8 | 1550 | Risk Ratio (M‐H, Random, 95% CI) | 0.92 [0.66, 1.26] |
| 21 Augmented labour Show forest plot | 6 | 1379 | Risk Ratio (M‐H, Random, 95% CI) | 0.91 [0.82, 1.02] |
| 22 Umbilical cord base excess (artery) Show forest plot | 3 | 75 | Mean Difference (IV, Random, 95% CI) | ‐0.97 [‐2.65, 0.72] |
| 23 Umbilical cord base excess (venous) Show forest plot | 2 | 129 | Mean Difference (IV, Random, 95% CI) | ‐0.05 [‐2.39, 2.30] |
| 24 Umbilical cord pH (artery) Show forest plot | 5 | 1245 | Mean Difference (IV, Random, 95% CI) | ‐0.01 [‐0.02, ‐0.00] |
| 25 Umbilical cord pH (venous) Show forest plot | 4 | 1299 | Mean Difference (IV, Random, 95% CI) | 0.01 [‐0.01, 0.02] |
| 26 Neonatal resuscitation Show forest plot | 2 | 69 | Risk Ratio (M‐H, Random, 95% CI) | 1.02 [0.04, 25.09] |
| Outcome or subgroup title | No. of studies | No. of participants | Statistical method | Effect size |
| 1 Respiratory depression (< 8 breaths/min) Show forest plot | 2 | 135 | Risk Ratio (M‐H, Random, 95% CI) | 0.0 [0.0, 0.0] |
| 2 Oxygen desaturation (SpO2 < 95%) Show forest plot | 1 | Risk Ratio (M‐H, Random, 95% CI) | Totals not selected | |
| 3 Hypotension Show forest plot | 2 | 135 | Risk Ratio (M‐H, Random, 95% CI) | 0.0 [0.0, 0.0] |
| 4 Bradycardia Show forest plot | 2 | 135 | Risk Ratio (M‐H, Random, 95% CI) | 0.0 [0.0, 0.0] |
| 5 Nausea (and vomiting) Show forest plot | 2 | 135 | Risk Ratio (M‐H, Random, 95% CI) | 0.85 [0.28, 2.54] |
| 6 Pruritus Show forest plot | 1 | Risk Ratio (M‐H, Random, 95% CI) | Totals not selected | |
| 7 Sedation (1 h) Show forest plot | 1 | Mean Difference (IV, Random, 95% CI) | Totals not selected | |
| 8 Need for naloxone Show forest plot | 2 | 135 | Risk Ratio (M‐H, Random, 95% CI) | 0.0 [0.0, 0.0] |
| 9 FHR/CTG abnormalities, non‐reassuring fetal status Show forest plot | 1 | Risk Ratio (M‐H, Random, 95% CI) | Totals not selected | |
| 10 Pain intensity 'early' (1 h) Show forest plot | 1 | Mean Difference (IV, Random, 95% CI) | Totals not selected | |
| 11 Pain intensity 'late' (2 h) Show forest plot | 1 | Mean Difference (IV, Random, 95% CI) | Totals not selected | |
| 12 Additional analgesia required (escape analgesia) Show forest plot | 1 | Risk Ratio (M‐H, Random, 95% CI) | Totals not selected | |
| 13 Neonatal resuscitation Show forest plot | 1 | Risk Ratio (M‐H, Random, 95% CI) | Totals not selected | |
| Outcome or subgroup title | No. of studies | No. of participants | Statistical method | Effect size |
| 1 Satisfaction with pain relief Show forest plot | 1 | Mean Difference (IV, Random, 95% CI) | Totals not selected | |
| 2 Oxygen desaturation (SpO2 < 95%) Show forest plot | 1 | Risk Ratio (M‐H, Random, 95% CI) | Totals not selected | |
| 3 Hypotension Show forest plot | 1 | Risk Ratio (M‐H, Random, 95% CI) | Totals not selected | |
| 4 Bradycardia Show forest plot | 1 | Risk Ratio (M‐H, Random, 95% CI) | Totals not selected | |
| 5 Nausea Show forest plot | 1 | Risk Ratio (M‐H, Random, 95% CI) | Totals not selected | |
| 6 Vomiting Show forest plot | 1 | Risk Ratio (M‐H, Random, 95% CI) | Totals not selected | |
| 7 Pruritus Show forest plot | 1 | Risk Ratio (M‐H, Random, 95% CI) | Totals not selected | |
| 8 Apgar score < 7 at 5 min Show forest plot | 1 | Risk Ratio (M‐H, Random, 95% CI) | Totals not selected | |
| 9 Need for naloxone Show forest plot | 1 | Risk Ratio (M‐H, Random, 95% CI) | Totals not selected | |
| 10 FHR/CTG abnormalities, non‐reassuring fetal status Show forest plot | 1 | Risk Ratio (M‐H, Random, 95% CI) | Totals not selected | |
| 11 Additional analgesia required (escape analgesia) Show forest plot | 1 | Risk Ratio (M‐H, Random, 95% CI) | Totals not selected | |
| 12 Rate of caesarean delivery Show forest plot | 1 | Risk Ratio (M‐H, Random, 95% CI) | Totals not selected | |
| 13 Augmented labour Show forest plot | 1 | Risk Ratio (M‐H, Random, 95% CI) | Totals not selected | |
| 14 Umbilical cord base excess (artery) Show forest plot | 1 | Mean Difference (IV, Random, 95% CI) | Totals not selected | |
| 15 Umbilical cord base excess (venous) Show forest plot | 1 | Mean Difference (IV, Random, 95% CI) | Totals not selected | |
| 16 Umbilical cord pH (artery) Show forest plot | 1 | Mean Difference (IV, Random, 95% CI) | Totals not selected | |
| 17 Umbilical cord pH (venous) Show forest plot | 1 | Mean Difference (IV, Random, 95% CI) | Totals not selected | |
| 18 Neonatal resuscitation Show forest plot | 1 | Risk Ratio (M‐H, Random, 95% CI) | Totals not selected | |