Revascularización completa versus revascularización del vaso culpable en infarto de miocardio con elevación del ST con enfermedad de múltiples vasos
Información
- DOI:
- https://doi.org/10.1002/14651858.CD011986.pub2Copiar DOI

- Base de datos:
-
- Cochrane Database of Systematic Reviews
- Versión publicada:
-
- 03 mayo 2017see what's new
- Tipo:
-
- Intervention
- Etapa:
-
- Review
- Grupo Editorial Cochrane:
-
Grupo Cochrane de Corazón
- Copyright:
-
- Copyright © 2017 The Cochrane Collaboration. Published by John Wiley & Sons, Ltd.
Cifras del artículo
Altmetric:
Citado por:
Autores
Contributions of authors
CB: protocol writing, trial selection, data extraction, data analysis, data interpretation, review writing, and future review updates.
SH: protocol writing, trial selection, data extraction, data analysis, data interpretation, review writing, and future review updates.
DB: data interpretation and review writing.
RK: data interpretation and review writing.
DF: data analysis, data interpretation, and review writing.
EO: data analysis, data interpretation, and review writing.
KA: data analysis, data interpretation, and review writing.
AS: data analysis, data interpretation, and review writing.
MS: data analysis, data interpretation, and review writing.
SZ: data analysis, data interpretation, and review writing.
AO: data analysis, data interpretation, and review writing.
CG: TSA expert, data analysis, data interpretation, and review writing.
HK: data interpretation and review writing.
TE: data interpretation and review writing.
DH: data interpretation and review writing.
JB: data analysis, data interpretation, and review writing.
The first and second review authors contributed equally to this review.
Sources of support
Internal sources
-
Self supported, Other.
External sources
-
Self supported, Other.
Declarations of interest
CB: none known.
SH: none known.
DB: Advisory Board: Cardax, Elsevier Practice Update Cardiology, Medscape Cardiology, Regado Biosciences; Board of Directors: Boston VA Research Institute, Society of Cardiovascular Patient Care; Chair: American Heart Association Quality Oversight Committee; Data Monitoring Committees: Duke Clinical Research Institute, Harvard Clinical Research Institute, Mayo Clinic, Population Health Research Institute (including for his role on the DSMB of COMPLETE); Honoraria: American College of Cardiology (Senior Associate Editor, Clinical Trials and News, ACC.org), Belvoir Publications (Editor in Chief, Harvard Heart Letter), Duke Clinical Research Institute (clinical trial steering committees), Harvard Clinical Research Institute (clinical trial steering committee), HMP Communications (Editor in Chief, Journal of Invasive Cardiology), Journal of the American College of Cardiology (Guest Editor; Associate Editor), Population Health Research Institute (clinical trial steering committee), Slack Publications (Chief Medical Editor, Cardiology Today’s Intervention), Society of Cardiovascular Patient Care (Secretary/Treasurer), WebMD (CME steering committees); Other: Clinical Cardiology (Deputy Editor), NCDR‐ACTION Registry Steering Committee (Chair), VA CART Research and Publications Committee (Chair); Research Funding: Amarin, Amgen, AstraZeneca, Bristol‐Myers Squibb, Eisai, Ethicon, Forest Laboratories, Ischemix, Lilly, Medtronic, Pfizer, Roche, Sanofi Aventis, The Medicines Company; Royalties: Elsevier (Editor, Cardiovascular Intervention: A Companion to Braunwald’s Heart Disease); Site Co‐Investigator: Biotronik, Boston Scientific, St. Jude Medical; Trustee: American College of Cardiology; Unfunded Research: FlowCo, PLx Pharma, Takeda.
RK: none known.
DF: has received compensation for travel expenses related to his membership on the board of the Alliance for a Healthier Generation and the American Heart Association. Dr Faxon has also received compensation for consulting as a member of a Data Safety Monitoring Board from Medtronic, Boston Scientific, and Biotronik. Dr Faxon has received stock options from RIVA Medical as well as honoraria from the American Heart Association for his service as an editor of Circulation. All compensation received is unrelated to this review.
EO: has received compensation for consulting from Abiomed, Astra Zeneca, Biotie, Boehringer Ingelheim, Bristol Meyers Squibb, Daiichi Sankyo, Eli Lilly & Company, Faculty Connection, Gilead Sciences, Ikaria, Ivivi, Janssen Pharmaceuticals, LipoScience, Merck, Pozen, Roche, Sanofi Aventis, Stealth Peptides, The Medicines Company, and Web MD. Dr Ohman has received institutional grants for clinical trials from Daiichi Sankyo, Eli Lilly & Company, Gilead Sciences, and Janssen Pharmaceuticals. Dr Ohman has received payment for lectures from Gilead Sciences, Janssen Pharmaceuticals, and LipoScience. All compensation received is unrelated to this review.
KA: none known.
AS: none known.
MS: none known.
SZ: has received compensation for lectures from GSK and Arbor Pharmaceuticals for topics unrelated to this review.
AO: none known.
CG: none known.
HK: none known.
TE: fees from Boston Scientific, St. Jude Medical, Astra Zeneca, and Bayer.
DH: none known.
JB: none known.
Acknowledgements
We acknowledge the important role of the institutions that foster our career development, the Cochrane Heart Group, and the reviewers that provided interesting and useful criticisms.
We also thank the contribution of Dr Wenliang Song and Lanye He in the translation of the article Zhang 2015; and Ronald E Pachon for his participation at early stages of this manuscript.
Version history
| Published | Title | Stage | Authors | Version |
| 2017 May 03 | Complete versus culprit‐only revascularisation in ST elevation myocardial infarction with multi‐vessel disease | Review | Claudio A Bravo, Sameer A Hirji, Deepak L Bhatt, Rachna Kataria, David P Faxon, E Magnus Ohman, Kevin L Anderson, Akil I Sidi, Michael H Sketch Jr., Stuart W Zarich, Asishana A Osho, Christian Gluud, Henning Kelbæk, Thomas Engstrøm, Dan Eik Høfsten, James M Brennan | |
| 2015 Dec 17 | Early invasive versus conservative strategy for non‐infarct related artery lesions in ST elevation myocardial infarction with multi‐vessel disease | Protocol | Sameer A Hirji, Claudio A Bravo, Ronald E Pachon, David P Faxon, E Magnus Ohman, Kevin L Anderson, Akil I Sidi, Michael H Sketch, Stuart W Zarich, James M Brennan | |
Differences between protocol and review
We determined that a revision to the review title was needed based on alignment with current terminology, the protocol for this review was titled "Early invasive versus conservative strategy for non‐infarct related artery lesions in ST elevation myocardial infarction with multi‐vessel disease".
We have changed the order of the authors and added the following authors: Deepak L Bhatt, Asishana A Osho, Christian Gluud, Henning Kelbæk, Thomas Engstrøm, Dan Eik Høfsten); and removed Ronald E Pachon.
We did not apply any filters to the Conference Proceedings Index search because the relatively small retrieval set of the base search did not warrant applying a filter.
We did not search Current Controlled Trials MetaRegister (www.controlled‐trials.com/mrct/) as it is no longer active or available on the Internet.
We believe that the important outcome long‐term all‐cause mortality was omitted from the protocol and it was considered that this is a crucial outcome to judge the effectiveness of one intervention over the other. We judged this outcome as relevant or more relevant compared to cardiovascular mortality and adverse events, therefore we added this as another primary outcome. Moreover, all‐cause mortality is likely a less biased outcome. We have added all‐cause mortality as another outcome to be evaluate under the subgroup analysis section. All‐cause mortality is a crucial patient oriented outcome that is important to evaluate for potential subgroup differences.
In the protocol, we planned to include only participants who received revascularisation before discharge in the complete revascularisation group. In the review, we included participants who received revascularisation of the non‐culprit vessel (at least 50% obstruction but less than 100%) at the index procedure or at a second intervention including after discharge.
We removed in‐stent thrombosis and PCI‐related myocardial infarction measured at 30 days and one year after the intervention from the primary outcome adverse events because it overlapped with the outcome short‐ and long‐term myocardial infarction.
We considered the outcomes short‐term cardiovascular and all‐cause mortality, non‐fatal myocardial infarction, and revascularisation as those that occurred within the first 30 days after the index procedure.
We added the sensitivity analysis "Restricting the analysis to published trials that utilised mostly DES" because we thought it was reasonable to attribute heterogeneity or a certain effect size because of certain specific type of stent.
In addition to the cumulative meta‐analysis we conducted Trial Sequential Analysis of the ones that we judged to be the most relevant outcomes.
Notes
It was noted that at the time of submission of this meta‐analysis, the ACUTE COMPARE trial was published. In an updated version we will include that trial.
Keywords
MeSH
Medical Subject Headings (MeSH) Keywords
Medical Subject Headings Check Words
Female; Humans; Male;
PICO

Study flow diagram.

Risk of bias graph: review authors' judgements about each risk of bias item presented as percentages across all included studies.

Risk of bias summary: review authors' judgements about each risk of bias item for each included study.

Trial Sequential Analysis for complete versus culprit‐only revascularisation on long‐term all‐cause mortality. The diversity‐adjusted required information size (DARIS) was calculated based on an expected relative risk reduction (RRR) of 20% from proportion event in control (Pc) group of 6.3% with an alpha of 2% and beta of 10%.
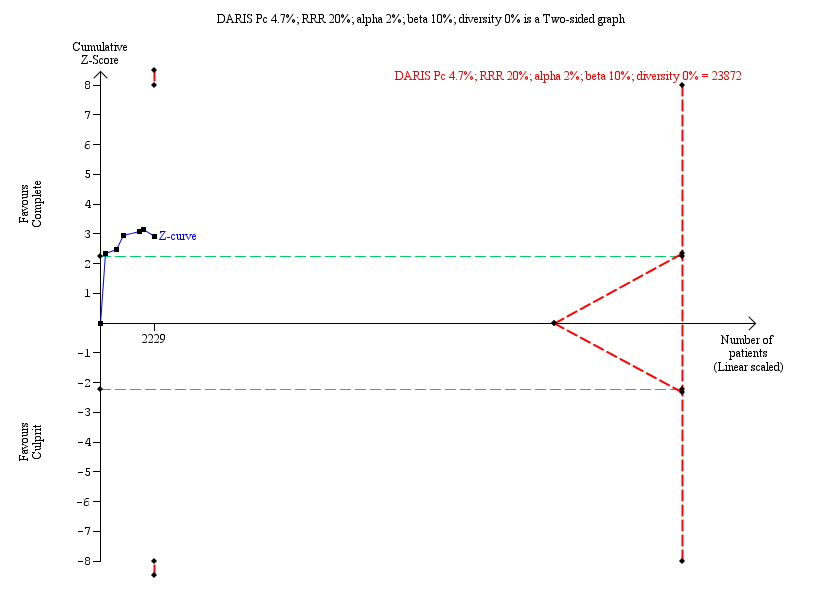
Trial Sequential Analysis for complete versus culprit‐only revascularisation on long‐term cardiovascular mortality. The diversity‐adjusted required information size (DARIS) was calculated based on an expected relative risk reduction (RRR) of 20% from Pc group of 4.7% with an alpha of 2% and beta of 10%.

Trial Sequential Analysis for complete versus culprit‐only revascularisation on long‐term non‐fatal myocardial infarction. The diversity‐adjusted required information size (DARIS) was calculated based on an expected relative risk reduction (RRR) of 20% from Pc group of 7.0% with an alpha of 2% and beta of 10%.
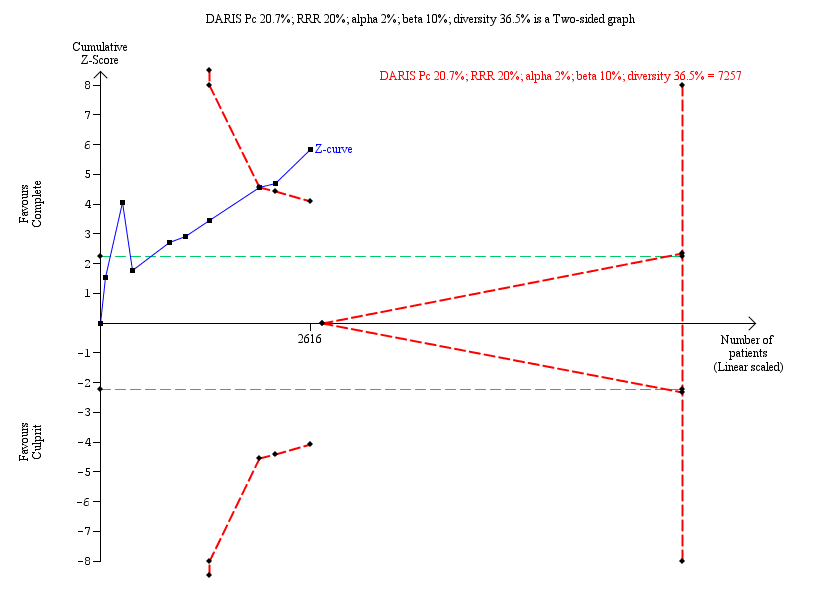
Trial Sequential Analysis for complete versus culprit‐only revascularisation on long‐term revascularisation. The diversity‐adjusted required information size (DARIS) was calculated based on an expected relative risk reduction (RRR) of 20% from Pc group of 20.7% with an alpha of 2% and beta of 10%.

Comparison 1 Primary outcomes, Outcome 1 Long‐term all‐cause mortality.
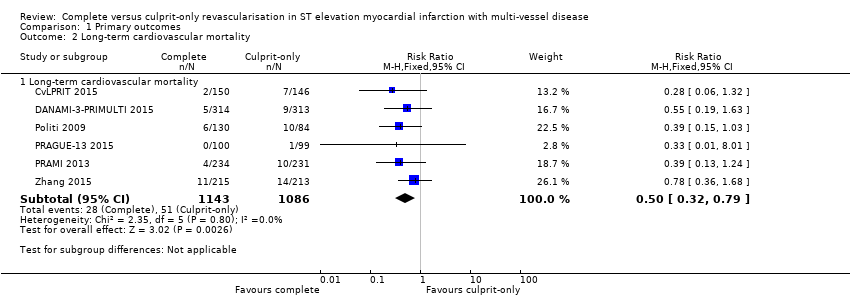
Comparison 1 Primary outcomes, Outcome 2 Long‐term cardiovascular mortality.

Comparison 1 Primary outcomes, Outcome 3 Long‐term non‐fatal myocardial infarction.
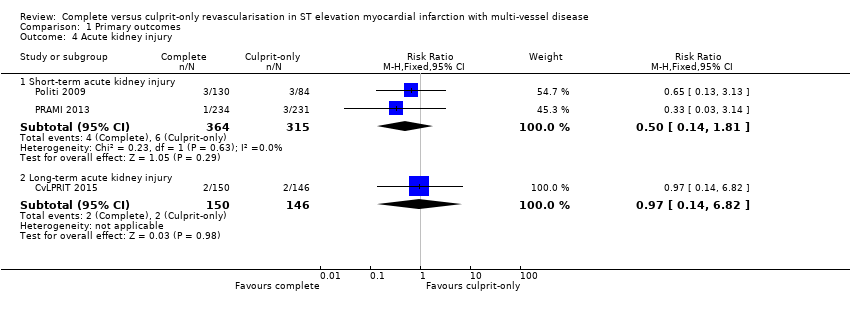
Comparison 1 Primary outcomes, Outcome 4 Acute kidney injury.
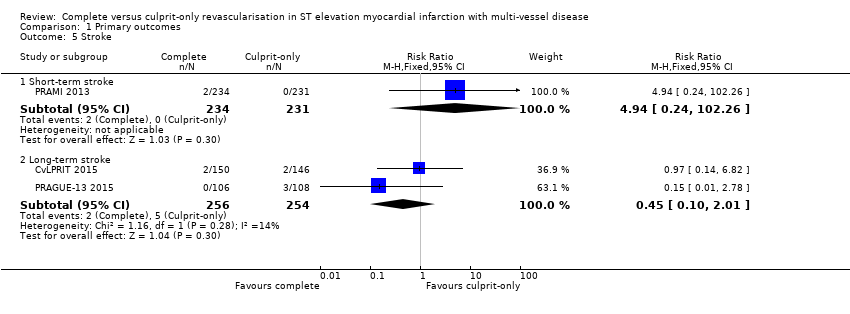
Comparison 1 Primary outcomes, Outcome 5 Stroke.

Comparison 1 Primary outcomes, Outcome 6 Bleeding.
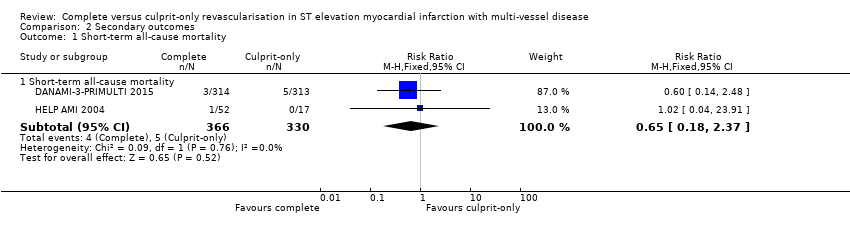
Comparison 2 Secondary outcomes, Outcome 1 Short‐term all‐cause mortality.
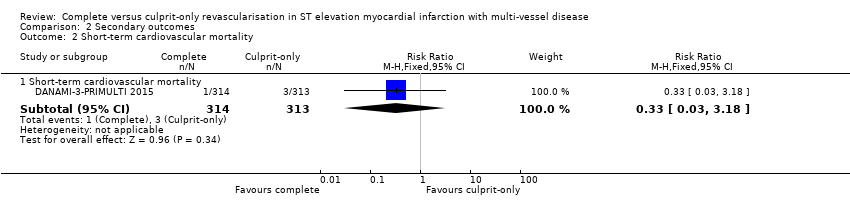
Comparison 2 Secondary outcomes, Outcome 2 Short‐term cardiovascular mortality.

Comparison 2 Secondary outcomes, Outcome 3 Short‐term non‐fatal myocardial infarction.
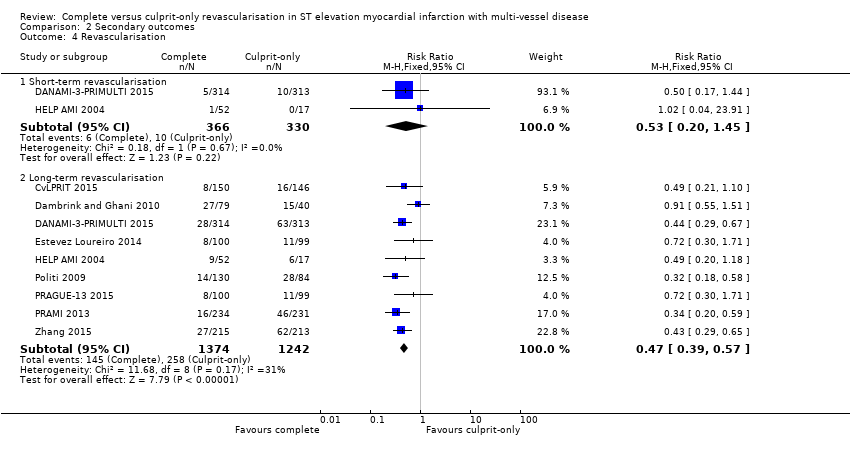
Comparison 2 Secondary outcomes, Outcome 4 Revascularisation.

Comparison 2 Secondary outcomes, Outcome 5 Cost ≥ 1 year.
| Complete revascularisation compared to culprit‐only revascularisation in ST elevated myocardial infarction with multi‐vessel disease | ||||||
| Patient or population: people with STEMI and MVD. | ||||||
| Outcomes | Anticipated absolute effects* (95% CI) | Relative effect | No of participants | Quality of the evidence | Comments | |
| Risk with culprit only | Risk with complete revascularisation | |||||
| Long‐term all‐cause mortality (≥ 1 year after the intervention) | Study population | RR 0.80 | 2417 | ⊕⊝⊝⊝ | PRAMI study terminated early. CvLPRIT and PRAMI concerning for attrition bias. Only CvLPRIT was judged to have low risk for selection bias. | |
| 63 per 1000 | 50 per 1000 | |||||
| Long‐term cardiovascular mortality (≥ 1 year after the intervention) | Study population | RR 0.50 | 2229 | ⊕⊝⊝⊝ | PRAMI study terminated early. CvLPRIT and PRAMI concerning for attrition bias. Only CvLPRIT was judged to have low risk for selection bias. | |
| 47 per 1000 | 23 per 1000 | |||||
| Long‐term myocardial infarction (≥ 1 year after the intervention) | Study population | RR 0.62 | 2099 | ⊕⊝⊝⊝ | PRAMI study terminated early. CvLPRIT and PRAMI concerning for attrition bias. Only CvLPRIT was judged to have low risk for selection bias. | |
| 70 per 1000 | 43 per 1000 | |||||
| Overall adverse events (pooled short and long term) | Study population | OR 0.84 | 4086 | ⊕⊝⊝⊝ | PRAMI study terminated early. CvLPRIT and PRAMI concerning for attrition bias. Only CvLPRIT was judged to have low risk for selection bias. Open label to the operator may affect this outcome. | |
| 29 per 1000 | 24 per 1000 | |||||
| Short‐term all‐cause mortality (within the first 30 days after the intervention) | Study population | RR 0.65 | 696 | ⊕⊝⊝⊝ | HELP‐AMI trial did not describe in detail their methodology to analyse for bias. | |
| 15 per 1000 | 10 per 1000 | |||||
| Long‐term revascularisation (≥ 1 year after the intervention) | Study population | RR 0.47 | 2616 | ⊕⊝⊝⊝ | PRAMI study terminated early. CvLPRIT and PRAMI concerning for attrition bias. Only CvLPRIT was judged to have low risk for selection bias. Open label to the operator may affect this outcome. | |
| 208 per 1000 | 98 per 1000 | |||||
| *The risk in the intervention group (and its 95% confidence interval) is based on the assumed risk in the comparison group and the relative effect of the intervention (and its 95% CI). CI: confidence interval; MVD: multi‐vessel disease; RCT: randomised controlled trial; RR: risk ratio; STEMI: ST elevated myocardial infarction. | ||||||
| GRADE Working Group grades of evidence | ||||||
| 1 Downgraded due to publication (reporting) bias. 2 Downgraded due to study limitations (largely risk of attrition bias and selection bias). 3 Downgraded because of indirectness: black and Hispanic people, as well as women were under‐represented. 4 Downgraded due to imprecision. | ||||||
| Study | Dates | Complete revascularisation (staged vs 1 time) | Intervention criteria in non‐culprit vessel | Mean follow‐up (years) | Description multi‐vessel disease | Country | Number of centres |
| May 2011 to May 2013 | At index procedure or before discharge. 65% of participants in invasive group had at index procedure. | > 70% diameter stenosis in 1 plane or > 50% in 2 planes. | 2.5 | Culprit vessel plus ≥ 1 non‐infarct‐related epicardial artery with ≥ 1 lesion deemed angiographically significant (> 70% stenosis in 1 plane or > 50% in 2 planes). | UK | 7 | |
| June 2004 to February 2007. | Staged 7.5 days after P‐PCI. | FFR < 0.75 and in stenosis > 90%, PCI was performed without FFR measurement. PCI was with BMS or DES. | 3 | ≥ 1 significant stenosis (> 50% stenosis in ≥ 1 view) in ≥ 2 major epicardial coronary arteries, or the combination of a side branch and a main epicardial vessel provided that they supplied different territories. | The Netherlands | 1 | |
| March 2011 to February 2014 | Staged 2 days after P‐PCI. | FFR < 0.8 and those > 90% stenotic arteries visually. | 2.2 | Significant stenosis (> 50% stenosis visually in arteries > 2 mm diameter) in ≥ 1 of the non‐culprit epicardial coronary arteries or their major side branches in addition to the infarct‐related artery. | Denmark | 2 | |
| 2010 to 2013 | Staged. | Complete. Criteria not described in study. | 1 | NR. | Spain | NR | |
| NR | Index procedure. | Not described. | 1 | NR. | Not described | NR | |
| January 2003 to December 2007 | At index procedure or staged mean 56 days after P‐PCI. 50% participants of complete revascularisation had at intervention of the non‐culprit lesions at index procedure. | > 70% diameter stenosis. | 2.5 | > 70% diameter stenosis of ≥ 2 epicardial coronary arteries or their major branches by visual estimation. | Not described | NR | |
| September 2008 to December 2014 | Staged between 3 and 40 days after P‐PCI. | > 70% stenosis of non‐culprit coronary artery. | 3 | ≥ 1 vessel, beside the culprit vessel, with significant stenosis (> 70% stenosis). | Czech Republic | 6 | |
| April 2008 to January 2013 | At index procedure. | Stenosis ≥ 50%. | 2 | The presence of stenosis ≥ 50% in ≥ 1 coronary artery other than the culprit vessel. | UK | 5 | |
| January 2009 to June 2012 | Staged between 7 and 10 days after P‐PCI. | 75% to 90%. | 2 | Non‐culprit vessel with significant stenosis (75% to 90% stenosis). | China | NR | |
| BMS: bare‐metal stent; DES: drug‐eluting stent; FFR: fractional flow reserve; NR: not reported in the article; PCI: percutaneous coronary intervention; P‐PCI: primary percutaneous coronary intervention. | |||||||
| Study | Group | Sample size (n) | Participants (n (%)) | Dropouts (n (%)) | % Male | Mean age (years) | % HTN | % DM | % HLD | % Prior MI | % Anterior STEMI |
| Complete | 150 | 139 (92.7) | 11 (7.3) | 85.3 | 64.6 | 36 | 12.7 | 27.3 | 4.7 | 36 | |
| Culprit‐only | 146 | 139 (95.2) | 8 (5.5) | 76.7 | 65.3 | 35 | 13.7 | 23.3 | 3.4 | 35.6 | |
| Complete | 80 | 71 (88.8) | 1 (1.3) | 80 | 62 | 26.3 | 6.3 | 15 | 6.3 | 21.3 | |
| Culprit‐only | 41 | 41 (100) | 1 (2.4) | 80.5 | 61 | 42.5 | 5 | 30 | 4.9 | 23.3 | |
| Complete | 314 | 294 (93.6) | 1 (0.3) | 80 | 64 | 41.4 | 9.2 | NR | 5.4 | 33.4 | |
| Culprit‐only | 313 | 313 (100) | 0 | 81.5 | 63 | 46.6 | 13.4 | NR | 8.6 | 35.8 | |
| Complete | 100 | NR | NR | NR | NR | NR | NR | NR | NR | NR | |
| Culprit‐only | 99 | NR | NR | NR | NR | NR | NR | NR | NR | NR | |
| Complete | 52 | NR | NR | 88.5 | 63.5 | 36.5 | 11.5 | 41.2 | NR | 52 | |
| Culprit‐only | 17 | NR | NR | 82.4 | 65.3 | 58.8 | 41.2 | 53 | NR | 59 | |
| Complete | 130 | NR | NR | 78.5 | 64 | 57 | 16.2 | NR | NR | 45.4 | |
| Culprit‐only | 84 | NR | NR | 76.2 | 66.5 | 60 | 23.8 | NR | NR | 41.7 | |
| Complete | 106 | NR | NR | NR | NR | NR | NR | NR | NR | NR | |
| Culprit‐only | 108 | NR | NR | NR | NR | NR | NR | NR | NR | NR | |
| Complete | 234 | 223 (95.3) | 10 (4.3) | 75.6 | 62 | 40.2 | 15 | NR | 8.1 | 28.6 | |
| Culprit‐only | 231 | 229 (99) | 8 (3.5) | 80.5 | 62 | 40.3 | 20.8 | NR | 7 | 38.5 | |
| Complete | 215 | NR | NR | 61 | 62.3 | 64.2 | 36.7 | 35.3 | NR | 36.7 | |
| Culprit‐only | 213 | NR | NR | 67.1 | 62 | 61 | 35.2 | 36.6 | NR | 40 | |
| DM: diabetes mellitus; HLD: hyperlipidaemia; HTN: hypertension; MI: myocardial infarction; n: number of participants; NR: not reported in the article; STEMI: ST elevated myocardial infarction. | |||||||||||
| Study | Group | Symptoms to PCI time (minute) | PCI without stenting (n (%)) | DES (n (%)) | BMS (n (%)) | 2‐Vessel disease (n (%)) | 3‐Vessel disease (n (%)) | Received PCI non‐culprit (n (%)) | DAPT | DAPT duration |
| Complete | 182 | NR | 141 (94) | NR | 119 (79.3) | 31 (20.7) | 139 (92.7) | Yes | NR | |
| Culprit‐only | 159 | NR | 127 (87) | NR | 110 (75.3) | 36 (24.7) | 0 | |||
| Complete | NR | 6 (7.5) | 18 (22.5) | 56 (70) | 60 (75) | 20 (25) | 48 (60) | Yes | 1 month | |
| Culprit‐only | NR | 7 (17.1) | 7 (7.1) | 27 (66) | 33 (80.5) | 8 (19.5) | 0 | |||
| Complete | NR | 12 (3.8) | 298 (95) | 0 | NR | 97 (31) | 193 (61.5) | Yes | 1 year | |
| Culprit‐only | NR | 18 (5.8) | 290 (92.7) | 0 | NR | 100 (32) | 0 | |||
| Complete | NR | NR | NR | NR | NR | NR | NR | NR | NR | |
| Culprit‐only | NR | NR | NR | NR | NR | NR | NR | |||
| Complete | 210 | 0 | 52 (100) | 0 | 36 (69) | 16 (30.8) | NR | Yes | 1 month | |
| Culprit‐only | 236 | 0 | 17 (100) | 0 | 9 (53) | 8 (47) | NR | |||
| Complete | NR | NR | 11 (8.5) | NR | NR | 48 (37) | NR | NR | NR | |
| Culprit‐only | NR | NR | 10 (12) | NR | NR | 21 (25) | NR | |||
| Complete | NR | NR | NR | NR | NR | NR | NR | NR | NR | |
| Culprit‐only | NR | NR | NR | NR | NR | NR | NR | |||
| Complete | NR | 1 (< 1) | 147 (63) | 86 (37) | 143 (61.1) | 91 (39) | 223 (95.3) | Yes | 1 month | |
| Culprit‐only | NR | 0 | 135 (58) | 96 (42) | 155 (67.1) | 76 (33) | 2 (1) | |||
| Complete | 214 | 0 | 215 (100) | 0 | NR | NR | NR | NR | NR | |
| Culprit‐only | 227 | 0 | 213 (100) | 0 | NR | NR | NR | |||
| BMS: bare‐metal stent; DAPT: dual antiplatelet therapy; DES: drug‐eluting stent; n: number of participants; NR: not reported in the article; PCI: percutaneous coronary intervention. | ||||||||||
| Outcome or subgroup title | No. of studies | No. of participants | Statistical method | Effect size |
| 1 Long‐term all‐cause mortality Show forest plot | 8 | Risk Ratio (M‐H, Fixed, 95% CI) | Subtotals only | |
| 1.1 Long‐term all‐cause mortality | 8 | 2417 | Risk Ratio (M‐H, Fixed, 95% CI) | 0.80 [0.58, 1.11] |
| 2 Long‐term cardiovascular mortality Show forest plot | 6 | Risk Ratio (M‐H, Fixed, 95% CI) | Subtotals only | |
| 2.1 Long‐term cardiovascular mortality | 6 | 2229 | Risk Ratio (M‐H, Fixed, 95% CI) | 0.50 [0.32, 0.79] |
| 3 Long‐term non‐fatal myocardial infarction Show forest plot | 6 | Risk Ratio (M‐H, Fixed, 95% CI) | Subtotals only | |
| 3.1 Long‐term non‐fatal myocardial infarction | 6 | 2099 | Risk Ratio (M‐H, Fixed, 95% CI) | 0.62 [0.44, 0.89] |
| 4 Acute kidney injury Show forest plot | 3 | Risk Ratio (M‐H, Fixed, 95% CI) | Subtotals only | |
| 4.1 Short‐term acute kidney injury | 2 | 679 | Risk Ratio (M‐H, Fixed, 95% CI) | 0.50 [0.14, 1.81] |
| 4.2 Long‐term acute kidney injury | 1 | 296 | Risk Ratio (M‐H, Fixed, 95% CI) | 0.97 [0.14, 6.82] |
| 5 Stroke Show forest plot | 3 | Risk Ratio (M‐H, Fixed, 95% CI) | Subtotals only | |
| 5.1 Short‐term stroke | 1 | 465 | Risk Ratio (M‐H, Fixed, 95% CI) | 4.94 [0.24, 102.26] |
| 5.2 Long‐term stroke | 2 | 510 | Risk Ratio (M‐H, Fixed, 95% CI) | 0.45 [0.10, 2.01] |
| 6 Bleeding Show forest plot | 4 | Risk Ratio (M‐H, Fixed, 95% CI) | Subtotals only | |
| 6.1 Short‐term bleeding | 3 | 1213 | Risk Ratio (M‐H, Fixed, 95% CI) | 1.00 [0.53, 1.86] |
| 6.2 Long‐term bleeding | 2 | 923 | Risk Ratio (M‐H, Fixed, 95% CI) | 0.79 [0.45, 1.41] |
| Outcome or subgroup title | No. of studies | No. of participants | Statistical method | Effect size |
| 1 Short‐term all‐cause mortality Show forest plot | 2 | Risk Ratio (M‐H, Fixed, 95% CI) | Subtotals only | |
| 1.1 Short‐term all‐cause mortality | 2 | 696 | Risk Ratio (M‐H, Fixed, 95% CI) | 0.65 [0.18, 2.37] |
| 2 Short‐term cardiovascular mortality Show forest plot | 1 | Risk Ratio (M‐H, Fixed, 95% CI) | Subtotals only | |
| 2.1 Short‐term cardiovascular mortality | 1 | 627 | Risk Ratio (M‐H, Fixed, 95% CI) | 0.33 [0.03, 3.18] |
| 3 Short‐term non‐fatal myocardial infarction Show forest plot | 1 | Risk Ratio (M‐H, Fixed, 95% CI) | Subtotals only | |
| 3.1 Short‐term non‐fatal myocardial infarction | 1 | 627 | Risk Ratio (M‐H, Fixed, 95% CI) | 1.74 [0.52, 5.90] |
| 4 Revascularisation Show forest plot | 9 | Risk Ratio (M‐H, Fixed, 95% CI) | Subtotals only | |
| 4.1 Short‐term revascularisation | 2 | 696 | Risk Ratio (M‐H, Fixed, 95% CI) | 0.53 [0.20, 1.45] |
| 4.2 Long‐term revascularisation | 9 | 2616 | Risk Ratio (M‐H, Fixed, 95% CI) | 0.47 [0.39, 0.57] |
| 5 Cost ≥ 1 year Show forest plot | 1 | 69 | Mean Difference (IV, Fixed, 95% CI) | ‐1948.0 [‐9171.85, 5275.85] |