رواسکولاریزاسیون کامل در برابر رواسکولاریزاسیون رگ درگیر به تنهایی در انفارکتوس میوکارد همراه با بالا رفتن قطعه ST در موارد درگیری چند عروق با هم
چکیده
پیشینه
بیماری درگیری چند رگ قلبی با هم در افراد مبتلا به انفارکتوس میوکارد همراه با بالا رفتن قطعه ST؛ (ST elevation myocardial infarction; STEMI) شایع است و با پیشآگهی بدتری پس از STEMI همراه است. بر اساس شواهد محدود، دستورالعملهای بینالمللی مداخله را فقط در رگ درگیر حین STEMI توصیه میکنند. این روش، به نوبه خود، شریانهای عروق کرونری دیگر را که بهطور قابل توجهی تنگ شده، برای درمان پزشکی یا رواسکولاریزاسیون بر اساس ایسکمیک قابل القا در تست تحریکی، رها میکند و بدون درمان باقی میگذارد. دادههای جدیدتر نشان میدهند که مداخله در شریانهای عروق کرونری تنگ شده درگیر (culprit) و غیر‐درگیر (مداخله کامل) ممکن است نتایج بهتری را در مقایسه با مداخلات برای رگ درگیر به تنهایی به ارمغان بیاورد.
اهداف
ارزیابی تاثیرات رواسکولاریزاسیون کامل زودهنگام در برابر استراتژی مداخله فقط در رگ درگیر در افراد مبتلا به STEMI و درگیری چند رگ قلبی با هم.
روشهای جستوجو
پایگاه ثبت مرکزی کارآزماییهای کنترل شده کاکرین؛ MEDLINE؛ Embase؛ پورتال جستوجوی پلتفرم بینالمللی پایگاه ثبت کارآزماییهای بالینی سازمان جهانی بهداشت و ClinicalTrials.gov را جستوجو کردیم. تاریخ آخرین جستوجو 4 ژانویه 2017 بود. هیچ گونه محدودیت زبانی اعمال نکردیم. مجموعه مقالات کنفرانس را تا دسامبر 2016 به صورت دستی جستوجو کردیم و با نویسندگان و شرکتهای مرتبط در این زمینه تماس گرفتیم.
معیارهای انتخاب
فقط کارآزماییهای تصادفیسازی و کنترل شده (randomised controlled trials; RCTs) را وارد کردیم، که در آنها استراتژی رواسکولاریزاسیون کامل با مداخله کرونری از راه پوست (percutaneous coronary intervention; PCI) فقط در رگ درگیر برای درمان افراد مبتلا به STEMI و درگیری چند رگ قلبی با هم مقایسه شدند.
گردآوری و تجزیهوتحلیل دادهها
کیفیت روششناسی هر کارآزمایی را با استفاده از ابزار «خطر سوگیری» (bias) کاکرین ارزیابی کردیم. اختلافات را با بحث میان نویسندگان مرور حل کردیم. از روشهای استاندارد روششناسی توصیه شده توسط کاکرین استفاده کردیم. پیامدهای اولیه عبارت بود از مورتالیتی به هر علتی در طولانیمدت (یک سال یا بیشتر پس از مداخله شاخص)، مرگومیر قلبیعروقی طولانیمدت، انفارکتوس میوکارد غیر‐کشنده در طولانیمدت و حوادث جانبی. پیامدهای ثانویه عبارت بود از مورتالیتی به هر علتی در کوتاه‐مدت (درون 30 روز اول پس از مداخله شاخص)، مرگومیر قلبیعروقی در کوتاه‐مدت، انفارکتوس میوکارد غیر‐کشنده در کوتاه‐مدت، رواسکولاریزاسیون، کیفیت زندگی مرتبط با سلامت و هزینه. دادهها را با استفاده از مدلهای اثر‐ثابت مورد تجزیهوتحلیل قرار دادیم، و نتایج را به صورت خطرات نسبی (RR) با 95% فواصل اطمینان (CI) بیان کردیم. از معیارهای سیستم درجهبندی توصیه، ارزیابی، توسعه و ارزشیابی (GRADE) برای ارزیابی کیفیت شواهد استفاده کردیم و برای کنترل خطرات خطاهای تصادفی، تجزیهوتحلیل مرحلهای کارآزمایی (trial sequential analysis; TSA) را انجام دادیم.
نتایج اصلی
نه RCT را وارد کردیم که شامل 2633 فرد مبتلا به STEMI و درگیری چند رگ با هم بود که بهطور تصادفی به استراتژی رواسکولاریزاسیون کامل (1381 = n) در برابر رواسکولاریزاسیون رگ درگیر بهتنهایی (1252 = n) اختصاص داده شدند. استراتژی رواسکولاریزاسیون کامل و رگ درگیر به تنهایی تفاوتی در مورتالیتی به هر علتی در طولانیمدت (65/1274 (5.1%)) در گروه کامل در برابر 72/1143 (6.3%) در گروه رگ درگیر به تنهایی ایجاد نکرد (RR: 0.80؛ 95% CI؛ 0.58 تا 1.11؛ 2417 شرکتکننده؛ 8 مطالعه؛ I2 = 0%؛ شواهد با کیفیت بسیار پائین). در مقایسه با مداخله برای رگ درگیر به تنهایی، استراتژی رواسکولاریزاسیون کامل با نسبت پائین مرگومیر طولانیمدت قلبیعروقی (28/1143 (2.4%) در گروه کامل در برابر 51/1086 (4.7%) در گروه رگ درگیر به تنهایی؛ RR: 0.50؛ 95% CI؛ 0.32 تا 0.79؛ 2229 شرکتکننده؛ 6 مطالعه؛ I2 = 0%؛ شواهد با کیفیت بسیار پائین) و انفارکتوس میوکارد غیر‐کشنده طولانیمدت (47/1095 (4.3%) در گروه کامل در برابر 70/1004 (7.0%) در گروه رگ درگیر به تنهایی همراه بود؛ RR: 0.62؛ 95% CI؛ 0.44 تا 0.89؛ 2099 شرکتکننده؛ 6 مطالعه؛ I2 = 0%؛ شواهد با کیفیت بسیار پائین). استراتژیهای رواسکولاریزاسیون کامل و رگ درگیر به تنهایی از نظر حوادث جانبی ترکیبی (51/2096) (2.4%) در گروه کامل در برابر 57/1990 (2.9%) در گروه رگ درگیر به تنهایی تفاوتی نداشت؛ RR: 0.84؛ 95% CI؛ 0.58 تا 1.21؛ 4086 شرکتکننده؛ I2 = 0%؛ شواهد با کیفیت بسیار پائین). رواسکولاریزاسیون کامل با نسبت پائین رواسکولاریزاسیون طولانیمدت (145/1374 (10.6%) در گروه کامل در برابر 258/1242 (20.8%) در گروه رگ درگیر به تنهایی همراه بود؛ RR: 0.47؛ 95% CI؛ 0.39 تا 0.57؛ 2616 شرکتکننده؛ 9 مطالعه؛ I2 = 31%؛ شواهد با کیفیت بسیار پائین). TSA برای مورتالیتی به هر علتی در طولانیمدت، مورتالیتی قلبیعروقی در طولانیمدت و انفارکتوس میوکارد غیر‐کشنده طولانیمدت نشان داد که برای دستیابی به نتایج قابل اطمینان بیشتر در مورد این پیامدها، RCTهای بیشتری مورد نیاز هستند. با توجه به رواسکولاریزاسیون بهصورت مکرر در طولانیمدت، RCTهای بیشتر ممکن است نتیجه فعلی ما را تغییر ندهند. کیفیت شواهد برای تمام پیامدهای اولیه و اکثر پیامدهای ثانویه عمدتا به علت خطر سوگیری، عدم دقت و غیر‐مستقیم بودن، بسیار پائین قضاوت شد.
نتیجهگیریهای نویسندگان
در مقایسه با مداخله در رگ درگیر به تنهایی، استراتژی رواسکولاریزاسیون کامل ممکن است به دلیل نسبتهای پائینتر مرگومیر قلبیعروقی در طولانیمدت، رواسکولاریزاسیون در طولانیمدت و انفارکتوس میوکارد غیر‐کشنده در طولانیمدت بهتر باشد اما این یافتهها بر اساس شواهد با کیفیت بسیار پائین هستند. TSA همچنین از نیاز به RCTهای بیشتر برای نتیجهگیریهای قویتر در مورد تاثیرات رواسکولاریزاسیون بر مورتالیتی به هر علتی در طولانیمدت، مرگومیر قلبیعروقی در طولانیمدت و انفارکتوس میوکارد غیر‐کشنده در طولانیمدت حمایت میکند.
PICO
خلاصه به زبان ساده
رواسکولاریزاسیون کامل در برابر رواسکولاریزاسیون رگ درگیر (culprit) به تنهایی در حمله قلبی همراه با بالا رفتن قطعه ST در موارد درگیری چند رگ با هم
سوال مطالعه مروری
در افراد مبتلا به تنگ شدن عروق کرونر متعدد (رگهای خونی که قلب را پوشانده و خون را به قلب میرسانند)، همراه با یک رگ کاملا بسته شده (مسدود شده) که موجب حمله قلبی میشود، بهتر است که تمام رگها باز شود یا تنها رگی که باعث حمله قلبی شده باز شود.
پیشینه
تنگ شدن قابل توجه همزمان چندین رگ کرونری (به نام درگیری چندین رگ با هم) با یک رگ کرونر کاملا مسدود شده که منجر به حمله قلبی میشود، معمولا میان افراد مبتلا به حمله قلبی دیده میشود. درمان فعلی این شریانهای عروق کرونر تنگ شده یا کاملا مسدود شده شامل یک پروسیجر داخل عروقی (درون رگ خون) است که مداخله کرونری از طریق پوست نامیده میشود، که در آن از یک بالون استفاده میشود و در محل انسداد قرار داده و متورم میشود در نتیجه شریان باز شده و جریان خون طبیعی باز میگردد. این کار معمولا پس از قرار دادن یک استنت (لوله مشبک کوچک) به منظور پیشگیری از بسته شدن مجدد شریانهایی که قبلا تنگ شده بودند، انجام میگیرد. علاوه بر شریان مسدود شده، ممکن است شریانهای کرونری تنگ شده دیگری نیز وجود داشته باشد اما چندین انجمن علمی قلب فقط مداخله در رگ(هایی) را توصیه میکنند که منجر به حمله قلبی میشوند در نتیجه شریانهای تنگ شده به صورت درمان نشده باقی میمانند، مگر اینکه فرد همچنان این نشانهها را داشته باشد.
ویژگیهای مطالعه
کارآزماییهای بالینی را در مورد بزرگسالانی جستوجو کردیم که مداخله کرونری را از طریق پوست برای مدیریت حمله قلبی و درگیری چند رگ با هم انجام دادند. شواهد تا 4 ژانویه 2017 بهروز است. فقط چهار کارآزمایی دریافت کمک مالی را از سازمانهای دولتی یا نهادهای خیریه گزارش کردند. کارآزماییهای دیگر منابع مالی را ذکر نکردند و هیچ یک از شرکتهای خصوصی به عنوان منابع مالی ذکر نشدند. در کارآزماییهای وارد شده، هم شرکتکنندگان و هم محققان از درمانی که شرکتکنندگان دریافت کردند، اطلاع داشتند که این امر ممکن است منجر به سوگیری (bias) در نتایج شود. یک کارآزمایی ثبتنام شده زودتر از زمان برنامهریزی شده به پایان رسید، زیرا تفاوت بین دو گروه درمان قابل توجه بود. این امر ممکن است باعث شود تا تفاوت بین گروههای مداخله بیش از حد ارزیابی شود. برای اکثر کارآزماییها، تعداد شرکتکنندگانی که برای مشاهده تفاوت بالقوه بین درمانها وارد شدند، کافی نبود.
نتایج کلیدی
نه کارآزمایی بالینی را با 2633 فرد مبتلا به حمله قلبی و درگیری چندین رگ با هم وارد کردیم. در مقایسه با شرکتکنندگانی که تحت باز کردن فقط یک رگ کرونری که باعث حمله قلبی شده بود، قرار گرفتند، افراد تحت درمان تمام عروق تنگ شده، مرگومیر ناشی از بیماریهای قلبی و تامین خون (بیماری قلبیعروقی نامیده میشود) کمتری داشتند، نیاز به درمانهای کمتری برای باز کردن شریانهای عروق کرونری مشکلدار داشتند و در پایان یک سال یا بیشتر پس از درمان، حملات قلبی کمتری داشتند. بر اساس تجزیهوتحلیلهای ما، اگر چه به نظر میرسد درمان در تمام رگهای تنگ شده استراتژی درمانی بهتری باشد، برای تایید اینکه این رویکرد با مرگومیر ناشی از بیماریهای قلبیعروقی یا حمله قلبی کمتر یا هر دو همراه است یا خیر، هنوز هم نیاز به کارآزماییهای بالینی به خوبی طراحی شده وجود دارد.
کیفیت شواهد
کیفیت شواهد بسیار پائین است. به عنوان مثال، تعداد شرکتکنندگان در مطالعات وارد شده کافی نبود، تیم پزشکی از گروهی که شرکتکنندگان به آن اختصاص داده شده بودند و اینکه ممکن بود نتیجهگیریهای ما را تحت تاثیر قرار دهد، آگاه بودند. کارآزماییهای بالینی خوب طراحی شده با تعداد زیاد شرکتکنندگان برای تعیین اینکه کدام استراتژی درمان برتر است، مورد نیاز است.
Authors' conclusions
Summary of findings
| Complete revascularisation compared to culprit‐only revascularisation in ST elevated myocardial infarction with multi‐vessel disease | ||||||
| Patient or population: people with STEMI and MVD. | ||||||
| Outcomes | Anticipated absolute effects* (95% CI) | Relative effect | No of participants | Quality of the evidence | Comments | |
| Risk with culprit only | Risk with complete revascularisation | |||||
| Long‐term all‐cause mortality (≥ 1 year after the intervention) | Study population | RR 0.80 | 2417 | ⊕⊝⊝⊝ | PRAMI study terminated early. CvLPRIT and PRAMI concerning for attrition bias. Only CvLPRIT was judged to have low risk for selection bias. | |
| 63 per 1000 | 50 per 1000 | |||||
| Long‐term cardiovascular mortality (≥ 1 year after the intervention) | Study population | RR 0.50 | 2229 | ⊕⊝⊝⊝ | PRAMI study terminated early. CvLPRIT and PRAMI concerning for attrition bias. Only CvLPRIT was judged to have low risk for selection bias. | |
| 47 per 1000 | 23 per 1000 | |||||
| Long‐term myocardial infarction (≥ 1 year after the intervention) | Study population | RR 0.62 | 2099 | ⊕⊝⊝⊝ | PRAMI study terminated early. CvLPRIT and PRAMI concerning for attrition bias. Only CvLPRIT was judged to have low risk for selection bias. | |
| 70 per 1000 | 43 per 1000 | |||||
| Overall adverse events (pooled short and long term) | Study population | OR 0.84 | 4086 | ⊕⊝⊝⊝ | PRAMI study terminated early. CvLPRIT and PRAMI concerning for attrition bias. Only CvLPRIT was judged to have low risk for selection bias. Open label to the operator may affect this outcome. | |
| 29 per 1000 | 24 per 1000 | |||||
| Short‐term all‐cause mortality (within the first 30 days after the intervention) | Study population | RR 0.65 | 696 | ⊕⊝⊝⊝ | HELP‐AMI trial did not describe in detail their methodology to analyse for bias. | |
| 15 per 1000 | 10 per 1000 | |||||
| Long‐term revascularisation (≥ 1 year after the intervention) | Study population | RR 0.47 | 2616 | ⊕⊝⊝⊝ | PRAMI study terminated early. CvLPRIT and PRAMI concerning for attrition bias. Only CvLPRIT was judged to have low risk for selection bias. Open label to the operator may affect this outcome. | |
| 208 per 1000 | 98 per 1000 | |||||
| *The risk in the intervention group (and its 95% confidence interval) is based on the assumed risk in the comparison group and the relative effect of the intervention (and its 95% CI). CI: confidence interval; MVD: multi‐vessel disease; RCT: randomised controlled trial; RR: risk ratio; STEMI: ST elevated myocardial infarction. | ||||||
| GRADE Working Group grades of evidence | ||||||
| 1 Downgraded due to publication (reporting) bias. 2 Downgraded due to study limitations (largely risk of attrition bias and selection bias). 3 Downgraded because of indirectness: black and Hispanic people, as well as women were under‐represented. 4 Downgraded due to imprecision. | ||||||
Background
Description of the condition
The World Health Organization (WHO) reported that in 2012 there were 17.5 million global deaths due to cardiovascular diseases, accounting for 31% of all deaths (WHO 2014); furthermore, they estimated about 20 million cardiovascular associated deaths in 2015 (WHO 2005). In contemporary practice, among the people who present to the hospital with ST elevation myocardial infarction (STEMI), between 40% and 65% have concurrent multi‐vessel disease (MVD) or a combination of a completely occluded coronary artery and significant but incomplete stenosis of other coronary vessels (Dziewierz 2010; Jo 2011; Park 2014; Sorajja 2007). As the burden of cardiovascular diseases affects hospital systems worldwide, there is growing interest among healthcare providers to examine and improve the various treatment strategies involved in the management of STEMI in people with co‐existing MVD.
Several studies have shown that the co‐existence of culprit and non‐culprit coronary artery stenotic lesions leads to worse outcomes. For instance, people with STEMI and MVD have higher one‐year rates of the composite outcome of death, recurrent myocardial infarction, and need for revascularisation compared with people with single‐vessel disease (Corpus 2004; Halkin 2005; Jaski 1992; Muller 1991; Sorajja 2007). The American College of Cardiology (ACC)/American Heart Association (AHA) (ACCF/AHA 2013) and by the European Society of Cardiology (ESC) (ESC 2012) discouraged the early intervention of the non‐culprit; however, these recommendations were based on limited evidence. At that time, standard of care for people presenting with STEMI and MVD was to undergo sole intervention on the culprit lesion followed by intervention on other significant coronary artery stenoses involving non‐culprit arteries, in a staged fashion; or a multi‐vessel intervention in cases of cardiogenic shock or persistent ischaemia after primary percutaneous coronary intervention (P‐PCI). However, more recent randomised controlled trials (RCT) have demonstrated that simultaneous intervention on both culprit and non‐culprit lesions can be safely performed and that it may improve patient outcomes (CvLPRIT 2015; DANAMI‐3‐PRIMULTI 2015; PRAGUE‐13 2015; PRAMI 2013). This evidence subsequently resulted in an upgrade in the ACC/AHA and ESC/European Association for Cardio‐Thoracic Surgery (EACTS) recommendations on the intervention of non‐infarct‐related arteries (IRA) stenotic lesions from possibly intervention that can produce harm or no benefit (class III recommendation) to an intervention that may be considered in selected people with MVD (class IIb recommendation level of evidence B) per ACC/AHA/Society for Cardiovascular Angiography and Interventions (SCAI) 2015 guidelines (ACC/AHA/SCAI 2015), class IIa for staged intervention or IIb for simultaneous multi‐vessel percutaneous coronary intervention (PCI) at the index procedure with a level of evidence B per ESC 2014 guidelines (ESC 2014).
Description of the intervention
The current standard of care for treatment of people with STEMI is P‐PCI on the completely occluded artery within 90 minutes from first medical contact (ACCF/AHA 2013; ESC 2012; ESC 2014; NICE 2013). Upon presentation to the hospital, a person with STEMI is taken to the catheterisation laboratory where angiography of the coronary arteries is performed in an attempt to identify the culprit lesion, that is, the narrowed atherosclerotic lesion of the coronary vessel responsible for the ischaemic changes seen on the electrocardiogram. The culprit lesion is treated with P‐PCI comprising of balloon angioplasty followed by the insertion of a stent.
In addition to the culprit vessel, it is possible for a person to have other significantly stenosed coronary arteries. These non‐culprit stenoses may not be responsible for the person's STEMI on presentation, but may eventually lead to acute or chronic ischaemic heart disease (Corpus 2004; Halkin 2005; Jaski 1992; Sorajja 2007). In people with non‐culprit artery disease amenable to PCI, three different treatment strategies can be adopted: 1. P‐PCI on the culprit artery along with medical management, with revascularisation of the non‐culprit lesions only in the setting of recurrent symptoms, infarction, or significant inducible ischaemia on provocative testing; 2. complete revascularisation including the culprit and non‐culprit arteries during the same procedure; and 3. staged intervention on the non‐culprit arteries later during the same hospitalisation or shortly after discharge.
How the intervention might work
STEMI is a consequence of a sudden complete occlusion of a coronary artery, leading to infarction or myocardial cell death. P‐PCI is currently the preferred treatment option for a completely occluded coronary artery in the setting of STEMI. This procedure restores the blood supply to a previously ischaemic region, thereby reducing cell death and preserving as much viable myocardium as possible. An early invasive approach for the partially occluded non‐culprit lesion(s), in the setting of MVD, might help in simultaneously restoring and improving blood supply to the remaining myocardium that is at potential risk for future ischaemic events.
There is cumulative evidence that STEMI is a pro‐inflammatory process that might play a role in the instability of the atherosclerotic plaques and subsequent higher risk of cardiac events surrounding the STEMI (Arroyo‐Espliguero 2004; Kubo 2010). Therefore, complete revascularisation could potentially prevent subsequent cardiac events by treating any unstable inflamed atherosclerotic plaques and thus preventing complete obstruction (subsequent STEMI), transient obstruction/embolisation (non‐STEMI), or progression over time to ischaemia and symptoms of angina (unstable angina or refractory angina). Intervention on the non‐culprit lesions might impose a higher risk of vascular complications including periprocedural infarction, renal impairment due to the contrast load, and additional risk of bleeding when performed as a staged procedure. In addition, PCI with stent implantation always carries the risk of later stent thrombosis.
Why it is important to do this review
A timely P‐PCI with revascularisation of the culprit vessel remains the mainstay of treatment for people presenting with STEMI across different continents. However, management of significantly stenotic lesions of the non‐culprit vessel has been an area of constant debate and the recommendations differ among the various published guidelines worldwide. In the US, for instance, the 2013 ACC/AHA guidelines discouraged routine simultaneous P‐PCI of non‐culprit lesions with the culprit vessel in haemodynamically stable people because of concerns of worse outcomes (class III (harm)/level of evidence B) (ACCF/AHA 2013), and ESC encouraged intervention of the culprit vessel only (ESC 2012). With those guidelines, simultaneous intervention of culprit and non‐culprit vessels was recommended only in certain contexts such as in cardiogenic shock or when there was persistence of symptoms of cardiac ischaemia despite intervention on the culprit lesion (class I/level of evidence C ACCF/AHA 2013) (class IIa/level of evidence B ESC 2012). Based on more recent evidence provided by RCTs suggesting better outcomes with complete revascularisation in people with STEMI and MVD (CvLPRIT 2015; DANAMI‐3‐PRIMULTI 2015; PRAGUE‐13 2015; PRAMI 2013), the ACC/AHA and ESC guidelines updated their guidelines. The ACC/AHA/SCAI 2015 and ESC 2014 guidelines now state that simultaneous intervention on significantly stenotic non‐culprit lesions can be considered in selected people with STEMI and MVD, thus upgrading their recommendations to class IIb. The fact that the strength of the recommendation is still IIb suggests that more robust evidence is needed to make stronger recommendations in this regard. In contrast, the National Institute for Health and Care Excellence (NICE) guidelines do not make any recommendations regarding intervention on non‐culprit coronary arteries due to lack of evidence (NICE 2013).
This lack of strong recommendations in regards to intervention on both culprit and non‐culprit arteries during STEMI emphasises the need for good‐quality evidence followed by systematic analysis, to support more specific recommendations. Such information, when available, can be of great help to healthcare providers allowing them to allocate resources more efficiently thereby improving outcomes related to this common condition amidst concerns over healthcare expenditure and varying insurance reimbursements.
Objectives
To assess the effects of early complete revascularisation compared with culprit vessel only intervention strategy in people with STEMI and MVD.
Methods
Criteria for considering studies for this review
Types of studies
We included only RCTs comparing complete revascularisation versus culprit‐only PCI strategy in people with STEMI and MVD. We included studies reported as full‐text, those published as abstract, and unpublished data.
Types of participants
We included adults aged 18 years and above, who underwent P‐PCI for the management of STEMI, with concurrent non‐culprit significant lesions (as defined by the authors of the trial), identified at the time of the index procedure.
Types of interventions
We included studies that looked at a population of people presenting with STEMI and who were initially treated with a P‐PCI and coronary angiography to assess the extent of coronary vessel obstruction in the various branches of the coronary tree. Further, in these people, the culprit and the non‐culprit arteries were identified based on correlation with participants' changes on electrocardiograms. Following initial treatment of the culprit lesion, participants in these RCTs were randomised to receive either complete or culprit vessel only intervention. A comparison was then made between these two strategies, defined as:
-
Complete revascularisation strategy: involving additional revascularisation of the clinically significant stenotic non‐culprit lesion(s) (at least 50% obstruction but less than 100%) at the index procedure or in a second intervention. This was carried out in all eligible participants, except if contraindicated;
-
Culprit vessel‐only intervention: involving no additional invasive approach but rather medical management of all eligible participants, even with evidence of non‐culprit artery disease diagnosed at the time of P‐PCI. Exceptions were made if the participant had clinical symptoms that warranted further testing and intervention (e.g. new‐onset chest pain, dynamic changes on electrocardiogram, or a positive stress test).
Types of outcome measures
Primary outcomes
-
Long‐term all‐cause mortality: defined as death from any cause at one year or greater after the intervention.
-
Long‐term cardiovascular mortality: defined as death from cardiovascular cause at one year or greater after the intervention.
-
Long‐term non‐fatal myocardial infarction: spontaneous myocardial infarction measured at one year or greater after the intervention.
-
Adverse events: acute kidney injury, stroke, and bleeding (defined as GUSTO (Global Utilization of Streptokinase and t‐PA for Occluded Coronary Arteries) severe or moderate and TIMI (Thrombolysis in Myocardial Infarction) major or minor) at 30 days (short‐term) and one year or later (long‐term) after the initial intervention.
Secondary outcomes
-
Short‐term all‐cause mortality: defined as death from any cause measured within the first 30 days (short‐term) after the index intervention.
-
Short‐term cardiovascular mortality: defined as death from cardiovascular cause within the first 30 days after the index intervention.
-
Short‐term non‐fatal myocardial infarction: spontaneous myocardial infarction (excluding periprocedural elevation of cardiac enzymes) and measured within the first 30 days after the index intervention.
-
Revascularisation: defined as the need for revascularisation with either coronary artery bypass graft surgery (CABG) or PCI. Measured within the first 30 days (short‐term) and at one year or greater (long‐term) after the intervention.
-
Health‐related quality of life: measured with any validated health‐related quality of life instrument at one year or greater after the intervention.
-
Cost: measured at one‐year follow‐up or greater.
Search methods for identification of studies
Electronic searches
On 4 January 2017, we searched the following sources from their inception and we imposed no restriction on language of publication:
-
Cochrane Central Register of Controlled Trials (CENTRAL): 2016, Issue 11 (Wiley);
-
Database of Abstracts of Reviews of Effects (DARE): Issue 2 of 4, April 2015 (Wiley);
-
Health Technology Assessment Database (HTA): Issue 4 of 4, October 2016 (Wiley);
-
Ovid MEDLINE(R) 1946 to December Week 1 2016, Ovid MEDLINE(R) In‐Process & Other Non‐Indexed Citations 3 January 2017 and Ovid MEDLINE(R) Epub Ahead of Print 3 January 2017;
-
Embase 1974 to 4 January 2017; Embase Classic 1947 to 1973; MEDLINE 1966 to 4 January 2017 (embase.com);
-
Conference Proceedings Citation Index‐Science (CPCI‐S) 1990 to 4 January 2017 (Web of Science).
We applied the Cochrane sensitivity‐maximizing RCT filter (Lefebvre 2011) to MEDLINE (Ovid) but did not apply it to the MEDLINE In‐Process or Epub searches. For Embase, we used the multi‐term Embase filter with the best balance of sensitivity and specificity (Wong 2006) translated from Ovid to embase.com syntax.
For details of terms used in search strategies please see Appendix 1.
Searching other resources
In order to identify articles potentially missed through the electronic searches, we:
-
handsearched reference lists of all included studies and relevant reviews retrieved by electronic searching to identify other potentially eligible trials or ancillary publications;
-
conducted a search on 8 December 2016 for other systematic reviews and Health Technology Assessment reports in Epistemonikos (www.epistemonikos.org);
-
handsearched on 8 December 2016, conference proceedings via their websites for 2011 to 2016 (congress365.escardio.org), ACC Annual Scientific Sessions (www.onlinejacc.org/content/meeting‐abstract‐supplements), AHA Annual Scientific Sessions (circ.ahajournals.org), and Transcatheter Cardiovascular Therapeutics Abstracts (www.tctmd.com);
-
contacted corresponding authors of included studies for any additional published or unpublished data;
-
attempted to contact the authors of trials when information in the study report was lacking or unclear.
We also searched the following trial registers:
-
ClinicalTrials.gov (www.clinicaltrials.gov/);
-
European (EU) Clinical Trials Register (www.clinicaltrialsregister.eu/);
-
WHO International Clinical Trials Registry Platform (apps.who.int/trialsearch/).
Data collection and analysis
Selection of studies
Two review authors (SH and CB) independently screened titles and abstracts for inclusion of all the potential studies that the search identified and coded them as 'retrieve' (eligible or potentially eligible/unclear) or 'do not retrieve'. If there were any disagreements, a third review author arbitrated. We retrieved the full‐text study reports/publication and two review authors (SH and CB) independently screened the full‐text and identified studies for inclusion, and identified and recorded reasons for exclusion of the ineligible studies. We resolved any disagreements through discussion or, if required, we consulted a third review author. We identified and excluded duplicate publications and collated multiple reports of the same study so that each study, rather than each report, became a unit of interest in the review. We recorded the selection process in sufficient detail to complete a PRISMA flow diagram (Figure 1) and Characteristics of excluded studies table.
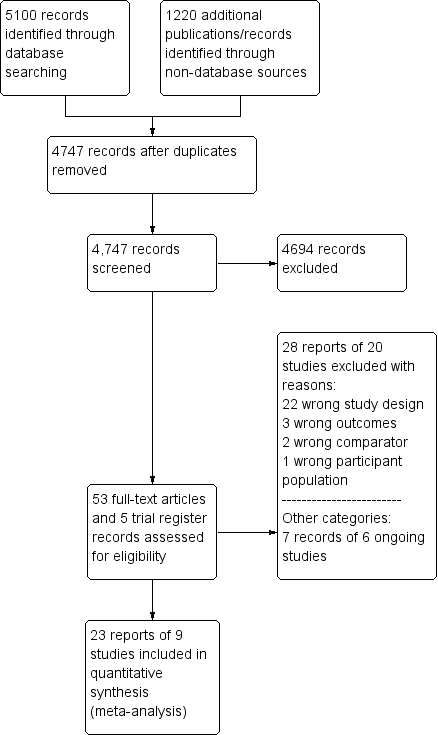
Study flow diagram.
Data extraction and management
We used a data collection form for study characteristics and outcome data that had been piloted on at least one study in the review. One review author (CB) extracted study characteristics from included studies including:
-
methods: study design, total duration of study, details of any 'run‐in' period, number of study centres and location, study setting, withdrawals, and date of study;
-
participants: number, mean age, age range, gender, severity of the condition, diagnostic criteria, inclusion criteria, and exclusion criteria;
-
interventions: intervention, comparison, concomitant medications, and excluded medications;
-
outcomes: primary and secondary outcomes specified and collected, and time points reported;
-
notes: funding for trial and notable conflicts of interest of trial authors.
Two review authors (CB and SH) independently extracted outcome data from included studies. We resolved any disagreements by consensus or by involving a third review author. One review author (CB) transferred data into the Review Manager 5 (RevMan 2014). We double‐checked that data were entered correctly by comparing the data presented in the systematic review with those of the study reports. A second review author (SH) spot‐checked study characteristics for accuracy against the trial report.
Trial Sequential Analysis
We performed Trial Sequential Analysis (TSA) for the outcomes long‐term all‐cause mortality, long‐term cardiovascular mortality, long‐term non‐fatal myocardial infarction, and long‐term revascularisation. We applied TSA using free software (www.ctu.dk/tsa). TSA reduces the risk of random errors due to sparse data and repetitive testing of the accumulating data (Wetterslev 2008). We calculated the diversity‐adjusted required information size, that is, number of participants needed to detect or reject a hypothesis. In our meta‐analysis, the required information size for dichotomous outcomes was based on the proportion in the control group; assumption of a plausible relative risk reduction (RRR) of 20% observed in the included trials; a risk of type I error (alpha) of 2%; a risk of type II error (beta) of 10%; and the observed diversity of the meta‐analysis (Jakobsen 2014). The underlying assumption of TSA is that testing for significance may be performed each time a new trial is added to the meta‐analysis. We added the trials according to the year of publication, and if more than one trial was published in a year, we added trials alphabetically according to the last name of the first author or the trial name. On the basis of the required information size, we constructed trial sequential monitoring boundaries (Thorlund 2011; Wetterslev 2008). These boundaries determine the statistical inference one may draw regarding the cumulative meta‐analysis that has not reached the required information size; if the trial sequential monitoring boundary is crossed by the cumulative Z curve before the required information size is reached, firm evidence may perhaps be established and further trials may be superfluous. In contrast, if the boundary benefit or harm is not surpassed, it is most probably necessary to continue doing trials in order to detect or reject a certain intervention effect. That can be determined by assessing if the cumulative Z‐curve crosses the trial sequential boundaries for futility.
Assessment of risk of bias in included studies
Two review authors (SH and CB) independently assessed the risk of bias for each study using the criteria outlined in the Cochrane Handbook for Systematic Reviews of Interventions (Higgins 2011). We resolved any disagreements by discussion or by involving a third review author. We assessed the risk of bias according to the following domains (Wood 2008).
-
Random sequence generation.
-
Allocation concealment.
-
Blinding of participants and personnel.
-
Blinding of outcome assessment.
-
Incomplete outcome data.
-
Selective outcome reporting.
-
Other bias (e.g. industry funding).
We graded each potential source of bias as high, low, or unclear and provide a quote from the study report together with a justification for our judgement in the 'Risk of bias' table. We summarised the risk of bias judgements across different studies for each of the domains listed. Wherever the information on the risk of bias related to unpublished data or correspondence with a trialist, we noted the same in the 'Risk of bias' table.
We conducted the review according to the published protocol (Hirji 2015), and reported any deviations from it under the Differences between protocol and review. When considering treatment effects, we took into account the risk of bias for the studies that contributed to such an outcome.
Measures of treatment effect
We analysed dichotomous data as risk ratios (RR) with 95% confidence intervals (CI) and continuous data as mean difference (MD) or standardised mean difference (SMD) with 95% CI. SMD will be used if the outcome is measured in a variety of ways, for instances with different scales and MD will be used if the outcomes is measured with the same method. We entered data presented as a scale with a consistent direction of effect. We described skewed data reported as medians and interquartile ranges narratively.
Unit of analysis issues
All included trials were randomised at the individual participant level.
Dealing with missing data
We contacted investigators to verify key study characteristics and obtain missing numerical outcome data wherever possible (e.g. when a study was published as abstract only). Where this was not feasible, and the missing data were thought to introduce serious bias, we explored the impact of including such studies on the overall assessment of results using a sensitivity analysis.
Assessment of heterogeneity
We examined heterogeneity using the I2 statistic, which quantifies inconsistency across studies to assess the impact of heterogeneity on the meta‐analysis, with an I2 statistic of 50% or more indicative of a considerable level of inconsistency.
If we identified substantial heterogeneity, we reported it and explored possible causes by prespecified subgroup analysis and performed the analysis using a random‐effects model. In the event of substantial clinical, methodological, or statistical heterogeneity, we decided not to report study results as pooled effect estimates.
Assessment of reporting biases
We were unable to assess reporting bias as the number of included studies was insufficient for an informative funnel plot (Higgins 2011).
Data synthesis
If there was evidence for homogeneous effects across studies, we analysed the data using RR and summarised all data using a fixed‐effect model (Riley 2011; Wood 2008). In addition, we performed statistical analyses according to the statistical guidelines contained in the Cochrane Handbook for Systematic Reviews of Interventions (Higgins 2011).
Subgroup analysis and investigation of heterogeneity
We carried out the following subgroup analyses and investigated interaction.
-
Drug‐eluting stent (DES) compared to bare‐metal stents (BMS).
-
Sex.
-
People with diabetes mellitus compared to people without diabetes mellitus.
-
Non‐culprit and culprit intervention during the same procedure compared to in separate interventions (staged).
-
Low risk of bias articles compared to high risk of bias articles.
-
Participants in cardiogenic shock compared to participants not in cardiogenic shock.
We used the following outcomes in subgroup analyses.
-
Long‐term all‐cause mortality.
-
Long‐term cardiovascular mortality.
-
Long‐term non‐fatal myocardial infarction.
We used the formal test for subgroup interactions in Review Manager 5 (RevMan 2014).
Sensitivity analysis
We performed sensitivity analyses to explore the influence of the following factors on effect sizes.
-
Restricting the analysis to published studies.
-
Restricting the analysis to trials at low risk of bias, as specified in Assessment of risk of bias in included studies.
-
Restricting the analysis to trials using the following filters: language of publication, source of funding (industry), and country.
-
Restricting the analysis to published trials that utilised mostly DES.
Reaching conclusions
Two review authors (CB and CG) independently assessed the quality of the evidence using the GRADE approach and the GRADE profiler (GRADEpro) 3.6 (GRADEpro GDT) to assess the quality of evidence related to each of the key outcomes listed in the Types of outcome measures (Chapter 12.2, Cochrane Handbook for Systematic Reviews of Interventions; Higgins 2011). A summary of the evidence is included in the summary of findings Table for the main comparison.
We based our conclusions only on findings from the quantitative or narrative synthesis of included studies for this review.
We avoided making recommendations for practice and our implications for research were meant to suggest priorities for future research and outline any remaining uncertainties in the area.
Results
Description of studies
For a detailed description of studies, see the Characteristics of included studies, Characteristics of excluded studies, and Characteristics of ongoing studies tables.
Results of the search
Our comprehensive literature search identified 5100 records; of these, we identified 53 full‐text papers and five clinical trial register records for further examination. We excluded the other studies on the basis of their titles or abstracts, which either did not meet the inclusion criteria or were not relevant to the question under trial (see Figure 1 for the PRISMA flow chart). After screening the full‐text of the selected publications, nine trials (23 publications) met the inclusion criteria. All studies were in English, except for one (Zhang 2015). Although we sought additional information from the authors of all studies, two responded to these requests and only one provided additional data (DANAMI‐3‐PRIMULTI 2015).
Included studies
A detailed description of the characteristics of included studies is presented in the Characteristics of included studies table; Table 1; Table 2; and Table 3. The following is a succinct overview.
| Study | Dates | Complete revascularisation (staged vs 1 time) | Intervention criteria in non‐culprit vessel | Mean follow‐up (years) | Description multi‐vessel disease | Country | Number of centres |
| May 2011 to May 2013 | At index procedure or before discharge. 65% of participants in invasive group had at index procedure. | > 70% diameter stenosis in 1 plane or > 50% in 2 planes. | 2.5 | Culprit vessel plus ≥ 1 non‐infarct‐related epicardial artery with ≥ 1 lesion deemed angiographically significant (> 70% stenosis in 1 plane or > 50% in 2 planes). | UK | 7 | |
| June 2004 to February 2007. | Staged 7.5 days after P‐PCI. | FFR < 0.75 and in stenosis > 90%, PCI was performed without FFR measurement. PCI was with BMS or DES. | 3 | ≥ 1 significant stenosis (> 50% stenosis in ≥ 1 view) in ≥ 2 major epicardial coronary arteries, or the combination of a side branch and a main epicardial vessel provided that they supplied different territories. | The Netherlands | 1 | |
| March 2011 to February 2014 | Staged 2 days after P‐PCI. | FFR < 0.8 and those > 90% stenotic arteries visually. | 2.2 | Significant stenosis (> 50% stenosis visually in arteries > 2 mm diameter) in ≥ 1 of the non‐culprit epicardial coronary arteries or their major side branches in addition to the infarct‐related artery. | Denmark | 2 | |
| 2010 to 2013 | Staged. | Complete. Criteria not described in study. | 1 | NR. | Spain | NR | |
| NR | Index procedure. | Not described. | 1 | NR. | Not described | NR | |
| January 2003 to December 2007 | At index procedure or staged mean 56 days after P‐PCI. 50% participants of complete revascularisation had at intervention of the non‐culprit lesions at index procedure. | > 70% diameter stenosis. | 2.5 | > 70% diameter stenosis of ≥ 2 epicardial coronary arteries or their major branches by visual estimation. | Not described | NR | |
| September 2008 to December 2014 | Staged between 3 and 40 days after P‐PCI. | > 70% stenosis of non‐culprit coronary artery. | 3 | ≥ 1 vessel, beside the culprit vessel, with significant stenosis (> 70% stenosis). | Czech Republic | 6 | |
| April 2008 to January 2013 | At index procedure. | Stenosis ≥ 50%. | 2 | The presence of stenosis ≥ 50% in ≥ 1 coronary artery other than the culprit vessel. | UK | 5 | |
| January 2009 to June 2012 | Staged between 7 and 10 days after P‐PCI. | 75% to 90%. | 2 | Non‐culprit vessel with significant stenosis (75% to 90% stenosis). | China | NR |
BMS: bare‐metal stent; DES: drug‐eluting stent; FFR: fractional flow reserve; NR: not reported in the article; PCI: percutaneous coronary intervention; P‐PCI: primary percutaneous coronary intervention.
| Study | Group | Sample size (n) | Participants (n (%)) | Dropouts (n (%)) | % Male | Mean age (years) | % HTN | % DM | % HLD | % Prior MI | % Anterior STEMI |
| Complete | 150 | 139 (92.7) | 11 (7.3) | 85.3 | 64.6 | 36 | 12.7 | 27.3 | 4.7 | 36 | |
| Culprit‐only | 146 | 139 (95.2) | 8 (5.5) | 76.7 | 65.3 | 35 | 13.7 | 23.3 | 3.4 | 35.6 | |
| Complete | 80 | 71 (88.8) | 1 (1.3) | 80 | 62 | 26.3 | 6.3 | 15 | 6.3 | 21.3 | |
| Culprit‐only | 41 | 41 (100) | 1 (2.4) | 80.5 | 61 | 42.5 | 5 | 30 | 4.9 | 23.3 | |
| Complete | 314 | 294 (93.6) | 1 (0.3) | 80 | 64 | 41.4 | 9.2 | NR | 5.4 | 33.4 | |
| Culprit‐only | 313 | 313 (100) | 0 | 81.5 | 63 | 46.6 | 13.4 | NR | 8.6 | 35.8 | |
| Complete | 100 | NR | NR | NR | NR | NR | NR | NR | NR | NR | |
| Culprit‐only | 99 | NR | NR | NR | NR | NR | NR | NR | NR | NR | |
| Complete | 52 | NR | NR | 88.5 | 63.5 | 36.5 | 11.5 | 41.2 | NR | 52 | |
| Culprit‐only | 17 | NR | NR | 82.4 | 65.3 | 58.8 | 41.2 | 53 | NR | 59 | |
| Complete | 130 | NR | NR | 78.5 | 64 | 57 | 16.2 | NR | NR | 45.4 | |
| Culprit‐only | 84 | NR | NR | 76.2 | 66.5 | 60 | 23.8 | NR | NR | 41.7 | |
| Complete | 106 | NR | NR | NR | NR | NR | NR | NR | NR | NR | |
| Culprit‐only | 108 | NR | NR | NR | NR | NR | NR | NR | NR | NR | |
| Complete | 234 | 223 (95.3) | 10 (4.3) | 75.6 | 62 | 40.2 | 15 | NR | 8.1 | 28.6 | |
| Culprit‐only | 231 | 229 (99) | 8 (3.5) | 80.5 | 62 | 40.3 | 20.8 | NR | 7 | 38.5 | |
| Complete | 215 | NR | NR | 61 | 62.3 | 64.2 | 36.7 | 35.3 | NR | 36.7 | |
| Culprit‐only | 213 | NR | NR | 67.1 | 62 | 61 | 35.2 | 36.6 | NR | 40 |
DM: diabetes mellitus; HLD: hyperlipidaemia; HTN: hypertension; MI: myocardial infarction; n: number of participants; NR: not reported in the article; STEMI: ST elevated myocardial infarction.
| Study | Group | Symptoms to PCI time (minute) | PCI without stenting (n (%)) | DES (n (%)) | BMS (n (%)) | 2‐Vessel disease (n (%)) | 3‐Vessel disease (n (%)) | Received PCI non‐culprit (n (%)) | DAPT | DAPT duration |
| Complete | 182 | NR | 141 (94) | NR | 119 (79.3) | 31 (20.7) | 139 (92.7) | Yes | NR | |
| Culprit‐only | 159 | NR | 127 (87) | NR | 110 (75.3) | 36 (24.7) | 0 | |||
| Complete | NR | 6 (7.5) | 18 (22.5) | 56 (70) | 60 (75) | 20 (25) | 48 (60) | Yes | 1 month | |
| Culprit‐only | NR | 7 (17.1) | 7 (7.1) | 27 (66) | 33 (80.5) | 8 (19.5) | 0 | |||
| Complete | NR | 12 (3.8) | 298 (95) | 0 | NR | 97 (31) | 193 (61.5) | Yes | 1 year | |
| Culprit‐only | NR | 18 (5.8) | 290 (92.7) | 0 | NR | 100 (32) | 0 | |||
| Complete | NR | NR | NR | NR | NR | NR | NR | NR | NR | |
| Culprit‐only | NR | NR | NR | NR | NR | NR | NR | |||
| Complete | 210 | 0 | 52 (100) | 0 | 36 (69) | 16 (30.8) | NR | Yes | 1 month | |
| Culprit‐only | 236 | 0 | 17 (100) | 0 | 9 (53) | 8 (47) | NR | |||
| Complete | NR | NR | 11 (8.5) | NR | NR | 48 (37) | NR | NR | NR | |
| Culprit‐only | NR | NR | 10 (12) | NR | NR | 21 (25) | NR | |||
| Complete | NR | NR | NR | NR | NR | NR | NR | NR | NR | |
| Culprit‐only | NR | NR | NR | NR | NR | NR | NR | |||
| Complete | NR | 1 (< 1) | 147 (63) | 86 (37) | 143 (61.1) | 91 (39) | 223 (95.3) | Yes | 1 month | |
| Culprit‐only | NR | 0 | 135 (58) | 96 (42) | 155 (67.1) | 76 (33) | 2 (1) | |||
| Complete | 214 | 0 | 215 (100) | 0 | NR | NR | NR | NR | NR | |
| Culprit‐only | 227 | 0 | 213 (100) | 0 | NR | NR | NR |
BMS: bare‐metal stent; DAPT: dual antiplatelet therapy; DES: drug‐eluting stent; n: number of participants; NR: not reported in the article; PCI: percutaneous coronary intervention.
Source of data
All included trials had published data in established journals, except for the PRAGUE‐13 (PRAGUE‐13 2015) and Estevez (Estevez Loureiro 2014) trials, which only had abstracts. We contacted all corresponding authors, two replied and only one (DANAMI‐3‐PRIMULTI 2015) provided additional data (Appendix 2).
Comparisons
All included trials compared culprit‐only versus complete revascularisation in people with acute STEMI and MVD. Six trials performed the intervention on the non‐culprit vessels as a staged intervention (Dambrink and Ghani 2010; DANAMI‐3‐PRIMULTI 2015; Estevez Loureiro 2014; Politi 2009; PRAGUE‐13 2015; Zhang 2015), and three trials performed the intervention of the non‐culprit vessels at the same index procedure (HELP AMI 2004; Politi 2009; PRAMI 2013). In one trial, the investigators encouraged the interventionists to perform the complete revascularisation at the same index procedure (CvLPRIT 2015); however, 35% of the procedures were staged. The Politi 2009 trial had three intervention groups: complete revascularisation during the index procedure; complete revascularisation in a staged procedure; and culprit vessel‐only revascularisation.
Overview of study populations
The nine trials included 2633 participants, 1381 participants were randomised to the complete revascularisation group and 1252 to the culprit‐only intervention group.
Among the four publications that reported dropout, 1449 (96%) participants finished the trial, 727 (93.4%) in the complete revascularisation group and 722 (98.8%) in the culprit‐only intervention group (CvLPRIT 2015; Dambrink and Ghani 2010; DANAMI‐3‐PRIMULTI 2015; PRAMI 2013).
Trial design
The included trials were conducted between 2003 and 2014, and the duration of follow‐up ranged from one to three years, with a mean follow‐up of 2.1 years.
Four trials were multi‐centre (CvLPRIT 2015; DANAMI‐3‐PRIMULTI 2015; PRAGUE‐13 2015; PRAMI 2013), one was single centre (Dambrink and Ghani 2010), and four trials did not mention the number of centres (Estevez Loureiro 2014; HELP AMI 2004; Politi 2009; Zhang 2015). The number of centres per trial ranged between one and seven.
Two trials terminated prematurely, one because of slow enrolment (Dambrink and Ghani 2010) and the other because there was a marked benefit from the complete revascularisation strategy (PRAMI 2013).
Settings
Six of the nine trials were performed in Europe (Spain, Denmark, UK, Czech Republic, and the Netherlands), one in China (Zhang 2015), and two trials did not report where the study was carried out, although based on the authorship, it is likely that they were carried out in Italy (HELP AMI 2004; Politi 2009).
Participants
The majority of participants were men, with male percentage per group between 61% and 89%. The mean age was 63.5 years and the age mean per study ranged between 62 and 65 years. Included studies did not report the ethnicity of the participants.
With the exception of two studies (Estevez Loureiro 2014; PRAGUE‐13 2015), all trials reported comorbidities. The trials that reported comorbidities included people with past medical history of diabetes mellitus, arterial hypertension, hyperlipidaemia, smoking, myocardial infarction, prior CABG, prior PCI, stroke, heart failure, and chronic kidney disease. These trials had between 5% and 41% of participants with diabetes and between 26% and 64% of participants with hypertension, which were therefore the most common comorbidities among the included participants, followed by previous myocardial infarction.
With the exception of two studies (Estevez Loureiro 2014; PRAGUE‐13 2015), all trials reported comedications. In the studies that reported comedications, after the intervention participants received standard medical treatment for the duration of the follow‐up. The most commonly reported drugs were aspirin and clopidogrel in seven out of nine trials; six of the nine trials reported using beta‐blockers, angiotensin‐converting enzyme inhibitor, angiotensin receptor blockers, glycoprotein IIb/IIIa inhibitor, and statins. Five trials reported using dual antiplatelet after PCI, where this combination treatment was provided for at least one month (CvLPRIT 2015; Dambrink and Ghani 2010; DANAMI‐3‐PRIMULTI 2015; HELP AMI 2004; PRAMI 2013).
The major exclusion criteria from the included trials were cardiogenic shock in seven trials (CvLPRIT 2015; DANAMI‐3‐PRIMULTI 2015; HELP AMI 2004; Politi 2009; PRAGUE‐13 2015; PRAMI 2013; Zhang 2015), clear indication for CABG in six trials (Dambrink and Ghani 2010; DANAMI‐3‐PRIMULTI 2015; HELP AMI 2004; Politi 2009; PRAGUE‐13 2015; PRAMI 2013), prior CABG in five trials (CvLPRIT 2015; Dambrink and Ghani 2010; Politi 2009; PRAMI 2013; Zhang 2015), and technically impossible PCI and chronic coronary obstruction in six trials (CvLPRIT 2015; Dambrink and Ghani 2010; DANAMI‐3‐PRIMULTI 2015; Politi 2009; PRAMI 2013; Zhang 2015). Only one trial did not report the exclusion criteria (Estevez Loureiro 2014).
Diagnosis
All trials reported that the participants had acute STEMI and MVD diagnosed during the P‐PCI. Among the studies that described the definition of MVD, they considered as such, those cases where significant stenosis was present in at least one other major epicardial artery besides the culprit vessel. Significant stenosis was defined as greater than 50% stenosis in one or two planes by visual inspection (CvLPRIT 2015; Dambrink and Ghani 2010; DANAMI‐3‐PRIMULTI 2015; PRAMI 2013) or greater than 70% in one plane (CvLPRIT 2015; Politi 2009; PRAGUE‐13 2015). After diagnosing significant stenosis by visual inspection of the coronary angiogram, in two studies the investigators performed a fractional flow reserve (FFR) measurement to decide whether the stenosis was haemodynamically significant and required intervention. The cutoff value for FFR that defined haemodynamically significant stenosis was 0.8 or less (DANAMI‐3‐PRIMULTI 2015) and less than 0.75 (Dambrink and Ghani 2010).
Interventions
All 2633 participants underwent the intervention after randomisation. In two trials, all participants underwent PCI with DES placement (HELP AMI 2004; Zhang 2015), while two other trials did not describe the type of stent utilised (Estevez Loureiro 2014; PRAGUE‐13 2015). For more details please refer to Table 3.
Outcomes
Six trials explicitly stated the primary and secondary outcomes in their publications; only three trials did not specify their secondary outcomes (Estevez Loureiro 2014; Politi 2009; Zhang 2015). The most commonly defined primary outcome in the publications and protocols were non‐fatal myocardial infarction, all‐cause mortality, revascularisation, and cardiac mortality.
Reporting of outcomes
All trials collected a median of 1.2 (range one to three) primary outcomes and a median of 3.8 (range one to eight) secondary outcomes. All included trials assessed non‐fatal myocardial infarction, all except one trial assessed revascularisation (Zhang 2015), all except one trial assessed all‐cause mortality (Estevez Loureiro 2014), and all except two trials assessed cardiac mortality (Dambrink and Ghani 2010; HELP AMI 2004).
Four trials reported bleeding (CvLPRIT 2015; Dambrink and Ghani 2010; DANAMI‐3‐PRIMULTI 2015; PRAMI 2013), and three trials reported acute kidney injury (CvLPRIT 2015; Politi 2009; PRAMI 2013). For a summary of all assessed outcomes in each trial, see the Characteristics of included studies table.
Excluded studies
We excluded twenty‐eight articles after careful evaluation of the full publication (Figure 1). The main reasons for exclusion were: wrong study design and wrong comparator. For further details, see the Characteristics of excluded studies table.
Risk of bias in included studies
For details on risk of bias of included studies see the Characteristics of included studies table. For an overview of review authors' judgements about each risk of bias item for individual trials and across all trials see Figure 2 and Figure 3.
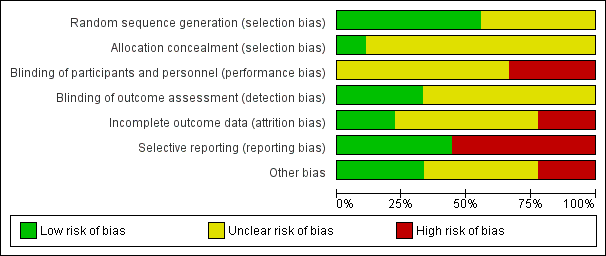
Risk of bias graph: review authors' judgements about each risk of bias item presented as percentages across all included studies.

Risk of bias summary: review authors' judgements about each risk of bias item for each included study.
Allocation
Five out of the nine included trials utilised electronically generated random numbers to allocate the included participants into one of the intervention groups (CvLPRIT 2015; Dambrink and Ghani 2010; DANAMI‐3‐PRIMULTI 2015; Politi 2009; PRAMI 2013). Four out of the nine trials did not describe their methods of generating the allocation sequence (Estevez Loureiro 2014; HELP‐AMI 2004; PRAGUE‐13 2015; Zhang 2015). Only one trial detailed how the allocation concealment was ensured (CvLPRIT 2015). Therefore, only the CvLPRIT trial was at low risk of selection bias. The remaining eight trials were at high risk of selection bias.
Blinding
Because of the nature of the intervention, all studies were open label for the operators. Several trials described that they were open label for the participants (CvLPRIT 2015; DANAMI‐3‐PRIMULTI 2015; PRAMI 2013), and blinded for investigators and outcome assessors (CvLPRIT 2015;Dambrink and Ghani 2010; DANAMI‐3‐PRIMULTI 2015; PRAMI 2013). One study described that it was open label for investigators and participants (PRAGUE‐13 2015), and two trials did not state if they were blinded to participants (Dambrink and Ghani 2010; Zhang 2015). With the exception of the outcome of revascularisation, there was low risk of performance and detection bias since the majority of the other assessed outcomes were objective.
Incomplete outcome data
Only four trials reported the number of withdrawals (CvLPRIT 2015; Dambrink and Ghani 2010; DANAMI‐3‐PRIMULTI 2015; PRAMI 2013). The number of dropouts per group were similar; however, given the low number of events, there was considerably high risk of attrition bias in two trials (CvLPRIT 2015; PRAMI 2013).
Selective reporting
Among the four studies that were registered in a clinical trial database or had a published protocol, there was a low risk of reporting bias (CvLPRIT 2015; DANAMI‐3‐PRIMULTI 2015; PRAGUE‐13 2015; PRAMI 2013).
Other potential sources of bias
Only four trials reported funding from national institutions or charitable institutions (CvLPRIT 2015; DANAMI‐3‐PRIMULTI 2015; PRAGUE‐13 2015; PRAMI 2013). The other trials did not mention the source of funding and no private companies were mentioned as sources of finance.
Effects of interventions
Baseline characteristics
For details of baseline characteristics see Table 2.
Complete revascularisation strategy or culprit vessel‐only intervention
Primary outcomes
Long‐term all‐cause mortality
Eight studies found that complete and culprit‐only revascularisation strategies did not differ significantly regarding long‐term all‐cause mortality (65/1274 (5.1%) in complete group versus 72/1143 (6.3%) in culprit‐only group; RR 0.80, 95% CI 0.58 to 1.11; participants = 2417; I2 = 0%; very low quality evidence) (Analysis 1.1) (CvLPRIT 2015; Dambrink and Ghani 2010; DANAMI‐3‐PRIMULTI 2015; HELP AMI 2004; Politi 2009; PRAGUE‐13 2015; PRAMI 2013; Zhang 2015).
The TSA showed that more studies are needed to demonstrate that the complete revascularisation strategy is related to an at least 20% long‐term all‐cause mortality RRR compared to the culprit‐only intervention strategy (RR 0.80, TSA‐adjusted CI 0.56 to 1.10) (Figure 4).

Trial Sequential Analysis for complete versus culprit‐only revascularisation on long‐term all‐cause mortality. The diversity‐adjusted required information size (DARIS) was calculated based on an expected relative risk reduction (RRR) of 20% from proportion event in control (Pc) group of 6.3% with an alpha of 2% and beta of 10%.
Long‐term cardiovascular mortality
Six studies found that, when compared to the culprit‐only intervention strategy, complete revascularisation was associated with a lower cardiovascular mortality in the long‐term or one year after the index procedure (28/1143 (2.4%) in complete group versus 51/1086 (4.7%) in culprit‐only group; RR 0.50, 95% CI 0.32 to 0.79; participants = 2229; I2 = 0%; very low quality evidence) (Analysis 1.2) (CvLPRIT 2015; DANAMI‐3‐PRIMULTI 2015; Politi 2009; PRAGUE‐13 2015; PRAMI 2013; Zhang 2015).
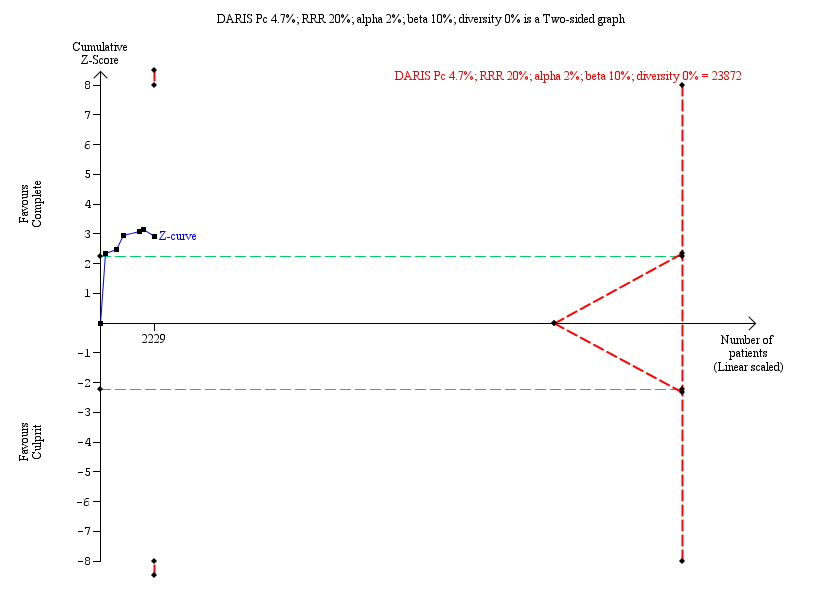
The TSA showed that more studies are needed to demonstrate that the complete revascularisation strategy is related to an at least 20% long‐term cardiovascular mortality RRR compared with the culprit‐only intervention strategy (RR 0.51, TSA‐adjusted CI 0.08 to 3.24) (Figure 5).

Trial Sequential Analysis for complete versus culprit‐only revascularisation on long‐term cardiovascular mortality. The diversity‐adjusted required information size (DARIS) was calculated based on an expected relative risk reduction (RRR) of 20% from Pc group of 4.7% with an alpha of 2% and beta of 10%.
Long‐term non‐fatal myocardial infarction
Six studies found that complete revascularisation strategy was superior to the culprit‐only intervention in terms of long‐term non‐fatal myocardial infarction (47/1095 (4.3%) in complete group versus 70/1004 (7.0%) in culprit‐only group; RR 0.62, 95% CI 0.44 to 0.89; participants = 2099; I2 = 0%; very low quality evidence) (Analysis 1.3) (CvLPRIT 2015; DANAMI‐3‐PRIMULTI 2015; HELP AMI 2004; Politi 2009; PRAMI 2013; Zhang 2015).
The TSA showed that more studies are needed to demonstrate that the complete revascularisation strategy is related to an at least 20% long‐term non‐fatal myocardial infarction RRR compared to the culprit‐only intervention strategy (RR 0.64, TSA‐adjusted CI 0.14 to 2.82) (Figure 6).
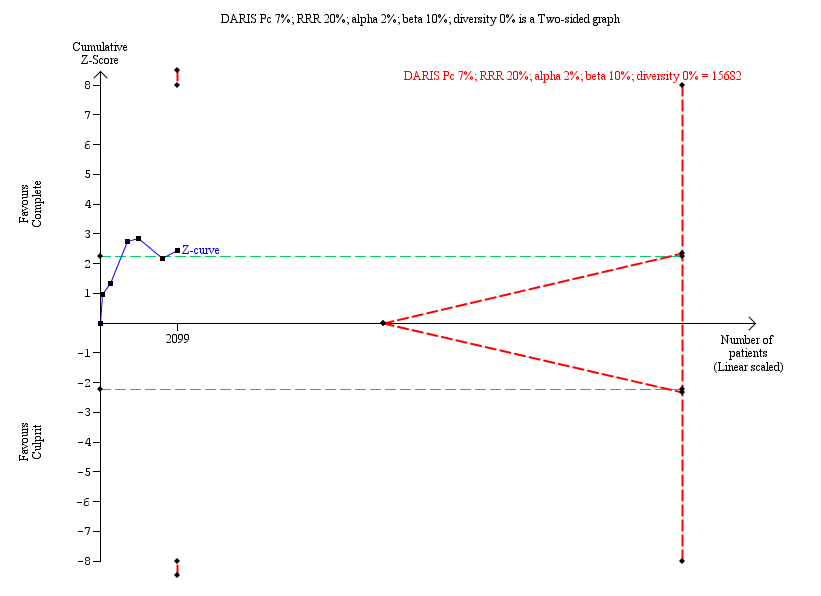
Trial Sequential Analysis for complete versus culprit‐only revascularisation on long‐term non‐fatal myocardial infarction. The diversity‐adjusted required information size (DARIS) was calculated based on an expected relative risk reduction (RRR) of 20% from Pc group of 7.0% with an alpha of 2% and beta of 10%.
Adverse events
Six studies contributed to the pooled analysis of all adverse events comprising acute kidney injury, stroke, and bleeding in the short‐term (within the first 30 days after the index procedure) and long‐term, demonstrated that the frequency of the combined adverse event rate was similar in both groups (51/2096 (2.4%) in complete group versus 57/1990 (2.9%) in culprit‐only group; RR 0.84, 95% CI 0.58 to 1.21; participants = 4086; I2 = 0%; very low quality evidence).
Acute kidney injury
Two studies found no difference in the occurrence of acute kidney injury in the short‐term between complete or culprit‐only revascularisation strategy (4/364 (1.1%) in complete group versus 6/315 (1.9%) in culprit‐only group; RR 0.50, 95% CI 0.14 to 1.81; participants = 679; I2 = 0%; very low quality evidence) (Politi 2009; PRAMI 2013). Similarly, one trial found no difference in the occurrence of acute kidney injury in the long‐term between complete or culprit‐only revascularisation strategy (2/150 (1.3%) in complete group versus 2/146 (1.4%) in culprit‐only group; RR 0.97, 95% CI 0.14 to 6.82; participants = 296) (Analysis 1.4) (CvLPRIT 2015).
Stroke
One trial found no difference in the occurrence of short‐term stroke between complete or culprit‐only revascularisation strategy (2/234 (0.9%) in complete group versus or 0/231 (0%) in culprit‐only group; RR 4.94, 95% CI 0.24 to 102.26; participants = 465; very low quality evidence) (PRAMI 2013). Two trials showed that complete and culprit‐only revascularisation strategies were associated with similar rate of stroke in the long‐term (2/256 (0.8%) in complete group versus 5/254 (2%) in culprit‐only group; RR 0.45, 95% CI 0.10 to 2.01; participants = 510; I2 = 14) (Analysis 1.5) (CvLPRIT 2015; PRAGUE‐13 2015).
Bleeding
Three trials showed that there was no difference in major bleeding rate between groups in the short‐term (21/628 (3.3%) in complete group versus 19/585 (3.2%) in culprit‐only group; RR 1.00, 95% CI 0.53 to 1.86; participants = 1213; I2 = 0%; very low quality evidence) (Dambrink and Ghani 2010; DANAMI‐3‐PRIMULTI 2015; PRAMI 2013). Two trials demonstrated that the frequency of bleeding in the long‐term was similar between groups (20/464 (4.3%) in complete group versus 25/459 (5.4%) in culprit‐only group; RR 0.79, 95% CI 0.45 to 1.41; participants = 923; I2 = 0%) (Analysis 1.6) (CvLPRIT 2015; DANAMI‐3‐PRIMULTI 2015).
Secondary outcomes
Short‐term all‐cause mortality
Two trials showed that the complete and culprit‐only revascularisation strategies did not differ significantly in terms of short‐term all‐cause mortality (4/366 (1.1%) in complete group versus 5/330 (1.5%) in culprit‐only group; RR 0.65, 95% CI 0.18 to 2.37; participants = 696; I2 = 0%; very low quality evidence) (Analysis 2.1) (DANAMI‐3‐PRIMULTI 2015; HELP AMI 2004).
Short‐term cardiovascular mortality
One trial showed that the complete and culprit‐only revascularisation strategies did not differ significantly regarding short‐term cardiovascular mortality (1/314 (0.3%) in complete group versus 3/313 (1%) in culprit‐only group; RR 0.33, 95% CI 0.03 to 3.18; participants = 627; I2 = 0%) (Analysis 2.2) (DANAMI‐3‐PRIMULTI 2015).
Short‐term non‐fatal myocardial infarction
One trial showed that the complete and culprit‐only revascularisation strategies did not differ significantly regarding short‐term non‐fatal myocardial infarction (7/314 (2.2%) in complete group versus 4/313 (1.3%) in culprit‐only group; RR 1.74, 95% CI 0.52 to 5.90; participants = 627; I2 = 0%) (Analysis 2.3) (DANAMI‐3‐PRIMULTI 2015).
Short‐term and long‐term revascularisation
Two trials showed that there was no difference in terms of revascularisation between groups in the short‐term (6/366 (1.6%) in complete group versus 10/330 (3%) in culprit‐only group; RR 0.53, 95% CI 0.20 to 1.45; participants = 696; I2 = 0%) (DANAMI‐3‐PRIMULTI 2015; HELP AMI 2004). Nine trials showed that the complete revascularisation strategy was associated with significantly lower rates of revascularisation in the long‐term (145/1374 (10.6%) in complete group versus 258/1242 (20.8%) in culprit‐only group; RR 0.47, 95% CI 0.39 to 0.57; participants = 2616; I2 = 31%; very low quality evidence) (Analysis 2.4) (CvLPRIT 2015; Dambrink and Ghani 2010; DANAMI‐3‐PRIMULTI 2015; Estevez Loureiro 2014; HELP AMI 2004; Politi 2009; PRAGUE‐13 2015; PRAMI 2013; Zhang 2015).
In the TSA, the cumulative Z‐curve crossed the sequential monitoring boundaries for benefit. This result indicates that the complete revascularisation strategy is associated to an at least 20% long‐term non‐fatal myocardial infarction RRR compared with the culprit‐only strategy (RR 0.49, TSA‐adjusted CI 0.31 to 0.79) and further trials may not change this result (Figure 7).

Trial Sequential Analysis for complete versus culprit‐only revascularisation on long‐term revascularisation. The diversity‐adjusted required information size (DARIS) was calculated based on an expected relative risk reduction (RRR) of 20% from Pc group of 20.7% with an alpha of 2% and beta of 10%.
Health‐related quality of life
No studies reported long‐term health‐related quality of life.
Cost
Only one study reported on costs and found no difference in one‐year cost between the groups (MD Euros ‐1948.00, 95% CI ‐9171.85 to 5275.85; participants = 69; I2 = 0%) (Analysis 2.5) (HELP AMI 2004).
Subgroup analyses
Drug‐eluting stent compared to bare‐metal stents
Two trials utilised DES only in few participants (20% of the included participants in Dambrink and Ghani 2010 and 10.2% in the Politi 2009 trial received DES), while the other studies mostly placed DES in their revascularisation procedures. In those participants who underwent revascularisation with DES, complete revascularisation was favoured over the culprit‐only revascularisation strategy in terms of long‐term cardiovascular mortality (22/913 (2.4%) in complete group versus 40/903 (4.4%) in culprit‐only group; RR 0.54, 95% CI 0.33 to 0.91; participants = 1816; studies = 4; I2 = 0%) and long‐term non‐fatal myocardial infarction (41/965 (4.2%) in complete group versus 63/920 (6.8%) in culprit‐only group; RR 0.63, 95% CI 0.43 to 0.93; participants = 1885; studies = 5; I2 = 0%). In contrast, for participants in whom revascularisation was performed with BMS, neither of the revascularisation strategies was statistically favoured in terms of long‐term cardiovascular mortality (6/130 (4.6%) in complete group versus 10/84 (12%) in culprit‐only group; RR 0.39, 95% CI 0.15 to 1.03; participants = 214; studies = 1) or long‐term non‐fatal myocardial infarction (6/130 (4.6%) in complete group versus 7/84 (8.3%) in culprit‐only group; RR 0.55, 95% CI 0.19 to 1.59; participants = 214; studies = 1).
Sex
Given the poor subgroup reporting in the included trials, we were unable to perform analysis by sex.
People with diabetes mellitus compared to people without diabetes mellitus
Given the poor subgroup reporting in the included trials, we were unable to perform analysis by people with or without diabetes mellitus.
Non‐culprit and culprit intervention during the same procedure compared to in separate interventions (staged)
The complete revascularisation strategy performed at the index procedure was associated with lesser long‐term non‐fatal myocardial infarction (12/501 (2.4%) in complete group versus 32/478 (6.7%) in culprit‐only group; RR 0.37, 95% CI 0.19 to 0.71; participants = 979; studies = 4; I2 = 0%), while when the intervention on the non‐culprit lesions was deferred for a second intervention or staged procedure, the complete and culprit‐only revascularisation strategies had similar long‐term non‐fatal myocardial infarction (35/594 (5.9%) in complete group versus 45/610 (7.4%) in culprit‐only group; RR 0.80, 95% CI 0.52 to 1.23; participants = 1204; studies = 3; I2 = 0%). Complete revascularisation was also associated with lesser long‐term cardiovascular mortality when performed either during the index procedure (10/449 (2.2%) in complete group versus 27/461 (5.9%) in culprit‐only group; RR 0.40, 95% CI 0.20 to 0.82; participants = 910; studies = 3; I2 = 0%) or in a staged manner (18/694 (2.6%) in complete group versus 34/709 (4.8%) in culprit‐only group; RR 0.56, 95% CI 0.32 to 0.98; participants = 1403; studies = 4; I2 = 0%). It is important to note that in the CvLPRIT 2015 trial, which was grouped with the studies that performed complete revascularisation at the index procedure, 35% of the complete revascularisation procedures were performed in a staged manner.
Low risk of bias articles compared to high risk of bias articles
Given the poor subgroup reporting in the included trials, we were unable to perform analysis by low or high risk of bias.
Participants in cardiogenic shock compared to participants not in cardiogenic shock
Given the poor subgroup reporting in the included trials, we were unable to perform analysis by participants in or not in cardiogenic shock.
Sensitivity analyses
We performed sensitivity analyses restricting the analysis to studies that were published, were in English language only, with revascularisation guided by FFR, and the type of stent used. The overall results were unaffected by excluding the studies with those characteristics from the pooled analysis.
Assessment of reporting bias
We were unable to create a funnel plot because we did not pool more than 10 trials for the analysis of any outcome.
Ongoing trials
We identified six ongoing clinical trials that are comparing complete PCI revascularisation versus PCI of culprit‐only revascularisation in people with STEMI (see Characteristics of ongoing studies table).
Discussion
Summary of main results
The meta‐analysis of nine RCTs showed that, compared with the culprit‐only intervention, complete revascularisation in people with STEMI and MVD seems to be associated with a lower long‐term cardiovascular mortality, long‐term revascularisation need, and long‐term non‐fatal myocardial infarction.
Overall completeness and applicability of evidence
Even though this systematic review included nine fairly well‐designed RCTs and there was significant consistency across the studies due to similar inclusion/exclusion criteria, similar participant populations, similar procedures, and criteria to decide about intervening on the non‐culprit vessel, the overall quality of evidence was very low mostly due to serious problem of imprecision, indirectness, and study limitations.
The fact that the included studies in this pooled analysis were conducted recently and were contemporary with regards to the standards of care utilised, including DES and up‐to‐date medical therapy, along with the flexible inclusion and exclusion criteria, ensures high applicability of these results to current‐day clinical practice. Even though the studies were performed in different parts of the world, some continents were under‐represented. For instance, none of the included trials studied participants in North America, South America, or Australia. Women were also under‐represented, and although none of the trials reported the race of the studied participants, it is plausible that black and Hispanic people were not included or were under‐represented. Therefore, these findings have to be applied cautiously in those under‐represented populations and geographic locations.
Quality of the evidence
We utilised the GRADE assessment tool to evaluate the quality of evidence for the most relevant outcomes. In general, we judged the outcomes to have very low quality of evidence. The quality of the evidence was downgraded because of the potential risk of bias, indirectness of findings, and imprecision. Given the number of studies, we were unable to exclude publication bias and we found no evidence of plausible confounding or dose‐response gradient.
One of the main limitations of the included studies was the open‐label design, which potentially may increase the risk of performance or detection bias. To attenuate these biases, the investigators blinded the outcome assessors and we, in our analysis, included mostly objective outcomes such as mortality and non‐fatal myocardial infarction. However, we do expect that the rate of revascularisation and acute kidney injury were possibly influenced by detection and performance bias. Five of the included trials lacked a published protocol (Dambrink and Ghani 2010; Estevez Loureiro 2014; HELP AMI 2004; Politi 2009; Zhang 2015), which was concerning for risk of reporting bias; for those studies that had a published protocol, we found no evidence of reporting bias. The only study that effectively reported the allocation concealment and random sequence generation was the CvLPRIT 2015 trial, which we judged to have low risk of selection bias, while the others had high risk for selection bias.
Although the studies had few dropouts, given the small number events, we considered that the proportion of participants that left the trials might have increased the risk of attrition bias in at least two studies (CvLPRIT 2015; PRAMI 2013). Moreover, the early termination of one study because of significant difference between groups (PRAMI 2013), may also have introduced bias to the results (e.g. overestimate the beneficial results from the complete revascularisation strategy).
Another explanation for the very low quality of evidence comes from the fact that women and presumably minority group such as Hispanic and black people were under‐represented in the included studies, which would affect the external applicability of these findings; therefore, we considered this a serious limitation in indirectness of the evidence. Another limitation that justified downgrading the quality of the evidence for imprecision was that the included studies had a small number of events and several outcomes did not meet the optimal information size, which was confirmed with the TSA.
Potential biases in the review process
In order to ensure applicability of these results to patient care, all‐cause mortality was added as another primary outcome after publication of the protocol. The definition of “type of intervention” was changed to include RCTs that performed revascularisation as a second intervention at another hospitalization, which is a common practice. Additionally an element that should be considered as a potential source of bias during the review process is that the decision on intervening the non‐culprit coronary arteries was slightly different among studies. For instance, trials included in this review used slightly different degrees of stenosis while others utilised FFR measurements. Finally, some studies performed the complete revascularisation at the same index procedure while others performed the complete revascularisation at different times.
Agreements and disagreements with other studies or reviews
Major international guidelines, including those from the ACCF/AHA 2013 and ESC 2012, favour timely intervention on the culprit artery and tend to discourage simultaneous interventions upon non‐culprit lesions in the absence of objective signs or symptoms of persistent cardiac ischaemia, due to lack of good‐quality evidence and even concerns of possible harm. The results of our meta‐analysis suggest that in fact complete revascularization of significantly stenotic (50‐70% stenotic) non‐culprit lesions, regardless of signs or symptoms of ischaemia, may improve important cardiovascular outcomes.
Our findings are clearly in conformity with the newly updated ACC/AHA/SCAI 2015 and ESC 2014 guidelines, which allow for consideration of simultaneous intervention on both culprit and non‐culprit lesions during the same index procedure, thus suggesting possible benefits in otherwise haemodynamically stable people presenting with STEMI and MVD.
There are several meta‐analyses that have previously shown that complete revascularisation and culprit‐only intervention strategies have similar outcomes. For example, Vlaar 2011 showed in their meta‐analysis of four prospective studies that there was no difference in short (odds ratio (OR) 1.98, 95% CI 0.57 to 6.85) or long‐term mortality (OR 1.45, 95% CI 0.61 to 3.46). Similarly Bagai 2013, after analysing three RCTs, showed that the strategies were similar (OR 0.81, 95% CI 0.32 to 2.06).
In contrast, more recently published meta‐analyses have shown that complete revascularisation strategy is superior to the culprit‐only intervention strategy. Sardar 2015 included five RCTs and they found that, compared to a culprit‐vessel‐only intervention strategy, complete revascularisation was associated with a significant reduction in revascularisation (OR 0.32, 95% CI 0.21 to 0.49), cardiovascular mortality (OR 0.44, 95% CI 0.20 to 0.94), and recurrent myocardial infarction (OR 0.35, 95% CI 0.18 to 0.69). In Elgendy 2015, the pooled analysis of six RCTs showed that the complete revascularisation strategy lowered the risk of urgent revascularisation (RR 0.55, 95% CI 0.35 to 0.86), but the strategies did not differ in terms of mortality (RR 0.68, 95% CI 0.4 to 1.14) and myocardial infarction (RR 0.56, 95% CI 0.24 to 1.27). In the editorial comment by Bhatt 2015, the pooled analysis of the PRAMI 2013 and CvLPRIT 2015 trials showed that, compared with the culprit‐only intervention group, the complete revascularisation strategy was associated with a lower cardiovascular mortality, revascularisation, and myocardial infarction. Similarly, Pandit 2014 demonstrated that the complete revascularisation strategy was associated with reduced cardiovascular deaths (OR 0.39, 95% CI 0.18 to 0.83), revascularisation (OR 0.28, 95% CI 0.18 to 0.44), and non‐fatal myocardial infarction (OR 0.38, 95% CI 0.20 to 0.75). In Bangalore 2015, the complete revascularisation strategy was associated with lower mortality (RR 0.60, 95% CI 0.38 to 0.97), cardiovascular mortality (RR 0.38, 95% CI 0.20 to 0.73), and revascularisation (RR 0.42, 95% CI 0.31 to 0.57). In Bainey 2014, it was shown that complete revascularisation strategy lowered in‐hospital mortality (OR 0.24, 95% CI 0.06 to 0.91) and need for revascularisation (OR 0.31, 95% CI 0.17 to 0.57). In terms of long‐term mortality, the strategies appeared to be similar (OR 0.61, 95% CI 0.28 to 1.33).
Although our present systematic review is consistent with the previously published reviews and meta‐analyses, this is the largest, most comprehensive, and only systematic review that included only RCTs, showing that complete revascularisation strategy is associated with a long‐term reduction in cardiovascular mortality, non‐fatal myocardial infarction, and revascularisation. Furthermore, this is the only systematic review in this area that has utilised GRADE to evaluate the quality of the evidence, and to include a TSA in order to control the type I and II errors and to predict if the total number of participants included in the meta‐analysis was enough to draw conclusions regarding the effects of complete revascularisation.

Study flow diagram.

Risk of bias graph: review authors' judgements about each risk of bias item presented as percentages across all included studies.

Risk of bias summary: review authors' judgements about each risk of bias item for each included study.

Trial Sequential Analysis for complete versus culprit‐only revascularisation on long‐term all‐cause mortality. The diversity‐adjusted required information size (DARIS) was calculated based on an expected relative risk reduction (RRR) of 20% from proportion event in control (Pc) group of 6.3% with an alpha of 2% and beta of 10%.
Trial Sequential Analysis for complete versus culprit‐only revascularisation on long‐term cardiovascular mortality. The diversity‐adjusted required information size (DARIS) was calculated based on an expected relative risk reduction (RRR) of 20% from Pc group of 4.7% with an alpha of 2% and beta of 10%.

Trial Sequential Analysis for complete versus culprit‐only revascularisation on long‐term non‐fatal myocardial infarction. The diversity‐adjusted required information size (DARIS) was calculated based on an expected relative risk reduction (RRR) of 20% from Pc group of 7.0% with an alpha of 2% and beta of 10%.
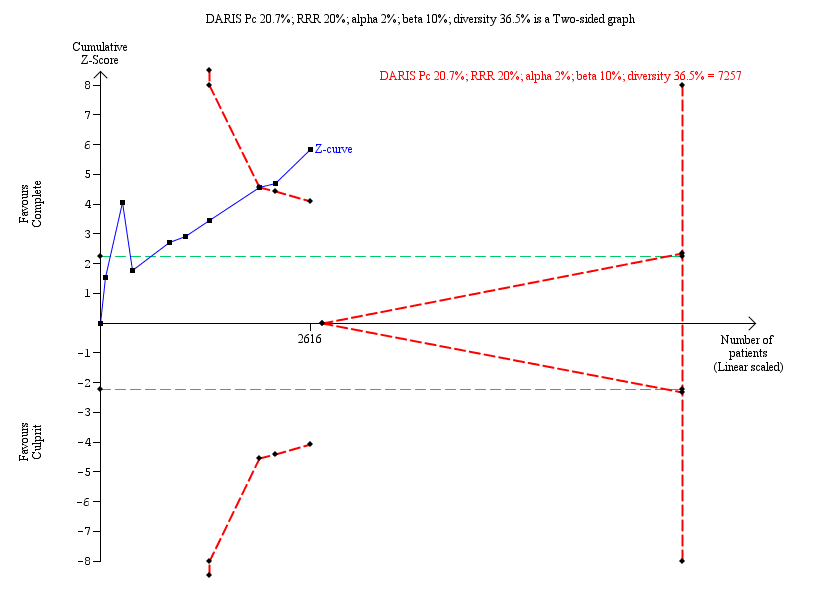
Trial Sequential Analysis for complete versus culprit‐only revascularisation on long‐term revascularisation. The diversity‐adjusted required information size (DARIS) was calculated based on an expected relative risk reduction (RRR) of 20% from Pc group of 20.7% with an alpha of 2% and beta of 10%.

Comparison 1 Primary outcomes, Outcome 1 Long‐term all‐cause mortality.
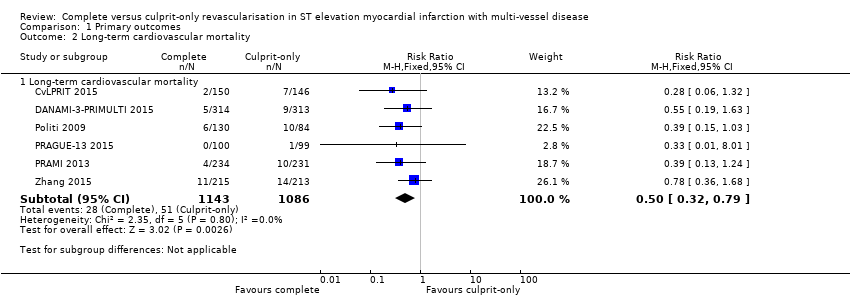
Comparison 1 Primary outcomes, Outcome 2 Long‐term cardiovascular mortality.

Comparison 1 Primary outcomes, Outcome 3 Long‐term non‐fatal myocardial infarction.
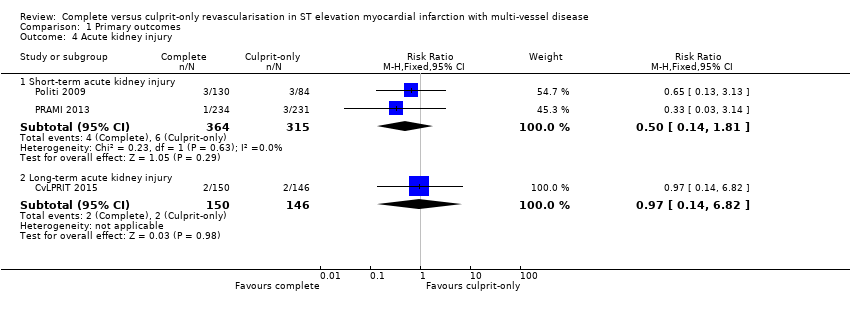
Comparison 1 Primary outcomes, Outcome 4 Acute kidney injury.
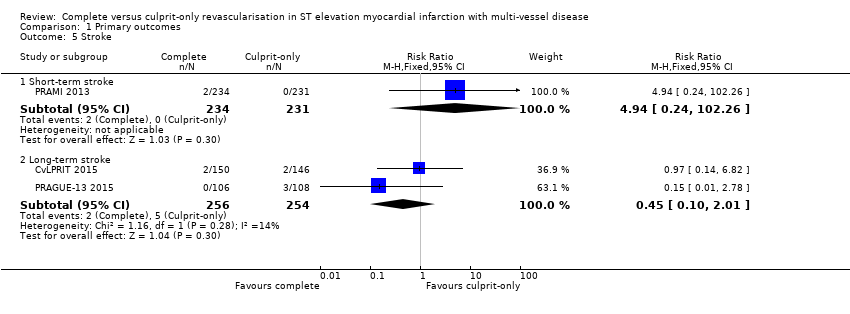
Comparison 1 Primary outcomes, Outcome 5 Stroke.

Comparison 1 Primary outcomes, Outcome 6 Bleeding.
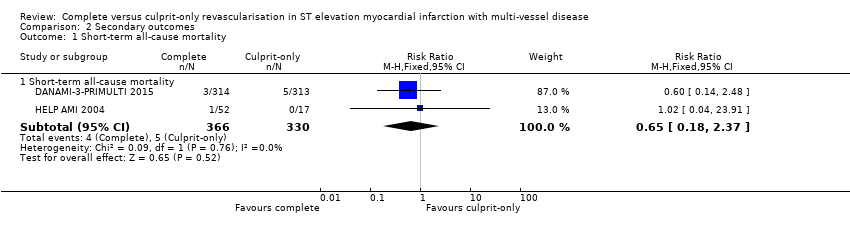
Comparison 2 Secondary outcomes, Outcome 1 Short‐term all‐cause mortality.
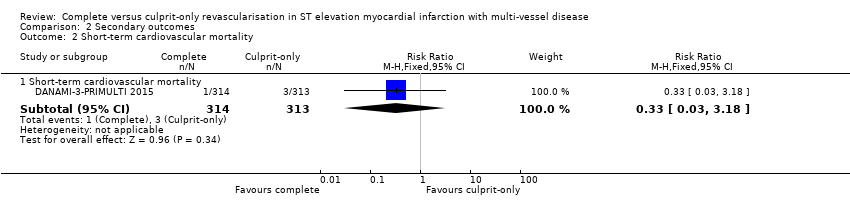
Comparison 2 Secondary outcomes, Outcome 2 Short‐term cardiovascular mortality.

Comparison 2 Secondary outcomes, Outcome 3 Short‐term non‐fatal myocardial infarction.
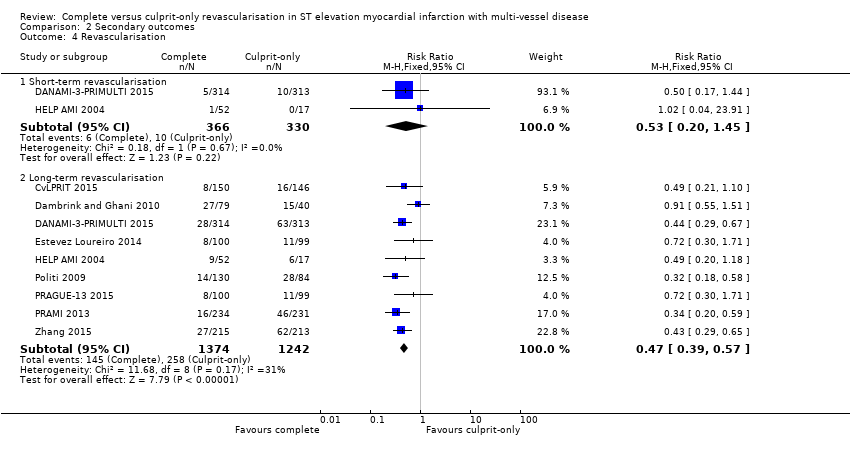
Comparison 2 Secondary outcomes, Outcome 4 Revascularisation.

Comparison 2 Secondary outcomes, Outcome 5 Cost ≥ 1 year.
| Complete revascularisation compared to culprit‐only revascularisation in ST elevated myocardial infarction with multi‐vessel disease | ||||||
| Patient or population: people with STEMI and MVD. | ||||||
| Outcomes | Anticipated absolute effects* (95% CI) | Relative effect | No of participants | Quality of the evidence | Comments | |
| Risk with culprit only | Risk with complete revascularisation | |||||
| Long‐term all‐cause mortality (≥ 1 year after the intervention) | Study population | RR 0.80 | 2417 | ⊕⊝⊝⊝ | PRAMI study terminated early. CvLPRIT and PRAMI concerning for attrition bias. Only CvLPRIT was judged to have low risk for selection bias. | |
| 63 per 1000 | 50 per 1000 | |||||
| Long‐term cardiovascular mortality (≥ 1 year after the intervention) | Study population | RR 0.50 | 2229 | ⊕⊝⊝⊝ | PRAMI study terminated early. CvLPRIT and PRAMI concerning for attrition bias. Only CvLPRIT was judged to have low risk for selection bias. | |
| 47 per 1000 | 23 per 1000 | |||||
| Long‐term myocardial infarction (≥ 1 year after the intervention) | Study population | RR 0.62 | 2099 | ⊕⊝⊝⊝ | PRAMI study terminated early. CvLPRIT and PRAMI concerning for attrition bias. Only CvLPRIT was judged to have low risk for selection bias. | |
| 70 per 1000 | 43 per 1000 | |||||
| Overall adverse events (pooled short and long term) | Study population | OR 0.84 | 4086 | ⊕⊝⊝⊝ | PRAMI study terminated early. CvLPRIT and PRAMI concerning for attrition bias. Only CvLPRIT was judged to have low risk for selection bias. Open label to the operator may affect this outcome. | |
| 29 per 1000 | 24 per 1000 | |||||
| Short‐term all‐cause mortality (within the first 30 days after the intervention) | Study population | RR 0.65 | 696 | ⊕⊝⊝⊝ | HELP‐AMI trial did not describe in detail their methodology to analyse for bias. | |
| 15 per 1000 | 10 per 1000 | |||||
| Long‐term revascularisation (≥ 1 year after the intervention) | Study population | RR 0.47 | 2616 | ⊕⊝⊝⊝ | PRAMI study terminated early. CvLPRIT and PRAMI concerning for attrition bias. Only CvLPRIT was judged to have low risk for selection bias. Open label to the operator may affect this outcome. | |
| 208 per 1000 | 98 per 1000 | |||||
| *The risk in the intervention group (and its 95% confidence interval) is based on the assumed risk in the comparison group and the relative effect of the intervention (and its 95% CI). CI: confidence interval; MVD: multi‐vessel disease; RCT: randomised controlled trial; RR: risk ratio; STEMI: ST elevated myocardial infarction. | ||||||
| GRADE Working Group grades of evidence | ||||||
| 1 Downgraded due to publication (reporting) bias. 2 Downgraded due to study limitations (largely risk of attrition bias and selection bias). 3 Downgraded because of indirectness: black and Hispanic people, as well as women were under‐represented. 4 Downgraded due to imprecision. | ||||||
| Study | Dates | Complete revascularisation (staged vs 1 time) | Intervention criteria in non‐culprit vessel | Mean follow‐up (years) | Description multi‐vessel disease | Country | Number of centres |
| May 2011 to May 2013 | At index procedure or before discharge. 65% of participants in invasive group had at index procedure. | > 70% diameter stenosis in 1 plane or > 50% in 2 planes. | 2.5 | Culprit vessel plus ≥ 1 non‐infarct‐related epicardial artery with ≥ 1 lesion deemed angiographically significant (> 70% stenosis in 1 plane or > 50% in 2 planes). | UK | 7 | |
| June 2004 to February 2007. | Staged 7.5 days after P‐PCI. | FFR < 0.75 and in stenosis > 90%, PCI was performed without FFR measurement. PCI was with BMS or DES. | 3 | ≥ 1 significant stenosis (> 50% stenosis in ≥ 1 view) in ≥ 2 major epicardial coronary arteries, or the combination of a side branch and a main epicardial vessel provided that they supplied different territories. | The Netherlands | 1 | |
| March 2011 to February 2014 | Staged 2 days after P‐PCI. | FFR < 0.8 and those > 90% stenotic arteries visually. | 2.2 | Significant stenosis (> 50% stenosis visually in arteries > 2 mm diameter) in ≥ 1 of the non‐culprit epicardial coronary arteries or their major side branches in addition to the infarct‐related artery. | Denmark | 2 | |
| 2010 to 2013 | Staged. | Complete. Criteria not described in study. | 1 | NR. | Spain | NR | |
| NR | Index procedure. | Not described. | 1 | NR. | Not described | NR | |
| January 2003 to December 2007 | At index procedure or staged mean 56 days after P‐PCI. 50% participants of complete revascularisation had at intervention of the non‐culprit lesions at index procedure. | > 70% diameter stenosis. | 2.5 | > 70% diameter stenosis of ≥ 2 epicardial coronary arteries or their major branches by visual estimation. | Not described | NR | |
| September 2008 to December 2014 | Staged between 3 and 40 days after P‐PCI. | > 70% stenosis of non‐culprit coronary artery. | 3 | ≥ 1 vessel, beside the culprit vessel, with significant stenosis (> 70% stenosis). | Czech Republic | 6 | |
| April 2008 to January 2013 | At index procedure. | Stenosis ≥ 50%. | 2 | The presence of stenosis ≥ 50% in ≥ 1 coronary artery other than the culprit vessel. | UK | 5 | |
| January 2009 to June 2012 | Staged between 7 and 10 days after P‐PCI. | 75% to 90%. | 2 | Non‐culprit vessel with significant stenosis (75% to 90% stenosis). | China | NR | |
| BMS: bare‐metal stent; DES: drug‐eluting stent; FFR: fractional flow reserve; NR: not reported in the article; PCI: percutaneous coronary intervention; P‐PCI: primary percutaneous coronary intervention. | |||||||
| Study | Group | Sample size (n) | Participants (n (%)) | Dropouts (n (%)) | % Male | Mean age (years) | % HTN | % DM | % HLD | % Prior MI | % Anterior STEMI |
| Complete | 150 | 139 (92.7) | 11 (7.3) | 85.3 | 64.6 | 36 | 12.7 | 27.3 | 4.7 | 36 | |
| Culprit‐only | 146 | 139 (95.2) | 8 (5.5) | 76.7 | 65.3 | 35 | 13.7 | 23.3 | 3.4 | 35.6 | |
| Complete | 80 | 71 (88.8) | 1 (1.3) | 80 | 62 | 26.3 | 6.3 | 15 | 6.3 | 21.3 | |
| Culprit‐only | 41 | 41 (100) | 1 (2.4) | 80.5 | 61 | 42.5 | 5 | 30 | 4.9 | 23.3 | |
| Complete | 314 | 294 (93.6) | 1 (0.3) | 80 | 64 | 41.4 | 9.2 | NR | 5.4 | 33.4 | |
| Culprit‐only | 313 | 313 (100) | 0 | 81.5 | 63 | 46.6 | 13.4 | NR | 8.6 | 35.8 | |
| Complete | 100 | NR | NR | NR | NR | NR | NR | NR | NR | NR | |
| Culprit‐only | 99 | NR | NR | NR | NR | NR | NR | NR | NR | NR | |
| Complete | 52 | NR | NR | 88.5 | 63.5 | 36.5 | 11.5 | 41.2 | NR | 52 | |
| Culprit‐only | 17 | NR | NR | 82.4 | 65.3 | 58.8 | 41.2 | 53 | NR | 59 | |
| Complete | 130 | NR | NR | 78.5 | 64 | 57 | 16.2 | NR | NR | 45.4 | |
| Culprit‐only | 84 | NR | NR | 76.2 | 66.5 | 60 | 23.8 | NR | NR | 41.7 | |
| Complete | 106 | NR | NR | NR | NR | NR | NR | NR | NR | NR | |
| Culprit‐only | 108 | NR | NR | NR | NR | NR | NR | NR | NR | NR | |
| Complete | 234 | 223 (95.3) | 10 (4.3) | 75.6 | 62 | 40.2 | 15 | NR | 8.1 | 28.6 | |
| Culprit‐only | 231 | 229 (99) | 8 (3.5) | 80.5 | 62 | 40.3 | 20.8 | NR | 7 | 38.5 | |
| Complete | 215 | NR | NR | 61 | 62.3 | 64.2 | 36.7 | 35.3 | NR | 36.7 | |
| Culprit‐only | 213 | NR | NR | 67.1 | 62 | 61 | 35.2 | 36.6 | NR | 40 | |
| DM: diabetes mellitus; HLD: hyperlipidaemia; HTN: hypertension; MI: myocardial infarction; n: number of participants; NR: not reported in the article; STEMI: ST elevated myocardial infarction. | |||||||||||
| Study | Group | Symptoms to PCI time (minute) | PCI without stenting (n (%)) | DES (n (%)) | BMS (n (%)) | 2‐Vessel disease (n (%)) | 3‐Vessel disease (n (%)) | Received PCI non‐culprit (n (%)) | DAPT | DAPT duration |
| Complete | 182 | NR | 141 (94) | NR | 119 (79.3) | 31 (20.7) | 139 (92.7) | Yes | NR | |
| Culprit‐only | 159 | NR | 127 (87) | NR | 110 (75.3) | 36 (24.7) | 0 | |||
| Complete | NR | 6 (7.5) | 18 (22.5) | 56 (70) | 60 (75) | 20 (25) | 48 (60) | Yes | 1 month | |
| Culprit‐only | NR | 7 (17.1) | 7 (7.1) | 27 (66) | 33 (80.5) | 8 (19.5) | 0 | |||
| Complete | NR | 12 (3.8) | 298 (95) | 0 | NR | 97 (31) | 193 (61.5) | Yes | 1 year | |
| Culprit‐only | NR | 18 (5.8) | 290 (92.7) | 0 | NR | 100 (32) | 0 | |||
| Complete | NR | NR | NR | NR | NR | NR | NR | NR | NR | |
| Culprit‐only | NR | NR | NR | NR | NR | NR | NR | |||
| Complete | 210 | 0 | 52 (100) | 0 | 36 (69) | 16 (30.8) | NR | Yes | 1 month | |
| Culprit‐only | 236 | 0 | 17 (100) | 0 | 9 (53) | 8 (47) | NR | |||
| Complete | NR | NR | 11 (8.5) | NR | NR | 48 (37) | NR | NR | NR | |
| Culprit‐only | NR | NR | 10 (12) | NR | NR | 21 (25) | NR | |||
| Complete | NR | NR | NR | NR | NR | NR | NR | NR | NR | |
| Culprit‐only | NR | NR | NR | NR | NR | NR | NR | |||
| Complete | NR | 1 (< 1) | 147 (63) | 86 (37) | 143 (61.1) | 91 (39) | 223 (95.3) | Yes | 1 month | |
| Culprit‐only | NR | 0 | 135 (58) | 96 (42) | 155 (67.1) | 76 (33) | 2 (1) | |||
| Complete | 214 | 0 | 215 (100) | 0 | NR | NR | NR | NR | NR | |
| Culprit‐only | 227 | 0 | 213 (100) | 0 | NR | NR | NR | |||
| BMS: bare‐metal stent; DAPT: dual antiplatelet therapy; DES: drug‐eluting stent; n: number of participants; NR: not reported in the article; PCI: percutaneous coronary intervention. | ||||||||||
| Outcome or subgroup title | No. of studies | No. of participants | Statistical method | Effect size |
| 1 Long‐term all‐cause mortality Show forest plot | 8 | Risk Ratio (M‐H, Fixed, 95% CI) | Subtotals only | |
| 1.1 Long‐term all‐cause mortality | 8 | 2417 | Risk Ratio (M‐H, Fixed, 95% CI) | 0.80 [0.58, 1.11] |
| 2 Long‐term cardiovascular mortality Show forest plot | 6 | Risk Ratio (M‐H, Fixed, 95% CI) | Subtotals only | |
| 2.1 Long‐term cardiovascular mortality | 6 | 2229 | Risk Ratio (M‐H, Fixed, 95% CI) | 0.50 [0.32, 0.79] |
| 3 Long‐term non‐fatal myocardial infarction Show forest plot | 6 | Risk Ratio (M‐H, Fixed, 95% CI) | Subtotals only | |
| 3.1 Long‐term non‐fatal myocardial infarction | 6 | 2099 | Risk Ratio (M‐H, Fixed, 95% CI) | 0.62 [0.44, 0.89] |
| 4 Acute kidney injury Show forest plot | 3 | Risk Ratio (M‐H, Fixed, 95% CI) | Subtotals only | |
| 4.1 Short‐term acute kidney injury | 2 | 679 | Risk Ratio (M‐H, Fixed, 95% CI) | 0.50 [0.14, 1.81] |
| 4.2 Long‐term acute kidney injury | 1 | 296 | Risk Ratio (M‐H, Fixed, 95% CI) | 0.97 [0.14, 6.82] |
| 5 Stroke Show forest plot | 3 | Risk Ratio (M‐H, Fixed, 95% CI) | Subtotals only | |
| 5.1 Short‐term stroke | 1 | 465 | Risk Ratio (M‐H, Fixed, 95% CI) | 4.94 [0.24, 102.26] |
| 5.2 Long‐term stroke | 2 | 510 | Risk Ratio (M‐H, Fixed, 95% CI) | 0.45 [0.10, 2.01] |
| 6 Bleeding Show forest plot | 4 | Risk Ratio (M‐H, Fixed, 95% CI) | Subtotals only | |
| 6.1 Short‐term bleeding | 3 | 1213 | Risk Ratio (M‐H, Fixed, 95% CI) | 1.00 [0.53, 1.86] |
| 6.2 Long‐term bleeding | 2 | 923 | Risk Ratio (M‐H, Fixed, 95% CI) | 0.79 [0.45, 1.41] |
| Outcome or subgroup title | No. of studies | No. of participants | Statistical method | Effect size |
| 1 Short‐term all‐cause mortality Show forest plot | 2 | Risk Ratio (M‐H, Fixed, 95% CI) | Subtotals only | |
| 1.1 Short‐term all‐cause mortality | 2 | 696 | Risk Ratio (M‐H, Fixed, 95% CI) | 0.65 [0.18, 2.37] |
| 2 Short‐term cardiovascular mortality Show forest plot | 1 | Risk Ratio (M‐H, Fixed, 95% CI) | Subtotals only | |
| 2.1 Short‐term cardiovascular mortality | 1 | 627 | Risk Ratio (M‐H, Fixed, 95% CI) | 0.33 [0.03, 3.18] |
| 3 Short‐term non‐fatal myocardial infarction Show forest plot | 1 | Risk Ratio (M‐H, Fixed, 95% CI) | Subtotals only | |
| 3.1 Short‐term non‐fatal myocardial infarction | 1 | 627 | Risk Ratio (M‐H, Fixed, 95% CI) | 1.74 [0.52, 5.90] |
| 4 Revascularisation Show forest plot | 9 | Risk Ratio (M‐H, Fixed, 95% CI) | Subtotals only | |
| 4.1 Short‐term revascularisation | 2 | 696 | Risk Ratio (M‐H, Fixed, 95% CI) | 0.53 [0.20, 1.45] |
| 4.2 Long‐term revascularisation | 9 | 2616 | Risk Ratio (M‐H, Fixed, 95% CI) | 0.47 [0.39, 0.57] |
| 5 Cost ≥ 1 year Show forest plot | 1 | 69 | Mean Difference (IV, Fixed, 95% CI) | ‐1948.0 [‐9171.85, 5275.85] |