Neuroestimulación eléctrica transcutánea (TENS) para el dolor neuropático en adultos
Resumen
Antecedentes
El dolor neuropático, que es causado por enfermedades o daño en los nervios, representa una carga significativa en los pacientes y la sociedad. Puede ser particularmente desagradable y el logro de un control adecuado de los síntomas puede ser difícil. A menudo los pacientes con dolor neuropático emplean métodos no farmacológicos de tratamiento que pueden incluir la neuroestimulación eléctrica transcutánea (TENS). Esta revisión reemplaza una Revisión Cochrane, “Estimulación nerviosa eléctrica transcutánea (ENET) para el dolor crónico” (Nnoaham 2014), y un protocolo retirado, “Estimulación nerviosa eléctrica transcutánea (ENET) para el dolor neuropático en adultos” (Claydon 2014). Esta revisión reemplaza el protocolo original para el dolor neuropático que fue retirado.
Objetivos
Determinar la efectividad analgésica de la TENS versus TENS placebo (simulada), TENS versus atención habitual, TENS versus ningún tratamiento y TENS además de atención habitual versus atención habitual sola en el tratamiento del dolor neuropático en pacientes adultos.
Métodos de búsqueda
Se hicieron búsquedas en CENTRAL, MEDLINE, Embase, PsycINFO, AMED, CINAHL, Web of Science, PEDro, LILACS (hasta septiembre de 2016) y en varios registros de ensayos clínicos. También se realizaron búsquedas en bibliografías de los estudios incluidos para obtener otros estudios relevantes.
Criterios de selección
Se incluyeron los ensayos controlados aleatorizados en los que la TENS se evaluó en el tratamiento del dolor neuropático central o periférico. Los estudios se incluyeron si investigaron lo siguiente: TENS versus TENS placebo (simulada), TENS versus atención habitual, TENS versus ningún tratamiento y TENS además de atención habitual versus atención habitual sola en el tratamiento del dolor neuropático en pacientes adultos.
Obtención y análisis de los datos
Dos autores de la revisión examinaron de forma independiente todos los resultados de la búsqueda en las bases de datos e identificaron los artículos que requerían una evaluación del texto completo. Posteriormente, dos autores de la revisión aplicaron de forma independiente los criterios de inclusión/exclusión a estos estudios. Los mismos autores de la revisión extrajeron los datos de forma independiente, evaluaron el riesgo de sesgo utilizando la herramienta Cochrane estándar y calificaron la calidad de la evidencia mediante GRADE.
Resultados principales
Se incluyeron 15 estudios con 724 participantes. Se encontró una variedad de protocolos de tratamiento relacionados con la duración de la atención, la cantidad de aplicaciones de la TENS y la intensidad de la aplicación. En resumen, la duración de la atención varió de cuatro días a tres meses. De manera similar, se encontró una variación en los tiempos de aplicación de la ; desde 15 minutos hasta sesiones de una hora aplicadas cuatro veces al día. Habitualmente se encontró una intensidad de la TENS establecida hasta lograr un cosquilleo perceptible aceptable, y hubo escasos estudios que aumentaron la dosis para mantener dicha percepción. De las comparaciones que se había planificado explorar, sólo fue posible realizar una síntesis cuantitativa para la TENS versus TENS simulada. Los datos insuficientes y la gran diversidad en las condiciones control impidieron la realización de una síntesis cuantitativa para las comparaciones restantes.
Para la TENS comparada con la TENS simulada, cinco estudios fueron elegibles para el análisis agrupado. Los estudios restantes se describieron en forma narrativa. En general, 11 estudios se consideraron con alto riesgo de sesgo, y cuatro con riesgo incierto. Debido al escaso número de estudios elegibles, los niveles altos de riesgo de sesgo entre los estudios y los tamaños de la muestra pequeños, la calidad de la evidencia se consideró muy baja para el análisis agrupado y la calificación individual de los resultados de los estudios únicos fue muy baja según GRADE. En el caso de los estudios individuales analizados de forma narrativa, las limitaciones metodológicas, la calidad del informe y la naturaleza heterogénea de las intervenciones comparadas no permitieron hacer estimaciones generales fiables del efecto de la ENET.
Cinco estudios (a través de diversos trastornos neuropáticos) que investigaron el cambio en la intensidad del dolor mediante una escala analógica visual, fueron apropiados para el análisis agrupado de TENS versus TENS simulada. Se encontró una diferencia media posintervención en el tamaño del efecto a favor de la ENET de ‐1,58 (intervalo de confianza [IC] del 95%: ‐2,08 a ‐1,09, p < 0,00001, n = 207, seis comparaciones de cinco estudios) (evidencia de calidad muy baja). No hubo heterogeneidad significativa en este análisis. Aunque esta cifra excedió la diferencia mínimamente importante predeterminada para los resultados de dolor, la calidad de la evidencia se consideró muy baja, lo que significa que existe muy poca confianza en esta estimación del efecto y es probable que el efecto verdadero sea significativamente diferente del informado en esta revisión. Sólo un estudio de estos cinco investigó la calidad de vida relacionada con la salud como un resultado, lo que significa que no fue posible informar sobre este resultado en esta comparación. De igual manera, no fue posible informar sobre la impresión global del cambio o los cambios en la administración de analgésicos en este análisis agrupado.
Diez estudios pequeños compararon la TENS con alguna forma de atención habitual. Sin embargo, hubo gran diversidad en lo que constituyó la atención habitual, lo que impidió el agrupamiento de los datos. La mayoría de estos estudios no encontraron diferencias en los resultados de dolor entre la TENS versus otros tratamientos activos o estuvieron a favor de la intervención de comparación (evidencia de calidad muy baja). No fue posible informar sobre otros resultados primarios y secundarios de estos ensayos individuales (calidad de vida relacionada con la salud, impresión global del cambio y cambios en la administración de analgésicos).
De los 15 estudios incluidos, tres informaron eventos adversos que fueron leves y limitados a la “irritación de la piel” en o alrededor del sitio de la colocación de los electrodos (evidencia de calidad muy baja). Tres estudios no informaron eventos adversos mientras que los restantes no informaron detalles con respecto a los eventos adversos.
Conclusiones de los autores
En esta revisión, se informó sobre la comparación entre la TENS y la TENS simulada. La calidad de la evidencia fue muy baja, lo que significa que no fue posible establecer con seguridad si la TENS es efectiva para el control del dolor en los pacientes con dolor neuropático. La calidad muy baja de la evidencia significa que hay una confianza muy limitada en la estimación del efecto informada; es probable que el efecto verdadero sea significativamente diferente. Se realizan recomendaciones con respecto a los diseños de los estudio futuros de la TENS que pueden reducir significativamente la incertidumbre relacionada con la efectividad de esta modalidad de tratamiento.
PICO
Resumen en términos sencillos
Neuroestimulación eléctrica transcutánea (TENS) para el dolor neuropático
Conclusión
En los pacientes adultos con dolor neuropático, no es posible establecer con seguridad si la TENS es efectiva para aliviar el dolor en comparación con la TENS simulada.
Antecedentes
El dolor neuropático es el dolor causado por lesiones o enfermedades en los nervios y puede ser difícil de tratar de forma efectiva. Puede ocurrir después de una lesión nerviosa directa o desarrollarse debido a problemas como la diabetes, el herpes y el síndrome del túnel carpiano. La TENS es un tratamiento común para diversas afecciones dolorosas. Incluye el uso de una unidad pequeña operada con batería para aplicar corrientes eléctricas de bajo nivel a través de electrodos adheridos a la piel. Este procedimiento se ha indicado para el alivio del dolor.
Pregunta de la revisión
¿La TENS mejora la intensidad del dolor y la calidad de vida relacionada con la salud en los pacientes adultos con dolor neuropático?
Características de los estudios
Se examinaron todos los ensayos clínicos elegibles que compararon TENS con TENS “falsa” (simulada), atención habitual o ningún tratamiento, o que compararon TENS más atención habitual versus atención habitual solamente, para el dolor neuropático en pacientes adultos. Hasta septiembre de 2016 se encontraron 15 estudios elegibles para inclusión. De estos 15 estudios, fue posible combinar los resultados de cinco para investigar el efecto de la TENS en comparación con TENS simulada para el tratamiento del dolor. Los estudios incluyeron un rango de problemas de dolor neuropático (p.ej., pacientes con lesión en la médula espinal, dolor lumbar con afectación de los nervios, complicaciones asociadas con la diabetes, etc.). Se encontró que la calidad de los estudios en general fue baja.
Hallazgos clave
No fue posible determinar con seguridad si la TENS es efectiva para aliviar el dolor en comparación con la TENS simulada en pacientes con dolor neuropático. Lo anterior se debe a la calidad muy baja de la evidencia, lo que significa que existe una confianza muy limitada en este resultado y que es probable que los estudios futuros cambien este resultado. La falta de datos informados hizo que no fuera posible establecer conclusiones sobre el efecto del tratamiento con TENS sobre la calidad de vida relacionada con la salud, la administración de fármacos para el alivio del dolor o la impresión del paciente de cómo la TENS modificó su afección.
Se describieron los resultados de diez estudios adicionales que compararon la TENS con otros tipos de tratamiento. Hubo cierta variabilidad en estos diez estudios y, por lo tanto, no se pudieron combinar ni analizar en conjunto. Lo anterior, junto con la calidad muy baja de estos diez estudios, hizo que no se pudiera evaluar el alivio del dolor, la calidad de vida relacionada con la salud, la administración de fármacos para el alivio del dolor ni la impresión del cambio.
En tres de los 15 estudios, algunos pacientes que recibieron TENS presentaron irritación de la piel bajo las almohadillas de los electrodos. Tres estudios no informaron problemas y los estudios restantes no proporcionaron detalles sobre los efectos secundarios. Sobre la base de estos datos, es poco realista hacer señalamientos sobre los efectos secundarios asociados con el uso de TENS.
Authors' conclusions
Summary of findings
| TENS versus sham TENS for neuropathic pain in adults | ||||
| Patient or population: adults with neuropathic pain Settings: secondary care Intervention/comparison: TENS vs sham TENS Outcome: Pain intensity (VAS) | ||||
| Outcomes | Effect estimate (95% CI) | No of participants | Quality of the evidence | Comments |
|---|---|---|---|---|
| Post‐intervention pain intensity (VAS 0‐10) | Favoured TENS. Mean difference ‐1.58 (95% CI ‐2.08 to ‐1.09) | 207 (5) | ⊕⊝⊝⊝ Very lowa | Downgraded 3 levels due to multiple sources of potential bias, small number and size of studies. |
| Health related quality of life | No data | ‐ | ‐ | ‐ |
| Participant global impression of change | No data | ‐ | ‐ | ‐ |
| Analgesic medication use | Not estimable | ‐ | ‐ | ‐ |
| Incidence/nature of adverse events | Not estimable | ‐ | ‐ | ‐ |
| CI: confidence interval; TENS: transcutaneous electrical nerve stimulation; VAS: visual analogue scale. | ||||
| GRADE Working Group grades of evidence | ||||
| aDowngraded twice for limitations of studies and once for imprecision. | ||||
Background
Description of the condition
Neuropathic pain is defined as "pain caused by a lesion or disease of the somatosensory system" and represents a significant source of chronic pain and loss of function at both an individual and societal level (Jensen 2011). Approximately 20% of adults in the USA and 27% in the EU report chronic pain (Kennedy 2014; Leadley 2012). Within this, it is estimated that 20% of people with chronic pain will have neuropathic pain characteristics, translating to an approximate prevalence of 6% to 7% in the general population (Bouhassira 2008). This is confirmed by one systematic review that estimated a population prevalence for neuropathic pain of 6.9% to 10% (van Hecke 2014). Neuropathic pain is often rated as particularly intense and distressing and can have a significant negative impact on activities of daily living and quality of life (Leadley 2014; McDermott 2006; Moore 2014).
Neuropathic pain may be classified as peripheral or central in origin depending on the site of lesion or disease. Peripheral neuropathic pain results from injury or disease of the peripheral nerves and includes conditions such as post‐traumatic nerve injury, diabetic peripheral neuropathy (or painful diabetic neuropathy (PDN)) and postherpetic neuralgia (PHN). Central neuropathic pain results from injury or disease affecting the central nervous system (spinal cord, brainstem or brain) and includes central poststroke pain, postspinal cord injury pain and pain related to multiple sclerosis. Regardless of the causal condition or classification there are common features associated with neuropathic pain. Typically, neuropathic pain is associated with positive features such as spontaneous pain, hyperalgesia (excessive pain to a painful stimulus) and allodynia (pain evoked by a normally non‐painful stimulus), as well as negative features such as sensory loss, weakness and hypoaesthesia (reduced sense of touch or sensation) (Baron 2010; Vranken 2012). For patients, this translates to pain being caused by innocuous stimuli such as light touch or gentle movement, increased pain in response to noxious stimuli, and reduced sensory and motor function (Baron 2010; Maier 2010; Vranken 2012). Additionally, pain may be perceived in the absence of provoking stimuli (Baron 2010; Baron 2012).
The mechanisms underpinning this persistent pain state are complex. It is most likely that a mix of peripheral and central mechanisms are responsible for ongoing pain perception. Following a lesion or disease in a peripheral somatosensory structure (e.g. peripheral nerve), inflammatory mediators are released that causes sensitisation of nociceptors (nerve receptors that respond to tissue damaging stimuli or threat of damage) resulting in lowered stimulation thresholds and enhanced activity in these receptors (Cohen 2014). Damage to neural structures (at both peripheral nerve and central nervous system levels) can result in longer term changes to their structure and function (Black 2008; Levinson 2012), resulting in abnormal or excessive activity in areas of damaged neural tissue that is thought to lead to ongoing and often severe and intractable pain (Cohen 2014). These changes may also be accompanied by a decreased capacity of the body's natural pain modulation mechanisms (known as endogenous analgesia), further compounding the pain perceived (Baron 2010). These multiple, integrated pain mechanisms result in neuropathic pain being particularly difficult to treat and ongoing pain with limited response to treatment is common. First line management of neuropathic pain is primarily pharmacological (Dworkin 2013; O'Connor 2009); however, it is also common for management to include non‐pharmacological treatments such as psychological or physical interventions including transcutaneous electrical nerve stimulation (TENS). Standard TENS units are portable, widely available, easily self‐administered and are a popular adjunct therapy for people with chronic neuropathic pain (Johnson 2011).
Description of the intervention
TENS is the therapeutic application of transcutaneous (over the skin) electrical stimulation and is primarily used for pain control in a wide range of acute and chronic pain conditions (APTA 2001). TENS units typically use adhesive electrodes applied to the skin surface to apply pulsed electrical stimulation that can be modified in terms of frequency (stimulation rate), intensity and duration (Johnson 2011). TENS application is commonly described as being in either high or low frequency modes. Low frequency TENS is consistently defined as being 10 Hz or less (Bjordal 2003; Moran 2011; Sabino 2008), while high frequency TENS typically appears to be described as ranging up to 50 Hz or 100 Hz and above (Moran 2011; Santos 2013; Sluka 2003; Sluka 2005). Low frequency TENS is often used at higher intensities eliciting motor contraction, while high frequency TENS has traditionally been used at lower intensities (Walsh 2009). Modulated TENS applies stimulation across a range of frequencies and may help ameliorate development of tolerance to TENS (Sluka 2013).
Intensity appears to be a critical factor in optimising TENS efficacy and increasingly it is thought that regardless of frequency of application, the intensity needs to produce a strong, non‐painful sensation that ideally is titrated during treatment to maintain the intensity level (Bjordal 2003; Moran 2011; Sluka 2013). To account for the suggested importance of this, it was proposed that this review would undertake a subgroup analysis based on intensity: strong and titrated versus all other application of intensities. Placement of electrodes may influence response, although this issue is somewhat ambiguous with local, related spinal segment and contralateral electrode placement demonstrating an effect in both animal and human studies (Brown 2007; Chesterton 2003; Dailey 2013; Sabino 2008; Somers 2009). Timing of outcome measurement requires consideration when analysing TENS studies as theory predicts that the TENS analgesia induced should peak during or immediately after use (Sluka 2013).
How the intervention might work
TENS induced analgesia is thought to be multifactorial and encompasses likely peripheral, spinal and supraspinal mechanisms. In one animal study, the increased mechanical sensitivity caused by peripheral injection of serotonin (a substance naturally produced following injury/inflammation) was decreased by application of TENS (Santos 2013). Importantly, it was demonstrated that this analgesia was partly mediated by peripheral mechanisms as preinjection of a peripheral opioid receptor blocker decreased the analgesia produced, implying the TENS effect was mediated via activation of these peripheral receptors (Santos 2013). A spinal effect for electrical stimulation was initially demonstrated by Wall 1967, and was suggested to work via the 'pain‐gate' mechanism proposed in 1965 (Melzack 1965). The pain gate theory proposes that large diameter (Aβ) afferent fibres (carrying sensations such as vibration, touch, etc.) inhibit nociceptive activity in the dorsal horn of the spinal cord, with a resultant decrease in pain perception (Melzack 1965). TENS application and its stimulation of peripheral neural structures is a source of considerable large diameter afferent activity and this is therefore a plausible means of TENS induced analgesia. TENS is also thought to have additional spinal segmental effects; decreased inflammation‐induced dorsal horn neuron sensitisation (Sabino 2008), altered levels of neurotransmitters such as gamma‐aminobutyric acid (GABA) and glycine, which are thought to be involved in inhibition of nociceptive traffic (Maeda 2007; Somers 2009), and modulation of the activity of the cells that provide support/surround neurons (glial cells) in the spinal cord (Matsuo 2014), have all been suggested as means by which TENS may produce analgesia at a spinal segmental level.
Further, it appears that TENS may have an effect on endogenous analgesia. Descending activity relayed via the midbrain periaqueductal grey (PAG) and the rostral ventral medulla (RVM) in the brainstem may have inhibitory effects at the segmental level (Gebhart 2004). This PAG‐RVM relayed segmental inhibition is mediated in part via opioidergic pathways (Calvino 2006; Gebhart 2004). TENS induced analgesia has been shown to be reversible with preinjection of opioid receptor blockers in both the PAG and RVM in rats with experimentally induced peripheral inflammation implying that this may be an operational pathway by which TENS contributes to analgesia (DeSantana 2009; Kalra 2001). This descending mechanism may also exist in humans with pain. An enhanced conditioned pain modulation (descending modulation) response has been observed in people with fibromyalgia during active TENS application compared to no TENS or placebo TENS (Dailey 2013). The descending modulation of pain is apparently not related to frequency of TENS stimulation employed (DeSantana 2009), rather it is the intensity of stimulation that appears to be critical in TENS analgesia (Moran 2011; Sluka 2013).
Low frequency and high frequency TENS effects have been shown to be mediated via µ‐ and δ‐opioid receptor classes, respectively and as such low frequency TENS effects may be limited in people using opioids for pain relief as they primarily act via µ‐opioid receptor pathways (Leonard 2010; Leonard 2011; Sluka 2013). Given that pharmacological management of neuropathic pain may involve opioid medication, it is possible this may impact upon low frequency TENS efficacy if used concurrently. Therefore, this review proposes a subgroup analysis of low versus high frequency TENS application to investigate this further.
These descending inhibitory mechanisms have also been implicated in placebo analgesia (the phenomena of improvements in pain that follow the delivery of an inert treatment) (Eippert 2009); therefore, it is possible that the suggested mechanisms of TENS induced analgesia described above may not necessarily represent specific effects of electrical stimulation but could possibly result purely from the therapeutic ritual of providing a TENS unit.
Sham credibility issues in studies of transcutaneous electrical nerve stimulation
One issue regarding the credibility of sham conditions specifically for TENS studies is whether the sham condition that is employed controls adequately for all aspects of the treatment experience. Various types of sham TENS have been proposed including deactivated units that are identical in appearance but deliver no actual stimulation to devices where an initial brief period of stimulation at the start of use is delivered and then faded out (Rakel 2010). To try to enhance blinding in these paradigms, the information given to participants is often limited regarding what they should feel when the device is switched on. However, it is clear that there are substantial threats to the credibility of these shams when compared to active stimulation that elicits strong sensations. Given that the effectiveness of TENS is widely thought to be related to the intensity of the stimulus, a true sham that establishes robust blinding of participants is not achievable (Sluka 2013). This represents a risk of bias to all sham controlled trials of TENS.
Why it is important to do this review
TENS is a widely used and readily available adjunct therapy for people with chronic pain and has the benefit of having an apparently low risk profile. This review supersedes one Cochrane Review: 'Transcutaneous electrical nerve stimulation (TENS) for chronic pain' (Nnoaham 2014 (withdrawn)); and one withdrawn protocol 'Transcutaneous electrical nerve stimulation (TENS) for neuropathic pain in adults' (Claydon 2014 (withdrawn)). The original review for chronic pain was split into two titles, one on neuropathic pain and one on fibromyalgia (Johnson 2016). This review replaces the original protocol for neuropathic pain that was withdrawn. There are a number of systematic reviews of the effect of TENS across various painful conditions (e.g. labour pain, rheumatoid arthritis, phantom limb pain and chronic low back pain) (Brosseau 2003; Khadilkar 2008; Dowswell 2009; Johnson 2010; Johnson 2015). There are no consistent findings and most reviews comment on the lack of good quality trials and consequent difficulty in estimating effect sizes. However, there is no previous Cochrane Review examining the effect of TENS on neuropathic pain.
Objectives
To determine the analgesic effectiveness of TENS versus placebo (sham) TENS, TENS versus usual care, TENS versus no treatment and TENS in addition to usual care versus usual care alone in the management of neuropathic pain in adults.
Methods
Criteria for considering studies for this review
Types of studies
We included randomised controlled trials (RCTs) or quasi‐randomised trials (including cross‐over designs) of TENS applied as treatment for central or peripheral neuropathic pain of any aetiology in adults. We excluded non‐randomised studies, case reports/series, studies of experimental pain, clinical observations and systematic reviews. We assessed studies for inclusion regardless of their publication status. We excluded studies designed to test the immediate effects of a single treatment only with follow‐up less than 24 hours. For non‐English language papers, we sourced translators through Cochrane Pain, Palliative and Supportive Care Review Group as well as personal networks where available.
Types of participants
We included participants aged 18 years or over identified as having pain of neuropathic origin from a wide range of conditions, including, but not limited to:
-
cancer‐related neuropathy;
-
HIV neuropathy;
-
painful diabetic neuropathy (PDN);
-
phantom limb pain;
-
postherpetic neuralgia (PHN);
-
postoperative or traumatic neuropathic pain;
-
spinal cord injury;
-
poststroke pain;
-
trigeminal neuralgia.
We excluded studies that included participants with a mix of neuropathic and non‐neuropathic pain where it was impossible to extract data for the neuropathic pain participants independently. We excluded studies that included participants with complex regional pain syndrome (Type I or II) or fibromyalgia as these studies are considered in separate Cochrane Reviews (Johnson 2016; Smart 2016).
Types of interventions
We included all standard modes of TENS, regardless of the device manufacturer, in which the TENS condition delivered a clearly perceptible sensation. Given that self‐use and portability are key clinical features of TENS, we excluded non‐portable electrical stimulation devices such as interferential therapy (IFT). We included any parameters of treatment that evoked a perceptible sensation, and any frequency or duration of treatment or surface electrode configuration. We excluded studies delivering intensities of TENS that were subperceptual or barely perceptual due to the risk of suboptimal treatment. We excluded studies where current was delivered percutaneously (e.g. electroacupuncture, percutaneous electrical nerve stimulation (PENS), neuroreflexotherapy) and where the effect of TENS could not be separated from the effects of other treatments (i.e. comparison interventions standardised between groups). The comparisons of interest were TENS versus placebo (sham) TENS, TENS versus usual care, TENS versus no treatment and TENS in addition to usual care versus usual care alone.
Types of outcome measures
We included studies with pain intensity as the primary or secondary outcome.
Primary outcomes
-
Pain intensity as measured using a visual analogue scale (VAS), numerical rating scale (NRS), verbal rating scale or Likert scale.
-
Health related quality of life (HRQoL) using any validated tool (e.g. 36‐item Short Form (SF‐36), six‐item Short Form (SF‐6), EuroQol).
Secondary outcomes
-
Participant global impression of change (PGIC) scales.
-
Analgesic medication use.
-
Incidence/nature of adverse events.
Search methods for identification of studies
Electronic searches
We searched the following electronic databases using a combination of controlled vocabulary, medical subject headings (MeSH) and free‐text terms to identify published articles.
-
Cochrane Central Register of Controlled Trials (CENTRAL; 2016 Issue 8) via CRSO;
-
MEDLINE (via Ovid) 1946 to August week 5 2016;
-
Embase (via Ovid) 1974 to 2016 week 37;
-
CINAHL (EBSCO) 1982 to August 2016;
-
PsycINFO (Ovid) 1806 to July week 4 2016;
-
LILACS (Birme) 1985 to September 2016;
-
PEDro June 2016;
-
Web of Science (ISI) SCI, SSCI, CPCI‐S, CPCI‐SS to September 2016;
-
AMED (via Ovid) 1985 to August 2016;
-
Database of Abstracts of Reviews of Effects June 2016;
-
Health Technology Assessments February 2017.
There were no language restrictions. The search strategies used can be found in Appendix 1.
Searching other resources
We searched the metaRegister of controlled trials (mRCT) (www.controlled-trials.com/mrct), ClinicalTrials.gov (www.clinicaltrials.gov), and the World Health Organization (WHO) International Clinical Trials Registry Platform (ICTRP) (apps.who.int/trialsearch/) for ongoing trials. In addition, we checked the reference lists of reviews and retrieved articles for additional studies. We also sought relevant expert input in an attempt to elicit further contribution regarding novel studies.
Unpublished data
To minimise the prospect of publication bias, we undertook a further search of the following:
-
OpenGrey (System for Information on Grey Literature in Europe);
-
Dissertation abstracts (ProQuest);
-
National Research Register Archive;
-
Health Services Research Projects in Progress;
-
Pan African Clinical Trials Registry;
-
EU Clinical Trials Register.
Data collection and analysis
Selection of studies
Two review authors (WG and BMW) independently assessed the titles and abstracts of potential studies identified by the search strategy for their eligibility. If the eligibility of a study was unclear from the title and abstract, we assessed the full paper. We excluded studies that did not match the inclusion criteria (see Criteria for considering studies for this review). We resolved disagreements between review authors regarding a study's inclusion by discussion. A third review author (NEO) was available to assess relevant studies if resolution and agreement could not be reached. This option was not required. We did not anonymise studies prior to assessment.
A PRISMA study flow diagram documents the screening process (Figure 1) (Liberati 2009), as recommended in Part 2, Section 11.2.1 of the Cochrane Handbook for Systematic Reviews of Interventions (Schünemann 2011).

Study flow diagram.
Data extraction and management
Two review authors (WG and BMW) independently extracted data from all included studies using a standardised, piloted data extraction form. We resolved any discrepancies/disagreement by consensus. A third review author (NEO) was available for arbitration if consensus was not achieved. This option was not required. We extracted the following data from each study included in the review:
-
country of origin;
-
study design;
-
study population (including diagnosis, diagnostic criteria used, symptom duration, age, gender);
-
concomitant treatments that may affect outcome (medication, procedures, etc.);
-
sample size, active and control/comparator groups;
-
intervention(s) (including type, parameters (e.g. frequency, intensity, duration, electrode position, setting and professional discipline of the clinician delivering the therapy);
-
type of placebo/comparator intervention;
-
outcomes (primary and secondary) and time points assessed (only for the comparisons of interest to this review);
-
adverse events;
-
industry sponsorship;
-
author conflict of interest statements.
Assessment of risk of bias in included studies
Two review authors (WG and BMW) independently assessed risk of bias for each study, using the criteria outlined in the Cochrane Handbook for Systematic Reviews of Interventions and adapted from those used by the Cochrane Pregnancy and Childbirth Group, with any disagreements resolved by discussion (Higgins 2011). In cases where consensus was not reached, a third review author (NEO) was available for arbitration. This option was not required.
For each study of parallel design, we assessed the following.
-
Random sequence generation (selection bias). We assessed the method used to generate allocation sequence as:
-
low risk of bias (any truly random process, e.g. random number table; computer random number generator);
-
unclear risk of bias (method used to generate sequence not clearly stated);
-
high risk of bias (studies using a non‐random process, e.g. odd or even date of birth; hospital or clinic record number).
-
-
Allocation concealment (checking for possible selection bias). We assessed the method used to conceal allocation to group assignment as:
-
low risk of bias (e.g. telephone or central randomisation; consecutively numbered sealed opaque envelopes);
-
unclear risk of bias (method not clearly stated);
-
high risk of bias (studies that did not conceal allocation e.g. open list).
-
-
Blinding of study participants (checking for possible performance and detection bias). We assessed the methods used to blind participants and personnel (care providers) as follows:
-
low risk of bias (participants/personnel blinded to allocated intervention; and unlikely that blinding broken);
-
unclear risk of bias (insufficient information to permit judgement of low/high risk of bias);
-
high risk of bias (participants/personnel not blinded to allocated intervention, two interventions clearly identifiable to personnel as experimental and control OR participants/personnel blinded to allocated intervention but it is likely that blinding may have been broken).
-
-
Blinding of outcome assessor (detection bias). We assessed the methods used to blind outcome assessors as:
-
low risk of bias (outcome assessor (including 'participants' with respect to self‐report outcomes) blinded to participants' allocated interventions and unlikely that blinding broken);
-
unclear risk of bias (insufficient information to permit judgement of low/high risk of bias);
-
high risk of bias (outcome assessor (including 'participants' with respect to self‐report outcomes) unblinded to participants' allocated interventions OR outcome assessor blinded to allocated intervention but likely that blinding may have been broken).
-
-
Incomplete outcome data (attrition bias). We assessed attrition bias by considering if participant dropout rate was appropriately described and acceptable:
-
low risk of bias (less than 20% dropout and appeared to be missing at random. Numbers given per group and reasons for dropout described);
-
unclear risk of bias (if less than 20% but reasons not described and numbers per group not given. Unclear that data were missing at random);
-
high risk of bias (if over 20% even if imputed appropriately).
-
-
Incomplete outcome data (participant exclusion). We assessed whether participants were analysed in the group to which they were allocated as:
-
low risk of bias (if analysed data in group to which originally assigned with appropriately imputed data or as an available‐case analysis);
-
unclear risk of bias (insufficient information provided to determine if analysis was per protocol or intention to treat);
-
high risk of bias (if per‐protocol analysis used. Where available data were not analysed or participant data were included in group they were not originally assigned to).
-
-
Selective reporting (reporting bias). We assessed whether studies were free of the suggestion of reporting bias as:
-
low risk of bias (study protocol available and all prespecified outcomes of interest adequately reported; study protocol not available but all expected outcomes of interest adequately reported; all primary outcomes numerically reported with point estimates and measures of variance for all time points);
-
unclear risk of bias (inadequate information to allow judgement of a study to be classified as 'low risk' or 'high risk');
-
high risk of bias (incomplete reporting of prespecified outcomes; one or more primary outcomes was reported using measurements, analysis methods or subsets of data that were not prespecified; one or more reported primary outcomes were not prespecified; one or more outcomes of interest reported incompletely and cannot be entered into a meta‐analysis; results for a key outcome expected to have been reported excluded).
-
-
Size of study (checking for possible biases confounded by small sample size). We assessed studies as:
-
low risk of bias (200 participants or more per treatment arm);
-
unclear risk of bias (50 to 199 participants per treatment arm);
-
high risk of bias (fewer than 50 participants per treatment arm).
-
-
Other sources of bias. We also assessed other risk factors such as whether trials were stopped early, differences between groups at baseline, differences between groups in timing of outcome assessment, insufficient control of cointerventions and author source of funding declarations.
Measures of treatment effect
We analysed primary outcomes and presented this on a continuous scale as mean difference (MD) with 95% confidence intervals (CI). Where data were available, we planned to present outcomes in a dichotomised format. For dichotomised data (responder analyses), we planned to consider analyses based upon a 30% or greater reduction in pain to represent a moderately important benefit, and a 50% or greater reduction in pain intensity to represent a substantially important benefit as suggested by the IMMPACT guidelines (Dworkin 2008). Where possible, we planned to present risk ratio (RR) and risk difference (RD) with 95% CIs for dichotomised outcome measures. We planned to calculate the number needed to treat for an additional beneficial outcome (NNTB) as an absolute measure of treatment effect. However, these data were not available in the included studies. For HRQoL data, we preplanned a minimally important clinical difference to be greater than 10% of the scale employed (Furlan 2009), however we were unable to report on HRQoL.
The IMMPACT thresholds are based on estimates of the degree of within‐person change from baseline that participants might consider clinically important, whereas the studies in this review typically presented effect sizes as the mean between‐group change. There is little consensus or evidence regarding what the threshold should be for a clinically important difference in pain intensity based on the between‐group difference postintervention. For some pharmacological interventions, the distribution of participant outcomes is bimodally distributed (Moore 2013). That is, some participants experience a substantial reduction in symptoms (Moore 2014), some experience minimal to no improvement and very few experience intermediate (moderate) improvements. In this instance, and if the distribution of participant outcomes reflects the distribution of treatment effects, then the mean effect may be the effect that the fewest participants actually demonstrate (Moore 2013). Therefore, it is possible that a small mean between‐group effect size might reflect that a proportion of participants responded very well to the intervention tested. It is unknown whether outcomes are commonly bimodally distributed in trials of TENS and the advantage of focusing on the between‐group difference is that it is the only direct estimate of the mean specific effect of the intervention. Equally, it remains possible that a very small mean between‐group effect might accurately represent generally very small effects of an intervention for most or all individuals.
The OMERACT 12 group have reported recommendations for minimally important difference for pain outcomes (Busse 2015). They recommend 10 mm on a 0 mm to 100 mm VAS as the threshold for minimal importance for mean between‐group change though they stress this should be interpreted with caution as it remains possible that estimates that fall closely below this point may still reflect a treatment that benefits an appreciable number of people. We use this threshold but interpret it appropriately given the quality of the included studies.
Unit of analysis issues
In cross‐over studies, we planned to use first period data only wherever possible (Higgins 2011). Where this was not reported, we undertook analysis as if the treatment periods were parallel and highlighted the potential bias this may have introduced. All included studies randomised at the level of the individual participant.
Dealing with missing data
Where insufficient data were presented to enter into an otherwise viable meta‐analysis, we contacted the study authors. Two included studies did not present data in a format suitable for data extraction. One study author replied with further data (Buchmuller 2012). We were unable to contact the authors of one further study (Prabhakar 2011).
Assessment of heterogeneity
We planned to combine studies that examined similar conditions. However, given the limited number of studies, we pooled data from studies in different neuropathic pain conditions but have considered whether diagnostic group appears to be a source of important heterogeneity. We evaluated the included studies for clinical homogeneity regarding study population, treatment procedure, control intervention, timing of follow‐up and outcome measurement. We did not combine studies that compared TENS to usual care with studies that compared TENS to sham/placebo in the same analysis. We formally explored heterogeneity using the Chi² test to investigate the statistical significance of any heterogeneity, and the l² statistic to estimate the amount of heterogeneity. Where significant heterogeneity (P < 0.1) was present, we planned to explore subgroup analyses. Preplanned comparisons are described in Subgroup analysis and investigation of heterogeneity.
Assessment of reporting biases
We planned to consider the possible influence of publication/small study biases on review findings. The influence of small study biases were, in part, addressed by the risk of bias criterion 'study size.' We planned to use funnel plots to visually explore the likelihood of reporting biases when there were at least 10 studies in a meta‐analysis and included studies differ in size. For continuous outcomes, we planned to use Egger's test to detect possible small study bias and, for dichotomised outcomes, we planned to test for the possible influence of publication bias on each outcome by estimating the number of participants in studies with zero effect required to change the NNTB to an unacceptably high level (defined as a NNTB of 10), as outlined by Moore 2008. Given the small number of studies in the meta‐analysis and that the remaining studies investigated different TENS comparisons, we did not undertake the above processes.
Data synthesis
We extracted data and classified them according to outcome and duration of follow‐up (during‐use effects; short term: zero to less than two weeks postintervention; mid‐term: two to seven weeks postintervention; and long term: eight or more weeks postintervention). Where adequate data existed, we used a random‐effects model to meta‐analyse outcome data from suitably homogeneous studies using Review Manager 5 (RevMan 2014). For the pooled analysis, pain intensity data was extracted as 0‐10 VAS rating scale except one study which used a 0‐100 VAS scale (Barbarisi 2010). For this study, we converted the results to a 0‐10 scale by dividing the measure by 10. The pooled effect sizes for pain intensity were presented as MDs. We planned to pool data for adverse events across conditions though adequate data were not available to do so. We considered meta‐analysis appropriate for only one comparison (TENS versus sham TENS). This decision reflects the clinical diversity across the included studies, particularly in relation to the control condition. We described the remaining studies as a narrative synthesis. We used the GRADE system to summarise the quality of the body of evidence for key comparisons (Guyatt 2008).
-
Limitations of studies: downgraded once if greater than 25% of participants were from studies at high risk of bias across any key 'Risk of bias' criteria.
-
Inconsistency: downgraded once if heterogeneity was statistically significant and I2 ≥ 40% or when reported treatment effects were in opposition directions.
-
Indirectness: downgraded once if greater than 50% of the participants were outside the target group.
-
Imprecision: downgraded once if fewer than 400 participants for continuous data and fewer than 300 events for dichotomous data (Guyatt 2011).
-
Publication bias: downgrade once where there was direct evidence of publication bias.
We considered single studies both inconsistent and imprecise (unless sample size was greater than 400 participants for continuous data and greater than 300 events for dichotomous data). Two review authors (WG and BW) made these judgements independently and we resolved disagreements by discussion. A third review author (NEO) was available if agreement could not be reached. This option was not required.
The GRADE system uses the following criteria for assigning grade of evidence:
-
high: we are very confident that the true effect lies close to that of the estimate of the effect;
-
moderate: we are moderately confident in the effect estimate; the true effect is likely to be close to the estimate of effect, but there is a possibility that it is substantially different;
-
low: our confidence in the effect estimate is limited; the true effect may be substantially different from the estimate of the effect;
-
very low: we have very little confidence in the effect estimate; the true effect is likely to be substantially different from the estimate of effect.
We included a 'Summary of findings' table to present the main findings for the comparison 'TENS versus sham TENS' in a transparent and simple tabular format. In particular, we included key information concerning the quality of evidence, the magnitude of effect of the intervention examined and the sum of available data on the outcome(s). Due to clinical heterogeneity and lack of studies, we were unable to compare TENS versus usual care, TENS versus no treatment or TENS in addition to usual care versus usual care alone, therefore we did not present 'Summary of findings' tables for these comparisons.
Subgroup analysis and investigation of heterogeneity
We planned subgroup analysis in the following domains:
-
type of neuropathic pain: central neuropathic pain (pain due to identifiable pathology of the central nervous system (e.g. stroke, spinal cord injury) or peripheral neuropathic pain (pain resulting from pathology of the nerve root or peripheral nerves);
-
type of neuropathic condition (as feasible from included studies);
-
stimulation parameters: intensity (subgroup studies in which intensity was titrated to a strong sensation versus studies in which intensity was not titrated);
-
stimulation parameters: frequency (low frequency TENS 10 Hz or less versus high frequency TENS 100 Hz or greater).
We did not undertake these analyses due to insufficient number of included studies and for the pooled analysis clinical homogeneity.
Sensitivity analysis
We undertook a sensitivity analysis on risk of bias (investigating the effect of including/excluding studies at high risk of bias from the analysis) and the choice of meta‐analysis model (investigating the impact of applying a fixed‐effect instead of a random‐effects model) for the comparison TENS versus sham TENS. We described all other studies narratively.
Results
Description of studies
For a detailed description of all studies see Characteristics of included studies and Characteristics of excluded studies table.
Results of the search
The literature search was conducted in September 2016 and found 4081 records. We removed duplicates and were left with 2330 study records. Two review authors (BW and WG) then independently reviewed titles and abstracts of all study records against inclusion and exclusion criteria. These independent selections were compared and consensus reached over study inclusion/assessment of full text papers. We selected 46 records for further investigation in full‐text format and from this agreed on 15 papers to include in the review (Barbarisi 2010; Bi 2015; Buchmuller 2012; Casale 2013; Celik 2013; Gerson 1977; Ghoname 1999; Koca 2014; Nabi 2015; Őzkul 2015; Prabhakar 2011; Rutgers 1988; Serry 2015; Tilak 2016; Vitalii 2014). One review author (BW) translated and conducted inclusion/exclusion criteria for two papers with the help of a native German speaker (Heidenreich 1988; Lehmkuhl 1978); a volunteer identified through Cochrane Task Exchange translated another study, which two review authors (BW and WG) assessed for inclusion/exclusion (Pourmomeny 2009). See Figure 1 for a summary of the screening process.
Included studies
A detailed description of all studies included in this review is provided in the Characteristics of included studies table, and detailed descriptions of participants and TENS treatment parameters in individual studies (where reported) can be found in Table 1. We included 15 studies and extracted data from 14 of these. One study did not provide useable data (Rutgers 1988). We contacted two study authors with respect to clarifications around published data. On request, Barbarisi 2010 provided detail on post‐treatment VAS pain intensity score variance; Buchmuller 2012 provided clarification on the process of subgrouping of participants into a neuropathic pain group and data on VAS pain intensity for this group. Nabi 2015 provided methodological information with respect to outcome assessment timeframe postintervention. We contacted two study authors regarding clarification of published data but received no response (Prabhakar 2011; Serry 2015). Lack of up to date contact information meant one study author could not be contacted (Rutgers 1988).
| Study, comparison (admitted sample size) | Group baseline pain intensity VAS/NRS | Neuropathic condition | Reported mean duration | Diagnostic criteria | Hz and pulse width | Electrode location | Intensity | Duration, frequency and site of administration |
|---|---|---|---|---|---|---|---|---|
| TENS vs sham TENS (30) | P300 + TENS: 4 ± 0.93 P600 + TENS: 3.8 0.95 P300 + sham TENS: 4.1 ± 1.19 P600 + sham TENS: 3.2 ± 0.81 | Postherpetic neuralgia | 15.25 ± 8.7 months | No formal or clinical neuropathic diagnostic criteria | 100 Hz (later described in text as 50 Hz) 125 µs | "Around site of pain" | "Clear non‐painful paraesthesia". Titrated to maintain strength of perception | 30 minutes daily for 4 weeks Clinic administration |
| TENS vs sham TENS (52) | TENS: 5.17 ± 2.34 Sham TENS: 5.56 ± 2.07 | Spinal cord injury | 6.9 ± 3.6 months (since spinal cord injury) | No formal or clinical neuropathic diagnostic criteria | 2 Hz 200 ms | Placed "on region with pain" | 50 mA. No description of perceived sensation | 20 minutes 3 × weekly for 12 weeks Clinic administration |
| TENS vs sham TENS (122) | TENS: 6.15 ± 2.24 Sham TENS: 5.91 ± 2.12 | Lumbar radicular pain (subgroup data supplied by authors) | Not reported | Clinical assessment | Mixed: 80‐100 Hz alternated with 2 Hz 200 ms | Placed on low back and radicular region of pain | Low intensity paraesthesia alternated with high intensity (muscle twitches) | 1 hour. 4 × daily for 3 months Self‐administered at home |
| TENS vs laser? (20) | TENS: 6 ± 0.8 Laser?: 6.6 ± 1.1 | Carpal tunnel syndrome | Not reported | Nerve conduction study | 100 Hz 80 ms | Over carpal ligament and median nerve | "Below muscle contraction" | 30 minutes 5 × weekly for 3 weeks Clinic administration |
| TENS vs sham TENS (33) | TENS: 5.79 ± 2.17 Sham TENS: 5.64 ± 1.81 | Spinal cord injury | 19.1 months | LANSSa > 12 | 4 Hz 200 µs | Placed "on region with pain" | 50 mA. No description of perceived sensation | 30 minutes 1 × daily for 10 days Clinic administration |
| TENS vs drug treatment (29) | TENS: 27.0 Drug: 59.0 (0‐100) | Postherpetic neuralgia | No details | No formal or clinical neuropathic diagnostic criteria | No details | "Placed on affected dermatome" | No detail | 15 minutes 1 × weekly for 4 weeks then 1 × fortnightly for 3 weeks |
| TENS vs PENS (64) | TENS: 7.0 ± 1.9 PENS: 7.2 ± 1.8 Sham PENS: 6.6 ± 1.9 | Lumbar radicular pain | 21 ± 9 months | Clinical assessment. Radiological assessment of nerve root compression | 4 Hz 100 ms | Placed on posterior lower limb | "Highest tolerable sensation" without muscle twitch | 30 minutes 3 × weekly for 3 weeks Clinic administration |
| TENS vs IFT (75) | TENS: 8.06 ± 0.55 IFT: 8.25 ± 0.4 Splint: 8.31 ± 0.6 | Carpal tunnel syndrome | 13.3 ± 6.3 months | Nerve conduction study | 100 Hz 80 ms | Placed on "palmar aspect of hand/wrist" | No details | 20 minutes 5 × weekly for 3 weeks Clinic administration |
| TENS vs PRF sympathectomy (65) | TENS: 6.10 PRF sympathectomy: 6.46 (NRS) | Peripheral diabetic neuropathy | 12.9 ± 3 years (since diabetes onset) | Clinical diagnosis | 80 Hz 200 µs | "Around shin and ankle" | "two to three times sensory threshold" | 20 minutes 10 treatment sessions on alternate days Clinic administration |
| TENS vs visual illusion (26) | TENS: 5.33 ± 1.20 Visual illusion: 5.33 ± 1.37 | Spinal cord injury | 12.4 ± 17.8 months | ≥ 4 on DN4 | 80 Hz 180 µs | Bilaterally around spine above level of injury | "perceptible but comfortable" | 30 minutes 5 × weekly for 2 weeks Clinic administration |
| TENS vs cervical spine mobilisation (75) | Not stated | Cervical radicular pain (75) | No details | No formal or clinical neuropathic diagnostic criteria | 100 Hz 50 µs | Placed at 'cervical spinal segment and distal dermatome | No details | 30 minutes 10 sessions on alternate days over 3 weeks Clinic administration |
| TENS vs acupuncture (26) | Not stated | Postherpetic neuralgia | "3 months to 9 years" | No formal or clinical neuropathic diagnostic criteria | 100 Hz 200 µs | "Either side of painful area" | "Fairly strong sensation" | 3 × 30 minute clinic sessions week 1. Then home use for 5 weeks. No detail on home use frequency/duration |
| TENS vs exercise (60) | Not stated | Peripheral diabetic neuropathy | 12.2 ± 2.3 years (since onset of neuropathy ) | No formal or clinical neuropathic diagnostic criteria | 15 Hz 250 µs | Lower leg/ankle | "Strong rhythmic muscle contractions" | 30 minutes 3 × weekly for 8 weeks Clinic administration |
| TENS vs mirror therapy | TENS: 5.00 ± 1.63 Mirror: 5.46 ± 1.67 | Phantom limb pain | 13 ± 1.5 days (since onset of phantom limb pain) | No formal or clinical neuropathic diagnostic criteria | No details | Site of pain contralateral limb | "Strong but comfortable" | 20 minutes 1 × daily for 4 days Clinic administration |
| TENS vs sham TENS (25) | TENS: 8.09 ± 0.97 Sham TENS: 8.05 ± 1.05 | Spinal cord injury | 12.7 months | LANSS > 12 | 4 Hz 200 ms | Proximal and distal to pain region | 50 mA. No description of perceived sensation | 30 minutes 1 × daily for 10 days Clinic administration |
DN4: Douleur Neuropathique 4; IFT: interferential therapy; LANSS: Leeds Assessment of Neuropathic Symptoms and Signs pain scale; NRS: numerical rating scale; P300: pregabalin 300 mg; P600: pregabalin 600 mg; PENS: percutaneous electrical nerve stimulation; PRF: pulsed radiofrequency; TENS: transcutaneous electrical nerve stimulation; VAS: visual analogue scale.
A detailed narrative description of all included studies can be found in Appendix 2.
Design
All studies included in the review were RCTs. Of these, we considered five were appropriate to pool data for the comparison of TENS versus sham (Barbarisi 2010; Bi 2015; Buchmuller 2012; Celik 2013; Vitalii 2014). Each of these five were two arm parallel designs with TENS versus sham TENS. The remaining 10 studies were RCTs with two parallel intervention arms (Casale 2013; Gerson 1977; Nabi 2015; Rutgers 1988; Tilak 2016), three parallel intervention arms (Koca 2014; Prabhakar 2011), or were randomised cross‐over designs with either two (Őzkul 2015), or three sequenced interventions (Ghoname 1999).
Participants
The 15 studies included 728 participants at intake. Seven of the included studies did not have a formal mechanism employed to classify/diagnose participants (Barbarisi 2010; Bi 2015; Gerson 1977; Prabhakar 2011; Rutgers 1988; Serry 2015; Tilak 2016). Two studies employed confirmatory nerve conduction studies (Casale 2013; Koca 2014), two used the Leeds Assessment of Neuropathic Symptoms and Signs (LANSS) scale (Celik 2013; Vitalii 2014), and one study used the Douleur Neuropathique 4 (DN4) questionnaire (Őzkul 2015). Three studies classified participants by clinical assessment (Buchmuller 2012; Ghoname 1999; Nabi 2015). Within participants, neuropathic pain was associated with spinal cord injury in four studies (Bi 2015; Celik 2013; Őzkul 2015; Vitalii 2014), PHN in three studies (Barbarisi 2010; Gerson 1977; Rutgers 1988), sciatica/chronic low back pain in two studies (Buchmuller 2012; Ghoname 1999), carpal tunnel syndrome in two studies (Casale 2013; Koca 2014), PDN in two studies (Nabi 2015; Serry 2015), phantom limb pain in one study (Tilak 2016), and cervical radiculopathy in one study (Prabhakar 2011). Baseline pain intensity was not part of the inclusion criteria for this review, however these data are reported in Table 1.
Interventions
There was considerable diversity in the comparisons and parameters of TENS application in terms of frequency of applied TENS, intensity of TENS, electrode position, and frequency and duration of application (see Table 1 for a summary of intervention characteristics). Five studies compared TENS with sham TENS and were considered suitable for pooling. These five studies used 'no current' as the sham condition. Electrode placement and the device itself were identical to active TENS. Two studies attempted to maintain participant blinding by informing participants that a sensation may or may not be felt (Barbarisi 2010; Buchmuller 2012), while two studies failed to include details on managing participant intervention expectations (Bi 2015; Vitalii 2014). One study applied TENS/sham TENS below the site of injury in participants with spinal cord injury meaning no participants reported sensation during TENS application and used this as evidence for adequate sham (Celik 2013). Two studies used sham TENS devices which delivered no current but appeared to be switched on and 'live' (Buchmuller 2012; Vitalii 2014). Two studies did not include detail on this and it could not be assumed the sham TENS device appeared to the participant to be switched on. Lastly, in four of the five studies in the pooled analysis the clinical personnel were not blinded to treatment (Barbarisi 2010; Bi 2015; Celik 2013; Vitalii 2014). No studies compared TENS with no treatment, or TENS in addition to usual care with usual care alone. All remaining studies compared TENS against usual care and employed a range of active treatments in the comparison group. The different types of comparison may be categorised as TENS versus other electrotherapy modalities (Casale 2013; Ghoname 1999; Koca 2014), TENS versus sensory‐motor rehabilitation strategies (Őzkul 2015; Tilak 2016), TENS versus manual therapy (Prabhakar 2011), TENS versus acupuncture (Rutgers 1988), TENS versus exercise (Serry 2015), and TENS versus pharmacotherapy (Gerson 1977). See Table 1 for a summary of study participants, comparisons and conditions studied.
Outcomes
All five studies used in the pooled analysis assessed pain intensity immediately post‐intervention and are all therefore classified as assessing short‐term outcome. Four of the five studies reported VAS using a 0‐10 scale while one study used a 0‐100 scale (Barbarisi 2010). In the pooled analysis, outcome assessment occurred immediately post‐intervention period which varied in length from 10 days (Celik 2013; Vitalii 2014) to four weeks (Barbarisi 2010) to three months (Bi 2015; Buchmuller 2012).
The majority of studies included in the narrative synthesis assessed pain intensity on a 0‐10 VAS scale immediately post‐intervention, (Casale 2013; Ghoname 1999; Őzkul 2015; Prabhakar 2011; Serry 2015; Tilak 2016). Within this group, the length of intervention varied in duration from four days (Tilak 2016) to two weeks (Őzkul 2015), three weeks (Casale 2013; Ghoname 1999; Prabhakar 2011), and eight weeks (Serry 2015).
One study assessed pain intensity at three weeks' post‐intervention therefore reporting mid‐term effects (Koca 2014), and one study reported pain intensity at one week', one month' and three months' postintervention covering short, mid and long term outcome effects (Nabi 2015).
Only one study assessed during use effects, with pain intensity (0‐100 VAS scale) reported at week eight of an overall 10 week intervention protocol (Gerson 1977). Lastly, one study reported assessment of pain intensity using a 10 point stepwise scale at six weeks, nine weeks and six months; however, no useable data were presented (Rutgers 1988).
Two studies collected data on HRQoL (Buchmuller 2012; Ghoname 1999). However, we were unable to use these data. No studies reported on PGIC. Three studies monitored/reported on medication use; however, we were unable to analyse the data further. Lastly, three studies reported on minor skin irritation as adverse events (Buchmuller 2012; Koca 2014; Nabi 2015). Further detail regarding these outcomes is supplied in the Effects of interventions section.
Excluded studies
A list of the 31 excluded studies and reasons for exclusion is provided in the Characteristics of excluded studies table. In summary, reasons for exclusion were as follows: not definitive neuropathic pain participants (nine studies); not an RCT or follow‐up less than 24 hours post‐randomisation (nine studies); composite outcome measures involving pain and other sensory measures/symptoms (10 studies); standard TENS unit not used (two studies) and treatment delivered at subperceptual levels (one study).
Studies awaiting classification
One paper is awaiting translation and is currently recorded as awaiting classification (Wang 2009). A search of clinical trials registries and abstracts yielded three registered trials and one thesis of interest. We contacted study authors for all three trials. Two authors replied and following this these trials were excluded. We have contacted authors of the remaining trial and the thesis without reply (ICTRPNCT02496351; Samier 2006). These results are recorded as awaiting classification. See Characteristics of studies awaiting classification table.
Ongoing studies
The search identified no ongoing studies.
Risk of bias in included studies
We present a 'Risk of Bias' summary for all included studies in Figure 2, followed by an individual graphical representation for every study across each 'Risk of Bias' domain (Figure 3). In summary, we judged 11 studies as being at high risk of bias overall (Barbarisi 2010; Bi 2015; Celik 2013; Gerson 1977; Ghoname 1999; Koca 2014; Nabi 2015; Prabhakar 2011; Rutgers 1988; Serry 2015; Vitalii 2014). We judged the remaining four studies at unclear risk of bias (Buchmuller 2012; Casale 2013; Őzkul 2015; Tilak 2016).

Risk of bias graph: review authors' judgements about each risk of bias item presented as percentages across all included studies.

Risk of bias summary: review authors' judgements about each risk of bias item for each included study.
Allocation
Random sequence generation
We judged six out of the 15 included studies to have adequately described random sequence generation and we classified them as low risk for selection bias (Barbarisi 2010; Bi 2015; Buchmuller 2012; Casale 2013; Őzkul 2015; Tilak 2016). Seven studies did not provide sufficient detail to allow a judgement to be made with regard to sequence generation and we judged them to be at unclear risk of bias (Gerson 1977; Ghoname 1999; Nabi 2015; Prabhakar 2011; Rutgers 1988; Serry 2015; Vitalii 2014). Two studies used alternate/sequential allocation to treatment groups and we therefore judged them to be at high risk for selection bias (Celik 2013; Koca 2014).
Allocation concealment
The majority of studies did not provide sufficient detail to allow judgement with respect to allocation concealment and we assigned them unclear risk of bias (Barbarisi 2010; Bi 2015; Casale 2013; Gerson 1977; Nabi 2015; Prabhakar 2011; Rutgers 1988; Serry 2015; Vitalii 2014). We deemed two studies to be at high risk for allocation concealment (Celik 2013; Koca 2014). Two studies were cross‐over designs and we therefore judged them to be at low risk for selection bias (Ghoname 1999; Őzkul 2015, while we judged two parallel controlled trials to have adequately described allocation concealment and were designated low risk of bias in allocation concealment (Buchmuller 2012; Tilak 2016).
Blinding
Blinding of participants/personnel (care providers)
For each study, we assessed and judged blinding of participants and blinding of personnel separately. When completing 'Risk of bias' tables (where these ratings are combined into one domain) we adhered to the following guideline: where either the participants or personnel were considered to be inadequately blinded we judged the section overall to be at high risk of bias. This was the case for nine out of the 14 studies (Barbarisi 2010; Bi 2015; Celik 2013; Gerson 1977; Ghoname 1999; Koca 2014; Nabi 2015; Rutgers 1988; Vitalii 2014). One study described adequate blinding of both participants and personnel and was deemed at low risk of bias (Buchmuller 2012). Five studies made comparisons against other comparable active treatments and we assigned unclear risk of bias to blinding of participants and personnel in these studies (Casale 2013; Őzkul 2015; Prabhakar 2011; Serry 2015; Tilak 2016).
Blinding of outcome assessors
We judged two of the five studies in the pooled analysis investigating pain intensity with TENS versus sham TENS at low risk of bias (Buchmuller 2012; Celik 2013). We rated the remaining three studies in the pooled analysis at unclear risk of bias in this domain (Barbarisi 2010; Bi 2015; Vitalii 2014). We considered studies applying two active comparable treatments at unclear risk for this domain (Casale 2013; Őzkul 2015; Prabhakar 2011; Serry 2015; Tilak 2016), while we judged studies applying invasive or non‐comparable treatments compared to TENS at high risk of bias (Gerson 1977; Ghoname 1999; Koca 2014; Nabi 2015; Rutgers 1988).
Incomplete outcome data
With regard incomplete outcome data, we separately considered risk of bias assessment for 'attrition' and 'participation exclusion' domains. However, in a number of studies 'participant exclusion' was not explicitly described. In response to this, we used the following guideline when judging 'attrition' and 'participant exclusion' bias: if 'participant exclusion' was not explicitly described but the ‘attrition’ was minor or acceptable and reasonably described, we used this as justification for low risk across both domains. If 'attrition' or 'participant exclusion' was not adequately described or explained, this was used as justification for the unclear risk 'participant exclusion from analysis' decision for the studies Nabi 2015, Prabhakar 2011, Serry 2015, and Vitalii 2014. Furthermore, we judged one cross‐over study at unclear risk of bias as no mention was made with regard to any missing data over the many hundreds of data collection points (Ghoname 1999).
Six studies adequately described both sections in this domain and we judged them at low risk of bias (Barbarisi 2010; Bi 2015; Casale 2013; Celik 2013; Őzkul 2015; Tilak 2016). One study specifically excluded participants lost to follow‐up and we therefore judged high risk on 'participant exclusion' bias (Koca 2014). Two studies reported very significant attrition and employed 'per protocol' analysis and we judged these at high risk of bias across both domains (Gerson 1977; Rutgers 1988). We obtained data for a neuropathic subgroup of participants in one study, of which there was around 38% loss of outcome data at post‐treatment assessment and therefore we judged this study at high risk of attrition bias (Buchmuller 2012).
Selective reporting
We considered eight studies to have adequately reported across all outcome measures and were judged at low risk of bias (Bi 2015; Casale 2013; Celik 2013; Koca 2014; Nabi 2015; Őzkul 2015; Tilak 2016; Vitalii 2014. Inconsistencies in presented data led us to judge two studies at unclear risk (Barbarisi 2010; Buchmuller 2012). Five studies did not adequately describe or present all stated outcome measures and were assigned high risk of bias in this area (Gerson 1977; Ghoname 1999; Prabhakar 2011; Rutgers 1988; Serry 2015).
Other potential sources of bias
We focused on two main factors in this risk of bias section and judged whether baseline characteristics and outcome measure time frames were adequate and comparable. We judged six studies at low risk of bias in this domain (Bi 2015; Buchmuller 2012; Casale 2013; Celik 2013; Tilak 2016; Vitalii 2014). Two studies did not provide any data about baseline characteristics between groups and we assigned at high risk of bias (Gerson 1977; Prabhakar 2011). Seven studies were at unclear risk due to insufficient detail around baseline comparisons or outcome measure timing (Barbarisi 2010; Ghoname 1999; Koca 2014; Nabi 2015; Őzkul 2015; Rutgers 1988; Serry 2015).
Size of study
We deemed 13 studies to be at high risk of bias with fewer than 50 participants per treatment arm (Barbarisi 2010; Bi 2015; Casale 2013; Celik 2013; Gerson 1977; Koca 2014; Nabi 2015; Őzkul 2015; Prabhakar 2011; Rutgers 1988; Serry 2015; Tilak 2016; Vitalii 2014. We assigned two studies unclear risk of bias as their sample size was between 50 and 200 per treatment arm (Buchmuller 2012) or as part of a cross‐over trial (Ghoname 1999).
Effects of interventions
See: Summary of findings 1 TENS versus sham TENS
TENS versus sham TENS
Primary outcomes
Pain intensity
We included five individual studies that reported pain intensity post‐intervention (n = 207) (Barbarisi 2010; Bi 2015; Buchmuller 2012; Celik 2013; Vitalii 2014). Sample sizes ranged from n = 21 (Vitalii 2014), up to n = 122 (Buchmuller 2012). One two‐arm parallel design investigated TENS versus sham TENS in participants with PHN (Barbarisi 2010). Three studies ran two‐arm parallel group designs in participants with spinal cord injury (Bi 2015; Celik 2013; Vitalii 2014). One study investigated TENS versus sham TENS in participants with chronic radicular low back pain (Buchmuller 2012).
When pooling the data, we entered the pain intensity scores from Barbarisi 2010 as two distinct comparisons: pregabalin 300 mg plus TENS versus pregabalin 300 mg plus sham TENS and pregabalin 600 mg plus TENS versus pregabalin 600 mg plus sham TENS. We considered this a valid approach because it did not cause any unit of analysis issues as it was a parallel study design and participants were not 'double counted.'
For post‐intervention pain intensity (expressed on a 0‐10 scale) pooling of the studies using a random‐effects model yielded a MD effect size favouring TENS of ‐1.58 (95% CI ‐2.08 to ‐1.09, P < 0.00001, n = 207, 6 comparisons from 5 studies; very low quality evidence). There was no significant heterogeneity (see Figure 4).

Forest plot of comparison: 1 TENS versus sham TENS, outcome: 1.1 Pain intensity.
Sensitivity analysis yielded the following effect size when using a fixed‐effect model (MD ‐1.57, 95% CI ‐1.97 to ‐1.16, P < 0.00001, n = 207, 6 comparisons from 5 studies). Given that we rated the key domains of selection and blinding bias domains as high risk for Celik 2013, we investigated the effect of study quality on the pooled estimate by removing this study from the pooled analysis (see Figure 5). This yielded an effect size of ‐1.44 (95% CI ‐1.87 to ‐ 1.02, P < 0.001, n = 174, 5 comparisons from 4 studies).

Forest plot of comparison: 1 TENS versus sham TENS, outcome: 1.2 Pain intensity sensitivity analysis (Celik 2013 removed).
With regard to a relative comparison of effect size, three of the five studies in the pooled comparison used concomitant drug treatment and we considered that it would be inappropriate to use these as comparators of effect size. Therefore, using the random‐effects result, an MD of ‐1.58 when expressed relative to the mean baseline values of the study with the largest control group sample size Buchmuller 2012 (n = 58) equated to a 26% reduction in pain intensity post‐treatment (95% CI 18% to 34%). Overall, the MD exceeded the 1 unit suggested to be the minimally important difference in between‐group scores for pain intensity (Busse 2015).
The very low quality evidence (downgraded due to significant limitations of studies and imprecision) means it is impossible to confidently state whether TENS has a pain relieving effect compared to sham TENS in people with neuropathic pain at short‐term post‐intervention follow‐up. The true effect is very likely to be significantly different from the estimate reported.
Health related quality of life
Four of the five studies in the pooled analysis did not investigate HRQoL (Barbarisi 2010; Bi 2015; Celik 2013; Vitalii 2014). The remaining study, whilst assessing HRQoL via the SF‐36 questionnaire, did not present baseline data, did not provide neuropathic subgroup data and reported the SF‐36 broken into separate physical and mental domains (Buchmuller 2012). Therefore, we were unable to report on HRQoL in this comparison.
Secondary outcomes
Participant global impression of change
No studies reported PGIC.
Analgesic medication use
One study assessed concurrent gabapentin use in both TENS and sham TENS groups and reported increases in both (Vitalii 2014). The TENS group increased by a mean of approximately 136 mg of gabapentin while the sham TENS group increased by a mean of 560 mg of gabapentin. This difference in increase was reported as statistically significant but no variance data were given. Pregabalin was used concurrently in another study but there were no comparisons made or planned across pharmacological data (Barbarisi 2010). Drug use was monitored but not explicitly reported or analysed postintervention in a third study (Buchmuller 2012). Two studies did not include medication use as an outcome (Bi 2015; Celik 2013). Overall, we could make no conclusions on the effect of TENS versus sham TENS with respect to medication use.
Incidence/nature of adverse events
Two studies explicitly reported no adverse events associated with TENS treatment (Celik 2013; Vitalii 2014). One study reported minor skin irritation in 11 participants in the active group versus three participants in the sham group. These data related to the whole study which included people without defined neuropathic related pain (Buchmuller 2012). Two studies did not report adverse events (Barbarisi 2010; Bi 2015). We could make no overall conclusion from this with regard to adverse events associated with TENS versus sham TENS.
Planned comparisons
Due to a lack of data we were unable to report on comparisons for TENS versus no treatment or TENS in addition to usual care versus usual care alone. We identified 10 studies that compared TENS to usual care; however, there was great diversity in the treatment provided in the usual care arm of these studies precluding any quantitative data synthesis. A narrative summary of each of these studies is presented below.
TENS versus therapeutic laser
We found one study that compared TENS with laser (Casale 2013).
Primary outcomes
Pain intensity
Casale 2013 investigated TENS versus laser in participants with carpal tunnel syndrome. The study reported a statistically significant time‐by‐group ANOVA interaction indicating statistically significant differences in post‐treatment pain intensity scores (VAS 0‐10) between the laser and TENS groups. Our calculations indicated a MD of ‐1.2 in favour of laser compared to TENS (95% CI ‐2.3 to ‐0.1, P = 0.041).
We found very low quality evidence (downgraded for limitations of study, inconsistency and imprecision) that laser may be more effective than TENS for treatment of pain at short‐term postintervention follow‐up in participants with carpal tunnel syndrome.
Health related quality of life
The study did not report HRQoL.
Secondary outcomes
Participant global impression of change
The study did not report PGIC.
Analgesic medication use
The study did not report change in medication use.
Incidence/nature of adverse events
The study did not report adverse events.
TENS versus carbamazepine plus clomipramine
We found one study that compared TENS versus carbamazepine plus clomipramine (Gerson 1977).
Primary outcomes
Pain intensity
Gerson 1977 investigated TENS versus pharmacological intervention (carbamazepine plus clomipramine) in participants with PHN. Analysis of the results was performed on a per‐protocol basis and there was a 60% attrition rate across the whole sample. Final analysis was performed on 12 participants for the drug group (including three participants who were initially randomised to TENS) and four participants for the TENS group (including one participant who was initially randomised to drug treatment). VAS values (0‐100) at week eight were reported as means and standard errors of the mean (drug group 21 ± 4.3 mm, TENS group 43 ± 15.6 mm). The study reported this as a statistically significant difference although there was no information on the tests employed.
There was very low quality evidence (downgraded for limitations of study, inconsistency and imprecision) that carbamazepine plus clomipramine drug treatment may be more effective than TENS for treatment of pain in participants with PHN. It should be noted that the drug intervention was completed by week eight and all remaining participants were assessed at this stage. Thus, results reported for the drug arm of this study were short‐term postintervention effects while the TENS result related to 'during use' effects as the TENS final treatment was not delivered until week 10 of the protocol.
Health related quality of life
The study did not report HRQoL.
Secondary outcomes
Participant global impression of change
The study did not report PGIC.
Change in analgesic medication use
The study reported drug dosage data for participants who competed the protocol as being carbamazepine 150 mg /day to 1000 mg/day and clomipramine 10 mg/day to 75 mg/day. No further analysis or change in analgesic use reported.
Incidence/nature of adverse events
The study did not report adverse events.
TENS versus percutaneous electrical nerve stimulation
We found one study comparing TENS versus PENS (Ghoname 1999).
Primary outcomes
Pain intensity
Ghoname 1999 investigated PENS versus TENS in participants with sciatica. The study reported a significant reduction in pain intensity (VAS 0‐10) post‐treatment for both PENS and TENS. The study reported pain intensity 24 hours post‐treatment as significantly lower for PENS compared to TENS (mean ± SD: 4.1 ± 1.4 with PENS versus 5.4 ± 1.9 with TENS). This may be expressed as an MD of ‐1.3 (95% CI ‐1.9 to ‐0.7, P < 0.0001) in favour of PENS compared to TENS.
There was very low quality evidence (downgraded for limitations of study, inconsistency and imprecision) that PENS may be more effective than TENS for treatment of pain at short‐term post‐intervention follow‐up in participants with radicular pain secondary to sciatica.
Health related quality of life
Data for quality of life (SF‐36) were collected at baseline across all participants and scores reported as physical component summary (PCS) and mental component summary (MCS). The SF‐36 was then completed again, 24 hours after completion of all nine treatments of each modality. A repeat baseline SF‐36 was not reported prior to each subsequent treatment phase with all post‐treatment PCS/MCS scores being compared to the single original baseline assessment. We considered this to be sufficiently problematic such that we did not consider these data further.
Secondary outcomes
Participant global impression of change
The study did not report PGIC.
Analgesic medication use
Oral non‐opioid analgesic tablet consumption/day reduced by (mean ± SD) 50 ± 19% in the PENS group and 29 ± 17% in the TENS group post‐treatment compared to pretreatment for each phase: for PENS this equated to a reduction of approximately 1 tablet/day on average (approximately 2.5 tablets/day to 1.5 tablets/day). The study did not report any statistical analysis for this result.
Incidence/nature of adverse events
The study did not report adverse events.
TENS versus interferential therapy versus splints
We found one study comparing TENS versus IFT (Koca 2014).
Primary outcomes
Pain intensity
Koca 2014 investigated TENS versus IFT versus night splints in participants with carpal tunnel syndrome. There was a statistically significant difference (from baseline) in pain intensity (VAS 0‐10) for all three interventions post‐treatment. The study reported that IFT post‐treatment scores were significantly lower than scores for TENS or splint interventions (mean ± SD: 6.4 ± 1.2 with splint, 6.7 ± 1.4 with TENS, 4.80 ± 1.2 with IFT). This represented an MD of ‐0.3 (95% CI ‐1.1 to 0.5, P = 0.95) between TENS and splint treatment. In terms of the two active treatments (TENS and IFT), there was an MD of ‐1.88 (95% CI ‐2.68 to ‐1.07, P < 0.0001) in favour of IFT. There were two minor adverse events (skin irritation) in the TENS group.
There was very low quality evidence (downgraded for limitations of study, inconsistency and imprecision) that IFT may be more effective than TENS for treatment of pain at medium‐term postintervention follow‐up in participants with carpal tunnel syndrome.
Health related quality of life
The study did not report HRQoL.
Secondary outcomes
Participant global impression of change
The study did not report PGIC.
Analgesic medication use
The study did not report drug use.
Incidence/nature of adverse events
There were two minor adverse events (skin irritation) in the TENS group.
TENS versus pulsed radiofrequency sympathectomy
We found one study comparing TENS versus pulsed radiofrequency (PRF) sympathectomy (Nabi 2015).
Primary outcomes
Pain intensity
Nabi 2015 investigated PRF sympathectomy versus TENS in participants with diabetic peripheral neuropathy. At the postprocedure reassessment points, the mean pain intensity (NRS 0‐10) results were as follows: one week: 2.76 with PRF sympathectomy, 3.96 with TENS; one month: 4.3 with PRF sympathectomy, 5.23 with TENS; three months: 5.13 with PRF sympathectomy, 5.90 with TENS. There was no indication of variance for the NRS scores. There was no testing of the difference between groups reported.
We judged this study as presenting very low quality evidence (downgraded for limitations of study, inconsistency and imprecision) given the lack of data presented and the analysis being 'within‐group' only. Based on this, we were unable to draw any conclusions on the relative efficacy of each investigated treatment on pain in people with peripheral diabetic neuropathy.
Health related quality of life
The study did not report HRQoL.
Secondary outcomes
Participant global impression of change
The study did not report PGIC.
Analgesic medication use
The study did not report drug use.
Incidence/nature of adverse events
Skin irritation was "reported in a few" TENS participants.
TENS versus visual illusion
We found one study comparing TENS with visual illusion (VI) (Őzkul 2015).
Primary outcomes
Pain intensity
Őzkul 2015 investigated TENS versus VI in participants with pain secondary to spinal cord injury. The study reported a significant difference of 'present' pain intensity (VAS 0‐10) post day‐10 treatment between interventions (mean ± SD): 3.66 ± 1.52 with TENS, 4.66 ± 1.37 with VI). However, from our calculations, this represents a non‐significant MD of 1.0 (95% CI ‐0.16 to 2.15, P = 0.1). Within‐treatment analyses were reported as statistically significant in the domains of maximal and minimal pain for TENS only. However, between‐group testing was not significantly different for the two groups for mean, maximal or minimal pain intensity post‐treatment.
There was very low quality evidence (downgraded for limitations of study, inconsistency and imprecision) that VI was no more effective than TENS for treatment of pain at short‐term postintervention follow‐up in participants with neuropathic pain following spinal cord injury.
Health related quality of life
The study did not report HRQoL.
Secondary outcomes
Participant global impression of change
The study did not report PGIC.
Analgesic medication use
The study did not report drug use.
Incidence/nature of adverse events
The study explicitly reported no adverse events with TENS.
TENS versus cervical mobilisation versus exercise
We found one study comparing TENS versus cervical mobilisation versus exercise (Prabhakar 2011).
Primary outcomes
Pain intensity
Prabhakar 2011 investigated TENS versus cervical mobilisation versus exercise in participants with cervical radiculopathy. Pain intensity at baseline was not presented or compared between groups. Pain intensity (VAS 0‐10) data at three weeks were presented as reduction from baseline and VAS data at six weeks were not supplied. The VAS pain outcomes at three weeks were: reduction from baseline (mean ± SD): ‐3.53 ± 0.76 with TENS, ‐4.49 ± 0.76 with mobilisation, ‐2.16 ± 0.8 with isometric exercise. The results were presented as a series of within‐group analyses. Between‐group testing was reported as significant; however, it is unclear if this related to VAS pain intensity data and no data were reported for this analysis. We did not undertake any further analysis of the data in the absence of baseline data and sample sizes. We contacted the authors repeatedly for clarification with no reply.
One study provided very low quality evidence (downgraded for limitations of study, inconsistency and imprecision) investigating cervical spine mobilisation, TENS and isometric exercise treatment for pain in participants with cervical radiculopathy. Despite reporting significant differences between groups, it was impossible to draw conclusions on relative efficacy of each intervention due to lack of data and lack of information on statistical testing.
Health related quality of life
The study did not report HRQoL.
Secondary outcomes
Participant global impression of change
The study did not report PGIC.
Analgesic medication use
The study did not report drug use.
Incidence/nature of adverse events
The study did not report adverse events.
TENS versus acupuncture
We found one study comparing TENS with acupuncture (Rutgers 1988).
Primary outcomes
Pain intensity
Rutgers 1988 investigated TENS versus acupuncture in participants with PHN. The study reported no pain intensity data and undertook no comparisons/analyses. This may be due to the very high attrition rates; at nine weeks, three out of 13 in the TENS group and five out of 10 participants in the acupuncture group remained in the study. At nine weeks, one participant in the TENS group reported a subjective improvement in pain intensity and two participants in the acupuncture group reported moderate subjective improvement. No further analysis of this study was undertaken.
One study (very low quality evidence, downgraded for limitations of study, inconsistency and imprecision) investigated TENS versus acupuncture for pain in participants with PHN. It was impossible to draw conclusions on relative efficacy of each intervention due to significant methodological limitations and incomplete reporting of data.
Health related quality of life
The study did not report HRQoL.
Secondary outcomes
Participant global impression of change
The study did not report PGIC.
Analgesic medication use
The study did not report drug use.
Incidence/nature of adverse events
The study did not report adverse events.
TENS versus exercise versus pharmacological therapy
We found one study comparing exercise plus pharmacological therapy versus TENS plus pharmacological therapy versus pharmacological therapy alone for pain in participants with diabetic peripheral neuropathy (Serry 2015).
Primary outcomes
Pain intensity
The study reported pain intensity (VAS 0‐10) using a within‐group analysis. Despite stating using between‐group tests there was no reporting of this. Within‐group pain intensity percentage changes (comparing pretreatment to post‐treatment) were as follows: ‐41.67% with TENS plus pharmacological therapy, ‐16.7% with exercise plus pharmacological therapy. The study reported no within‐group statistical difference for the pharmacological therapy group. Neither baseline nor post‐treatment assessment points had any pain intensity data reported. We did not undertake any further analysis in the absence of useable data. We attempted to contact the authors on a number of occasions with no reply.
One study (very low quality evidence, downgraded for limitations of study, inconsistency and imprecision) investigated TENS plus pharmacological therapy versus exercise plus pharmacological therapy versus plus pharmacological therapy alone for pain in participants with PDN. Despite reporting significant differences between groups, it was impossible to draw conclusions on relative efficacy of each intervention due to lack of data and lack of information on statistical testing.
Health related quality of life
The study did not report HRQoL.
Secondary outcomes
Participant global impression of change
The study did not report PGIC.
Analgesic medication use
The study did not report drug use.
Incidence/nature of adverse events
The study did not report adverse events.
TENS versus mirror therapy
We found one study comparing TENS versus mirror therapy (Tilak 2016).
Primary outcomes
Pain intensity
Tilak 2016 investigated TENS versus mirror therapy in participants with phantom limb pain. The VAS scores were analysed using 'within' and 'between' group analysis. The study reported significantly different within‐group changes in pain intensity (VAS 0‐10) while between‐group testing was not. Post‐treatment pain intensity VAS values at day four were (mean ± SD): 2.46 ± 1.56 with TENS, 2.08 ± 1.62 with mirror therapy, which represents an MD of ‐0.38 (95% CI ‐0.8 to 1.6, P = 0.5) comparing mirror therapy to TENS and confirms the lack of significant difference between groups.
There was very low quality evidence (downgraded for limitations of study, inconsistency and imprecision) that mirror therapy was no more effective than TENS for treatment of pain at short‐term postintervention follow‐up in participants with phantom limb pain.
Health related quality of life
The study did not report HRQoL.
Secondary outcomes
Participant global impression of change
The study did not report PGIC.
Analgesic medication use
The study did not report drug use.
Incidence/nature of adverse events
The study did not report adverse events.
Discussion
Summary of main results
We were unable to confidently state whether TENS is effective (compare to sham TENS) for pain relief in people with neuropathic pain. The evidence we used in this comparison was very low quality and the true effect is very likely to be substantially different from that reported. The 'very low' GRADE judgement was based on the significant methodological limitations of the included studies, and overall small study sizes.
One study provided very low quality evidence that laser was more effective than TENS when treating pain in participants with carpal tunnel syndrome (Casale 2013). While the magnitude of the effect size in this comparison may be considered meaningful, the design of the study was such that allocation and blinding domains in risk of bias assessment were unclear, which, when considered with the small size of the study, necessitates limited confidence in this effect size.
Very low quality evidence investigating TENS versus pharmacotherapy for pain in participants with PHN may be interpreted as favouring carbamazepine plus clomipramine treatment (Gerson 1977). However, serious limitations in methodology and potential bias means this result should be viewed with very limited confidence.
Two studies (very low quality evidence) investigated the efficacy of TENS versus other electrotherapeutic modalities, PENS in participants with radicular pain secondary to sciatica (Ghoname 1999) and IFT in participants with carpal tunnel syndrome (Koca 2014). Significant concerns with the invasive nature of the PENS intervention and sham PENS intervention (Ghoname 1999), issues with participant selection/allocation (Koca 2014), risk of bias and participant/personnel blinding (Ghoname 1999; Koca 2014) rendered the results very limited in terms of confidence of the reported effects.
One study compared TENS versus PRF sympathectomy for pain intensity in participants with PDN (Nabi 2015). This study did not report variance of the data in the measured outcome and statistical tests did not appear to examine between‐group differences. There were also significant differences in final outcome measurement between groups and issues with participant/personnel blinding. We rated this study as providing very low quality evidence and it was impossible to draw conclusions on relative effectiveness.
Two studies investigated aspects of visual manipulation versus TENS on pain intensity (Őzkul 2015; Tilak 2016). Comparisons were VI versus TENS in participants with spinal cord injury (Őzkul 2015), and mirror therapy versus TENS in participants with phantom limb pain (Tilak 2016). Upon completion of treatment, there was no significant difference in pain intensity measures between groups in either study. Evidence provided by these studies was rated very low quality. The results should be viewed with limited confidence.
One study investigated cervical spinal joint mobilisation versus TENS versus isometric exercises for pain in participants with cervical radiculopathy (Prabhakar 2011). However, significant issues with methodology/potential risk of bias and data presentation/analysis in this paper meant it was impossible to draw conclusions regarding relative effectiveness of the investigated interventions.
One study investigated TENS versus acupuncture in participants with PHN (Rutgers 1988). This study had very significant methodological issues including high risk of bias across multiple domains, lack of published useable data and no statistical analysis; therefore, we were unable to draw conclusions regarding relative effectiveness of the investigated interventions.
One study investigated exercise plus pharmacotherapy versus TENS plus pharmacotherapy versus pharmacotherapy alone for pain in participants with diabetic peripheral neuropathy (Serry 2015). This study reported significant differences pretreatment to post‐treatment in exercise and TENS groups; however, they reported no between‐group comparison or presented any pain intensity data. This, combined with issues around participant/personnel blinding, meant we were unable to draw conclusions regarding relative effectiveness of the investigated interventions.
Overall completeness and applicability of evidence
This review included studies investigating TENS treatment for pain across a range of neuropathic conditions and against a number of interventions. We searched multiple databases for both published and unpublished studies. As such, it may be viewed as offering a reasonably complete summation of the evidence in this area. However, there are a number of issues and caveats to consider which may impact on completeness and applicability of the evidence.
Thirteen of the 15 studies in this review applied TENS interventions only in the clinic. This typically consisted of discreet sessions at varying intervals per week for set periods of time applied by and under control of the researcher. This may be due to methodological considerations and most likely addresses attempts to standardise the intervention, however, this is unlikely to be reflective of the manner in which TENS is used by people in daily life. Evidence suggests considerable variability in terms of treatment fidelity (e.g. duration and intensity) when TENS is self‐administered at home (Pallett 2014). Therefore, controlled prespecified frequency and duration of treatment may lead to discrepancies in estimate of effect (possible overestimation) compared to that found with self‐administered TENS. Conversely, it is possible that this issue might lead studies in this review to underestimate treatment effects as it limits the amount of TENS use possible. It is considered that successful TENS use is often administered for a number of hours per day (Johnson 1991; Johnson 2011). Only one study in this review employed a systematically evaluated self‐administration methodology (Buchmuller 2012), implying that the relatively infrequent and limited duration of clinic‐administered TENS applications of the rest of the studies in this review might lead to underestimation of TENS effect.
The pooled analysis investigating TENS versus sham TENS rests on the presumption that sham TENS is an effective placebo. However, there are challenges to delivering credible sham treatments for TENS (see How the intervention might work). This further reduces the confidence with which the estimated effect of active TENS versus sham TENS may be viewed. There are devices specifically designed to be a credible TENS sham which switch on, appear 'live' and deliver a perceptible sensation for approximately the first 30 seconds after which the output fades to zero (Rakel 2010). However, since clear differences in the experience of TENS and sham TENS are unavoidable, the risk of bias in terms of incomplete blinding remains an issue. This raises the prospect that pragmatic comparisons such as TENS in addition to usual care may be appropriate.
This review included studies with varying timing of assessment outcome for pain. None of the included studies in this review providing useable data employed a methodology whereby effect on pain intensity was assessed and reported on during TENS application which may impact on effect estimates. It is suggested that TENS has its optimal effect during application (Johnson 2011; Sluka 2013). Again, this may create some discrepancy between study findings and the experience of people with neuropathic pain who use or plan to use TENS.
This review excluded a number of studies as they did not fit our prespecified inclusion criteria. Several of these studies were excluded on the basis of using composite assessment scales which combined pain assessment with other features (e.g. pain intensity, paraesthesia and sleep disturbance) assessed on one symptom scale. While we deemed this critical in being able to successfully extract data and draw conclusions on TENS for treatment of pain in people with neuropathic pain, it does leave the possibility that this review may miss other non‐pain specific effects of TENS in people with neuropathic pain and ultimately that this review may not synthesise the entirety of studies conducted in the broad area of TENS for neuropathic pain.
Quality of the evidence
We rated the overall quality of the body of evidence as very low according to GRADE criteria. As a consequence, the conclusions drawn from pooled estimates and those taken from individual studies must be viewed with very limited confidence and the true effect is likely to be substantially different from the estimate of the effect. All studies were at unclear or high risk of bias across multiple domains. Within the 10 studies reported narratively, seven were assigned high risk across at least one of the key domains of selection bias: performance bias, detection bias, attrition bias or reporting bias (Gerson 1977; Ghoname 1999; Koca 2014; Nabi 2015; Prabhakar 2011; Rutgers 1988; Serry 2015).
In the pooled analysis, we assigned all studies as high risk across at least one of the key domains of selection bias mentioned above. When considering the combined high risk ratings in these domains, the possible bias introduced by small study sizes and the subjective nature of the outcome measure it would suggest the effect sizes estimated here are at risk of being exaggerated, particularly given the subjective nature of the outcome measure (Dechartres 2013; Wood 2008; Savoviĉ 2012). As a consequence, we downgraded the quality of the body of this evidence three times (twice for methodological limitations and once imprecision) from high to very low.
We did not downgrade the evidence on the GRADE criteria 'indirectness' or 'publication bias.' All included studies investigated either participants with neuropathic pain directly or were able to provide data for subsets of the group with neuropathic pain. The prevalence of small studies, as mentioned previously, increases the risk of publication bias, wherein there is a propensity for small negative studies to not reach full publication. There is evidence that this might lead to an exaggerated estimate of effect (Dechartres 2013; Moore 2012; Nüesch 2010). We did not downgrade any of the GRADE judgements on the basis of publication bias as we had no direct evidence of this, though all comparisons were downgraded for imprecision.
Overall across studies, we found deficiencies in terms of quality of methodology, reporting of methodology and presentation of adequate data to allow reasonable conclusions to be made. A number of studies did not report data on pain outcome measures, instead stating significant differences between groups with no data provided or statistical test results. Some studies did not report variance data for group means (VAS) and one study did not report group sample size. It was not always possible to check baseline characteristics of groups as pain intensity data (in some studies) were presented as change from baseline with no original baseline summary/variance data provided. Several studies did not report adequately on TENS treatment parameters.
Potential biases in the review process
This review utilised a comprehensive search strategy designed and implemented under expert guidance from the Cochrane Pain, Palliative and Supportive Care Review Group. It was deployed across multiple databases and language of publication was not restricted. Given the rigour of the searches conducted it seems reasonable to assert this review reflects the current body of literature around treatment of pain with TENS in people with neuropathic pain. While review authors were not blind to study authors, journal or institution, we performed all eligibility assessment independently and comparisons for inclusion made by discussion and agreement.
Pain intensity measured via a VAS or NRS was a key eligibility criterion for this review. Several studies utilised composite neuropathic assessment scales that did not allow pain intensity data to be presented as a distinct outcome. Similarly, we excluded studies in which a defined neuropathic pain subgroup could not be delineated. For example, TENS has been investigated for treatment of low back pain in people with multiple sclerosis, however, this may not be neuropathic in nature. These two aspects of study inclusion/exclusion judgement may introduce an element of bias into the review process in that the reported effect estimate may not be fully reflective of all studies in this broad area. However, given the widespread use of TENS as a pain treatment, it was deemed important by the review team that the effect reported was restricted to distinct measures of pain intensity in participants with defined neuropathic pain. Representing mean change scores on continuous scales can be seen as problematic in chronic pain studies since outcomes in pain studies demonstrate a bimodal distribution for some interventions (Moore 2013). More plainly, some participants demonstrated a substantial response to pain therapies while many demonstrated little or no response with few individual participants demonstrating a response similar to the average. This had led to the recommendation that chronic pain studies employ responder analysis based on predetermined cut‐offs for a clinically important response (30% reduction in pain or greater for a moderate benefit, 50% reduction in pain or greater for a substantial benefit) (Dworkin 2008; Moore 2010). No studies identified in this review presented the results of responder analyses and so this type of meta‐analysis was impossible. However, it is unclear if a bimodal distribution of outcome represents a bimodal distribution of treatment effect and we are not aware of any evidence to support the presence of bimodally distributed outcomes following TENS.
Agreements and disagreements with other studies or reviews
Due to the very low quality evidence, this Cochrane systematic review was unable to confidently state whether TENS is effective for pain relief compared to sham TENS in people with neuropathic pain. Two reviews investigating treatment modalities in people with neuropathic pain have been published. Cakici 2016 conducted a broad based review investigating all treatment options for people with peripheral diabetic neuropathy and included one study involving TENS and restricted outcomes to commentary in that it was deemed to have a 'positive' effect on symptoms. The second review investigated 22 common treatments for people with spinal cord injury (Harvey 2016). The two TENS comparison studies included in this review were also included in our review (Bi 2015; Celik 2013). In line with our finding, the review presented a meta‐analysis in favour of TENS as well as similar commentary around quality of evidence.
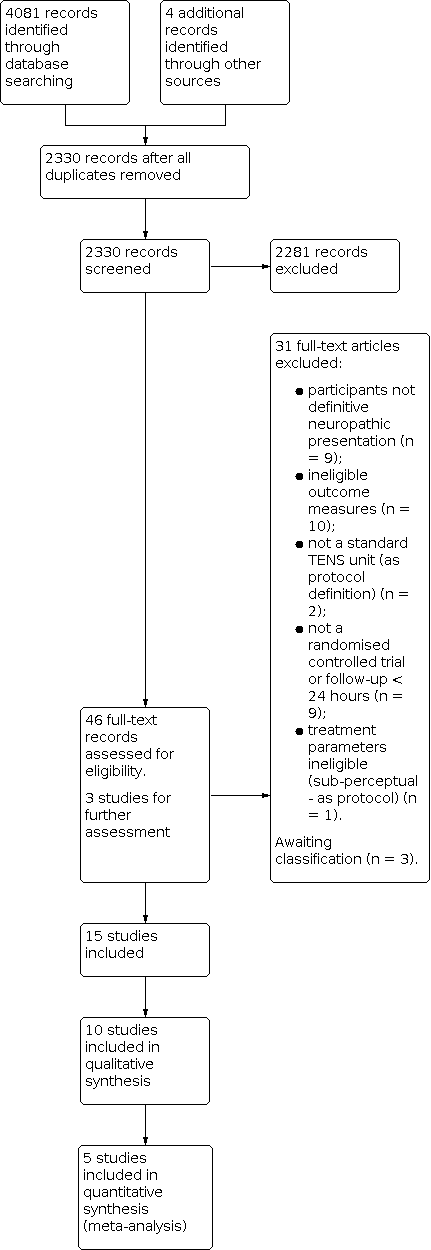
Study flow diagram.

Risk of bias graph: review authors' judgements about each risk of bias item presented as percentages across all included studies.

Risk of bias summary: review authors' judgements about each risk of bias item for each included study.

Forest plot of comparison: 1 TENS versus sham TENS, outcome: 1.1 Pain intensity.

Forest plot of comparison: 1 TENS versus sham TENS, outcome: 1.2 Pain intensity sensitivity analysis (Celik 2013 removed).

Comparison 1: TENS versus sham TENS, Outcome 1: Pain intensity

Comparison 1: TENS versus sham TENS, Outcome 2: Pain intensity sensitivity analysis (Celik 2013 removed)
| TENS versus sham TENS for neuropathic pain in adults | ||||
| Patient or population: adults with neuropathic pain Settings: secondary care Intervention/comparison: TENS vs sham TENS Outcome: Pain intensity (VAS) | ||||
| Outcomes | Effect estimate (95% CI) | No of participants | Quality of the evidence | Comments |
|---|---|---|---|---|
| Post‐intervention pain intensity (VAS 0‐10) | Favoured TENS. Mean difference ‐1.58 (95% CI ‐2.08 to ‐1.09) | 207 (5) | ⊕⊝⊝⊝ Very lowa | Downgraded 3 levels due to multiple sources of potential bias, small number and size of studies. |
| Health related quality of life | No data | ‐ | ‐ | ‐ |
| Participant global impression of change | No data | ‐ | ‐ | ‐ |
| Analgesic medication use | Not estimable | ‐ | ‐ | ‐ |
| Incidence/nature of adverse events | Not estimable | ‐ | ‐ | ‐ |
| CI: confidence interval; TENS: transcutaneous electrical nerve stimulation; VAS: visual analogue scale. | ||||
| GRADE Working Group grades of evidence | ||||
| aDowngraded twice for limitations of studies and once for imprecision. | ||||
| Study, comparison (admitted sample size) | Group baseline pain intensity VAS/NRS | Neuropathic condition | Reported mean duration | Diagnostic criteria | Hz and pulse width | Electrode location | Intensity | Duration, frequency and site of administration |
|---|---|---|---|---|---|---|---|---|
| TENS vs sham TENS (30) | P300 + TENS: 4 ± 0.93 P600 + TENS: 3.8 0.95 P300 + sham TENS: 4.1 ± 1.19 P600 + sham TENS: 3.2 ± 0.81 | Postherpetic neuralgia | 15.25 ± 8.7 months | No formal or clinical neuropathic diagnostic criteria | 100 Hz (later described in text as 50 Hz) 125 µs | "Around site of pain" | "Clear non‐painful paraesthesia". Titrated to maintain strength of perception | 30 minutes daily for 4 weeks Clinic administration |
| TENS vs sham TENS (52) | TENS: 5.17 ± 2.34 Sham TENS: 5.56 ± 2.07 | Spinal cord injury | 6.9 ± 3.6 months (since spinal cord injury) | No formal or clinical neuropathic diagnostic criteria | 2 Hz 200 ms | Placed "on region with pain" | 50 mA. No description of perceived sensation | 20 minutes 3 × weekly for 12 weeks Clinic administration |
| TENS vs sham TENS (122) | TENS: 6.15 ± 2.24 Sham TENS: 5.91 ± 2.12 | Lumbar radicular pain (subgroup data supplied by authors) | Not reported | Clinical assessment | Mixed: 80‐100 Hz alternated with 2 Hz 200 ms | Placed on low back and radicular region of pain | Low intensity paraesthesia alternated with high intensity (muscle twitches) | 1 hour. 4 × daily for 3 months Self‐administered at home |
| TENS vs laser? (20) | TENS: 6 ± 0.8 Laser?: 6.6 ± 1.1 | Carpal tunnel syndrome | Not reported | Nerve conduction study | 100 Hz 80 ms | Over carpal ligament and median nerve | "Below muscle contraction" | 30 minutes 5 × weekly for 3 weeks Clinic administration |
| TENS vs sham TENS (33) | TENS: 5.79 ± 2.17 Sham TENS: 5.64 ± 1.81 | Spinal cord injury | 19.1 months | LANSSa > 12 | 4 Hz 200 µs | Placed "on region with pain" | 50 mA. No description of perceived sensation | 30 minutes 1 × daily for 10 days Clinic administration |
| TENS vs drug treatment (29) | TENS: 27.0 Drug: 59.0 (0‐100) | Postherpetic neuralgia | No details | No formal or clinical neuropathic diagnostic criteria | No details | "Placed on affected dermatome" | No detail | 15 minutes 1 × weekly for 4 weeks then 1 × fortnightly for 3 weeks |
| TENS vs PENS (64) | TENS: 7.0 ± 1.9 PENS: 7.2 ± 1.8 Sham PENS: 6.6 ± 1.9 | Lumbar radicular pain | 21 ± 9 months | Clinical assessment. Radiological assessment of nerve root compression | 4 Hz 100 ms | Placed on posterior lower limb | "Highest tolerable sensation" without muscle twitch | 30 minutes 3 × weekly for 3 weeks Clinic administration |
| TENS vs IFT (75) | TENS: 8.06 ± 0.55 IFT: 8.25 ± 0.4 Splint: 8.31 ± 0.6 | Carpal tunnel syndrome | 13.3 ± 6.3 months | Nerve conduction study | 100 Hz 80 ms | Placed on "palmar aspect of hand/wrist" | No details | 20 minutes 5 × weekly for 3 weeks Clinic administration |
| TENS vs PRF sympathectomy (65) | TENS: 6.10 PRF sympathectomy: 6.46 (NRS) | Peripheral diabetic neuropathy | 12.9 ± 3 years (since diabetes onset) | Clinical diagnosis | 80 Hz 200 µs | "Around shin and ankle" | "two to three times sensory threshold" | 20 minutes 10 treatment sessions on alternate days Clinic administration |
| TENS vs visual illusion (26) | TENS: 5.33 ± 1.20 Visual illusion: 5.33 ± 1.37 | Spinal cord injury | 12.4 ± 17.8 months | ≥ 4 on DN4 | 80 Hz 180 µs | Bilaterally around spine above level of injury | "perceptible but comfortable" | 30 minutes 5 × weekly for 2 weeks Clinic administration |
| TENS vs cervical spine mobilisation (75) | Not stated | Cervical radicular pain (75) | No details | No formal or clinical neuropathic diagnostic criteria | 100 Hz 50 µs | Placed at 'cervical spinal segment and distal dermatome | No details | 30 minutes 10 sessions on alternate days over 3 weeks Clinic administration |
| TENS vs acupuncture (26) | Not stated | Postherpetic neuralgia | "3 months to 9 years" | No formal or clinical neuropathic diagnostic criteria | 100 Hz 200 µs | "Either side of painful area" | "Fairly strong sensation" | 3 × 30 minute clinic sessions week 1. Then home use for 5 weeks. No detail on home use frequency/duration |
| TENS vs exercise (60) | Not stated | Peripheral diabetic neuropathy | 12.2 ± 2.3 years (since onset of neuropathy ) | No formal or clinical neuropathic diagnostic criteria | 15 Hz 250 µs | Lower leg/ankle | "Strong rhythmic muscle contractions" | 30 minutes 3 × weekly for 8 weeks Clinic administration |
| TENS vs mirror therapy | TENS: 5.00 ± 1.63 Mirror: 5.46 ± 1.67 | Phantom limb pain | 13 ± 1.5 days (since onset of phantom limb pain) | No formal or clinical neuropathic diagnostic criteria | No details | Site of pain contralateral limb | "Strong but comfortable" | 20 minutes 1 × daily for 4 days Clinic administration |
| TENS vs sham TENS (25) | TENS: 8.09 ± 0.97 Sham TENS: 8.05 ± 1.05 | Spinal cord injury | 12.7 months | LANSS > 12 | 4 Hz 200 ms | Proximal and distal to pain region | 50 mA. No description of perceived sensation | 30 minutes 1 × daily for 10 days Clinic administration |
| DN4: Douleur Neuropathique 4; IFT: interferential therapy; LANSS: Leeds Assessment of Neuropathic Symptoms and Signs pain scale; NRS: numerical rating scale; P300: pregabalin 300 mg; P600: pregabalin 600 mg; PENS: percutaneous electrical nerve stimulation; PRF: pulsed radiofrequency; TENS: transcutaneous electrical nerve stimulation; VAS: visual analogue scale. | ||||||||
| Outcome or subgroup title | No. of studies | No. of participants | Statistical method | Effect size |
| 1.1 Pain intensity Show forest plot | 5 | 207 | Mean Difference (IV, Random, 95% CI) | ‐1.58 [‐2.08, ‐1.09] |
| 1.2 Pain intensity sensitivity analysis (Celik 2013 removed) Show forest plot | 4 | 174 | Mean Difference (IV, Random, 95% CI) | ‐1.44 [‐1.87, ‐1.02] |