Estimulación magnética periférica repetitiva para el deterioro y la discapacidad en personas después de un accidente cerebrovascular
Resumen
Antecedentes
La estimulación magnética periférica repetitiva (EMPr) es un método de tratamiento no invasivo que puede penetrar en estructuras más profundas con estimulación indolora para mejorar la función motora en las personas con deterioro físico debido a trastornos cerebrales o nerviosos. La EMPr para las personas después de haber sufrido un accidente cerebrovascular ha demostrado ser un método viable para mejorar las actividades de la vida diaria y la capacidad funcional. Sin embargo, la efectividad y la seguridad de esta intervención después de experimentar un accidente cerebrovascular siguen siendo inciertas. Esta es una actualización de la revisión publicada en 2019.
Objetivos
Evaluar los efectos de la EMPr para mejorar las actividades cotidianas y la capacidad funcional en las personas después de haber tenido un accidente cerebrovascular.
Métodos de búsqueda
Se hicieron búsquedas en el registro especializado del Grupo Cochrane de Accidentes cerebrovasculares (Cochrane Stroke); el Registro Cochrane central de ensayos controlados (Cochrane Central Register of Controlled Trials; CENTRAL) en la Biblioteca Cochrane; MEDLINE; Embase; el Cumulative Index to Nursing and Allied Health Literature (CINAHL); PsycINFO; la Allied and Complementary Medicine Database (AMED); OTseeker: Occupational Therapy Systematic Evaluation of Evidence; la Physiotherapy Evidence Database (PEDro); Ichushi‐Web; y seis registros de ensayos en curso el 5 de octubre de 2021. Se revisaron las listas de referencias y se estableció contacto con expertos en el tema. No se impusieron restricciones de idioma ni fecha de publicación en la búsqueda en las bases de datos electrónicas.
Criterios de selección
Se incluyeron los ensayos controlados aleatorizados (ECA) realizados para evaluar el efecto terapéutico de la EMPr en las personas tras un accidente cerebrovascular. Las siguientes comparaciones fueron elegibles para su inclusión: 1) solo la EMPr activa comparada con la EMPr "simulada" (una forma muy débil de estimulación o un sonido solamente); 2) solo la EMPr activa comparada con ninguna intervención; 3) EMPr activa más rehabilitación comparada con la EMPr simulada más rehabilitación; y 4) EMPr activa más rehabilitación comparada con la rehabilitación solamente.
Obtención y análisis de los datos
Dos autores de la revisión, de forma independiente, evaluaron los estudios para su inclusión en la revisión. Los mismos autores de la revisión evaluaron los métodos y el riesgo de sesgo, extrajeron los datos y evaluaron la certeza de la evidencia con el método GRADE. Se contactó con los autores de los ensayos para pedir información no publicada, si fue necesario. Cualquier desacuerdo se resolvió mediante discusión.
Resultados principales
Se incluyeron cuatro ensayos (tres ECA de grupos paralelos y un ensayo cruzado (cross‐over)) con un total de 139 participantes. Este resultado no ha variado respecto a la revisión publicada en 2019. El cegamiento de los participantes y los médicos se informó de forma adecuada en tres ensayos, y uno no informó sobre si se cegó al personal. Se consideró que el riesgo de sesgo general en los ensayos era bajo. Solo dos ensayos (con 63 y 18 participantes, respectivamente) proporcionaron información suficiente para ser incluida en el metanálisis. No se encontró un efecto claro de la EMPr en las actividades cotidianas al final del tratamiento (diferencia de medias (DM) ‐3,00; intervalo de confianza (IC) del 95%: ‐16,35 a 10,35; P = 0,66; un ensayo; 63 participantes; evidencia de certeza baja) y al final del seguimiento (DM ‐2,00; IC del 95%: ‐14,86 a 10,86; P = 0,76; un ensayo; 63 participantes; evidencia de certeza baja) cuando se comparó la EMPr más la rehabilitación con la rehabilitación simulada. No se encontraron diferencias estadísticas en la mejoría de la función de las extremidades superiores al final del tratamiento (DM 2,00; IC del 95%: ‐4,91 a 8,91; P = 0,57; un ensayo; 63 participantes; evidencia de certeza baja) y al final del seguimiento (DM 4,00; IC del 95%: ‐2,92 a 10,92; P = 0,26; un ensayo; 63 participantes; evidencia de certeza baja) cuando se comparó la EMPr más la rehabilitación con la EMPr simulada más la rehabilitación. Se observó una disminución de la espasticidad del codo al final del seguimiento (DM ‐0,41; IC del 95%: ‐0,89 a ‐0,07; un ensayo; 63 participantes; evidencia de certeza baja) cuando se comparó la EMPr más la rehabilitación con la EMPr simulada más la rehabilitación. En cuanto a la fuerza muscular, el tratamiento de la EMPr no se asoció con una mejoría en la fuerza muscular de los dorsiflexores del tobillo al final del tratamiento (DM 3,00; IC del 95%: ‐2,44 a 8,44; P = 0,28; un ensayo; 18 participantes; evidencia de certeza baja) en comparación con la EMPr simulada. Ningún estudio proporcionó información sobre la función de las extremidades inferiores o los eventos adversos, incluida la muerte. Según el método GRADE, la confianza en la evidencia relacionada con el desenlace principal se consideró baja debido al tamaño muestral pequeño de los estudios.
Conclusiones de los autores
No existe evidencia suficiente para sacar conclusiones acerca del uso sistemático de la EMPr en personas tras un accidente cerebrovascular. Se necesitan ensayos adicionales con tamaños muestrales grandes para proporcionar evidencia sólida para emplear la EMPr después de un accidente cerebrovascular.
PICO
Resumen en términos sencillos
Estimulación magnética periférica repetitiva para mejorar las actividades cotidianas de las personas después de sufrir un ictus
Pregunta de la revisión
¿Es la estimulación magnética periférica repetitiva (EMPr) efectiva para mejorar las actividades cotidianas de las personas después de un ictus?
Antecedentes
El ictus, la causa más común de discapacidad, ocurre cuando el suministro de sangre a una parte del cerebro se interrumpe o se reduce. Se conocen dos tipos de ictus: isquémico (debido a la falta de flujo sanguíneo) y hemorrágico (debido a la hemorragia). La parálisis del brazo o de la pierna después de un ictus causa problemas con las actividades y funciones cotidianas, incluyendo comer, ducharse, vestirse y caminar. Tras sufrir un ictus, las personas suelen requerir rehabilitación física, es decir, entrenamiento de las extremidades superiores e inferiores, ejercicio centrado en las actividades cotidianas y el uso de ayuda para caminar (por ejemplo, un bastón). Sin embargo, actualmente existen pocos tratamientos efectivos. La estimulación magnética periférica repetitiva (EMPr) es un tratamiento no invasivo (tratamiento que no implica la inserción de un instrumento en el cuerpo) que puede mejorar el movimiento en personas con debilidad muscular debida a daños cerebrales o nerviosos mediante la estimulación de las ramas finales del nervio motor para provocar una contracción muscular. La EMPr puede penetrar en las capas profundas de los músculos y es casi indolora, sin apenas efectos secundarios.
Fecha de la búsqueda
La búsqueda está actualizada hasta el 5 de junio de 2021.
Características de los estudios
Esta es una actualización de la revisión publicada en 2019. Se examinó la evidencia de cuatro ensayos controlados aleatorizados (estudios en los que los participantes son asignados al azar a uno de dos o más grupos de tratamiento) de la EMPr con un total de 139 participantes. Dos estudios compararon la EMPr con una estimulación "falsa" (una estimulación muy débil o un sonido solamente). Dos estudios compararon la EMPr más rehabilitación con la estimulación falsa más rehabilitación.
Resultados clave
Se encontró poca evidencia de que el uso de EMPr mejoró las actividades cotidianas, la fuerza muscular, la funcionalidad de las extremidades superiores y la espasticidad (rigidez inusual de los músculos) de las personas tras un ictus. El resultado actual no varía respecto a la revisión publicada en 2019. Aunque un ensayo informó de que la EMPr redujo la espasticidad de la extremidad superior, el efecto fue pequeño y sigue siendo incierto.
Calidad de la evidencia
La calidad de la evidencia se consideró baja para la mejoría de las actividades cotidianas, principalmente porque un estudio tuvo un tamaño muestral pequeño.
Conclusiones de los autores
Aún no está claro si la EMPr es útil para mejorar las actividades cotidianas y la capacidad funcional en las personas que han sufrido un ictus. Se necesitan más ensayos que incluyan un número mayor de participantes para determinar los efectos de la EMPr.
Authors' conclusions
Summary of findings
| Active rPMS only compared with sham rPMS in stroke | ||||||
| Patient or population: people with stroke Setting: not reported Intervention: active rPMS Comparison: sham rPMS | ||||||
| Outcomes | Anticipated absolute effects* (95% CI) | Relative effect | No. of participants | Certainty of the evidence | Comments | |
|---|---|---|---|---|---|---|
| Risk with sham rPMS | Risk with rPMS | |||||
| Activities of daily living (ADLs) | ‐ | ‐ | See comment | ‐ | ‐ | No trials measured this outcome. |
| Upper limb function | ‐ | ‐ | See comment | ‐ | ‐ | No trials measured this outcome. |
| Lower limb function | ‐ | ‐ | See comment | ‐ | ‐ | No trials measured this outcome. |
| Spasticity (elbow) | ‐ | ‐ | See comment | ‐ | ‐ | No trials measured this outcome. |
| Spasticity (wrist) | ‐ | ‐ | See comment | ‐ | ‐ | No trials measured this outcome. |
| Muscle strength | Mean muscle strength 10.44 kg | MD 3 kg higher | ‐ | 18 | ⊕⊕⊝⊝ |
|
| Death | ‐ | ‐ | See comment | ‐ | ‐ | No trials reported this outcome. |
| *The risk in the intervention group (and its 95% confidence interval) is based on assumed risk in the comparison group and relative effect of the intervention (and its 95% CI). CI: confidence interval; MD: mean difference; RCT: randomised controlled trial; rPMS: repetitive peripheral magnetic stimulation. | ||||||
| GRADE Working Group grades of evidence | ||||||
| aOne study with small sample size; 95% CI overlaps zero. | ||||||
| Active rPMS only compared with no intervention in stroke | ||||||
| Patient or population: people with stroke Setting: not available Intervention: active rPMS Comparison: no intervention | ||||||
| Outcomes | Anticipated absolute effects* (95% CI) | Relative effect | No. of participants | Certainty of the evidence | Comments | |
|---|---|---|---|---|---|---|
| Risk with no intervention | Risk with rPMS | |||||
| Activities of daily living (ADLs) | ‐ | ‐ | See comment | ‐ | ‐ | No trials measured this outcome. |
| Upper limb function | ‐ | ‐ | See comment | ‐ | ‐ | No trials measured this outcome. |
| Lower limb function | ‐ | ‐ | See comment | ‐ | ‐ | No trials measured this outcome. |
| Spasticity (elbow) | ‐ | ‐ | See comment | ‐ | ‐ | No trials measured this outcome. |
| Spasticity (wrist) | ‐ | ‐ | See comment | ‐ | ‐ | No trials measured this outcome. |
| Muscle strength | ‐ | ‐ | See comment | ‐ | ‐ | No trials measured this outcome. |
| Death | ‐ | ‐ | See comment | ‐ | ‐ | No trials measured this outcome. |
| *The risk in the intervention group (and its 95% confidence interval) is based on assumed risk in the comparison group and relative effect of the intervention (and its 95% CI). CI: confidence interval; rPMS: repetitive peripheral magnetic stimulation. | ||||||
| GRADE Working Group grades of evidence | ||||||
| Active rPMS plus rehabilitation compared with sham rPMS plus rehabilitation in stroke | ||||||
| Patient or population: people with stroke Setting: neurological rehabilitation hospital Intervention: active rPMS plus rehabilitation Comparison: sham rPMS plus rehabilitation | ||||||
| Outcomes | Anticipated absolute effects* (95% CI) | Relative effect | No. of participants | Certainty of the evidence | Comments | |
|---|---|---|---|---|---|---|
| Risk with sham rPMS plus rehabilitation | Risk with active rPMS plus rehabilitation | |||||
| Activities of daily living (ADLs) | Mean ADL score 50 | MD 3 lower (16.35 lower to 10.35 higher) | ‐ | 63 | ⊕⊕⊝⊝ |
|
| Upper limb function | Mean upper limb function score 13 | MD 2 higher | ‐ | 63 | ⊕⊕⊝⊝ |
|
| Lower limb function | ‐ | ‐ | See comment | ‐ | ‐ | No trials measured this outcome. |
| Spasticity (elbow) | Mean spasticity (elbow) score 1.41 | MD 0.41 lower | ‐ | 63 | ⊕⊕⊝⊝ |
|
| Spasticity (wrist) | Mean spasticity (wrist) score 2.13 | MD 0.2 lower | ‐ | 63 | ⊕⊕⊝⊝ |
|
| Muscle strength | ‐ | ‐ | See comment | ‐ | ‐ | No trials measured this outcome. |
| Death | ‐ | ‐ | See comment | ‐ | ‐ | No trials measured this outcome. |
| *The risk in the intervention group (and its 95% confidence interval) is based on assumed risk in the comparison group and relative effect of the intervention (and its 95% CI). CI: confidence interval; MD: mean difference; RCT: randomised controlled trial; rPMS: repetitive peripheral magnetic stimulation. | ||||||
| GRADE Working Group grades of evidence | ||||||
| aOne study with small sample size; 95% CI overlaps zero. | ||||||
| Active rPMS plus rehabilitation compared with rehabilitation only in stroke | ||||||
| Patient or population: people with stroke Setting: not available Intervention: active rPMS plus rehabilitation Comparison: rehabilitation only | ||||||
| Outcomes | Anticipated absolute effects* (95% CI) | Relative effect | No. of participants | Certainty of the evidence | Comments | |
|---|---|---|---|---|---|---|
| Risk with rehabilitation only | Risk with active rPMS plus rehabilitation | |||||
| Activities of daily living (ADLs) | ‐ | ‐ | See comment | ‐ | ‐ | No trials measured this outcome. |
| Upper limb function | ‐ | ‐ | See comment | ‐ | ‐ | No trials measured this outcome. |
| Lower limb function | ‐ | ‐ | See comment | ‐ | ‐ | No trials measured this outcome. |
| Spasticity (elbow) | ‐ | ‐ | See comment | ‐ | ‐ | No trials measured this outcome. |
| Spasticity (wrist) | ‐ | ‐ | See comment | ‐ | ‐ | No trials measured this outcome. |
| Muscle strength | ‐ | ‐ | See comment | ‐ | ‐ | No trials measured this outcome. |
| Death | ‐ | ‐ | See comment | ‐ | ‐ | No trials measured this outcome. |
| *The risk in the intervention group (and its 95% confidence interval) is based on assumed risk in the comparison group and relative effect of the intervention (and its 95% CI). CI: confidence interval; rPMS: repetitive peripheral magnetic stimulation. | ||||||
| GRADE Working Group grades of evidence | ||||||
Background
Description of the condition
Stroke is a serious healthcare problem that requires long‐term rehabilitation as a core component of recovery (Sacco 2013). Every year, around 16 million strokes occur throughout the world, causing 5.7 million deaths (Strong 2007). Approximately 88% of all strokes are of the ischaemic type; other types of stroke include haemorrhagic and subarachnoid (Park 2012). The most common disability after stroke is motor impairment (Langhorne 2009), which adversely affects the control of arm and leg movement and occurs in nearly 80% of people after stroke (De Vries 2007). At present, although poststroke functional recovery remains a high priority in health care, the evidence on effective interventions for poststroke impairment is limited (McArthur 2011).
Description of the intervention
Repetitive peripheral magnetic stimulation (rPMS) is a unique, non‐invasive treatment method that was developed for therapeutic neuromodulation in movement disorders (Beaulieu 2013). In rPMS, a stimulation coil (magnetic field generator) is placed over paralysed muscles of the arms, legs, or torso. The stimulation coil is attached to a stimulator (pulse generator), which provides an electrical current to the coil. The coil builds up a magnetic field as it passes through the skin, and it directs an electrical current into the neurons. Once the current achieves a certain value, an action potential is induced, which causes the neuron to depolarise and the muscles to eventually contract.
Treatment by rPMS allows painless stimulation of deep muscle structures that cannot be reached by neuromuscular electrical stimulation (NMES) (Barker 1991; Ito 2013). NMES recruits cutaneous receptors, whereas rPMS generates proprioceptive information during muscle contraction. Proprioceptive feedback during muscle contraction can influence brain plasticity and improve the sensorimotor system, whilst cutaneous receptors can generate noisy signals. These differences between NMES and rPMS are important. People receiving rPMS do not need to remove their clothes because the procedure does not require the placement of electrodes on the skin. Implanted medical devices, such as pacemakers or deep brain simulators, are contraindications for rPMS as well as NMES. However, the technology has no known negative side effects. NMES is widely used to treat people with motor deficits resulting from brain or nerve disorders, and rPMS is also beginning to be used for these conditions. rPMS devices are more bulky and expensive than NMES, which precludes wide use of the technology. Nevertheless, rPMS can be performed to safely stimulate deeper regions of muscle without pain, and can potentially improve functional recovery in people after stroke (Han 2006).
How the intervention might work
Applying rPMS to the muscle induces a proprioceptive input to the central nervous system in two ways (Struppler 2004), as follows.
-
Direct activation of sensorimotor nerve fibres with an orthodromic and antidromic conduction.
-
Indirect activation of mechanoreceptors during rhythmical contraction and relaxation, as well as vibration of the muscles.
This afferent input elicits sensations and reaches higher levels of the central nervous system.
Initial assessment of transcranial magnetic stimulation revealed an increase in corticomotor excitability after rPMS, and subsequent functional magnetic resonance imaging assessment showed focal activations within the sensorimotor cortex in healthy participants (Gallasch 2015). After stroke, rPMS increased motor‐evoked potential amplitude (Flamand 2014), as well as motor cortex excitability (Heldmann 2000; Krause 2008). One study showed that rPMS caused brain plastic change and increased ankle muscle strength on the paretic side in chronic patients after stroke, although NMES did not (Beaulieu 2017). Further, rPMS suppressed spasticity (Struppler 2003), and had a modulatory effect on motor performance (Struppler 2004). This technique is also thought to increase neural excitability of the cortex and to balance interactions between hemispheres, thereby contributing to functional improvement in people after stroke (Kerkhoff 2001).
Why it is important to do this review
Several clinical trials have examined the use of rPMS for people with functional disability (Heldmann 2000; Nielsen 1996; Struppler 2004; Struppler 2007). However, the peer‐reviewed literature includes no systematic review assessing the findings of available trials. It remains unclear whether rPMS is useful for people with functional disability after stroke, what type of stimulation (high frequency, low frequency, or other) should be performed, and on which part of the body (upper limb, lower limb, or others). In addition, rPMS studies have tended to include small sample sizes. A systematic review of trials was therefore needed to evaluate the effectiveness of rPMS.
Objectives
To assess the effects of rPMS in improving activities of daily living and functional ability in people after stroke.
Methods
Criteria for considering studies for this review
Types of studies
We included individual randomised controlled trials (RCTs), cluster‐RCTs, and cross‐over trials. We excluded quasi‐RCTs (trials in which the method of allocating participants to a treatment is not strictly random, e.g. by date of birth, hospital record number, alternation).
Types of participants
We included people after stroke regardless of sex, age, and stroke severity and duration. Stroke is defined by the World Health Organization as a "neurological deficit of cerebrovascular cause that lasts more than 24 hours or leads to death within 24 hours" (WHO 1989). We included mixed participant groups that consisted of people after stroke and other brain diseases, such as traumatic brain injury, if more than half of the included participants had a diagnosis of stroke.
Types of interventions
We included trials comparing any type of active rPMS or rPMS plus rehabilitation for improving functional ability versus any type of control intervention (i.e. sham rPMS, sham rPMS plus rehabilitation for improving functional ability, or no intervention). Investigators conducted rPMS peripherally (not for the central nervous system such as brain or spinal cord) and non‐invasively (without the use of puncture needle or implantation techniques).
We investigated the following comparisons.
-
Active rPMS only compared with sham rPMS.
-
Active rPMS only compared with no intervention.
-
Active rPMS plus rehabilitation compared with sham rPMS plus rehabilitation.
-
Active rPMS plus rehabilitation compared with rehabilitation only.
Types of outcome measures
Primary outcomes
Activities of daily living (ADLs) at the end of treatment and at the end of scheduled follow‐up. ADLs refer to basic tasks of everyday life, including self‐care activities such as eating, bathing, dressing, and toileting. We preferentially used the Barthel Index (BI) or the Functional Independence Measure (FIM), but allowed any related validated measuring tools such as:
-
Katz Index of Independence in Activities of Daily Living; and
-
Frenchay Activities Index (FAI).
Secondary outcomes
We included the following five other outcome measures. Any related validated measuring tools were allowed.
-
Upper limb function.
-
Fugl‐Meyer Assessment.
-
Action Research Arm Test.
-
Wolf Motor Function Test (seconds).
-
-
Lower limb function.
-
Gait velocity (cm/s).
-
Timed Up and Go Test (seconds).
-
-
Spasticity.
-
(Modified) Tardieu Scale.
-
Modified Ashworth Scale (MAS).
-
-
Muscle strength.
-
Grip strength (kg).
-
Medical Research Council (MRC) Scale.
-
-
Death (as adverse event).
We explored secondary outcomes at the end of treatment and at the end of scheduled follow‐up. We analysed these outcomes as continuous data.
Search methods for identification of studies
See the 'Specialised Register' information at the Cochrane Stroke Group's website. We searched for trials in all languages and arranged for translation of relevant articles published in languages other than English and Japanese. We did not impose any other restrictions for searches.
Electronic searches
We searched the Cochrane Stroke Specialised Register and the following electronic databases.
-
Cochrane Central Register of Controlled Trials (CENTRAL; 2021, Issue 10), in the Cochrane Library (searched 5 October 2021) (Appendix 1).
-
MEDLINE in Ovid (1946 to 5 October 2021) (Appendix 2).
-
Embase in Ovid (1980 to 5 October 2021) (Appendix 3).
-
Cumulative Index to Nursing and Allied Health Literature (CINAHL), in EBSCO (1937 to 5 October 2021) (Appendix 4).
-
PsycINFO in Ovid (1806 to 5 October 2021) (Appendix 5).
-
Allied and Complementary Medicine Database (AMED), in Ovid (1985 to 5 October 2021) (Appendix 6).
-
OTseeker: Occupational Therapy Systematic Evaluation of Evidence (www.otseeker.com/) (searched 5 October 2021) (Appendix 7).
-
Physiotherapy Evidence Database (PEDro; www.pedro.fhs.usyd.edu.au/) (1929 to 5 October 2021) (Appendix 8).
-
Ichushi‐Web (Japan Medical Abstracts Society (JAMAS)) (www.jamas.or.jp/) (searched 5 October 2021) (Appendix 9).
We developed the MEDLINE search strategy (Appendix 2) with the help of the Cochrane Stroke Group Information Specialist and adapted it for use with the other databases.
We also searched the following ongoing trials registers.
-
US National Institutes of Health Ongoing Trials Register ClinicalTrials.gov (www.clinicaltrials.gov; searched 5 October 2021) (Appendix 10).
-
ISRCTN Registry (www.isrctn.com/; searched 5 October 2021) (Appendix 11).
-
Stroke Trials Registry (www.strokecenter.org/trials/; searched 7 January 2019) (Appendix 12).
-
World Health Organization (WHO) International Clinical Trials Registry Platform (ICTRP) (www.who.int/ictrp/search/en/; searched 5 October 2021) (Appendix 13).
-
Japanese University hospital Medical Information Network (UMIN) Clinical Trials Registry (UMIN‐CTR) (www.umin.ac.jp/ctr/; searched 5 October 2021) (Appendix 14).
-
Japan Registry of Clinical Trials (jRCT) (jrct.niph.go.jp/; searched 5 October 2021) (Appendix 15).
We did not search the Stroke Trials Registry (www.strokecenter.org/trials) for this version of the review as it is now inactive.
Searching other resources
To identify additional published and unpublished relevant studies for potential inclusion in the review, we:
-
contacted experts in the field;
-
screened the reference lists of relevant articles; and
-
searched in Google Scholar (scholar.google.co.uk/).
Data collection and analysis
Selection of studies
Two review authors (YW, MO) independently screened the titles and abstracts of references obtained by our searches and excluded obviously irrelevant reports. We retrieved the full‐text articles for the remaining references, and two review authors (YW, MO) independently screened these to identify studies for inclusion. We identified and recorded reasons for the exclusion of ineligible studies. Any disagreements were resolved through discussion or by consulting a third review author (TK) if required. We collated multiple reports of the same study so that each study, rather than each report, was the unit of interest in the review. We recorded the selection process and completed a PRISMA flow diagram (Moher 2009). We included studies presented only as abstracts if sufficient information was reported. We used Covidence software for reference handling (Covidence).
Data extraction and management
Two review authors (YW, MO) independently extracted the following data from the included studies and entered the data into Covidence (Covidence).
-
Methods: study design, randomisation method, allocation concealment method, blinding methods.
-
Participants: diagnosis (type, severity, and location of stroke), number in each group, age, sex, baseline comparability between two groups, time from onset, losses to follow‐up.
-
Interventions: details of rPMS (frequency, intensity, duration, treatment session), target of stimulation, co‐exercise.
-
Outcomes: types of outcomes, time points assessed.
-
Other: setting, publication year, sources of funding, intention‐to‐treat analysis (ITT).
All disagreements were resolved by discussion.
Assessment of risk of bias in included studies
Two review authors (YW, MO) independently assessed risk of bias for each study according to the criteria outlined in the Cochrane Handbook for Systematic Reviews of Interventions (Higgins 2011), along with Covidence (Covidence). We used the Cochrane risk of bias tool, which includes the following domains: random sequence generation, allocation concealment, blinding of participants and personnel, blinding of outcome assessment, incomplete outcome data, selective outcome reporting, and other bias. We assessed each domain as having low risk, high risk, or unclear risk of bias (Higgins 2011). Any disagreements between review authors were resolved by discussion or by consultation with a third review author (TK).
Overall risk of bias
We made explicit judgements about whether studies were at high risk of bias based on the criteria in the Cochrane Handbook for Systematic Reviews of Interventions (Higgins 2011). With reference to the above domains, we assessed the likely magnitude and direction of the bias and whether we considered it likely to impact study findings.
We graded the risk of bias for each domain and provided information from the study report together with a justification for our judgement in the risk of bias tables.
Measures of treatment effect
For all outcomes, we carried out analyses as far as possible on an ITT basis, that is we attempted to include in the analyses all participants randomised to each group, and analysed all participants in the group to which they had been allocated, regardless of whether they received the allocated intervention. The denominator for each outcome in each trial was the number randomised minus any participants whose outcomes were known to be missing.
Dichotomous data
For dichotomous data, we presented results as risk ratios (RRs) with 95% confidence intervals (CIs).
Continuous data
For continuous data, we used the mean difference (MD) and 95% CI if outcomes were measured in the same way between trials. To combine trials that measured the same outcome but used different scales, we used the standardised mean difference (SMD) and 95% CI.
Unit of analysis issues
Standard parallel‐group RCTs
We treated individual participants as the unit of analysis.
Cluster‐randomised trials
We planned to include cluster‐randomised trials in the analyses, along with individually randomised trials. We planned that if we found such trials, we would adjust standard errors (SEs) using the methods described in the Cochrane Handbook for Systematic Reviews of Interventions, on the basis of an estimate of the intracluster correlation coefficient (ICC) derived from the trial if possible, from a similar trial, or from a study of a similar population. If we used ICCs from other sources, we would report this and conduct sensitivity analyses to investigate the effect of variation in the ICC. If we identified both cluster‐randomised trials and individually randomised trials, we would synthesise relevant information.
We also planned to assess heterogeneity in the randomisation unit and perform a sensitivity analysis to investigate effects of the randomisation unit.
Cross‐over trials
We included cross‐over trials in the review, only analysing data from the first phase of these trials.
Multi‐armed trials
We planned that if we identified trials with multiple intervention arms, we would include only directly relevant arms. If the trial included several relevant intervention arms, we would combine all relevant experimental intervention groups of the study into a single group, and combine all relevant control intervention groups into a single control group.
Dealing with missing data
If necessary, we contacted trial authors to obtain missing data, as well as data collected but not reported. We recorded levels of attrition for the included studies. We planned to perform sensitivity analysis to explore the impact of including studies with high levels of missing data in the overall assessment of treatment effect.
For all outcomes, we carried out analyses as far as possible on an ITT basis, that is we attempted to include in the analyses all participants randomised to each group, and analysed all participants in the group to which they had been allocated, regardless of whether they received the allocated intervention. The denominator for each outcome in each trial was the number randomised minus any participants whose outcomes were known to be missing.
Assessment of heterogeneity
We assessed statistical heterogeneity in each meta‐analysis using the I² statistic. We regarded heterogeneity as substantial if I² was greater than 50%. We used Review Manager 5 to assess heterogeneity (Review Manager 2020).
Assessment of reporting biases
We planned that if we found 10 or more studies, we would use funnel plots to detect publication bias. If asymmetry was suggested by visual assessment, we would perform exploratory analyses to investigate this. We also investigated selective outcome reporting through comparison of the methods section of articles with the reported results.
Data synthesis
Two review authors (YW, MO) independently extracted data from the included trials. One review author (TK) entered the data into Review Manager 5, and another review author (RM) checked the entries. Any disagreements were resolved through discussion, with reference to the original report.
We carried out statistical analysis using Review Manager 5 (Review Manager 2020). We used fixed‐effect meta‐analysis in combining data when it was reasonable to assume that studies were estimating the same underlying treatment effect, that is when trials were examining the same intervention, and when trial populations and methods were judged to be sufficiently similar. If clinical heterogeneity was sufficient to expect that underlying treatment effects would differ between trials, or if we detected substantial statistical heterogeneity, we used random‐effects meta‐analysis to produce an overall summary if an average treatment effect across trials was considered clinically meaningful. We treated the random‐effects summary as the average range of possible treatment effects, and discussed the clinical implications of differing treatment effects between trials. If the average treatment effect was not clinically meaningful, we did not combine trials. If we used random‐effects analyses, we presented results as the average treatment effect with 95% CI, along with estimates of Tau² and I². If it was inappropriate or impossible to pool data quantitatively, we provided a narrative summary of study results.
Subgroup analysis and investigation of heterogeneity
When we identified substantial heterogeneity in the primary outcomes, we investigated this by conducting subgroup analyses. We considered whether an overall summary was meaningful, and if so, used random‐effects analysis to produce it.
We planned to carry out the following subgroup analyses of primary outcomes if sufficient data were available.
-
Location of stimulation: upper limb versus lower limb or trunk.
-
Type of stroke: cerebral infarction versus cerebral haemorrhage.
-
Duration of illness: acute to subacute phase (to six months after stroke) versus chronic phase (more than six months after stroke).
We assessed subgroup differences by checking if a statistically significant subgroup difference was detected using Review Manager 5 (Review Manager 2020). We reported the results of subgroup analyses by quoting the Chi² statistic and the P value, and results by providing the I² statistic.
Sensitivity analysis
If we identified two or more studies that evaluated our primary outcome, we would perform sensitivity analyses to determine how the results were affected by excluding:
-
studies with inadequate allocation concealment and random sequence generation;
-
studies in which outcome assessment was not blinded;
-
studies in which loss to follow‐up was not reported or was greater than 10%; and
-
unpublished studies.
Summary of findings and assessment of the certainty of the evidence
We used the GRADE approach to assess the certainty of the body of evidence related to the following main outcomes at the end of treatment (Guyatt 2008).
-
ADLs.
-
Upper limb function.
-
Lower limb function.
-
Spasticity.
-
Muscle strength.
-
Death.
We used GRADEpro GDT to import data from Review Manager 5 to create summary of findings tables (GRADEpro GDT; Review Manager 2020). We produced a summary of the intervention effect and a measure of certainty for each of the above outcomes using the GRADE approach (Ryan 2016). The GRADE approach is based on five considerations (study limitations, consistency of effect, imprecision, indirectness, and publication bias) and is used to assess the certainty of the body of evidence for each outcome. Evidence can be downgraded from 'high certainty' by one level for serious (or by two levels for very serious) limitations, depending on assessments for risk of bias, indirectness of evidence, serious inconsistency, imprecision of effect estimates, or potential publication bias.
Results
Description of studies
Results of the search
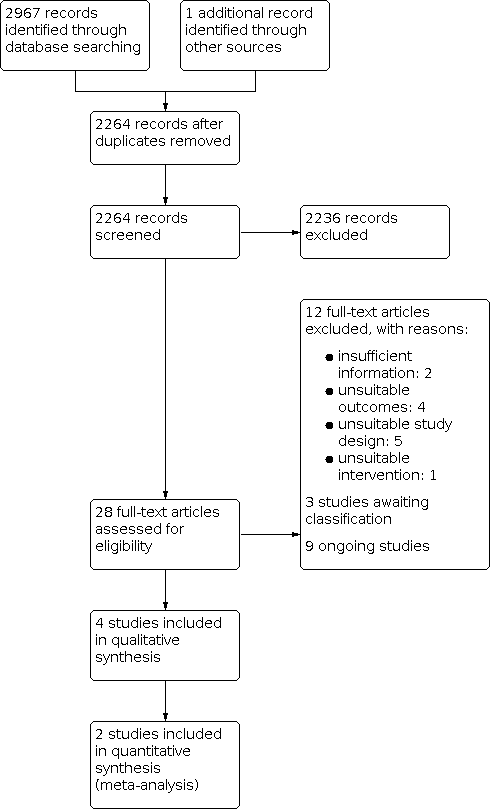
See Figure 1.

Study flow diagram.
The database searches for this update yielded 2967 records. After screening titles and abstracts, we identified 28 potentially relevant articles. After full‐text review, we included four trials involving a total of 139 participants (Beaulieu 2015a; Krewer 2014; Werner 2016; Zifko 2002).
Included studies
See Characteristics of included studies.
Study design and study location
We included three parallel‐group trials (Beaulieu 2015a; Krewer 2014; Zifko 2002), as well as one cross‐over trial (Werner 2016), in the qualitative synthesis. Two trials were from Germany; one from Canada; and one from Austria. In the previous version of this review, one trial was assessed as awaiting classification due to insufficient information (Zifko 2002). In this update, we decided after discussion to include this trial because it provided sufficient information on interventions and outcomes, and only lacked information on assessment time point.
Sample characteristics
The four included trials involved a total of 139 participants. Individual sample sizes of identified trials ranged from 18 in Beaulieu 2015a and Zifko 2002 to 63 in Krewer 2014. The mean age of participants was 55 years or younger (Beaulieu 2015a; Krewer 2014; Werner 2016), and mean time from onset ranged from less than 26 weeks in Krewer 2014 to 83 months in Beaulieu 2015a. Two studies included patients after stroke with an elapsed time from onset of at least 12 months (Beaulieu 2015a; Werner 2016). The trials included more men (57%) than women (43%) participants. Two studies included traumatic brain injury (Krewer 2014; Werner 2016), and one study included tetraparesis (Werner 2016). Participants with traumatic brain injury could not be excluded. We decided to include trials of mixed groups if more than half of participants had received a stroke diagnosis. We noted imbalances in time from onset in Beaulieu 2015a and Krewer 2014, and in mean age in Werner 2016, but we considered these unlikely to affect outcomes. In all studies groups were comparable in terms of baseline characteristics assessed.
Intervention approaches
The included studies used varied protocols of rPMS. Frequency of rPMS ranged from 5 Hz in Werner 2016 to 25 Hz in Krewer 2014. One study adopted theta‐burst frequency rPMS (Beaulieu 2015a). The duration of stimulation (per session) ranged from 190 seconds in Beaulieu 2015a to 20 minutes in Krewer 2014, and the number of stimulations (per session) ranged from 600 in Beaulieu 2015a to 5000 in Krewer 2014. Only one study conducted multiple stimulation sessions as part of the treatment regimen (two times a day, five times a week, for two weeks) (Krewer 2014). Targets of stimulation were the lower leg (Beaulieu 2015a), the upper and lower arm (Krewer 2014), the upper arm (Zifko 2002), and the lower arm (Werner 2016). Co‐exercise included occupational therapy after each stimulation (Krewer 2014), as well as muscle stretching during stimulation (Werner 2016). Sham stimulation consisted of low‐intensity stimulation in Beaulieu 2015a, or a clicking sound only in Krewer 2014, Werner 2016, and Zifko 2002.
Outcomes
The included trials used several heterogeneous outcome measures. Only one study assessed our primary outcome (ADLs) as measured by the Barthel Index (Krewer 2014). As muscle strength evaluation, Beaulieu 2015a measured maximal isometric strength of the ankle dorsiflexors. Krewer 2014 assessed upper limb function using the Fugl‐Meyer Assessment, and Zifko 2002 used angle of motion for hand extension and hand flexion and the Bard and Hirschberg Score and Action Research Arm Test. Investigators measured spasticity using the Modified Tardieu Scale (Krewer 2014), the Ashworth Score (Zifko 2002), the Modified Ashworth Score (Werner 2016), or the Gerstenbrand Spasticity Rating Scale (Zifko 2002). Two trials evaluated outcomes immediately after treatment (Beaulieu 2015a; Werner 2016); one trial measured outcomes after two weeks of treatment and two weeks after the treatment phase (Krewer 2014). One trial provided no information on the assessment time point (Zifko 2002). None of the included studies reported any adverse events, including death.
Excluded studies
We excluded 12 of 28 potentially relevant studies because they did not meet the inclusion criteria. Reasons for their exclusion are provided in the Characteristics of excluded studies table. Five studies were not RCTs (Bernhardt 2007; Struppler 2002; Struppler 2009; Chen 2020; Obayashi 2020), and four studies measured outcomes that differed from those provided in our protocol (Heldmann 2000; Kuznetsova 2016; Kuznietsova 2016; Momosaki 2014). One study evaluated an unsuitable intervention (Rossini 2005). Two studies were excluded because of insufficient information provided (Kinoshita 2020; Suzuki 2020).
Studies awaiting classification
The available evidence was insufficient to determine eligibility, and we were unable to make contact with the study authors (Kotchetkov 1999; Kuznetsova 2013; Samosiuk 2003).
Ongoing studies
We identified nine ongoing trials that appeared to be relevant for inclusion (DRKS00000798; DRKS00007722; DRKS00007899; jRCTs032190191; jRCTs042180014; jRCTs042180043; UMIN000018750; UMIN000019106; UMIN000031957). These studies were either inpatient or outpatient and included between 50 and 118 participants. According to the study registry, three studies were completed but not yet published, and six studies were ongoing. If these studies are eventually deemed to be eligible, they will be considered in the next review update (UMIN000018750; UMIN000019106). One study including 20 participants compared rPMS with sham rPMS in stroke patients and was completed on 31 March 2020 (UMIN000019106). Similarly, a study that included 50 participants compared rPMS plus physical therapy with physical therapy alone and was completed on 12 December 2017 (UMIN000018750). One study including 44 participants compared rPMS plus occupational therapy with sham stimulation and was completed on 28 May 2008 (DRKS00000798). This trial was registered retrospectively.
Risk of bias in included studies

Risk of bias graph: review authors' judgements about each risk of bias item presented as percentages across all included studies.

Risk of bias summary: review authors' judgements about each risk of bias item for each included study.
Allocation
Sequence generation
Werner 2016 conducted sequence generation with the help of a computer‐generated lot (www.randomizer.at), and was therefore judged to be at low risk of bias. The remaining studies did not report random sequence generation and were assessed as at unclear risk of bias.
Allocation concealment
We judged allocation concealment to be at low risk of bias in two trials (Krewer 2014; Werner 2016). The other two studies did not report on this and were judged to be at unclear risk of bias (Beaulieu 2015a; Zifko 2002).
Blinding
Participants and personnel
Three trials implemented blinding with regard to participants and personnel, and one study provided no information on whether personnel were blinded. Investigators conducted sham stimulations adequately. We assessed three studies as having a low risk of performance bias (Beaulieu 2015a; Krewer 2014; Werner 2016), and one study as having an unclear risk of performance bias (Zifko 2002).
Outcome assessment
All trials provided blinding with regard to outcome assessors and were assessed as having a low risk of detection bias.
Incomplete outcome data
Beaulieu 2015a and Werner 2016 reported no withdrawals or dropouts and were therefore assessed as having a low risk of attrition bias. Krewer 2014 reported that only three participants were lost to follow‐up (5%), and described no differences between groups in reasons for the missing outcome data. In addition, Krewer 2014 performed ITT analysis; we therefore classified this study as having a low risk of bias. Zifko 2002 reported that two participants (11%) did not complete the study. The reasons for this and whether ITT analysis was conducted were unclear. We therefore classified this study as having an unclear risk of bias.
Selective reporting
Study protocols were not available for any of the included studies, therefore we judged selective reporting bias as unclear for all studies.
Other potential sources of bias
We identified no information associated with other potential sources of bias and therefore judged this domain as low risk for all studies.
Effects of interventions
See: Summary of findings 1 Active rPMS only compared with sham rPMS in stroke; Summary of findings 2 Active rPMS only compared with no intervention in stroke; Summary of findings 3 Active rPMS plus rehabilitation compared with sham rPMS plus rehabilitation in stroke; Summary of findings 4 Active rPMS plus rehabilitation compared with rehabilitation only in stroke
See summary of findings Table 1; summary of findings Table 2; summary of findings Table 3; and summary of findings Table 4.
We contacted the authors of the included studies to request missing outcome data and data collected but not reported. However, we could not obtain data from the first phase of the cross‐over trial (Werner 2016). Zifko 2002 was reported as a conference abstract, and we were unable to access detailed study information or the study author's contact address. Consequently, we excluded these two studies from the quantitative synthesis (meta‐analysis). We included two studies in the quantitative analysis (Beaulieu 2015a; Krewer 2014). As Krewer 2014 evaluated spasticity at both the elbow and the wrist, we analysed these data separately.
Comparison 1. Active rPMS versus sham rPMS
Primary outcome
Activities of daily living
We found no studies examining the effect of rPMS on ADLs as a primary outcome in people after stroke.
Secondary outcomes
Upper limb function
One study reported significant improvement in upper limb function using the angle of motion for hand extension (from 151 to 157), the Action Research Arm Test (from 23.2 to 32.8), and the Bard and Hirschberg Score with regard to hand extension (from 1.4 to 1.7), finger extension (from 1.6 to 2.0), and pronation of the arm (2.2 to 2.7). The assessment time point for this outcome was unclear (Zifko 2002).
Lower limb function
None of the included trials reported on lower limb function.
Spasticity
One study reported significant improvement in spasticity assessed via the Ashworth Scale (from 2.0 to 1.7) and Gerstenbrand Spasticity (from 2.3 to 1.8) (Zifko 2002). The assessment time point for this outcome was unclear (Zifko 2002).
Muscle strength
Only one small study assessed our secondary outcome of muscle strength using maximal isometric strength of the ankle dorsiflexors at the end of treatment (Beaulieu 2015a). This trial included a total of 18 participants and showed that rPMS treatment was not associated with significant improvement in muscle strength at the end of treatment (after a single session) (mean difference (MD) 3.00, 95% confidence interval (CI) −2.44 to 8.44; Analysis 1.1). This study did not report muscle strength at the end of follow‐up.
Adverse events
The included trials did not report adverse events including death associated with rPMS.
Comparison 2. Active rPMS only compared with no intervention
No studies performed this comparison.
Comparison 3. rPMS plus rehabilitation versus sham rPMS plus rehabilitation
Primary outcome
Activities of daily living
Krewer 2014 provided data on ADLs as a Barthel Index score at the end of treatment (after two weeks' treatment) and at the end of follow‐up (two weeks after treatment phase). Data showed no significant differences between the rPMS plus rehabilitation group and the sham plus rehabilitation group (end of treatment: MD −3.00, 95% CI −16.35 to 10.35; Analysis 2.1; end of follow‐up: MD −2.00, 95% CI −14.86 to 10.86; Analysis 2.2).
Secondary outcomes
Upper limb function
Krewer 2014 reported the Fugl‐Meyer Assessment as an outcome measure of upper limb function. The results of this study showed that rPMS plus rehabilitation did not increase upper limb function compared with sham plus rehabilitation at the end of treatment (after two weeks' treatment) and at the end of follow‐up (two weeks after treatment phase) (end of treatment: MD 2.00, 95% CI −4.91 to 8.91; Analysis 2.3; end of follow‐up: MD 4.00, 95% CI −2.92 to 10.92; Analysis 2.4).
Spasticity
Krewer 2014 evaluated spasticity at the elbow and the wrist using the Modified Tardieu Scale. We evaluated results related to the elbow and the wrist separately. We found no significant differences in spasticity between the rPMS plus rehabilitation group and the sham plus rehabilitation group at the end of treatment (after two weeks' treatment) (elbow: MD −0.41, 95% CI −0.89 to 0.07; wrist: MD −0.20, 95% CI −0.76 to 0.36; Analysis 2.5). rPMS plus rehabilitation slightly reduced spasticity of the elbow compared with sham plus rehabilitation at the end of follow‐up (two weeks after treatment phase) (MD −0.48, 95% CI −0.93 to −0.03). We found no differences between the rPMS plus rehabilitation group and the sham plus rehabilitation group in spasticity of the wrist at the end of follow‐up (two weeks after treatment phase) (MD −0.13, 95% CI −0.67 to 0.41; Analysis 2.6).
Werner 2016 evaluated spasticity at the wrist and at the metatarsophalangeal (MCP) joints at 5, 30, 60, and 90 minutes following a single session of rPMS or sham plus stretch for 5 minutes. This study used a cross‐over design, and we were unable to obtain the spasticity score at the first phase in each group.
Other outcomes
None of the included trials reported on lower limb function, muscle strength, or adverse events including death associated with rPMS.
Comparison 4. rPMS plus rehabilitation versus rehabilitation only
No studies performed this comparison.
Discussion
Summary of main results
Four trials (139 participants) were eligible for inclusion in the review. This result was unchanged from the review published in 2019. We did not find high risk of bias across the included trials, and we determined that the overall risk of bias was low. Only one RCT (63 participants) reported the effects of rPMS on activities of daily living, finding that rPMS was not associated with a significant increase in the Barthel Index score (see summary of findings Table 3). Two studies compared rPMS versus sham (Beaulieu 2015a; Zifko 2002). Two studies compared rPMS plus rehabilitation versus sham plus rehabilitation (Krewer 2014; Werner 2016). Only one study conducted multiple stimulation sessions as part of treatment (Krewer 2014). Investigators reported spasticity, muscle strength, and upper limb function as secondary outcomes. Two studies reported significant reduction in spasticity (Krewer 2014; Zifko 2002). One of these studies reported the significant difference in spasticity of the elbow at the end of follow‐up (MD −0.48, 95% CI −0.93 to −0.03) (Krewer 2014). No studies reported significant improvement in strength. Two studies reported upper limb function (Krewer 2014; Zifko 2002): one of these studies did not find significant improvement (Krewer 2014), whilst the other study reported significant improvement (Zifko 2002). None of the included studies reported adverse events including death.
Overall completeness and applicability of evidence
Information provided by the included trials was insufficient to address the aim of our review. Only four trials contributed data to the review, three of which were individual RCTs. We also identified one cross‐over placebo‐controlled trial. We contacted the authors of the cross‐over trial, but received no response, and were therefore unable to include this study in our analysis. Stimulation parameters (frequency, intensity, pulses) and mean time from onset also varied across studies. Two studies included participants after traumatic brain injury as well as participants after stroke. These differences might affect the accuracy of our results. Sample sizes of the studies were small, ranging from 18 to 63 participants, which could have led to insufficient statistical power to detect differences. Large‐scale RCTs are needed to verify the efficacy of rPMS. In most of the included trials, outcomes were assessed at the end of the treatment period or within several weeks after treatment. Whether rPMS has long‐term effects on functional recovery is unclear. According to the trial registries, two out of eight ongoing studies have been completed. One ongoing study measured outcomes of muscle strength, ADL, upper limb function, and lower limb function (UMIN000018750). The other ongoing study measured upper limb function (UMIN000019106). The inclusion of smaller RCTs to be published in the future may change the conclusions of this review on rPMS. It is therefore necessary to monitor preprints, ongoing studies, and studies awaiting classification to obtain relevant results that require an update of this review.
Quality of the evidence
The overall risk of bias was low. Three studies reported blinding, which permitted a definitive judgement regarding performance bias, and one study provided no information on whether personnel were blinded. However, all of the included studies had relatively small sample sizes: 18 participants in Beaulieu 2015a and Zifko 2002, 63 in Krewer 2014, and 40 in Werner 2016. We downgraded the certainty of evidence related to the primary outcome, mainly because one study had a small sample size, with the 95% CI overlapping zero (summary of findings Table 1).
Potential biases in the review process
Despite our extensive literature search, selection bias may have occurred. Although two review authors independently assessed study eligibility, along with risk of bias in order to minimise potential bias in the review, we were required to make several subjective judgements during the review process. A different review team may have evaluated risk of bias differently.
Agreements and disagreements with other studies or reviews
Two previous reviews investigated the effectiveness of rPMS treatment (Beaulieu 2013; Beaulieu 2015b). Beaulieu 2013 summarised the results of 13 studies that used different types of outcomes (neurophysiological, biomechanical, clinical) in healthy individuals and in people with stroke or a spinal disorder. This review included quasi‐experimental studies and case studies and did not conduct pooled analysis. Owing to limited evidence, the review authors could reach no conclusion. Beaulieu 2015b dealt with stimulation parameters reported in any scientific research that applied rPMS as an intervention to improve somatosensory or motor disorders. Their literature search yielded 24 studies on various pathological disorders. The review authors conducted no pooled analysis and concluded that future studies require a more structured design and larger samples. Similarly, our review assessed RCTs with small sample sizes that focused on clinical outcomes after stroke, and found insufficient evidence to judge the effectiveness of rPMS.
An RCT that investigated the effects of low‐frequency repetitive transcranial magnetic stimulation on 112 participants after stroke showed significant improvement in ADLs after four weeks of treatment (Zheng 2015). However, our review on rPMS for ADL with 63 participants did not show a significant improvement in ADL. One reason for this might be the difference in targets of stimulation (transcranial or peripheral).
Study flow diagram.

Risk of bias graph: review authors' judgements about each risk of bias item presented as percentages across all included studies.

Risk of bias summary: review authors' judgements about each risk of bias item for each included study.

Comparison 1: rPMS versus sham, Outcome 1: Muscle strength at the end of treatment

Comparison 2: rPMS plus rehabilitation versus sham plus rehabilitation, Outcome 1: Activities of daily living at the end of treatment

Comparison 2: rPMS plus rehabilitation versus sham plus rehabilitation, Outcome 2: Activities of daily living at the end of follow‐up

Comparison 2: rPMS plus rehabilitation versus sham plus rehabilitation, Outcome 3: Upper limb function at the end of treatment

Comparison 2: rPMS plus rehabilitation versus sham plus rehabilitation, Outcome 4: Upper limb function at the end of follow‐up

Comparison 2: rPMS plus rehabilitation versus sham plus rehabilitation, Outcome 5: Spasticity of the elbow at the end of treatment

Comparison 2: rPMS plus rehabilitation versus sham plus rehabilitation, Outcome 6: Spasticity of the elbow at the end of follow‐up

Comparison 2: rPMS plus rehabilitation versus sham plus rehabilitation, Outcome 7: Spasticity of the wrist at the end of treatment

Comparison 2: rPMS plus rehabilitation versus sham plus rehabilitation, Outcome 8: Spasticity of the wrist at the end of follow‐up
| Active rPMS only compared with sham rPMS in stroke | ||||||
| Patient or population: people with stroke Setting: not reported Intervention: active rPMS Comparison: sham rPMS | ||||||
| Outcomes | Anticipated absolute effects* (95% CI) | Relative effect | No. of participants | Certainty of the evidence | Comments | |
|---|---|---|---|---|---|---|
| Risk with sham rPMS | Risk with rPMS | |||||
| Activities of daily living (ADLs) | ‐ | ‐ | See comment | ‐ | ‐ | No trials measured this outcome. |
| Upper limb function | ‐ | ‐ | See comment | ‐ | ‐ | No trials measured this outcome. |
| Lower limb function | ‐ | ‐ | See comment | ‐ | ‐ | No trials measured this outcome. |
| Spasticity (elbow) | ‐ | ‐ | See comment | ‐ | ‐ | No trials measured this outcome. |
| Spasticity (wrist) | ‐ | ‐ | See comment | ‐ | ‐ | No trials measured this outcome. |
| Muscle strength | Mean muscle strength 10.44 kg | MD 3 kg higher | ‐ | 18 | ⊕⊕⊝⊝ |
|
| Death | ‐ | ‐ | See comment | ‐ | ‐ | No trials reported this outcome. |
| *The risk in the intervention group (and its 95% confidence interval) is based on assumed risk in the comparison group and relative effect of the intervention (and its 95% CI). CI: confidence interval; MD: mean difference; RCT: randomised controlled trial; rPMS: repetitive peripheral magnetic stimulation. | ||||||
| GRADE Working Group grades of evidence | ||||||
| aOne study with small sample size; 95% CI overlaps zero. | ||||||
| Active rPMS only compared with no intervention in stroke | ||||||
| Patient or population: people with stroke Setting: not available Intervention: active rPMS Comparison: no intervention | ||||||
| Outcomes | Anticipated absolute effects* (95% CI) | Relative effect | No. of participants | Certainty of the evidence | Comments | |
|---|---|---|---|---|---|---|
| Risk with no intervention | Risk with rPMS | |||||
| Activities of daily living (ADLs) | ‐ | ‐ | See comment | ‐ | ‐ | No trials measured this outcome. |
| Upper limb function | ‐ | ‐ | See comment | ‐ | ‐ | No trials measured this outcome. |
| Lower limb function | ‐ | ‐ | See comment | ‐ | ‐ | No trials measured this outcome. |
| Spasticity (elbow) | ‐ | ‐ | See comment | ‐ | ‐ | No trials measured this outcome. |
| Spasticity (wrist) | ‐ | ‐ | See comment | ‐ | ‐ | No trials measured this outcome. |
| Muscle strength | ‐ | ‐ | See comment | ‐ | ‐ | No trials measured this outcome. |
| Death | ‐ | ‐ | See comment | ‐ | ‐ | No trials measured this outcome. |
| *The risk in the intervention group (and its 95% confidence interval) is based on assumed risk in the comparison group and relative effect of the intervention (and its 95% CI). CI: confidence interval; rPMS: repetitive peripheral magnetic stimulation. | ||||||
| GRADE Working Group grades of evidence | ||||||
| Active rPMS plus rehabilitation compared with sham rPMS plus rehabilitation in stroke | ||||||
| Patient or population: people with stroke Setting: neurological rehabilitation hospital Intervention: active rPMS plus rehabilitation Comparison: sham rPMS plus rehabilitation | ||||||
| Outcomes | Anticipated absolute effects* (95% CI) | Relative effect | No. of participants | Certainty of the evidence | Comments | |
|---|---|---|---|---|---|---|
| Risk with sham rPMS plus rehabilitation | Risk with active rPMS plus rehabilitation | |||||
| Activities of daily living (ADLs) | Mean ADL score 50 | MD 3 lower (16.35 lower to 10.35 higher) | ‐ | 63 | ⊕⊕⊝⊝ |
|
| Upper limb function | Mean upper limb function score 13 | MD 2 higher | ‐ | 63 | ⊕⊕⊝⊝ |
|
| Lower limb function | ‐ | ‐ | See comment | ‐ | ‐ | No trials measured this outcome. |
| Spasticity (elbow) | Mean spasticity (elbow) score 1.41 | MD 0.41 lower | ‐ | 63 | ⊕⊕⊝⊝ |
|
| Spasticity (wrist) | Mean spasticity (wrist) score 2.13 | MD 0.2 lower | ‐ | 63 | ⊕⊕⊝⊝ |
|
| Muscle strength | ‐ | ‐ | See comment | ‐ | ‐ | No trials measured this outcome. |
| Death | ‐ | ‐ | See comment | ‐ | ‐ | No trials measured this outcome. |
| *The risk in the intervention group (and its 95% confidence interval) is based on assumed risk in the comparison group and relative effect of the intervention (and its 95% CI). CI: confidence interval; MD: mean difference; RCT: randomised controlled trial; rPMS: repetitive peripheral magnetic stimulation. | ||||||
| GRADE Working Group grades of evidence | ||||||
| aOne study with small sample size; 95% CI overlaps zero. | ||||||
| Active rPMS plus rehabilitation compared with rehabilitation only in stroke | ||||||
| Patient or population: people with stroke Setting: not available Intervention: active rPMS plus rehabilitation Comparison: rehabilitation only | ||||||
| Outcomes | Anticipated absolute effects* (95% CI) | Relative effect | No. of participants | Certainty of the evidence | Comments | |
|---|---|---|---|---|---|---|
| Risk with rehabilitation only | Risk with active rPMS plus rehabilitation | |||||
| Activities of daily living (ADLs) | ‐ | ‐ | See comment | ‐ | ‐ | No trials measured this outcome. |
| Upper limb function | ‐ | ‐ | See comment | ‐ | ‐ | No trials measured this outcome. |
| Lower limb function | ‐ | ‐ | See comment | ‐ | ‐ | No trials measured this outcome. |
| Spasticity (elbow) | ‐ | ‐ | See comment | ‐ | ‐ | No trials measured this outcome. |
| Spasticity (wrist) | ‐ | ‐ | See comment | ‐ | ‐ | No trials measured this outcome. |
| Muscle strength | ‐ | ‐ | See comment | ‐ | ‐ | No trials measured this outcome. |
| Death | ‐ | ‐ | See comment | ‐ | ‐ | No trials measured this outcome. |
| *The risk in the intervention group (and its 95% confidence interval) is based on assumed risk in the comparison group and relative effect of the intervention (and its 95% CI). CI: confidence interval; rPMS: repetitive peripheral magnetic stimulation. | ||||||
| GRADE Working Group grades of evidence | ||||||
| Outcome or subgroup title | No. of studies | No. of participants | Statistical method | Effect size |
| 1.1 Muscle strength at the end of treatment Show forest plot | 1 | Mean Difference (IV, Fixed, 95% CI) | Subtotals only | |
| Outcome or subgroup title | No. of studies | No. of participants | Statistical method | Effect size |
| 2.1 Activities of daily living at the end of treatment Show forest plot | 1 | Mean Difference (IV, Fixed, 95% CI) | Subtotals only | |
| 2.2 Activities of daily living at the end of follow‐up Show forest plot | 1 | Mean Difference (IV, Fixed, 95% CI) | Subtotals only | |
| 2.3 Upper limb function at the end of treatment Show forest plot | 1 | Mean Difference (IV, Fixed, 95% CI) | Subtotals only | |
| 2.4 Upper limb function at the end of follow‐up Show forest plot | 1 | Mean Difference (IV, Fixed, 95% CI) | Subtotals only | |
| 2.5 Spasticity of the elbow at the end of treatment Show forest plot | 1 | Mean Difference (IV, Fixed, 95% CI) | Subtotals only | |
| 2.6 Spasticity of the elbow at the end of follow‐up Show forest plot | 1 | Mean Difference (IV, Fixed, 95% CI) | Subtotals only | |
| 2.7 Spasticity of the wrist at the end of treatment Show forest plot | 1 | Mean Difference (IV, Fixed, 95% CI) | Subtotals only | |
| 2.8 Spasticity of the wrist at the end of follow‐up Show forest plot | 1 | Mean Difference (IV, Fixed, 95% CI) | Subtotals only | |