Repetitive peripheral magnetic stimulation for activities of daily living and functional ability in people after stroke
Información
- DOI:
- https://doi.org/10.1002/14651858.CD011968.pub2Copiar DOI

- Base de datos:
-
- Cochrane Database of Systematic Reviews
- Versión publicada:
-
- 23 junio 2017see what's new
- Tipo:
-
- Intervention
- Etapa:
-
- Review
- Grupo Editorial Cochrane:
-
Grupo Cochrane de Accidentes cerebrovasculares
- Copyright:
-
- Copyright © 2017 The Cochrane Collaboration. Published by John Wiley & Sons, Ltd.
Cifras del artículo
Altmetric:
Citado por:
Autores
Contributions of authors
Ryo Momosaki prepared the protocol and drafted the review with support from Erika Ota. Ryo Momosaki and Naoki Yamada contributed to literature selection, data extraction, and analyses. Masahiro Abo provided critical revisions on intellectual content. All review authors approved the final review.
Sources of support
Internal sources
-
No sources of support supplied
External sources
-
This research is supported by the Project for Baby and Infant in Research of Health and Development to Adolescent and Young adult (BIRTHDAY) from the Japan Agency for Medical Research and Development, AMED, Japan.
Declarations of interest
Ryo Momosaki: none known.
Naoki Yamada: none known.
Erika Ota: none known.
Masahiro Abo: none known.
Acknowledgements
We thank Hazel Fraser from the Cochrane Stroke Group for providing relevant information, Joshua David Cheyne for helping to develop the search strategy and for conducting searches, Louis‐David Beaulieu and Carmen Krewer for performing re‐analysis and providing unpublished data, and Emma Barber for providing editorial support. Portions of the methods section in this review protocol are based on the text template of the Pregnancy and Childbirth Review Group.
Version history
| Published | Title | Stage | Authors | Version |
| 2022 Sep 28 | Repetitive peripheral magnetic stimulation for impairment and disability in people after stroke | Review | Tomohiko Kamo, Yoshitaka Wada, Masatsugu Okamura, Kotomi Sakai, Ryo Momosaki, Shunsuke Taito | |
| 2019 Nov 30 | Repetitive peripheral magnetic stimulation for impairment and disability in people after stroke | Review | Kotomi Sakai, Yuichi Yasufuku, Tomohiko Kamo, Erika Ota, Ryo Momosaki | |
| 2017 Jun 23 | Repetitive peripheral magnetic stimulation for activities of daily living and functional ability in people after stroke | Review | Ryo Momosaki, Naoki Yamada, Erika Ota, Masahiro Abo | |
| 2015 Nov 23 | Repetitive peripheral magnetic stimulation for activities of daily living and functional ability in people after stroke | Protocol | Ryo Momosaki, Naoki Yamada, Erika Ota, Masahiro Abo | |
Differences between protocol and review
We divided our evaluation of spasticity into parts of the body (elbow and wrist), although this was not specified in the protocol. We used Covidence software (Covidence 2013) for selection of studies, data extraction, and assessment of risk of bias. We included ADLs, upper limb function, lower limb function, muscle strength, spasticity, and death in the 'Summary of findings' table.
Keywords
MeSH
Medical Subject Headings (MeSH) Keywords
Medical Subject Headings Check Words
Humans;
PICO

Study flow diagram.

Risk of bias graph: review authors' judgements about each risk of bias item presented as percentages across all included studies.

Risk of bias summary: review authors' judgements about each risk of bias item for each included study.
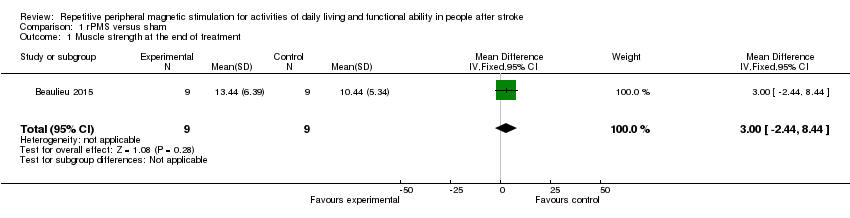
Comparison 1 rPMS versus sham, Outcome 1 Muscle strength at the end of treatment.

Comparison 2 rPMS plus rehabilitation versus rehabilitation only, Outcome 1 Activities of daily living at the end of treatment.
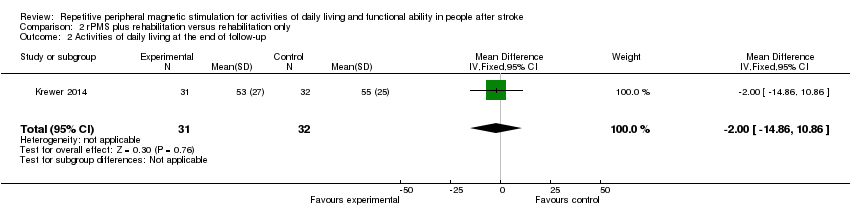
Comparison 2 rPMS plus rehabilitation versus rehabilitation only, Outcome 2 Activities of daily living at the end of follow‐up.

Comparison 2 rPMS plus rehabilitation versus rehabilitation only, Outcome 3 Upper limb function at the end of treatment.

Comparison 2 rPMS plus rehabilitation versus rehabilitation only, Outcome 4 Upper limb function at the end of follow‐up.

Comparison 2 rPMS plus rehabilitation versus rehabilitation only, Outcome 5 Spasticity at the end of treatment.

Comparison 2 rPMS plus rehabilitation versus rehabilitation only, Outcome 6 Spasticity at the end of follow‐up.
| rPMS compared with any type of control intervention in stroke | ||||||
| Patient or population: people with stroke Setting: Germany and Canada | ||||||
| Outcomes | Anticipated absolute effects* (95% CI) | Relative effect | No. of participants | Quality of the evidence | Comments | |
| Risk with any type of control intervention | Risk with rPMS | |||||
| Activities of daily living (ADLs) | Mean activities of daily living score was 50 | MD 3 lower | ‐ | 63 | ⊕⊕⊝⊝ | |
| Upper limb function | Mean upper limb function score was 13 | MD 2 higher | ‐ | 63 | ⊕⊕⊝⊝ | |
| Lower limb function ‐ not measured | ‐ | ‐ | See comments | ‐ | ‐ | No trials measured this outcome |
| Spasticity (elbow) | Mean spasticity (elbow) score was 1.41 | MD 0.41 lower | ‐ | 63 | ⊕⊕⊝⊝ | |
| Spasticity (wrist) | Mean spasticity (wrist) score was 2.13 | MD 0.2 lower | ‐ | 63 | ⊕⊕⊝⊝ | |
| Muscle strength | Mean muscle strength was 10.44 kg | MD 3 kg higher | ‐ | 18 | ⊕⊕⊝⊝ | |
| Death ‐ not reported | ‐ | ‐ | See comments | ‐ | ‐ | No trials reported this outcome |
| *The risk in the intervention group (and its 95% confidence interval) is based on assumed risk in the comparison group and relative effect of the intervention (and its 95% CI) | ||||||
| GRADE Working Group grades of evidence | ||||||
| aOne study with small sample size; 95% CI overlaps zero | ||||||
| Outcome or subgroup title | No. of studies | No. of participants | Statistical method | Effect size |
| 1 Muscle strength at the end of treatment Show forest plot | 1 | 18 | Mean Difference (IV, Fixed, 95% CI) | 3.0 [‐2.44, 8.44] |
| Outcome or subgroup title | No. of studies | No. of participants | Statistical method | Effect size |
| 1 Activities of daily living at the end of treatment Show forest plot | 1 | 63 | Mean Difference (IV, Fixed, 95% CI) | ‐3.00 [‐16.35, 10.35] |
| 2 Activities of daily living at the end of follow‐up Show forest plot | 1 | 63 | Mean Difference (IV, Fixed, 95% CI) | ‐2.0 [‐14.86, 10.86] |
| 3 Upper limb function at the end of treatment Show forest plot | 1 | 63 | Mean Difference (IV, Fixed, 95% CI) | 2.0 [‐4.91, 8.91] |
| 4 Upper limb function at the end of follow‐up Show forest plot | 1 | 63 | Mean Difference (IV, Fixed, 95% CI) | 4.0 [‐2.92, 10.92] |
| 5 Spasticity at the end of treatment Show forest plot | 1 | Mean Difference (IV, Fixed, 95% CI) | Subtotals only | |
| 5.1 Spasticity at the end of treatment (elbow) | 1 | 63 | Mean Difference (IV, Fixed, 95% CI) | ‐0.41 [‐0.89, 0.07] |
| 5.2 Spasticity at the end of treatment (wrist) | 1 | 63 | Mean Difference (IV, Fixed, 95% CI) | ‐0.20 [‐0.76, 0.36] |
| 6 Spasticity at the end of follow‐up Show forest plot | 1 | Mean Difference (IV, Fixed, 95% CI) | Subtotals only | |
| 6.1 Spasticity at the end of follow‐up (elbow) | 1 | 63 | Mean Difference (IV, Fixed, 95% CI) | ‐0.48 [‐0.93, ‐0.03] |
| 6.2 Spasticity at the end of follow‐up (wrist) | 1 | 63 | Mean Difference (IV, Fixed, 95% CI) | ‐0.13 [‐0.67, 0.41] |