뇌졸중 환자의 일상생활 및 기능적 활동에 대한 반복적인 말초신경 자극
초록
배경
반복적 말초신경 자극은 뇌 신경 장애로 인한 신체 기능 장애를 가진 사람들의 운동 기능을 향상하기 위해 심부 근육 조직을 고통 없이 자극할 수 있는 치료의 한 형태이다. 뇌졸중 환자들에 대한 rPMS의 사용은 일상생활과 기능적 활동을 개선하기 위한 실용적인 접근법으로 확인되었다. 그러나, 어떠한 체계적 고찰도 이용 가능한 실험 결과를 평가하지 않았다. 뇌졸중 환자들에 대한 이러한 중재의 효과와 안전성은 현재도 불확실하다.
목적
뇌졸중 환자의 일상생활 동작과 능력에 대한 반복적 말초신경 자극의 효과를 검증한다.
검색 전략
Cochrane Stroke Group Trials Register(˜2016년 8월), CENTRAL (2016년 8판), 코크란 라이브러리 (˜2016년 8월), MEDLINE (˜2016년 11월), Embase (˜2016년 8월), CINAHL (˜2016년 8월), PsycINFO (˜2016년 8월), AMED (˜2016년 8월), OTseeker (˜2016년 8월), PEDro (˜2016년 10월), ICHUSHI(˜2016년 10월)에서 검색을 실시했다. 또한, 5개의 진행 중인 임상시험 레지스트리를 검색하고 참고문헌목록을 살펴보았으며 해당 분야의 전문가에게 연락을 취했다. 언어와 출판 시기에 제한은 없었다.
선정 기준
뇌졸중 환자들에 대한 반복적 말초신경 자극의 효과를 검증하는 무작위대조시험만을 선출했다. 포함에 적합한 기준은 다음과 같았다: (1) 반복적 말초신경 자극 단독과 가짜 자극(미약한 자극이나 소리만 남)과의 비교 (2) 반복적 말초신경 자극 단독과 무중재를 비교 (3) 반복적 말초신경 자극과 재활치료의 병용과 가짜 자극과 재활치료의 병용과의 비교 (4) 반복적 말초신경 자극과 재활의 병용과 재활치료 단독시행과 비교.
자료 수집 및 분석
2명의 검토자가 연구의 적격성을 독립적으로 평가했다. 같은 2명의 검토자가 편협성 위험을 평가하고 데이터를 추출했다. 미발표 데이터가 필요한 경우 저자에게 문의했다. 토론을 통해 모든 의견의 불일치를 해소했다.
주요 결과
총 121명의 참가자가 포함된 3건의 연구(2건의 무작위대조시험, 1건의 교차설계시험)가 선택되었다. 참가자 및 치료자에 대한 눈가림에 관해서는 충분히 보고되고 있었으며, 모든 연구에서 본 바이어스의 위험은 낮은 것으로 판단되었다. 일상생활 동작에 있어 반복적 말초신경 자극의 효과는 중재 종료 시(평균차: ‐3.00, 95% 신뢰구간: ‐16.35˜10.35)와 추적 관찰 종료 시(MD ‐3.00, 95% CI ‐16.35˜10.35)에 명료하게 나타나지 않았다. 63명의 참가자로 이루어진 한 연구에서 팔 기능의 향상 효과는 명확하지 않았다(중재 종료시; MD 2.00, 95% CI ‐4.91˜8.91) (추적 관찰 종료시; MD 4.00, 95% CI ‐2.92˜10.92). 참가자 18명으로 구성된 하나의 연구에서 중재 종료시의 근력 증강 효과는 나타나지 않았다(MD 3.00, 95% CI ‐2.44˜8.44). 참가자 18명으로 구성된 하나의 연구에서 중재 종료시의 근력 증강 효과는 나타나지 않았다(MD 3.00, 95% CI ‐2.44˜8.44). 한 연구가 후속 종료시 팔꿈치의 유의미한 강직 완화 효과를 보고했다(MD ‐0.48, 95% CI ‐0.93˜‐0.03). 다리 기능이나 사망에 대한 보고는 없었다. GRADE 접근법에 따라 기본 결과에 대한 근거의 확실성은 표본 크기가 작아 낮은 것으로 판단했다.
연구진 결론
본 고찰에서 수집가능했던 연구 결과는 근거가 부족하고, 뇌졸중 환자에 대한 반복 말초신경 자극의 일상적인 이용에 관하여 어떤 결론으로 이어질 수 없었다. 적절한 자극 프로토콜 및 장기적인 효과를 나타내기 위한 더 대규모의 연구가 필요하다. 현재 진행중인 임상 연구가 3건으로, 다음의 고찰 업데이트에서 이들을 포함할 것이다.
PICO
쉬운 말 요약
뇌졸중 환자의 일상생활 동작 향상을 위한 반복적 말초신경 자극
연구의 질문
반복적 말초신경 자극이 뇌졸중 환자들의 일상활동을 향상시키는데 효과적인가?
배경
뇌졸중은 뇌혈관이 막힘으로 인해 발생되는 신체 능력을 저하시키는 가장 흔한 원인 질환이다. 뇌졸중에는 두 가지 유형: 혈류 감소에 의한 허혈성 뇌졸중과 출혈에 따른 출혈성 뇌졸중이다. 뇌졸중 후 팔과 다리 마비는 목욕, 탈의, 보행 등의 일상생활 동작에 문제를 야기한다. 뇌졸중 편마비 환자는 팔다리의 기능 훈련과 일상생활 동작 훈련, 지팡이 등의 보행 보조기구의 적절한 선정 등을 포함한 신체적 재활을 필요로 한다. 그러나 효과적인 중재에도 한계가 있다. 반복적 말초신경 자극은 뇌신경 장애가 있는 사람들의 신체 능력을 향상시키기 위해 사용되는 덜 고통스러운 자극 요법이다.
연구 특성
총 121명의 참가자를 갖는 3건의 반복적 말초신경 자극에 대한 임상 연구(2건은 무작위대조시험에서, 1건은 교차연구에서)가 발견되었다. 한 연구는 반복적 말초신경 자극과 가짜 자극(미약한 자극이나 소리만 자극)을 비교했다. 두 연구는 반복적 말초신경 자극과 재활의 병용 요법과 재활 단독시행을 비교했다.
주요 결과
뇌졸중 후 일상생활 동작 능력, 근력, 상지 기능, 강직(근육 긴장 이상)에 대한 반복적 말초신경 자극의 효과에 관해서는 한정된 근거밖에 발견되지 않았다. 반복적 말초신경 자극과 재활의 조합은 재활 단독시행에 비해 팔꿈치 강직을 조금 완화시켜 주었지만, 몸의 어디에 어떤 자극 방법을 사용하는 것이 좋은지에 대해서는 밝힐 수 없었다. 다리의 기능에 대한 정보는 찾을 수 없었다. 사망에 대한 보고도 없었다.
근거의 질
표본 크기 부족을 주된 이유로 근거의 질은 낮은 것으로 판단되었다. 적절한 자극 프로토콜을 결정하는 데에도 더욱 대규모 임상 연구가 필요하다.
Authors' conclusions
Summary of findings
| rPMS compared with any type of control intervention in stroke | ||||||
| Patient or population: people with stroke Setting: Germany and Canada | ||||||
| Outcomes | Anticipated absolute effects* (95% CI) | Relative effect | No. of participants | Quality of the evidence | Comments | |
| Risk with any type of control intervention | Risk with rPMS | |||||
| Activities of daily living (ADLs) | Mean activities of daily living score was 50 | MD 3 lower | ‐ | 63 | ⊕⊕⊝⊝ | |
| Upper limb function | Mean upper limb function score was 13 | MD 2 higher | ‐ | 63 | ⊕⊕⊝⊝ | |
| Lower limb function ‐ not measured | ‐ | ‐ | See comments | ‐ | ‐ | No trials measured this outcome |
| Spasticity (elbow) | Mean spasticity (elbow) score was 1.41 | MD 0.41 lower | ‐ | 63 | ⊕⊕⊝⊝ | |
| Spasticity (wrist) | Mean spasticity (wrist) score was 2.13 | MD 0.2 lower | ‐ | 63 | ⊕⊕⊝⊝ | |
| Muscle strength | Mean muscle strength was 10.44 kg | MD 3 kg higher | ‐ | 18 | ⊕⊕⊝⊝ | |
| Death ‐ not reported | ‐ | ‐ | See comments | ‐ | ‐ | No trials reported this outcome |
| *The risk in the intervention group (and its 95% confidence interval) is based on assumed risk in the comparison group and relative effect of the intervention (and its 95% CI) | ||||||
| GRADE Working Group grades of evidence | ||||||
| aOne study with small sample size; 95% CI overlaps zero | ||||||
Background
Description of the condition
Stroke is a serious healthcare problem that requires long‐term rehabilitation as a core component of recovery (Sacco 2013). Every year, around 16 million strokes occur throughout the world, causing 5.7 million deaths (Strong 2007). Approximately 88% of all strokes are of the ischaemic type; other types include haemorrhagic stroke and subarachnoid haemorrhage (Park 2012). The most common disability after stroke is motor impairment (Langhorne 2009), which adversely affects control of arm and leg movement and occurs in nearly 80% of people after stroke (De Vries 2007). At present, although post‐stroke functional recovery remains a high priority in health care, evidence on effective interventions for post‐stroke impairment is limited (McArthur 2011).
Description of the intervention
Repetitive peripheral magnetic stimulation (rPMS) is a unique non‐invasive stimulation method that was developed for therapeutic neuromodulation in movement disorders (Beaulieu 2013). In rPMS, a stimulation coil (magnetic field generator) is placed over the paralysed muscles of the arms, legs, or torso. The stimulation coil is attached to a stimulator (pulse generator), which provides an electrical current to the coil. The coil builds up a magnetic field as it passes through the skin, and it directs an electrical current into the neurons. Once the current achieves a certain value, an action potential is induced, which causes the neuron to depolarise and the muscles to eventually contract.
Treatment by rPMS allows painless stimulation of deep muscle structures that cannot be reached by electrical stimulation (Barker 1991; Ito 2013). People receiving rPMS do not need to remove their clothes because the procedure does not require placement of electrodes. Implanted medical devices, such as pacemakers or deep brain simulators, are contraindications for rPMS. However, the technology has no known negative side effects. Currently, rPMS is used to treat individuals with motor deficits resulting from brain or nerve disorders, although the high cost of rPMS devices precludes wide use of the technology. Nevertheless, rPMS can be performed to safely stimulate deeper regions of muscle without pain, and can potentially improve functional recovery in people after stroke (Han 2006).
How the intervention might work
Applying rPMS to the muscle induces a proprioceptive input to the central nervous system in two ways (Struppler 2004).
-
Direct activation of sensorimotor nerve fibres with an orthodromic and antidromic conduction.
-
Indirect activation of mechanoreceptors during rhythmical contraction and relaxation, as well as vibration of the muscles.
This afferent input elicits sensations and reaches higher levels of the central nervous system.
Initial assessment of transcranial magnetic stimulation revealed an increase in corticomotor excitability after rPMS, and subsequent functional magnetic resonance imaging assessment showed focal activations within the sensorimotor cortex in healthy participants (Gallasch 2015). After stroke, rPMS can increase motor‐evoked potential amplitude (Flamand 2014) and motor cortex excitability (Heldmann 2000; Krause 2008). Further, rPMS can effectively suppress spasticity (Struppler 2003) and has a modulatory effect on motor performance (Struppler 2004). The technique is also thought to increase neural excitability of the cortex and to balance interactions between hemispheres, thereby contributing to functional improvement in people after stroke (Kerkhoff 2001).
Why it is important to do this review
Several clinical trials have examined the use of rPMS for people with functional disability (Heldmann 2000; Nielsen 1996; Struppler 2004; Struppler 2007). However, the peer‐reviewed literature includes no systematic review that has assessed the findings of available trials. It remains unclear what type of stimulation (high frequency, low frequency, or other) should be performed, and on which part of the body (upper limb, lower limb, or others). In addition, rPMS studies have tended to include small sample sizes. Therefore, a systematic review of trials is needed to evaluate the effectiveness of rPMS.
Objectives
To assess the effect of rPMS for improving activities of daily living and functional ability in people after stroke.
Methods
Criteria for considering studies for this review
Types of studies
We included individual randomised controlled trials (RCTs), cluster‐RCTs, and cross‐over trials. We excluded quasi‐RCTs (trials in which the method of allocating participants to a treatment is not strictly random, e.g. by date of birth, hospital record number, or alternation).
Types of participants
We included people after stroke regardless of sex, age, and stroke severity and duration. Stroke is defined by the World Health Organization as a "neurological deficit of cerebrovascular cause that lasts more than 24 hours or leads to death within 24 hours" (World Health Organization 1989).
Types of interventions
We included trials comparing any type of active rPMS or rPMS plus rehabilitation for improving functional ability versus any type of control intervention (i.e. sham rPMS, sham rPMS plus rehabilitation for improving functional ability, or no intervention). Investigators conducted rPMS peripherally (not for central nervous system such as brain or spinal cord) and non‐invasively (without use of puncture needle or implantation techniques).
We investigated the following comparisons.
-
Active rPMS only compared with sham rPMS.
-
Active rPMS only compared with no intervention.
-
Active rPMS plus rehabilitation compared with sham rPMS plus rehabilitation.
-
Active rPMS plus rehabilitation compared with rehabilitation only.
Types of outcome measures
Primary outcomes
Activities of daily living (ADLs) at the end of treatment and at the end of scheduled follow‐up. ADLs refer to basic tasks of everyday life, including self‐care activities such as eating, bathing, dressing, and toileting. We preferentially used the Barthel Index (BI) or the Functional Independence Measure (FIM) but allowed the use of any validated ADL measures as follows.
-
Katz Index of Independence in Activities of Daily Living.
-
Frenchay Activities Index (FAI).
Secondary outcomes
We included the following secondary outcome measures.
-
Upper limb function.
-
Fugl‐Meyer Assessment.
-
Action Research Arm Test.
-
Wolf Motor Function Test (second).
-
-
Lower limb function.
-
Gait velocity (cm/s).
-
Timed Up and Go Test (seconds).
-
-
Spasticity.
-
(Modified) Tardieu Scale.
-
Modified Ashworth Scale (MAS).
-
-
Muscle strength.
-
Grip strength (kg).
-
Medical Research Council (MRC) Scale.
-
-
Death (as adverse event).
We explored secondary outcomes at the end of treatment and at the end of scheduled follow‐up. We treated these outcomes as continuous data.
Search methods for identification of studies
See the 'Specialized register' section in the Cochrane Stroke Group module. We searched for trials in all languages and arranged for translation of relevant articles when necessary.
Electronic searches
We searched the Cochrane Stroke Group trials register and the following electronic databases.
-
Cochrane Central Register of Controlled Trials (CENTRAL; 2016, Issue 11) in the Cochrane Library (searched August 2016) (Appendix 1).
-
MEDLINE in Ovid (1950 to August 2016) (Appendix 2).
-
Embase in Ovid (1980 to November 2016) (Appendix 3).
-
Cumulative Index to Nursing and Allied Health Literature (CINAHL) in EBSCO (1937 to August 2016) (Appendix 4).
-
PsycINFO in Ovid (1806 to August 2016) (Appendix 5).
-
Allied and Complementary Medicine Database (AMED) in Ovid (1985 to August 2016) (Appendix 6).
-
Occupational Therapy Systematic Evaluation of Evidence (OTseeker; www.otseeker.com/) (searched August 2016) (Appendix 7).
-
Physiotherapy Evidence Database (PEDro; http://www.pedro.fhs.usyd.edu.au/) (1929 to October 2016) (Appendix 8).
-
Ichushi‐Web (Japan Medical Abstracts Society (JAMAS) (www.jamas.or.jp/) (searched October 2016) (Appendix 9).
We developed the MEDLINE search strategy (Appendix 2) with the help of the Cochrane Stroke Group Information Specialist and adapted it for use with the other databases.
We also searched the following ongoing trials registers.
-
US National Institutes of Health Ongoing Trials Register ClinicalTrials.gov (www.clinicaltrials.gov; searched August 2016) (Appendix 10).
-
ISRCTN Registry (www.isrctn.com/; searched August 2016) (Appendix 11).
-
Stroke Trials Registry (www.strokecenter.org/trials/; searched 10 August 2016) (Appendix 12).
-
World Health Organization (WHO) International Clinical Trials Registry Platform (ICTRP) (www.who.int/ictrp/search/en/; searched August 2016) (Appendix 13).
-
Japanese UMIN Clinical Trials Registry (UMIN‐CTR) (www.umin.ac.jp/ctr/; searched August 2016) (Appendix 14).
Searching other resources
To identify additional published and unpublished relevant studies for potential inclusion in the review, we:
-
contacted experts in the field;
-
screened reference lists of relevant trials; and
-
searched Google Scholar (http://scholar.google.co.uk/).
Data collection and analysis
Selection of studies
Two review authors (RM, NY) independently screened titles and abstracts of references obtained as a result of our searching activities and excluded obviously irrelevant reports. We retrieved full‐text articles for the remaining references, and two review authors (RM, NY) independently screened these to identify studies for inclusion. We identified and recorded reasons for exclusion of ineligible studies. We resolved disagreements through discussion, or, if required, we consulted a third person (EO). We collated multiple reports of the same study, so that each study ‐ not each reference ‐ was the unit of interest in the review. We recorded the selection process and completed a PRISMA flow diagram (Moher 2009). We included studies presented only as abstracts, if sufficient information was reported. We used Covidence software for reference handling (Covidence 2013).
Data extraction and management
Two review authors (RM, NY) independently extracted the following data from the included studies using Covidence (Covidence 2013).
-
Methods: study design, randomisation method, allocation concealment method, blinding methods.
-
Participants: diagnosis (type, severity, and location of stroke), number in each group, age, sex, baseline comparability between two groups, time from onset, losses to follow‐up.
-
Interventions: details of rPMS (frequency, intensity, duration, treatment session), target of stimulation, co‐exercise.
-
Outcomes: types of outcomes, assessment time points.
-
Other: setting, publication year, sources of funding, intention‐to‐treat analysis (ITT).
All review authors resolved disagreements by discussion.
Assessment of risk of bias in included studies
Two review authors (RM, NY) independently assessed risk of bias for each study using the criteria outlined in the Cochrane Handbook for Systematic Reviews of Interventions (Higgins 2011) along with Covidence (Covidence 2013). We resolved disagreements by discussion or by consultation with another review author (EO). We assessed risk of bias according to the following domains.
Random sequence generation (checking for possible selection bias)
For each included study, we described the method used to generate the allocation sequence in sufficient detail to allow an assessment of whether it should produce comparable groups. We assessed the method as:
-
low risk of bias (any truly random process, e.g. random number table; computer random number generator);
-
high risk of bias (any non‐random process, e.g. odd or even date of birth; hospital or clinic record number); or
-
unclear risk of bias.
Allocation concealment (checking for possible selection bias)
For each included study, we described the method used to conceal allocation to interventions before assignment, and assessed whether intervention allocation could have been foreseen in advance of, or during recruitment, or changed after assignment. We assessed the method as:
-
low risk of bias (e.g. telephone or central randomisation; consecutively numbered, sealed, opaque envelopes);
-
high risk of bias (open random allocation; unsealed or non‐opaque envelopes, alternation; date of birth); or
-
unclear risk of bias.
Blinding of participants and personnel (checking for possible performance bias)
For each included study, we described the method used, if any, to blind study participants and personnel to which intervention a participant received. We considered that studies were at low risk of bias if they were blinded, or if we judged that lack of blinding would be unlikely to affect results. We assessed blinding separately for different outcomes or classes of outcomes. We assessed the method as:
-
low, high, or unclear risk of bias for participants; and
-
low, high, or unclear risk of bias for personnel.
Blinding of outcome assessment (checking for possible detection bias)
For each included study, we described the method used, if any, to blind outcome assessors to which intervention a participant received. We assessed blinding separately for different outcomes or classes of outcomes. We assessed the method used to blind outcome assessment as:
-
low, high, or unclear risk of bias.
Incomplete outcome data (checking for possible attrition bias due to the quantity, nature, and handling of incomplete outcome data)
For each included study, and for each outcome or class of outcomes, we described completeness of data, including attrition and exclusions from the analysis. We stated whether attrition and exclusions were reported and the numbers included in the analysis at each stage (compared with the total number of randomised participants), reasons for attrition or exclusion when reported, and whether missing data were balanced across groups or were related to outcomes. When sufficient information was reported, or could be supplied by trial authors, we re‐included missing data in the analyses that we performed. We assessed methods as:
-
low risk of bias (e.g. no missing outcome data; missing outcome data balanced across groups);
-
high risk of bias (e.g. numbers or reasons for missing data imbalanced across groups; 'as treated' analysis performed with a substantial departure of the intervention received from that assigned at randomisation); or
-
unclear risk of bias.
Selective reporting (checking for reporting bias)
For each included study, we described how we investigated the possibility of selective outcome reporting bias and what we found. We assessed the methods as:
-
low risk of bias (when it is clear that all of the study's prespecified outcomes and all expected outcomes of interest to the review have been reported);
-
high risk of bias (when not all the study's prespecified outcomes have been reported; one or more reported primary outcomes were not prespecified; outcomes of interest are reported incompletely and so cannot be used; study failed to include results of a key outcome that was expected to have been reported); or
-
unclear risk of bias.
Other bias
For each included study, we described any important concerns that we had about other possible sources of bias. We assessed whether each study was free of other problems that could put it at risk of bias by assigning:
-
low risk of other bias;
-
high risk of other bias; or
-
unclear whether risk of other bias is present.
Overall risk of bias
We made explicit judgements about whether studies were at high risk of bias, according to the criteria given in the Cochrane Handbook for Systematic Reviews of Interventions (Higgins 2011). With reference to the above domains, we assessed the likely magnitude and direction of the bias and whether we considered it likely to impact study findings.
We graded the risk of bias for each domain and provided information from the study report together with a justification for our judgement in the 'Risk of bias' tables.
We used the GRADE approach to assess the quality of the body of evidence related to the following main outcomes at the end of treatment (Guyatt 2008).
-
ADLs.
-
Upper limb function.
-
Lower limb function.
-
Spasticity.
-
Muscle strength.
-
Death.
We used GRADEprofiler (GRADE 2014) to import data from Review Manager 5.3 (RevMan 2014) to create a 'Summary of findings' table. We produced a summary of the intervention effect and a measure of quality for each of the above outcomes using the GRADE approach. The GRADE approach is based on five considerations (study limitations, consistency of effect, imprecision, indirectness, and publication bias) and is used to assess the quality of the body of evidence for each outcome. Evidence can be downgraded from 'high quality' by one level for serious (or by two levels for very serious) limitations, depending on assessments for risk of bias, indirectness of evidence, serious inconsistency, imprecision of effect estimates, or potential publication bias.
Measures of treatment effect
Dichotomous data
For dichotomous data, we presented results as a summary risk ratio with 95% confidence intervals.
Continuous data
For continuous data, we used the mean difference if outcomes were measured in the same way between trials. We used the standardised mean difference to combine trials that measured the same outcome but used different measures.
Unit of analysis issues
Cluster‐randomised trials
In future updates, we will include cluster‐randomised trials in the analyses, along with individually randomised trials. We will adjust standard errors using the methods described in the Cochrane Handbook for Systematic Reviews of Interventions on the basis of an estimate of the intracluster correlation coefficient (ICC) derived from the trial if possible, from a similar trial, or from a study of a similar population. If we use ICCs from other sources, we will report this and will conduct sensitivity analyses to investigate the effect of variation in the ICC. If we identify both cluster‐randomised trials and individually randomised trials, we plan to synthesise relevant information.
In future updates, we will acknowledge heterogeneity in the randomisation unit and will perform a sensitivity analysis to investigate effects of the randomisation unit.
Cross‐over trials
We included cross‐over trials in the review. We analysed only data from the first phase of cross‐over trials.
Multi‐armed trials
When we identified trials with multiple intervention arms, we planned to include only directly relevant arms. If the trial included several relevant intervention arms, we planned to combine all relevant experimental intervention groups of the study into a single group and to combine all relevant control intervention groups into a single control group.
Dealing with missing data
We contacted trial authors to obtain missing data, if necessary. For included studies, we noted levels of attrition. We performed sensitivity analysis to explore the impact of including studies with high levels of missing data in the overall assessment of treatment effect.
For all outcomes, we carried out analyses as far as possible on an ITT basis, that is, we attempted to include in the analyses all participants randomised to each group, and we analysed all participants in the group to which they were allocated, regardless of whether they received the allocated intervention. The denominator for each outcome in each trial was the number randomised minus any participants whose outcomes were known to be missing.
Assessment of heterogeneity
We assessed statistical heterogeneity in each meta‐analysis by using T², I², and Chi² statistics. We regarded heterogeneity as substantial if I² was greater than 30% and either T² was greater than zero or the P value was low (< 0.10) in the Chi² test for heterogeneity. We used Review Manager to assess heterogeneity (RevMan 2014).
Assessment of reporting biases
In future updates, if appropriate, we will use funnel plots to detect reporting biases (such as publication bias). We will assess funnel plot asymmetry visually. If asymmetry is suggested by visual assessment, we will perform exploratory analyses to investigate this.
Data synthesis
Two review authors (RM, NY) independently extracted data from the included trials. One review author (RM) entered the data into RevMan, and the other review author (NY) checked the entries. We resolved disagreements through discussion, with reference to the original report.
We carried out statistical analysis using Review Manager (RevMan 2014). We used fixed‐effect meta‐analysis in combining data when it was reasonable to assume that studies were estimating the same underlying treatment effect, that is, when trials were examining the same intervention, and when trial populations and methods were judged sufficiently similar. If clinical heterogeneity was sufficient to expect that underlying treatment effects differ between trials, or if we detected substantial statistical heterogeneity, we used random‐effects meta‐analysis to produce an overall summary if an average treatment effect across trials was considered clinically meaningful. We treated the random‐effects summary as the average range of possible treatment effects, and we discussed the clinical implications of differing treatment effects between trials. If the average treatment effect was not clinically meaningful, we did not combine trials. If we used random‐effects analyses, we presented results as the average treatment effect with 95% confidence interval (CI), along with estimates of T² and I². If it was inappropriate or impossible to pool data quantitatively, we provided a narrative summary of study results.
Subgroup analysis and investigation of heterogeneity
When we identified substantial heterogeneity in the primary outcomes, we investigated this by conducting subgroup analyses. We considered whether an overall summary was meaningful, and if so, we used random‐effects analysis to produce it.
We planned to carry out the following subgroup analyses of primary outcomes, if sufficient data were available.
-
Location of stimulation: upper limb versus lower limb or trunk.
-
Type of stroke: cerebral infarction versus cerebral haemorrhage.
-
Duration of illness: acute to subacute phase (to six months after stroke) versus chronic phase (more than six months after stroke).
We assessed subgroup differences by performing interaction tests available within Review Manager (RevMan 2014). We reported the results of subgroup analyses by quoting the Chi² statistic and the P value, and results of the interaction test by providing the I² value.
Sensitivity analysis
If we identified an adequate number of studies, we planned to perform sensitivity analyses by excluding:
-
studies with inadequate allocation concealment and random sequence generation;
-
studies in which outcome evaluation was not blinded;
-
studies in which loss to follow‐up was not reported or was greater than 10%; and
-
unpublished studies.
Results
Description of studies
Results of the search
See Figure 1.

Study flow diagram.
After screening 2145 titles and abstracts, we identified 17 potentially relevant articles. After reviewing the full text of the 17 articles, we included in the review three trials involving a total of 121 participants (Beaulieu 2015; Krewer 2014; Werner 2016).
Included studies
See Characteristics of included studies.
Study design and study location
We included two parallel‐group trials (Beaulieu 2015; Krewer 2014) and one cross‐over trial (Werner 2016) in qualitative synthesis. Trials were reported from Germany and Canada.
Sample characteristics
The three included trials involved 121 participants. Individual sample sizes of identified trials ranged from 18 (Beaulieu 2015) to 63 (Krewer 2014). Mean ages of participants were less than 55 years (Beaulieu 2015; Krewer 2014; Werner 2016), and mean time from onset ranged from less than 26 weeks (Krewer 2014) to 83 months (Beaulieu 2015). Two studies included participants with stroke, and their elapsed time from onset was over 12 months (Beaulieu 2015; Werner 2016). Male participants (57%) exceeded female (43%) participants. Two studies included traumatic brain injury (Krewer 2014; Werner 2016), and one study included tetraparesis (Werner 2016). We could not exclude study participants with traumatic brain injury. We decided to include trials of mixed groups if more than half had a stroke diagnosis. We noted imbalances in time since onset (Beaulieu 2015; Krewer 2014) and in mean age (Werner 2016), but we considered these unlikely to affect outcomes. Groups in all studies were comparable in terms of assessed baseline characteristics.
Intervention approaches
The included studies used varied protocols of rPMS. Frequency of rPMS ranged from 5 Hz (Werner 2016) to 25 Hz (Krewer 2014). One study adopted theta‐burst frequency rPMS (Beaulieu 2015). Duration of stimulation (per session) ranged from 190 seconds (Beaulieu 2015) to 20 minutes (Krewer 2014), and number of stimulations (per session) ranged from 600 (Beaulieu 2015) to 5000 (Krewer 2014). Only one study conducted multiple stimulation sessions as part of the treatment regimen (two times a day, five times a week, for two weeks) (Krewer 2014). Targets of stimulation were the lower leg (Beaulieu 2015), upper and lower arm (Krewer 2014), and lower arm (Werner 2016). Co‐exercise included occupational therapy after each stimulation (Krewer 2014) and muscle stretching during stimulation (Werner 2016). Sham stimulation consisted of low‐intensity stimulation (Beaulieu 2015) or a clicking sound only (Krewer 2014; Werner 2016).
Outcomes
The included trials used several heterogeneous outcome measures. Only one study assessed our primary outcome (ADLs) as measured by the Barthel Index (Krewer 2014). Beaulieu 2015 measured dorsiflexion strength (kg) as a muscle strength evaluation. Krewer 2014 assessed upper limb function using the Fugl‐Meyer Assessment. Investigators measured spasticity by using the Modified Tardieu Scale (Krewer 2014) or the Modified Ashworth Score (Werner 2016). Two trials evaluated outcomes immediately after treatment (Beaulieu 2015; Werner 2016); one trial measured outcomes after two weeks of treatment and two weeks after the treatment phase (Krewer 2014). None of the included studies reported any deaths.
Excluded studies
Among 17 potentially relevant studies, we excluded 13 trials because they did not meet the inclusion criteria. We have listed reasons for exclusion in the Characteristics of excluded studies table. Three studies were not RCTs (Bernhardt 2007; Struppler 2002; Struppler 2009), and three studies measured outcomes that were different from those provided in our protocol (Heldmann 2000; Kuznetsova 2016; Momosaki 2014). Evidence was insufficient for review authors to determine inclusion eligibility for four trials (Kotchetkov 1999; Kuznetsova 2013; Samosiuk 2003; Zifko 2002), and we were unable to make contact with study authors.
Ongoing studies
We identified four ongoing trials that appeared to be relevant for inclusion (Izumi 2015; Pohl 2015a; Pohl 2015b; Suzuki 2015). See Characteristics of ongoing studies.
Risk of bias in included studies

Risk of bias graph: review authors' judgements about each risk of bias item presented as percentages across all included studies.

Risk of bias summary: review authors' judgements about each risk of bias item for each included study.
Allocation
Sequence generation
Werner 2016 conducted sequence generation with the help of a computer‐generated lot (www.randomizer.at). As other studies did not report random sequence generation, we classified them as unclear.
Allocation concealment
Allocation concealment was adequate in two trials (Krewer 2014; Werner 2016); however, one study did not report on this (Beaulieu 2015).
Blinding
Participants and personnel
All trials provided blinding with regard to participants and personnel. Investigators conducted sham stimulations adequately, and we ranked these studies as having low risk of bias.
Outcome assessment
All trials provided blinding with regard to outcome assessors. All studies reported methods of blinding, and we ranked these studies as having low risk of bias.
Incomplete outcome data
Beaulieu 2015 and Werner 2016 reported no withdrawals or dropouts, so we classified these studies as having low risk of bias. Krewer 2014 reported that only three participants were lost to follow‐up (5%) and described no differences in the reasons why outcome data were missing. Krewer 2014 performed ITT analysis, and we classified this study as having low risk of bias.
Selective reporting
Study protocols were not available for any of the included studies, and so we judged selective reporting bias as low.
Other potential sources of bias
We identified no other information associated with other potential sources of bias.
Effects of interventions
See summary of findings Table for the main comparison.
We contacted the authors of included studies to request missing outcome data. However, we could not obtain data from the first phase of the cross‐over trial (Werner 2016), so we excluded this study from the quantitative synthesis (meta‐analysis). We included two studies in the quantitative analysis (Beaulieu 2015; Krewer 2014). As Krewer 2014 evaluated spasticity at both the elbow and the wrist, we analysed these data separately.
Comparison 1: rPMS versus sham
Primary outcome
Activities of daily living
We found no studies examining the effect of rPMS on the primary outcome in stroke patients.
Secondary outcomes
Muscle strength
Only one small study assessed our secondary outcome of muscle strength at the end of treatment (Beaulieu 2015). This trial included a total of 18 participants and showed that rPMS treatment was not associated with a significant improvement in muscle strength at the end of treatment (mean difference (MD) 3.00, 95% CI ‐2.44 to 8.44; see Analysis 1.1). This study did not report muscle strength at the end of follow‐up.
Others
Included trials did not report adverse events including death associated with rPMS.
Comparison 2: rPMS plus rehabilitation versus rehabilitation only
Primary outcome
Activities of daily living
Krewer 2014 provided data on activities of daily living as a Barthel Index score at the end of treatment and at the end of follow‐up. Data show no significant differences between the rPMS plus rehabilitation group and the rehabilitation only group (end of treatment: MD ‐3.00, 95% CI ‐16.35 to 10.35; see Analysis 2.1; end of follow‐up: MD ‐2.00, 95% CI ‐14.86 to 10.86; see Analysis 2.2).
Secondary outcomes
Upper limb function
Only Krewer 2014 reported the Fugl‐Meyer Assessment as an outcome measure of upper limb function. Results of this study show that rPMS plus rehabilitation did not increase upper limb function compared with rehabilitation only at the end of treatment and at the end of follow‐up (end of treatment: MD 2.00, 95% CI ‐4.91 to 8.91; see Analysis 2.3; end of follow‐up: MD 4.00, 95% CI ‐2.92 to 10.92; see Analysis 2.4).
Spasticity
Krewer 2014 evaluated spasticity at the elbow and wrist using the Modified Tardieu Scale. We separately evaluated results related to the elbow and the wrist. We found no significant differences in spasticity between the rPMS plus rehabilitation group and the rehabilitation group at the end of treatment (elbow: MD ‐0.41, 95% CI ‐0.89 to 0.07; wrist: MD ‐0.20, 95% CI ‐0.76 to 0.36; see Analysis 2.5). rPMS plus rehabilitation slightly reduced spasticity of the elbow compared with rehabilitation only at the end of follow‐up (MD ‐0.48, 95% CI ‐0.93 to ‐0.03). We found no differences between the rPMS plus rehabilitation group and the rehabilitation group in spasticity of the wrist at the end of follow‐up (MD ‐0.13, 95% CI ‐0.67 to 0.41; see Analysis 2.6).
Other outcomes
No study reported lower limb function as an outcome. None of the included trials reported adverse events, including death, associated with rPMS.
Discussion
Summary of main results
We found three trials (121 participants) that were eligible for inclusion in the review. We did not find high risk of bias across these trials, and we determined that the overall risk of bias was low. Only one randomised controlled trial (RCT) (63 participants) reported the effect of repetitive peripheral magnetic stimulation (rPMS) on activities of daily living and showed that rPMS was not associated with a significant increase in the Barthel Index score (see summary of findings Table for the main comparison). One study compared rPMS versus sham (Beaulieu 2015). Another two studies compared rPMS plus rehabilitation versus rehabilitation (Krewer 2014; Werner 2016). Only one study conducted multiple stimulation sessions as part of treatment (Krewer 2014). Investigators reported spasticity, muscle strength, and upper limb function as secondary outcomes. One study reported significant reduction in spasticity of the elbow at the end of follow‐up (mean difference (MD) ‐0.48, 95% confidence interval (CI) ‐0.93 to ‐0.03) but noted no significant differences in the other outcomes. None of the included studies reported death.
Overall completeness and applicability of evidence
Included trials did not provide sufficient information for review authors to address the aim of our review. Only three trials contributed data to our review, and only two of these were individual RCTs. We identified one cross‐over placebo‐controlled trial. We contacted the authors of this cross‐over trial, but as none of them responded, we could not include this study in our analysis. Stimulation parameters (frequency, intensity, pulses) also varied across studies. Sample sizes of the studies were small, ranging from 18 to 63 participants, which may have led to insufficient statistical power to detect differences. Large‐scale RCTs are needed to verify the efficacy of rPMS. Most of the included trials assessed the outcome at the end of the treatment period or within several weeks after treatment. Whether rPMS had long‐term effects on functional recovery is unclear.
Quality of the evidence
Overall risk of bias was low. All studies clearly reported blinding of participants and physicians, so we were able to make a clear decision about performance bias. However, all included studies had relatively small sample sizes: 18 in Beaulieu 2015, 63 in Krewer 2014, and 40 in Werner 2016. We downgraded the quality of evidence related to the primary outcome, mainly because one study had a small sample size and the 95% CI overlaps zero (summary of findings Table for the main comparison).
Potential biases in the review process
Despite our extensive literature search, selection bias may have occurred. Although two review authors independently assessed eligibility of studies for inclusion along with risks of bias to minimise potential bias in this review, several subjective judgements were required during the review process. A different review team may judge risk of bias differently.
Agreements and disagreements with other studies or reviews
Two previous reviews have investigated the effectiveness of rPMS treatment (Beaulieu 2013; Beaulieu 2015b). Beaulieu 2013 summarised the results of 13 studies that used different types of outcomes (neurophysiological, biomechanical, clinical) in healthy individuals and in people with stroke or a spinal disorder. This review included quasi‐experimental studies and case studies and conducted no pooled analysis. Review authors reported that owing to limited evidence, they could reach no conclusion. Beaulieu 2015b dealt with stimulation parameters reported in any scientific research that applied rPMS as an intervention to improve somatosensory or motor disorders. The literature search yielded 24 studies on various pathological disorders. Review authors conducted no pooled analysis and concluded that future studies require a more structured design and larger samples. Similarly, our review assessed RCTs with small sample sizes that focused on clinical outcomes after stroke and found lack of sufficient evidence for effectiveness of rPMS.

Study flow diagram.

Risk of bias graph: review authors' judgements about each risk of bias item presented as percentages across all included studies.

Risk of bias summary: review authors' judgements about each risk of bias item for each included study.
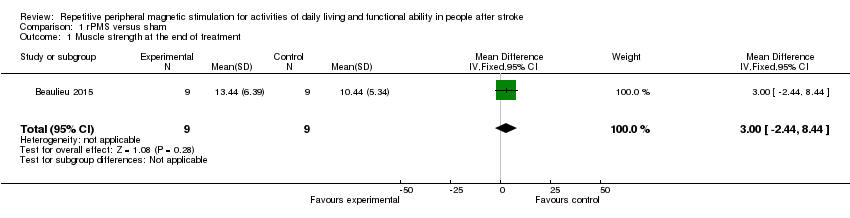
Comparison 1 rPMS versus sham, Outcome 1 Muscle strength at the end of treatment.

Comparison 2 rPMS plus rehabilitation versus rehabilitation only, Outcome 1 Activities of daily living at the end of treatment.
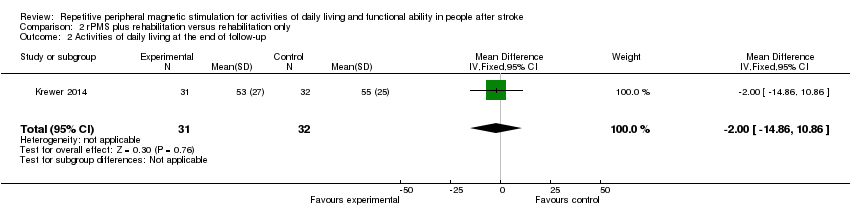
Comparison 2 rPMS plus rehabilitation versus rehabilitation only, Outcome 2 Activities of daily living at the end of follow‐up.

Comparison 2 rPMS plus rehabilitation versus rehabilitation only, Outcome 3 Upper limb function at the end of treatment.

Comparison 2 rPMS plus rehabilitation versus rehabilitation only, Outcome 4 Upper limb function at the end of follow‐up.

Comparison 2 rPMS plus rehabilitation versus rehabilitation only, Outcome 5 Spasticity at the end of treatment.

Comparison 2 rPMS plus rehabilitation versus rehabilitation only, Outcome 6 Spasticity at the end of follow‐up.
| rPMS compared with any type of control intervention in stroke | ||||||
| Patient or population: people with stroke Setting: Germany and Canada | ||||||
| Outcomes | Anticipated absolute effects* (95% CI) | Relative effect | No. of participants | Quality of the evidence | Comments | |
| Risk with any type of control intervention | Risk with rPMS | |||||
| Activities of daily living (ADLs) | Mean activities of daily living score was 50 | MD 3 lower | ‐ | 63 | ⊕⊕⊝⊝ | |
| Upper limb function | Mean upper limb function score was 13 | MD 2 higher | ‐ | 63 | ⊕⊕⊝⊝ | |
| Lower limb function ‐ not measured | ‐ | ‐ | See comments | ‐ | ‐ | No trials measured this outcome |
| Spasticity (elbow) | Mean spasticity (elbow) score was 1.41 | MD 0.41 lower | ‐ | 63 | ⊕⊕⊝⊝ | |
| Spasticity (wrist) | Mean spasticity (wrist) score was 2.13 | MD 0.2 lower | ‐ | 63 | ⊕⊕⊝⊝ | |
| Muscle strength | Mean muscle strength was 10.44 kg | MD 3 kg higher | ‐ | 18 | ⊕⊕⊝⊝ | |
| Death ‐ not reported | ‐ | ‐ | See comments | ‐ | ‐ | No trials reported this outcome |
| *The risk in the intervention group (and its 95% confidence interval) is based on assumed risk in the comparison group and relative effect of the intervention (and its 95% CI) | ||||||
| GRADE Working Group grades of evidence | ||||||
| aOne study with small sample size; 95% CI overlaps zero | ||||||
| Outcome or subgroup title | No. of studies | No. of participants | Statistical method | Effect size |
| 1 Muscle strength at the end of treatment Show forest plot | 1 | 18 | Mean Difference (IV, Fixed, 95% CI) | 3.0 [‐2.44, 8.44] |
| Outcome or subgroup title | No. of studies | No. of participants | Statistical method | Effect size |
| 1 Activities of daily living at the end of treatment Show forest plot | 1 | 63 | Mean Difference (IV, Fixed, 95% CI) | ‐3.00 [‐16.35, 10.35] |
| 2 Activities of daily living at the end of follow‐up Show forest plot | 1 | 63 | Mean Difference (IV, Fixed, 95% CI) | ‐2.0 [‐14.86, 10.86] |
| 3 Upper limb function at the end of treatment Show forest plot | 1 | 63 | Mean Difference (IV, Fixed, 95% CI) | 2.0 [‐4.91, 8.91] |
| 4 Upper limb function at the end of follow‐up Show forest plot | 1 | 63 | Mean Difference (IV, Fixed, 95% CI) | 4.0 [‐2.92, 10.92] |
| 5 Spasticity at the end of treatment Show forest plot | 1 | Mean Difference (IV, Fixed, 95% CI) | Subtotals only | |
| 5.1 Spasticity at the end of treatment (elbow) | 1 | 63 | Mean Difference (IV, Fixed, 95% CI) | ‐0.41 [‐0.89, 0.07] |
| 5.2 Spasticity at the end of treatment (wrist) | 1 | 63 | Mean Difference (IV, Fixed, 95% CI) | ‐0.20 [‐0.76, 0.36] |
| 6 Spasticity at the end of follow‐up Show forest plot | 1 | Mean Difference (IV, Fixed, 95% CI) | Subtotals only | |
| 6.1 Spasticity at the end of follow‐up (elbow) | 1 | 63 | Mean Difference (IV, Fixed, 95% CI) | ‐0.48 [‐0.93, ‐0.03] |
| 6.2 Spasticity at the end of follow‐up (wrist) | 1 | 63 | Mean Difference (IV, Fixed, 95% CI) | ‐0.13 [‐0.67, 0.41] |