Tratamientos farmacológicos con antidiabéticos orales para el tratamiento de las pacientes con diabetes gestacional
Información
- DOI:
- https://doi.org/10.1002/14651858.CD011967.pub2Copiar DOI

- Base de datos:
-
- Cochrane Database of Systematic Reviews
- Versión publicada:
-
- 25 enero 2017see what's new
- Tipo:
-
- Intervention
- Etapa:
-
- Review
- Grupo Editorial Cochrane:
-
Grupo Cochrane de Embarazo y parto
- Copyright:
-
- Copyright © 2017 The Cochrane Collaboration. Published by John Wiley & Sons, Ltd.
Cifras del artículo
Altmetric:
Citado por:
Autores
Contributions of authors
Julie Brown guarantees this review.
Julie Brown wrote the first version of this protocol and review. She contributed to data extraction and data entry.
Ruth Martis has provided comments on drafts of this review.
Brenda Hughes has provided input from a pharmacological perspective on drafts of this review.
Janet Rowan has provided input from a clinical perspective on drafts of this review.
Caroline Crowther has provided clinical and methodological feedback on drafts of this review.
Sources of support
Internal sources
-
An internal University department grant, New Zealand.
An internal University of Auckland department grant from the Liggins Institute has been awarded to Julie Brown to help with the preparation of several Cochrane systematic reviews as part of an overview of systematic reviews for the treatment of women with gestational diabetes. This current protocol/review will be one of the included reviews.
-
Liggins Institute, New Zealand.
Support for infrastructure to support the preparation of this protocol is from the Liggins Institute, University of Auckland, New Zealand.
External sources
-
National Institute for Health Research (NIHR), UK.
NIHR Cochrane Programme Grant Project: 13/89/05 – Pregnancy and childbirth systematic reviews to support clinical guidelines
Declarations of interest
Julie Brown has received a NZD 15,000 internal University grant to assist with the preparation of a Cochrane overview of treatment for gestational diabetes. This is one of the reviews that has been supported. The funds have contributed to a research assistant's time. The funding body gains no financial interest from the publication of the review and has not influenced the content.
Ruth Martis: none known
Brenda Hughes: none known
Janet Rowan: none known
Caroline A Crowther: none known
Acknowledgements
We acknowledge the valuable contributions of Nisreen Alwan, Jane West and Derek Tuffnall who were the authors of the original review Treatments for gestational diabetes (Alwan 2009).
We acknowledge the contribution of Tineke Crawford who assisted in data extraction and data entry.
We acknowledge the contribution of the authors of the other two reviews that were split from this original review in the preparation of the core background sections of the new review protocols.
Lifestyle interventions for the treatment of women with gestational diabetes ‐ Julie Brown, Nisreen Alwan, Stephen Brown, Christopher McKinlay, Diane Farrar, Jane West, Caroline Crowther.
Insulin for the treatment of women with gestational diabetes ‐ Julie Brown, Luke Greskowiak, Michelle Downie, Kate Williamson, Caroline Crowther.
We acknowledge the support from the Cochrane Pregnancy and Childbirth editorial team in Liverpool, the Australian and New Zealand Satellite of Cochrane Pregnancy and Childbirth and the Liggins Institute, University of Auckland, New Zealand.
As part of the pre‐publication editorial process, this review has been commented on by four peers (an editor and three referees who are external to the editorial team) and the Group's Statistical Adviser.
This project was supported by the National Institute for Health Research, via Cochrane Infrastructure and Cochrane Programme Grant funding to Cochrane Pregnancy and Childbirth. The views and opinions expressed therein are those of the authors and do not necessarily reflect those of the Systematic Reviews Programme, NIHR, NHS or the Department of Health.
Version history
| Published | Title | Stage | Authors | Version |
| 2017 Jan 25 | Oral anti‐diabetic pharmacological therapies for the treatment of women with gestational diabetes | Review | Julie Brown, Ruth Martis, Brenda Hughes, Janet Rowan, Caroline A Crowther | |
| 2015 Nov 24 | Oral anti‐diabetic pharmacological therapies for the treatment of women with gestational diabetes | Protocol | Julie Brown, Ruth Martis, Brenda Hughes, Janet Rowan, Caroline A Crowther | |
Differences between protocol and review
The following differences are noted between the published protocol and the full review.
Objectives
-
Review: To evaluate the effects of oral anti‐diabetic pharmacological therapies for treating women with GDM.
-
Protocol: To evaluate the effectiveness of oral agents in treating women with gestational diabetes for improving maternal and fetal health and well‐being.
Types of interventions
In this section we have clarified that the ‘anti‐diabetic agents’ are in fact pharmacological therapies.
Outcomes for use in GRADE/neonatal outcomes
We have edited ‘Neurosensory disability’ to ‘Neurosensory disability in later childhood’.
Notes
The original review, Alwan 2009 has been split into three new reviews due to the complexity of the included interventions. The following new reviews are underway.
-
Lifestyle interventions for the treatment of women with gestational diabetes mellitus (Brown 2015)
-
Oral anti‐diabetic pharmacological therapies for the treatment of women with gestational diabetes mellitus (this review)
-
Insulin for the treatment of women with gestational diabetes mellitus (Brown 2016)
Keywords
MeSH
Medical Subject Headings (MeSH) Keywords
- Acarbose [administration & dosage];
- Administration, Oral;
- Diabetes, Gestational [*drug therapy];
- Glyburide [administration & dosage];
- Hypoglycemia [chemically induced, prevention & control];
- Hypoglycemic Agents [*administration & dosage, adverse effects];
- Metformin [administration & dosage];
- Randomized Controlled Trials as Topic;
- Tolbutamide [administration & dosage];
Medical Subject Headings Check Words
Female; Humans; Pregnancy;
PICO

Study flow diagram

Risk of bias graph: review authors' judgements about each risk of bias item presented as percentages across all included studies

Risk of bias summary: review authors' judgements about each risk of bias item for each included study

Comparison 1 Oral anti‐diabetic agents versus placebo, Outcome 1 Hypertensive disorders of pregnancy.

Comparison 1 Oral anti‐diabetic agents versus placebo, Outcome 2 Caesarean section.

Comparison 1 Oral anti‐diabetic agents versus placebo, Outcome 3 Large‐for‐gestational age.

Comparison 1 Oral anti‐diabetic agents versus placebo, Outcome 4 Use of additional pharmacotherapy.

Comparison 1 Oral anti‐diabetic agents versus placebo, Outcome 5 Glycaemic control (end of treatment) (mg/dL).

Comparison 1 Oral anti‐diabetic agents versus placebo, Outcome 6 Weight gain in pregnancy (Kg).

Comparison 1 Oral anti‐diabetic agents versus placebo, Outcome 7 Induction of labour.

Comparison 1 Oral anti‐diabetic agents versus placebo, Outcome 8 Perineal trauma.

Comparison 1 Oral anti‐diabetic agents versus placebo, Outcome 9 Stillbirth.

Comparison 1 Oral anti‐diabetic agents versus placebo, Outcome 10 Neonatal death.

Comparison 1 Oral anti‐diabetic agents versus placebo, Outcome 11 Small‐for‐gestational age.

Comparison 1 Oral anti‐diabetic agents versus placebo, Outcome 12 Macrosomia.

Comparison 1 Oral anti‐diabetic agents versus placebo, Outcome 13 Birthweight (g).

Comparison 1 Oral anti‐diabetic agents versus placebo, Outcome 14 Shoulder dystocia.

Comparison 1 Oral anti‐diabetic agents versus placebo, Outcome 15 Bone fracture.

Comparison 1 Oral anti‐diabetic agents versus placebo, Outcome 16 Nerve palsy.

Comparison 1 Oral anti‐diabetic agents versus placebo, Outcome 17 Gestational age at birth (weeks).

Comparison 1 Oral anti‐diabetic agents versus placebo, Outcome 18 Neonatal hypoglycaemia.
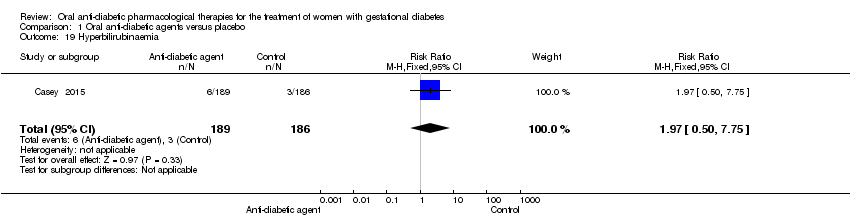
Comparison 1 Oral anti‐diabetic agents versus placebo, Outcome 19 Hyperbilirubinaemia.

Comparison 1 Oral anti‐diabetic agents versus placebo, Outcome 20 Admission to NICU.

Comparison 2 Metformin versus glibenclamide, Outcome 1 Hypertensive disorders of pregnancy.

Comparison 2 Metformin versus glibenclamide, Outcome 2 Caesarean section.

Comparison 2 Metformin versus glibenclamide, Outcome 3 Perinatal mortality.

Comparison 2 Metformin versus glibenclamide, Outcome 4 Large‐for‐gestational age.

Comparison 2 Metformin versus glibenclamide, Outcome 5 Death or serious morbidity composite.

Comparison 2 Metformin versus glibenclamide, Outcome 6 Use of additional pharmacotherapy.

Comparison 2 Metformin versus glibenclamide, Outcome 7 Maternal hypoglycaemia.

Comparison 2 Metformin versus glibenclamide, Outcome 8 Glycaemic control (mg/L; mmol/L).

Comparison 2 Metformin versus glibenclamide, Outcome 9 Weight gain in pregnancy (Kg).

Comparison 2 Metformin versus glibenclamide, Outcome 10 Induction of labour.

Comparison 2 Metformin versus glibenclamide, Outcome 11 Perineal trauma.
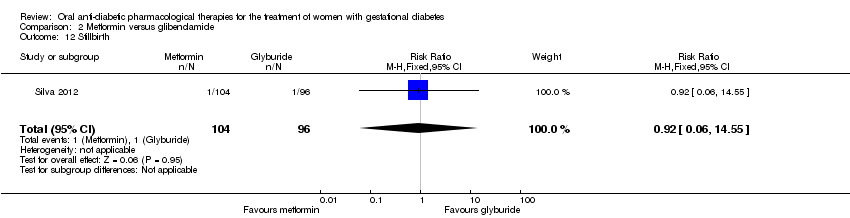
Comparison 2 Metformin versus glibenclamide, Outcome 12 Stillbirth.

Comparison 2 Metformin versus glibenclamide, Outcome 13 Macrosomia.

Comparison 2 Metformin versus glibenclamide, Outcome 14 Birth trauma.

Comparison 2 Metformin versus glibenclamide, Outcome 15 Shoulder dystocia.

Comparison 2 Metformin versus glibenclamide, Outcome 16 Gestational age at birth (weeks).

Comparison 2 Metformin versus glibenclamide, Outcome 17 Preterm birth.

Comparison 2 Metformin versus glibenclamide, Outcome 18 5‐minute Apgar < 7.

Comparison 2 Metformin versus glibenclamide, Outcome 19 Birthweight (g).

Comparison 2 Metformin versus glibenclamide, Outcome 20 Ponderal index.

Comparison 2 Metformin versus glibenclamide, Outcome 21 Neonatal hypoglycaemia.

Comparison 2 Metformin versus glibenclamide, Outcome 22 Respiratory distress syndrome.

Comparison 2 Metformin versus glibenclamide, Outcome 23 Hyperbilirubinaemia.

Comparison 2 Metformin versus glibenclamide, Outcome 24 Admission to NICU.
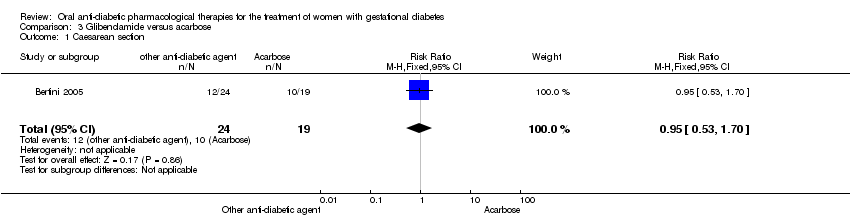
Comparison 3 Glibenclamide versus acarbose, Outcome 1 Caesarean section.

Comparison 3 Glibenclamide versus acarbose, Outcome 2 Perinatal mortality.

Comparison 3 Glibenclamide versus acarbose, Outcome 3 Large‐for‐gestational age.

Comparison 3 Glibenclamide versus acarbose, Outcome 4 Need for additional pharmacotherapy.

Comparison 3 Glibenclamide versus acarbose, Outcome 5 Maternal hypoglycaemia.

Comparison 3 Glibenclamide versus acarbose, Outcome 6 Weight gain in pregnancy (Kg).
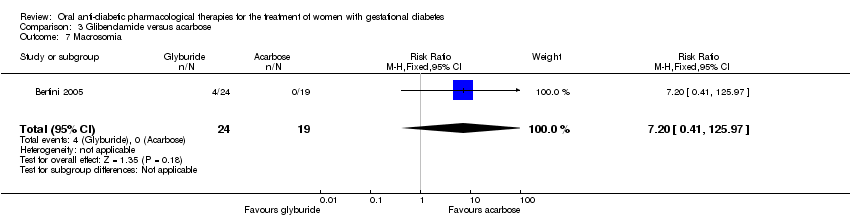
Comparison 3 Glibenclamide versus acarbose, Outcome 7 Macrosomia.

Comparison 3 Glibenclamide versus acarbose, Outcome 8 Small‐for‐gestational age.

Comparison 3 Glibenclamide versus acarbose, Outcome 9 Birth trauma (not specified).

Comparison 3 Glibenclamide versus acarbose, Outcome 10 Gestational age at birth (weeks).

Comparison 3 Glibenclamide versus acarbose, Outcome 11 Preterm birth.

Comparison 3 Glibenclamide versus acarbose, Outcome 12 Birthweight (Kg).

Comparison 3 Glibenclamide versus acarbose, Outcome 13 Neonatal hypoglycaemia.

Comparison 3 Glibenclamide versus acarbose, Outcome 14 Respiratory distress syndrome.
| Oral anti‐diabetic pharmacological therapies versus placebo ‐ maternal outcomes | ||||||
| Patient or population: women diagnosed with gestational diabetes; 24‐30 weeks' gestation; singleton pregnancy. Setting: Medical Centre, USA. | ||||||
| Outcomes | Anticipated absolute effects* (95% CI) | Relative effect | № of participants | Quality of the evidence | Comments | |
| Risk with placebo | Risk with oral anti‐diabetic pharmacological therapies | |||||
| Hypertensive disorders of pregnancy ‐ (any type) | 167 per 1000 | 207 per 1000 | RR 1.24 | 375 | ⊕⊝⊝⊝ | |
| Caearean section | 360 per 1000 | 371 per 1000 | RR 1.03 | 375 | ⊕⊝⊝⊝ | |
| Development of type 2 diabetes ‐ not measured | see comment | see comment | not estimable | ‐ | ‐ | This was not a pre‐specified outcome for the included studies reporting on this comparison |
| Perineal trauma | 5 per 1000 | 5 per 1000 | RR 0.98 | 375 | ⊕⊝⊝⊝ | Event rates were low 1/189 for anti‐diabetic pharmacological therapy and 1/186 in the control (placebo) group |
| Return to pre‐pregnancy weight ‐ not measured | see comment | see comment | not estimable | ‐ | ‐ | This was not a pre‐specified outcome for the included studies reporting on this comparison |
| Postnatal depression ‐ not measured | see comment | see comment | not estimable | ‐ | ‐ | This was not a pre‐specified outcome for the included studies reporting on this comparison |
| Induction of labour | 188 per 1000 | 222 per 1000 | RR 1.18 | 375 | ⊕⊝⊝⊝ | |
| *The risk in the intervention group (and its 95% confidence interval) is based on the assumed risk in the comparison group and the relative effect of the intervention (and its 95% CI). | ||||||
| GRADE Working Group grades of evidence | ||||||
| aRisk of bias ‐ we did not find a published protocol and there were more outcomes reported in the published paper than were listed in the trial registration document ‐ downgraded 1 level. | ||||||
| Oral anti‐diabetic pharmacological therapies versus placebo ‐ neonatal outcomes | ||||||
| Patient or population: infants of women diagnosed with gestational diabetes Setting: Medical Centre, USA Comparison: placebo | ||||||
| Outcomes | Anticipated absolute effects* (95% CI) | Relative effect | № of participants | Quality of the evidence | Comments | |
| Risk with placebo | Risk with oral anti‐diabetic pharmacological therapies | |||||
| Large‐for‐gestational age | 118 per 1000 | 105 per 1000 | RR 0.89 | 375 | ⊕⊝⊝⊝ | |
| Perinatal mortality | see comment | see comment | not estimable | ‐ | ‐ | None of the included studies pre‐specified this outcome |
| Death or serious morbidity composite ‐ not reported | see comment | see comment | not estimable | ‐ | ‐ | None of the included studies pre‐specified this outcome |
| Neonatal hypoglycaemia | 11 per 1000 | 21 per 1000 | RR 1.97 | 375 | ⊕⊝⊝⊝ | Event rates were low with 4/189 for oral anti‐diabetic pharmacological therapy and 2/186 for placebo group |
| Adiposity (neonate, child, adult) ‐ not measured | see comment | see comment | not estimable | ‐ | ‐ | None of the included studies pre‐specified this outcome |
| Diabetes (child, adult) ‐ not measured | see comment | see comment | not estimable | ‐ | ‐ | None of the included studies pre‐specified this outcome |
| Neurosensory disability in later childhood ‐ not measured | see comment | see comment | not estimable | ‐ | ‐ | None of the included studies pre‐specified this outcome |
| *The risk in the intervention group (and its 95% confidence interval) is based on the assumed risk in the comparison group and the relative effect of the intervention (and its 95% CI). | ||||||
| GRADE Working Group grades of evidence | ||||||
| aRisk of bias ‐ we did not find a published protocol and there were more outcomes reported in the published paper than were listed in the trial registration document ‐ downgraded 1 level. | ||||||
| Metformin versus glibenclamide ‐ maternal outcomes | ||||||
| Patient or population: women diagnosed with gestational diabetes Setting: trials conducted in Brazil, India and the USA | ||||||
| Outcomes | Anticipated absolute effects* (95% CI) | Relative effect | № of participants | Quality of the evidence | Comments | |
| Risk with glibenclamide | Risk with metformin | |||||
| Hypertensive disorders of pregnancy | 88 per 1000 | 62 per 1000 | RR 0.70 | 508 | ⊕⊕⊕⊝ | |
| Caesarean section | 392 per 1000 | 470 per 1000 | RR 1.20 | 554 | ⊕⊕⊝⊝ | |
| Development of type 2 diabetes ‐ not measured | see comment | see comment | not estimable | ‐ | ‐ | None of the included studies for this comparison had pre‐specified development of type 2 diabetes as an outcome |
| Perineal trauma | 6 per 1000 | 11 per 1000 | RR 1.67 | 308 | ⊕⊕⊝⊝ | Note low event rates (2/154 for metformin and 1/154 for glibenclamide |
| Return to pre‐pregnancy weight ‐ not measured | see comment | see comment | not estimable | ‐ | ‐ | None of the included studies for this comparison had return to pre‐pregnancy weight as a pre‐specified outcome |
| Postnatal depression ‐ not measured | see comment | see comment | not estimable | ‐ | ‐ | None of the included studies for this comparison had postnatal depression as a pre‐specified outcome |
| Induction of labour | 613 per 1000 | 496 per 1000 | RR 0.81 | 159 | ⊕⊕⊝⊝ | |
| *The risk in the intervention group (and its 95% confidence interval) is based on the assumed risk in the comparison group and the relative effect of the intervention (and its 95% CI). | ||||||
| GRADE Working Group grades of evidence | ||||||
| aRisk of bias ‐ all studies were open label ‐ downgraded 1 level. | ||||||
| Metformin versus glibenclamide ‐ neonatal outcomes | ||||||
| Patient or population: Infants of women diagnosed with gestational diabetes Setting: trials conducted in Brazil, India and the USA | ||||||
| Outcomes | Anticipated absolute effects* (95% CI) | Relative effect | № of participants | Quality of the evidence | Comments | |
| Risk with glibenclamide | Risk with metformin | |||||
| Large‐for‐gestational age | 193 per 1000 | 129 per 1000 | RR 0.67 | 246 | ⊕⊕⊝⊝ | |
| Perinatal mortality | 6 per 1000 | 5 per 1000 | RR 0.92 | 359 | ⊕⊝⊝⊝ | Note that event rates were very low. 1 study had no event of perinatal death in either the metformin nor the glibenclamide group. The second study had 1 death in each group |
| Death or serious morbidity composite | 350 per 1000 | 189 per 1000 | RR 0.54 | 159 | ⊕⊕⊝⊝ | |
| Neonatal hypoglycaemia | 48 per 1000 | 41 per 1000 | RR 0.86 | 554 | ⊕⊕⊝⊝ | |
| Adiposity ‐ not measured | see comment | see comment | not estimable | ‐ | ‐ | None of the included trials for this comparison had pre‐specified adiposity as a trial outcome |
| Diabetes ‐ not measured | see comment | see comment | not estimable | ‐ | ‐ | None of the included trials for this comparison had pre‐specified diabetes as a trial outcome |
| Neurosensory disability in later childhood ‐ not measured | see comment | see comment | not estimable | ‐ | ‐ | None of the included trials for this comparison had pre‐specified neurosensory disability as a trial outcome |
| *The risk in the intervention group (and its 95% confidence interval) is based on the assumed risk in the comparison group and the relative effect of the intervention (and its 95% CI). | ||||||
| GRADE Working Group grades of evidence | ||||||
| aRisk of bias ‐ allocation concealment was unclear in 1 study. 1 study was open label ‐ downgraded 1 level. | ||||||
| Glibenclamide versus acarbose ‐ maternal outcomes | ||||||
| Patient or population: women diagnosed with gestational diabetes; 11 to 33 weeks' gestation; singleton pregnancy Setting: Maternity hospital, Brazil | ||||||
| Outcomes | Anticipated absolute effects* (95% CI) | Relative effect | № of participants | Quality of the evidence | Comments | |
| Risk with acarbose | Risk with other oral anti‐diabetic agent | |||||
| Hypertensive disorders of pregnancy ‐ not reported | see comment | see comment | not estimable | ‐ | ‐ | No data were reported for this outcome |
| Caesarean section | 526 per 1000 | 500 per 1000 | RR 0.95 | 43 | ⊕⊕⊝⊝ | |
| Development of type 2 diabetes ‐ not reported | see comment | see comment | not estimable | ‐ | ‐ | No data were reported for this outcome |
| Perineal trauma ‐ not reported | see comment | see comment | not estimable | ‐ | ‐ | No data were reported for this outcome |
| Return to pre‐pregnancy weight ‐ not reported | see comment | see comment | not estimable | ‐ | ‐ | No data were reported for this outcome |
| Postnatal depression ‐ not reported | see comment | see comment | not estimable | ‐ | ‐ | No data were reported for this outcome |
| Induction of labour ‐ not reported | see comment | see comment | not estimable | ‐ | ‐ | No data were reported for this outcome |
| *The risk in the intervention group (and its 95% confidence interval) is based on the assumed risk in the comparison group and the relative effect of the intervention (and its 95% CI). | ||||||
| GRADE Working Group grades of evidence | ||||||
| aMethod of randomisation was unclear and the study was open‐label ‐ downgraded ‐1 level. | ||||||
| Glibenclamide versus acarbose ‐ neonatal outcomes | ||||||
| Patient or population: women with gestational diabetes Setting: maternity hospital, Brazil | ||||||
| Outcomes | Anticipated absolute effects* (95% CI) | Relative effect | № of participants | Quality of the evidence | Comments | |
| Risk with acarbose | Risk with glibenclamide | |||||
| Large‐for‐gestational age | 105 per 1000 | 251 per 1000 | RR 2.38 | 43 | ⊕⊕⊝⊝ | |
| Perinatal mortality | see comment | see comment | not estimable | 43 (1 RCT) | ⊕⊕⊝⊝ | No events were reported in either group |
| Death or serious morbidity composite ‐ not reported | see comment | see comment | not estimable | ‐ | ‐ | No data were reported for this outcome |
| Neonatal hypoglycaemia | 53/1000 | 333/1000 (46 to 1000) | RR 6.33 (0.87 to 46.32) | 43 | ⊕⊕⊝⊝ | Low event rates and sample size (8/24 in glibenclamide group and 1/19 in acarbose group) |
| Adiposity ‐ not reported | see comment | see comment | not estimable | ‐ | ‐ | No data were reported for this outcome |
| Diabetes ‐ not reported | see comment | see comment | not estimable | ‐ | ‐ | No data were reported for this outcome |
| Neurosensory disability in later childhood ‐ not reported | see comment | see comment | not estimable | ‐ | ‐ | No data were reported for this outcome |
| *The risk in the intervention group (and its 95% confidence interval) is based on the assumed risk in the comparison group and the relative effect of the intervention (and its 95% CI). | ||||||
| GRADE Working Group grades of evidence | ||||||
| aRisk of bias ‐ evidence of selective reporting ‐ downgraded 1 level. | ||||||
| Organisation/professional body | Screening and diagnostic criteria | |||||
| 1‐hour oral glucose challenge test | Oral glucose tolerance test | Fasting | 1 hour | 2 hour | 3 hour | |
| ADA 2013a, IADPSG 2010a, ADIPS 2013 (Nankervis 2014)a, WHO 2014a | ‐ | 75 g | ≥ 5.1 mmol/L (≥ 92 mg/dL) | ≥ 10 mmol/L (≥ 180 mg/dL) | ≥ 8.5 mmol/L (≥ 153 mg/dL) | ‐ |
| Carpenter and Coustanb National Diabetes Data Groupb | 50 g (> 7.2 mmol/L; > 130 mg/dL) | 100 g | ≥ 5.3 mmol/L (≥ 95 mg/dL) | ≥ 10 mmol/L (≥180 mg/dL) | ≥ 8.6 mmol/L (≥ 155 mg/dL) | ≥ 7.8 mmol/L (≥ 140 mg/dL) |
| 50 g (> 7.8 mmol/L; > 140 mg/dL) | 100 g | ≥ 5.8 mmol/L (≥ 105 mg/dL) | ≥ 10.6 mmol/L (≥ 190 mg/dL) | ≥ 9.2 mmol/L (≥ 165 mg/dL) | ≥ 8.0 mmol/L (≥ 145 mg/dL) | |
| Canadian Diabetes Association 2013 eithera orb | 50 g ‐ | 75 g 75 g | ≥ 5.3 mmol/L (≥ 95 mg/dL) ≥ 5.1 mmol/L (≥ 92 mg/dL) | ≥ 10.6 mmol/L (≥ 190 mg/dL) ≥ 10 mmol/L (≥ 180 mg/dL) | ≥ 9.0 mmol/L ≥ 8.5 mmol/L (≥ 153 mg/dL) | |
| ‐ | 75 g | ≥ 5.6 mmol/L (≥ 101 mg/dL) | ‐ | ≥ 7.8 mmol/L (≥ 140 mg/dL) | ‐ | |
| NICE 2008; WHO 1999; Hoffman 1998 (ADIPS)b | ‐ | 75 g | ≥ 7.0 mmol/L (≥ 126 mg/dL) | ‐ | ≥ 11.1 mmol/L (≥ 200 mg/dL) | ‐ |
| New Zealand Ministry of Health 2014a | 50 g if HbA1c < 41 mmol/mol (≥ 7.8 mmol/L; ≥ 140 mg/dL) | 75 g | ≥ 5.5 mmol/L (≥ 99 mg/dL) | ‐ | ≥ 9.0 mmol/L (≥ 162 mg/dL) | ‐ |
| ADA: American Diabetes Association | ||||||
| Study ID | Intervention | Comparison |
| 31.2 ± 4.5 (n = 24), glibenclamide | 31.5 ± 5.8 (n = 19), acarbose | |
| 31.3 ± 6, glibenclamide | 31.2 ± 6, placebo | |
| Not stated, acarbose | Not stated, placebo | |
| Not stated, glibenclamide | Not stated, metformin | |
| Not stated, glibenclamide | Not stated, metformin | |
| 33.4 ± 4.4 (n = 79), metformin | 33.6 ± 4.6 (n = 80), glibenclamide | |
| 31 ± 7.1 (n = 75) ‐ metformin | 29.6 ± 7.8 (n = 74), glibenclamide | |
| Not stated, metformin | Not stated, standard care | |
| Not stated, metformin | Not stated, glibenclamide | |
| Chlopropramide 30.9 (n = 58) Tolbutamide 29.7 (n = 46) | Diet 32.7 (n = 56) | |
| 32.6 ± 5.6 (n = 104), metformin | 31.3 ± 5.4 (n = 96), glibenclamide |
| Study ID | Intervention | Comparison | Timepoint BMI measured at |
| 27.5 ± 5.8 (n = 24), glibenclamide | 25.7 ± 4.2 (n = 19), acarbose | Not stated | |
| 29.0 ± 4.8 | 28.9 ± 5.3 | Pre‐pregnancy | |
| Not stated | Not stated | Not stated | |
| Not stated | Not stated | Not stated | |
| Not stated | Not stated | Not stated | |
| 28.7 ± 4.4 (n = 79), metformin | 28.8 ± 4.0 (n = 80), glibenclamide | Baseline | |
| 32.8 ± 5.8 (n = 75), metformin | 32.7 ± 7.0 (n = 74), glibenclamide | Not stated | |
| Not stated | Not stated | Not stated | |
| Not stated | Not stated | Not stated | |
| 28.7 ± 5.4 (n = 104), metformin | 28.6 ± 5.9 (n = 96), glibenclamide | Not stated |
| Study ID | Intervention | Comparison |
| Not stated | Not stated | |
| 26.0 ± 2.0, glibenclamide | 26.0 ± 1.0, placebo | |
| Not stated | Not stated | |
| Not stated | Not stated | |
| Not stated | Not stated | |
| 29.3 ± 3.3 weeks' (n = 79), metformin | 29.7 ± 3.7 weeks' (n = 80) | |
| 27.3 ± 6.8 weeks' (n = 75), metformin | 29.1 ± 5.0 weeks' (n = 74), glibenclamide | |
| Not stated | Not stated | |
| Not stated | Not stated | |
| Not stated | Not stated | |
| 27.0 ± 6.4 weeks' (n = 104), metformin | 25.4 ± 7.1 weeks' (n = 96), glibenclamide |
| Study ID | Timing | Screening | Diagnosis | Criteria |
| 24‐28 weeks' | 1 hour, 50 g OGCT(≥ 7.8 mmol/L; 140 mg/dL) | 2 abnormal values 3 hour, 100 g OGTT Fasting < 5.8 mmol/L (105 mg/dL) 1‐hour ≥ 10.6 mmol/L (190 mg/dL) 2‐hour ≥ 9.2 mmol/L (165 mg/dL) 3‐hour ≥ 8.1 mmol/L (145 mg/dL) | National Diabetes Data Group | |
| 11‐33 weeks' | Not stated | 75 g OGTT Fasting ≥ 6.1 mmol/L (110 mg/dL); 2‐hour value ≥ 7.8 mmol/L (140 mg/dL). | WHO criteria (old) | |
| 12‐34 weeks' | Not stated | Not stated | Not stated | |
| Not stated | Not stated | Not stated | WHO criteria but not stated if 1999 or 2015 | |
| ‐ | 1 hour 50 g OGCT (≥ 7.8 mmol/L; 140 mg/dL) | 2 abnormal values 100 g OGTT: fasting glucose ≥ 5.3 mmol/L, 1‐hour ≥ 10 mmol/L, 2‐hour ≥ 8.6 mmol/L, 3‐hour ≥ 7.8 mmol/L | Carpenter and Coustan | |
| 24‐28 weeks' | Not stated | 2 abnormal values 100 g OGTT: fasting glucose ≥ 5.3 mmol/L, 1‐hour ≥ 10 mmol/L, 2‐hour ≥ 8.6 mmol/L, 3‐hour ≥ 7.8 mmol/L | National Diabetes Data Group (1979) | |
| 11‐33 weeks' | 1 hour 50 g OGCT (≥ 7.2 mmol/L; 130 mg/dL) | 3 hour 100 g OGTT using criteria with 2 or more abnormal results. | Carpenter and Coustan | |
| Not stated | Not stated | Fasting blood glucose 5.1 to 5.4 mmol/L, 2 hour < 8.5 mmol/L | Not stated | |
| 11‐33 weeks' | 1 hour 50 g OGCT (≥ 7.2 mmol/L; 130 mg/dL) | 3 hour 100 g OGTT using criteria with 2 or more abnormal results. | Carpenter and Coustan | |
| Not stated | Not stated | Not stated | Not stated | |
| Not stated | Not stated | Not stated | WHO criteria (1999) | |
| OGCT oral glucose tolerance test; OGTT oral glucose tolerance test | ||||
| Study ID | Fasting | 1‐hour post‐prandial | 2‐hour post‐prandial |
| < 5.3 mmol/L (95mg/dL) | ‐ | < 6.7mmol/L (120 mg/dL) | |
| < 5.0 mmol/L (90 mg/dL) | ‐ | < 5.5 mmol/L (100 mg/dL) | |
| < 5.3 mmol/L (95 mg/dL) | < 7.5 mmol/L (135 mg/dL) | ‐ | |
| Not stated | Not stated | Not stated | |
| < 5.3 mmol/L (95 mg/dL) | < 7.8 mmol/L (140 mg/dL) | ‐ | |
| ≤ 5.3 mmol/L (95 mg/dL) | ‐ | ≤ 6.7 mmol/L (120 mg/dL) | |
| < 5.8 mmol/L (105 mg/dL) | ‐ | < 6.7 mmol/L (120 mg/dL) | |
| Not stated | Not stated | Not stated | |
| ≤ 5.3 mmol/L (95 mg/dL) | 90 minutes < 7.2 mmol/L (130 mg/dL) | ‐ | |
| ‐ | 8.3 mmol/L* (150 mg/dL) | ‐ | |
| 5.0 mmol/L (90 mg/dL) | < 6.7 mmol/L (120 mg/dL) | ‐ | |
| Post‐prandial timing not specified | |||
| Outcome or subgroup title | No. of studies | No. of participants | Statistical method | Effect size |
| 1 Hypertensive disorders of pregnancy Show forest plot | 1 | Risk Ratio (M‐H, Fixed, 95% CI) | Subtotals only | |
| 1.1 Hypertensive disorders of pregnancy (any type) | 1 | 375 | Risk Ratio (M‐H, Fixed, 95% CI) | 1.24 [0.81, 1.90] |
| 1.2 Pregnancy‐induced hypertension | 1 | 375 | Risk Ratio (M‐H, Fixed, 95% CI) | 1.24 [0.71, 2.19] |
| 1.3 Pre‐eclampsia | 1 | 375 | Risk Ratio (M‐H, Fixed, 95% CI) | 1.23 [0.59, 2.56] |
| 2 Caesarean section Show forest plot | 1 | 375 | Risk Ratio (M‐H, Fixed, 95% CI) | 1.03 [0.79, 1.34] |
| 3 Large‐for‐gestational age Show forest plot | 1 | 375 | Risk Ratio (M‐H, Fixed, 95% CI) | 0.89 [0.51, 1.58] |
| 4 Use of additional pharmacotherapy Show forest plot | 2 | 434 | Risk Ratio (M‐H, Fixed, 95% CI) | 0.68 [0.42, 1.11] |
| 4.1 Placebo | 2 | 434 | Risk Ratio (M‐H, Fixed, 95% CI) | 0.68 [0.42, 1.11] |
| 5 Glycaemic control (end of treatment) (mg/dL) Show forest plot | 1 | 375 | Mean Difference (IV, Fixed, 95% CI) | ‐3.0 [‐5.13, ‐0.87] |
| 6 Weight gain in pregnancy (Kg) Show forest plot | 1 | 375 | Mean Difference (IV, Fixed, 95% CI) | 0.0 [‐0.96, 0.96] |
| 7 Induction of labour Show forest plot | 1 | 375 | Risk Ratio (M‐H, Fixed, 95% CI) | 1.18 [0.79, 1.76] |
| 8 Perineal trauma Show forest plot | 1 | 375 | Risk Ratio (M‐H, Fixed, 95% CI) | 0.98 [0.06, 15.62] |
| 9 Stillbirth Show forest plot | 1 | 375 | Risk Ratio (M‐H, Fixed, 95% CI) | 0.49 [0.05, 5.38] |
| 10 Neonatal death Show forest plot | 1 | 375 | Risk Ratio (M‐H, Fixed, 95% CI) | 0.0 [0.0, 0.0] |
| 11 Small‐for‐gestational age Show forest plot | 1 | 375 | Risk Ratio (M‐H, Fixed, 95% CI) | 1.11 [0.58, 2.10] |
| 12 Macrosomia Show forest plot | 1 | 375 | Risk Ratio (M‐H, Fixed, 95% CI) | 0.71 [0.36, 1.41] |
| 13 Birthweight (g) Show forest plot | 1 | 375 | Mean Difference (IV, Fixed, 95% CI) | ‐33.0 [‐134.53, 68.53] |
| 14 Shoulder dystocia Show forest plot | 1 | 375 | Risk Ratio (M‐H, Fixed, 95% CI) | 0.33 [0.01, 8.00] |
| 15 Bone fracture Show forest plot | 1 | 375 | Risk Ratio (M‐H, Fixed, 95% CI) | 0.74 [0.17, 3.25] |
| 16 Nerve palsy Show forest plot | 1 | 375 | Risk Ratio (M‐H, Fixed, 95% CI) | 0.33 [0.01, 8.00] |
| 17 Gestational age at birth (weeks) Show forest plot | 1 | 375 | Mean Difference (IV, Fixed, 95% CI) | 0.0 [‐0.32, 0.32] |
| 18 Neonatal hypoglycaemia Show forest plot | 1 | 375 | Risk Ratio (M‐H, Fixed, 95% CI) | 1.97 [0.36, 10.62] |
| 19 Hyperbilirubinaemia Show forest plot | 1 | 375 | Risk Ratio (M‐H, Fixed, 95% CI) | 1.97 [0.50, 7.75] |
| 20 Admission to NICU Show forest plot | 1 | 375 | Risk Ratio (M‐H, Fixed, 95% CI) | 1.16 [0.53, 2.53] |
| Outcome or subgroup title | No. of studies | No. of participants | Statistical method | Effect size |
| 1 Hypertensive disorders of pregnancy Show forest plot | 3 | 508 | Risk Ratio (M‐H, Fixed, 95% CI) | 0.70 [0.38, 1.30] |
| 1.1 Pre‐eclampsia | 1 | 149 | Risk Ratio (M‐H, Fixed, 95% CI) | 0.66 [0.11, 3.82] |
| 1.2 Pregnancy‐induced hypertension | 2 | 359 | Risk Ratio (M‐H, Fixed, 95% CI) | 0.71 [0.37, 1.37] |
| 2 Caesarean section Show forest plot | 4 | 554 | Risk Ratio (M‐H, Random, 95% CI) | 1.20 [0.83, 1.72] |
| 2.1 Carpenter and Coustan criteria | 2 | 195 | Risk Ratio (M‐H, Random, 95% CI) | 2.36 [0.53, 10.52] |
| 2.2 National Diabetes Data Group criteria | 1 | 159 | Risk Ratio (M‐H, Random, 95% CI) | 1.12 [0.75, 1.68] |
| 2.3 World Health Organization (1999) | 1 | 200 | Risk Ratio (M‐H, Random, 95% CI) | 0.95 [0.78, 1.15] |
| 3 Perinatal mortality Show forest plot | 2 | 359 | Risk Ratio (M‐H, Fixed, 95% CI) | 0.92 [0.06, 14.55] |
| 4 Large‐for‐gestational age Show forest plot | 2 | 246 | Risk Ratio (M‐H, Random, 95% CI) | 0.67 [0.24, 1.83] |
| 4.1 Carpenter and Coustan criteria | 1 | 46 | Risk Ratio (M‐H, Random, 95% CI) | 1.25 [0.38, 4.07] |
| 4.2 World Health Organization (1999) | 1 | 200 | Risk Ratio (M‐H, Random, 95% CI) | 0.44 [0.21, 0.92] |
| 5 Death or serious morbidity composite Show forest plot | 1 | 159 | Risk Ratio (M‐H, Fixed, 95% CI) | 0.54 [0.31, 0.94] |
| 6 Use of additional pharmacotherapy Show forest plot | 5 | 660 | Risk Ratio (M‐H, Random, 95% CI) | 0.66 [0.28, 1.57] |
| 7 Maternal hypoglycaemia Show forest plot | 3 | 354 | Risk Ratio (M‐H, Fixed, 95% CI) | 0.89 [0.36, 2.19] |
| 8 Glycaemic control (mg/L; mmol/L) Show forest plot | 3 | Std. Mean Difference (IV, Fixed, 95% CI) | Subtotals only | |
| 8.1 Fasting blood glucose | 3 | 508 | Std. Mean Difference (IV, Fixed, 95% CI) | 0.19 [0.02, 0.37] |
| 8.2 Postprandial blood glucose | 3 | 508 | Std. Mean Difference (IV, Fixed, 95% CI) | 0.16 [‐0.01, 0.34] |
| 8.3 HbA1c | 1 | 200 | Std. Mean Difference (IV, Fixed, 95% CI) | ‐0.12 [‐0.39, 0.16] |
| 9 Weight gain in pregnancy (Kg) Show forest plot | 1 | 200 | Mean Difference (IV, Fixed, 95% CI) | ‐2.06 [‐3.98, ‐0.14] |
| 10 Induction of labour Show forest plot | 1 | 159 | Risk Ratio (M‐H, Fixed, 95% CI) | 0.81 [0.61, 1.07] |
| 11 Perineal trauma Show forest plot | 2 | 308 | Risk Ratio (M‐H, Fixed, 95% CI) | 1.67 [0.22, 12.52] |
| 12 Stillbirth Show forest plot | 1 | 200 | Risk Ratio (M‐H, Fixed, 95% CI) | 0.92 [0.06, 14.55] |
| 13 Macrosomia Show forest plot | 2 | 308 | Risk Ratio (M‐H, Fixed, 95% CI) | 0.72 [0.23, 2.21] |
| 14 Birth trauma Show forest plot | 1 | 159 | Risk Ratio (M‐H, Fixed, 95% CI) | 0.0 [0.0, 0.0] |
| 15 Shoulder dystocia Show forest plot | 2 | 195 | Risk Ratio (M‐H, Fixed, 95% CI) | 0.99 [0.14, 6.89] |
| 16 Gestational age at birth (weeks) Show forest plot | 3 | 508 | Mean Difference (IV, Fixed, 95% CI) | 0.03 [‐0.22, 0.28] |
| 17 Preterm birth Show forest plot | 3 | 508 | Risk Ratio (M‐H, Fixed, 95% CI) | 1.59 [0.59, 4.29] |
| 18 5‐minute Apgar < 7 Show forest plot | 1 | 149 | Risk Ratio (M‐H, Fixed, 95% CI) | 0.0 [0.0, 0.0] |
| 19 Birthweight (g) Show forest plot | 2 | 349 | Mean Difference (IV, Fixed, 95% CI) | ‐209.13 [‐314.53, ‐103.73] |
| 20 Ponderal index Show forest plot | 1 | 200 | Mean Difference (IV, Fixed, 95% CI) | ‐0.09 [‐0.17, ‐0.01] |
| 21 Neonatal hypoglycaemia Show forest plot | 4 | 554 | Risk Ratio (M‐H, Fixed, 95% CI) | 0.86 [0.42, 1.77] |
| 22 Respiratory distress syndrome Show forest plot | 1 | 159 | Risk Ratio (M‐H, Fixed, 95% CI) | 0.51 [0.10, 2.69] |
| 23 Hyperbilirubinaemia Show forest plot | 2 | 205 | Risk Ratio (M‐H, Fixed, 95% CI) | 0.68 [0.37, 1.25] |
| 24 Admission to NICU Show forest plot | 2 | 349 | Risk Ratio (M‐H, Fixed, 95% CI) | 1.52 [0.65, 3.56] |
| Outcome or subgroup title | No. of studies | No. of participants | Statistical method | Effect size |
| 1 Caesarean section Show forest plot | 1 | 43 | Risk Ratio (M‐H, Fixed, 95% CI) | 0.95 [0.53, 1.70] |
| 2 Perinatal mortality Show forest plot | 1 | 43 | Risk Ratio (M‐H, Fixed, 95% CI) | 0.0 [0.0, 0.0] |
| 3 Large‐for‐gestational age Show forest plot | 1 | 43 | Risk Ratio (M‐H, Fixed, 95% CI) | 2.38 [0.54, 10.46] |
| 4 Need for additional pharmacotherapy Show forest plot | 1 | 43 | Risk Ratio (M‐H, Fixed, 95% CI) | 0.49 [0.19, 1.27] |
| 5 Maternal hypoglycaemia Show forest plot | 1 | 43 | Risk Ratio (M‐H, Fixed, 95% CI) | 0.0 [0.0, 0.0] |
| 6 Weight gain in pregnancy (Kg) Show forest plot | 1 | 43 | Mean Difference (IV, Fixed, 95% CI) | ‐0.60 [‐3.13, 1.93] |
| 7 Macrosomia Show forest plot | 1 | 43 | Risk Ratio (M‐H, Fixed, 95% CI) | 7.20 [0.41, 125.97] |
| 8 Small‐for‐gestational age Show forest plot | 1 | 43 | Risk Ratio (M‐H, Fixed, 95% CI) | 0.0 [0.0, 0.0] |
| 9 Birth trauma (not specified) Show forest plot | 1 | 43 | Risk Ratio (M‐H, Fixed, 95% CI) | 0.0 [0.0, 0.0] |
| 10 Gestational age at birth (weeks) Show forest plot | 1 | 43 | Mean Difference (IV, Fixed, 95% CI) | ‐0.10 [‐0.82, 0.62] |
| 11 Preterm birth Show forest plot | 1 | 43 | Risk Ratio (M‐H, Fixed, 95% CI) | 0.0 [0.0, 0.0] |
| 12 Birthweight (Kg) Show forest plot | 1 | 43 | Mean Difference (IV, Fixed, 95% CI) | 153.0 [‐123.52, 429.52] |
| 13 Neonatal hypoglycaemia Show forest plot | 1 | 43 | Risk Ratio (M‐H, Fixed, 95% CI) | 6.33 [0.87, 46.32] |
| 14 Respiratory distress syndrome Show forest plot | 1 | 43 | Risk Ratio (M‐H, Fixed, 95% CI) | 0.0 [0.0, 0.0] |