| 1 Hypertensive disorders of pregnancy Show forest plot | 3 | 508 | Risk Ratio (M‐H, Fixed, 95% CI) | 0.70 [0.38, 1.30] |
|
| 1.1 Pre‐eclampsia | 1 | 149 | Risk Ratio (M‐H, Fixed, 95% CI) | 0.66 [0.11, 3.82] |
| 1.2 Pregnancy‐induced hypertension | 2 | 359 | Risk Ratio (M‐H, Fixed, 95% CI) | 0.71 [0.37, 1.37] |
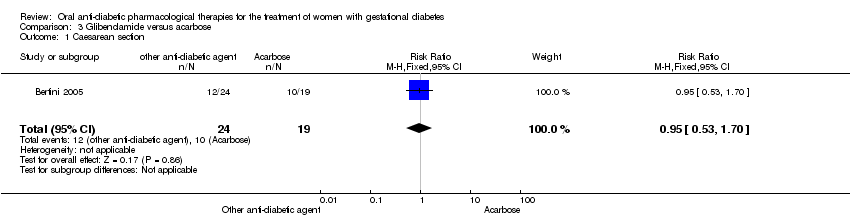
| 2 Caesarean section Show forest plot | 4 | 554 | Risk Ratio (M‐H, Random, 95% CI) | 1.20 [0.83, 1.72] |
|
| 2.1 Carpenter and Coustan criteria | 2 | 195 | Risk Ratio (M‐H, Random, 95% CI) | 2.36 [0.53, 10.52] |
| 2.2 National Diabetes Data Group criteria | 1 | 159 | Risk Ratio (M‐H, Random, 95% CI) | 1.12 [0.75, 1.68] |
| 2.3 World Health Organization (1999) | 1 | 200 | Risk Ratio (M‐H, Random, 95% CI) | 0.95 [0.78, 1.15] |
| 3 Perinatal mortality Show forest plot | 2 | 359 | Risk Ratio (M‐H, Fixed, 95% CI) | 0.92 [0.06, 14.55] |
|
| 4 Large‐for‐gestational age Show forest plot | 2 | 246 | Risk Ratio (M‐H, Random, 95% CI) | 0.67 [0.24, 1.83] |
|
| 4.1 Carpenter and Coustan criteria | 1 | 46 | Risk Ratio (M‐H, Random, 95% CI) | 1.25 [0.38, 4.07] |
| 4.2 World Health Organization (1999) | 1 | 200 | Risk Ratio (M‐H, Random, 95% CI) | 0.44 [0.21, 0.92] |
| 5 Death or serious morbidity composite Show forest plot | 1 | 159 | Risk Ratio (M‐H, Fixed, 95% CI) | 0.54 [0.31, 0.94] |
|
| 6 Use of additional pharmacotherapy Show forest plot | 5 | 660 | Risk Ratio (M‐H, Random, 95% CI) | 0.66 [0.28, 1.57] |
|
| 7 Maternal hypoglycaemia Show forest plot | 3 | 354 | Risk Ratio (M‐H, Fixed, 95% CI) | 0.89 [0.36, 2.19] |
|
| 8 Glycaemic control (mg/L; mmol/L) Show forest plot | 3 | | Std. Mean Difference (IV, Fixed, 95% CI) | Subtotals only |
|
| 8.1 Fasting blood glucose | 3 | 508 | Std. Mean Difference (IV, Fixed, 95% CI) | 0.19 [0.02, 0.37] |
| 8.2 Postprandial blood glucose | 3 | 508 | Std. Mean Difference (IV, Fixed, 95% CI) | 0.16 [‐0.01, 0.34] |
| 8.3 HbA1c | 1 | 200 | Std. Mean Difference (IV, Fixed, 95% CI) | ‐0.12 [‐0.39, 0.16] |
| 9 Weight gain in pregnancy (Kg) Show forest plot | 1 | 200 | Mean Difference (IV, Fixed, 95% CI) | ‐2.06 [‐3.98, ‐0.14] |
|
| 10 Induction of labour Show forest plot | 1 | 159 | Risk Ratio (M‐H, Fixed, 95% CI) | 0.81 [0.61, 1.07] |
|
| 11 Perineal trauma Show forest plot | 2 | 308 | Risk Ratio (M‐H, Fixed, 95% CI) | 1.67 [0.22, 12.52] |
|
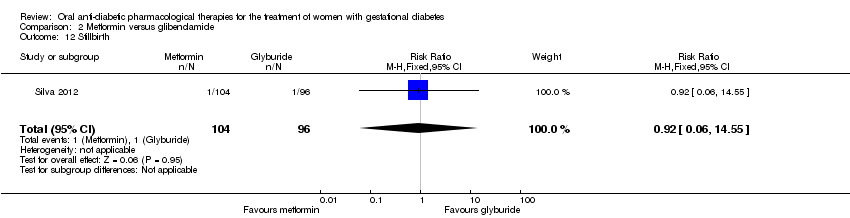
| 12 Stillbirth Show forest plot | 1 | 200 | Risk Ratio (M‐H, Fixed, 95% CI) | 0.92 [0.06, 14.55] |
|
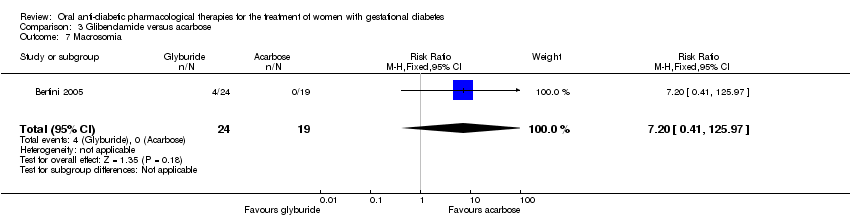
| 13 Macrosomia Show forest plot | 2 | 308 | Risk Ratio (M‐H, Fixed, 95% CI) | 0.72 [0.23, 2.21] |
|
| 14 Birth trauma Show forest plot | 1 | 159 | Risk Ratio (M‐H, Fixed, 95% CI) | 0.0 [0.0, 0.0] |
|
| 15 Shoulder dystocia Show forest plot | 2 | 195 | Risk Ratio (M‐H, Fixed, 95% CI) | 0.99 [0.14, 6.89] |
|
| 16 Gestational age at birth (weeks) Show forest plot | 3 | 508 | Mean Difference (IV, Fixed, 95% CI) | 0.03 [‐0.22, 0.28] |
|
| 17 Preterm birth Show forest plot | 3 | 508 | Risk Ratio (M‐H, Fixed, 95% CI) | 1.59 [0.59, 4.29] |
|
| 18 5‐minute Apgar < 7 Show forest plot | 1 | 149 | Risk Ratio (M‐H, Fixed, 95% CI) | 0.0 [0.0, 0.0] |
|
| 19 Birthweight (g) Show forest plot | 2 | 349 | Mean Difference (IV, Fixed, 95% CI) | ‐209.13 [‐314.53, ‐103.73] |
|
| 20 Ponderal index Show forest plot | 1 | 200 | Mean Difference (IV, Fixed, 95% CI) | ‐0.09 [‐0.17, ‐0.01] |
|
| 21 Neonatal hypoglycaemia Show forest plot | 4 | 554 | Risk Ratio (M‐H, Fixed, 95% CI) | 0.86 [0.42, 1.77] |
|
| 22 Respiratory distress syndrome Show forest plot | 1 | 159 | Risk Ratio (M‐H, Fixed, 95% CI) | 0.51 [0.10, 2.69] |
|
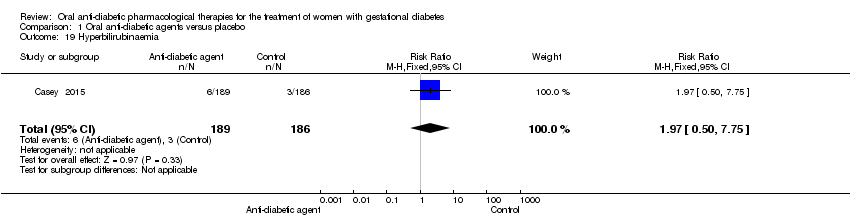
| 23 Hyperbilirubinaemia Show forest plot | 2 | 205 | Risk Ratio (M‐H, Fixed, 95% CI) | 0.68 [0.37, 1.25] |
|
| 24 Admission to NICU Show forest plot | 2 | 349 | Risk Ratio (M‐H, Fixed, 95% CI) | 1.52 [0.65, 3.56] |
|