Ácido ascórbico para el tratamiento de la enfermedad de Charcot‐Marie‐Tooth
Información
- DOI:
- https://doi.org/10.1002/14651858.CD011952Copiar DOI

- Base de datos:
-
- Cochrane Database of Systematic Reviews
- Versión publicada:
-
- 11 diciembre 2015see what's new
- Tipo:
-
- Intervention
- Etapa:
-
- Review
- Grupo Editorial Cochrane:
-
Grupo Cochrane de Neuromuscular
- Copyright:
-
- Copyright © 2015 The Cochrane Collaboration. Published by John Wiley & Sons, Ltd.
Cifras del artículo
Altmetric:
Citado por:
Autores
Contributions of authors
B Gess wrote the first and all subsequent drafts. P Young and D Pareyson commented on the first and subsequent drafts. MM Reilly commented on the penultimate draft. P Young, M Reilly and D Pareyson assisted B Gess in the selection of studies. B Gess and J Baets independently extracted data from the studies. P Young assisted in evaluation of data and studies and overlooked the progress of the review. M Reilly supported the progress of the review. P de Jonghe assisted J Baets in extraction of data. B Gess analysed the data. All six authors agreed to the final text.
Sources of support
Internal sources
-
University of Münster, Germany.
-
University of Antwerp, Belgium.
External sources
-
European Neuromuscular Centre, Netherlands.
Declarations of interest
MM Reilly and D Pareyson were involved as investigators in one of the trials included in this review (Pareyson 2011). B Gess and P Young have been involved in basic research projects on the function of ascorbic acid in the peripheral nervous system (Gess 2010; Gess 2011).
Acknowledgements
We thank the Trials Search Co‐ordinator of the Cochrane Neuromuscular Disease Group, Angela Gunn, who provided the searches. We also thank Ruth Brassington of the Cochrane Foundation Neuromuscular Study Group for her excellent assistance with formal requirements and her much appreciated draft of the plain language summary.
This project was supported by the National Institute for Health Research (NIHR) via Cochrane Infrastructure funding to the Cochrane Neuromuscular Disease Group. The views and opinions expressed therein are those of the authors and do not necessarily reflect those of the Systematic Reviews Programme, NIHR, National Health Service or the Department of Health. The Cochrane Neuromuscular Disease Group is also supported by the MRC Centre for Neuromuscular Diseases.
Version history
| Published | Title | Stage | Authors | Version |
| 2015 Dec 11 | Ascorbic acid for the treatment of Charcot‐Marie‐Tooth disease | Review | Burkhard Gess, Jonathan Baets, Peter De Jonghe, Mary M Reilly, Davide Pareyson, Peter Young | |
Differences between protocol and review
B Gess, J Baets, MM Reilly and D Pareyson joined the author team for this review. F Stögbauer and T Butterfass‐Bahloul, who were authors of Young 2008, withdrew.
We added additional sections to the Methods according to current Cochrane requirements.
The time points of 12 and 24 months for our meta‐analyses were chosen post hoc, because we found that trials used either a 12‐month or a 24‐month study duration and these time points are more suitable than 12 weeks, given the slow progression of the disease.
'Explicit inclusion criteria' relate to the GRADE criterion of indirectness. We removed it from the 'Risk of bias' assessment.
Notes
The review 'Treatment for Charcot Marie Tooth disease' (Young 2008) has been split into two separate reviews: Ascorbic acid for Charcot‐Marie‐Tooth disease and Treatments other than ascorbic acid for Charcot‐Marie‐Tooth disease. Treatments other than ascorbic acid for Charcot‐Marie‐Tooth disease will be published shortly.
Keywords
MeSH
Medical Subject Headings (MeSH) Keywords
Medical Subject Headings Check Words
Adult; Humans;
PICO
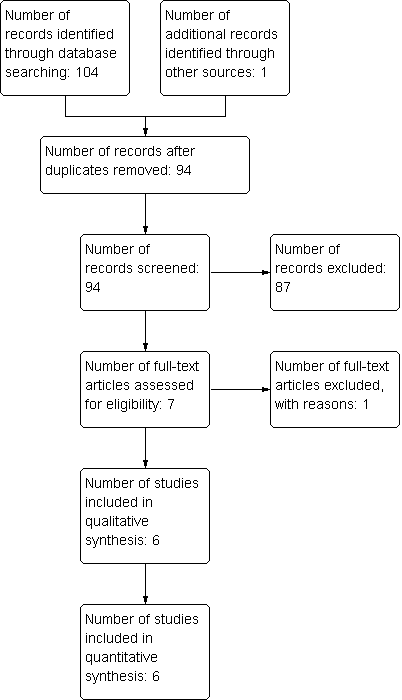
Study flow diagram.

Risk of bias summary: review authors' judgements about each risk of bias item for each included study. Green (+) = low risk of bias; yellow (?) = unclear risk of bias; red (‐) = high risk of bias.

Forest plot of comparison: 1 Ascorbic acid versus placebo 12 months, outcome: 1.1 CMTNS.
![Forest plot of comparison: 1 Ascorbic acid versus placebo 12 months (adults), outcome: 1.21 9‐hole peg test [s].](/es/cdsr/doi/10.1002/14651858.CD011952/media/CDSR/CD011952/image_n/nCD011952-AFig-FIG04.png)
Forest plot of comparison: 1 Ascorbic acid versus placebo 12 months (adults), outcome: 1.21 9‐hole peg test [s].
Forest plot of comparison: 2 Ascorbic acid versus placebo 24 months (adults), outcome: 2.1 Impairment ‐ CMTNS.
![Forest plot of comparison: 2 Ascorbic acid versus placebo 24 months (adults), outcome: 2.11 Impairment ‐ 9‐hole peg test [s].](/es/cdsr/doi/10.1002/14651858.CD011952/media/CDSR/CD011952/image_n/nCD011952-AFig-FIG06.png)
Forest plot of comparison: 2 Ascorbic acid versus placebo 24 months (adults), outcome: 2.11 Impairment ‐ 9‐hole peg test [s].
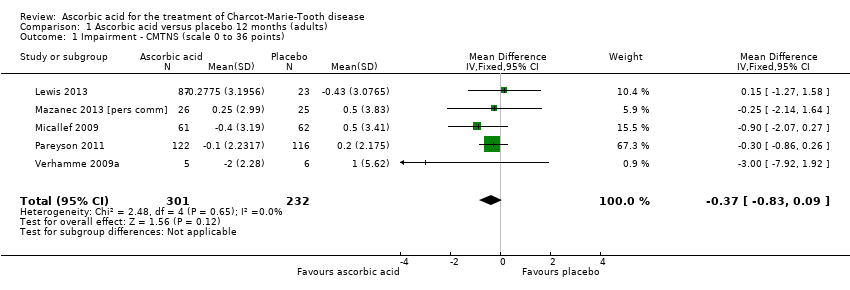
Comparison 1 Ascorbic acid versus placebo 12 months (adults), Outcome 1 Impairment ‐ CMTNS (scale 0 to 36 points).
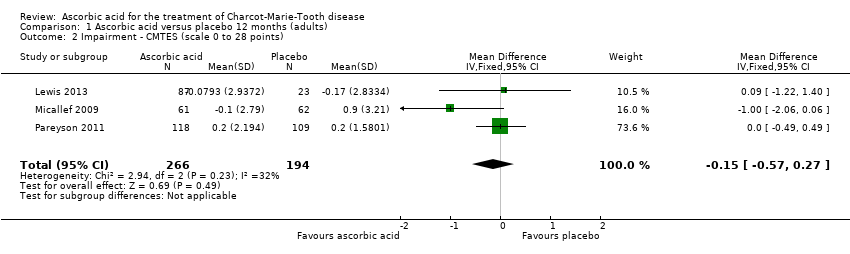
Comparison 1 Ascorbic acid versus placebo 12 months (adults), Outcome 2 Impairment ‐ CMTES (scale 0 to 28 points).

Comparison 1 Ascorbic acid versus placebo 12 months (adults), Outcome 3 Impairment ‐ NIS (scale ‐26 to 26 points).
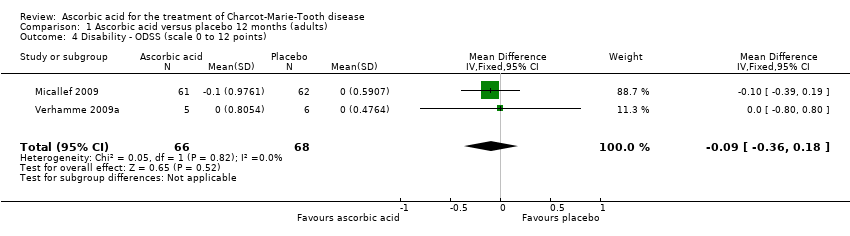
Comparison 1 Ascorbic acid versus placebo 12 months (adults), Outcome 4 Disability ‐ ODSS (scale 0 to 12 points).

Comparison 1 Ascorbic acid versus placebo 12 months (adults), Outcome 5 Disability ‐ ONLS (scale 0 to 12 points).
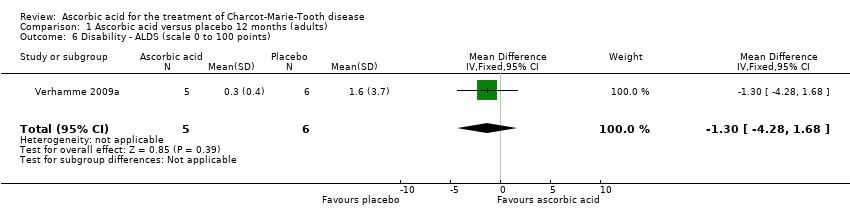
Comparison 1 Ascorbic acid versus placebo 12 months (adults), Outcome 6 Disability ‐ ALDS (scale 0 to 100 points).

Comparison 1 Ascorbic acid versus placebo 12 months (adults), Outcome 7 CMAP, ulnar nerve (abductor digiti minimi).

Comparison 1 Ascorbic acid versus placebo 12 months (adults), Outcome 8 CMAP, median nerve (abductor pollicis brevis).

Comparison 1 Ascorbic acid versus placebo 12 months (adults), Outcome 9 CMAP summatory from ulnar, median and peroneal nerves.

Comparison 1 Ascorbic acid versus placebo 12 months (adults), Outcome 10 Sensation ‐ INCAT Sensory Sum score (scale 0 to 20 points).
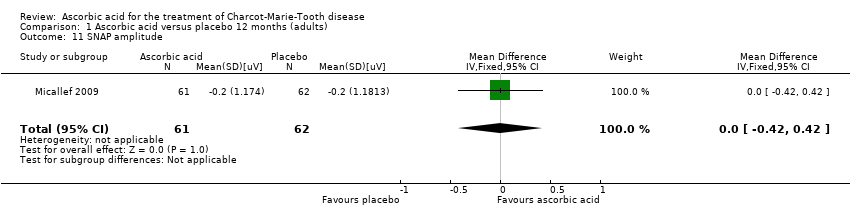
Comparison 1 Ascorbic acid versus placebo 12 months (adults), Outcome 11 SNAP amplitude.
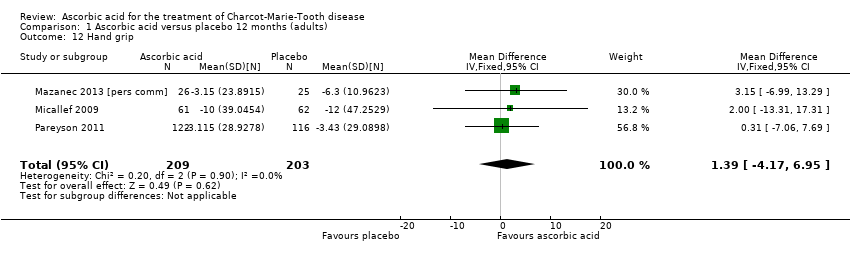
Comparison 1 Ascorbic acid versus placebo 12 months (adults), Outcome 12 Hand grip.

Comparison 1 Ascorbic acid versus placebo 12 months (adults), Outcome 13 Three‐point pinch.
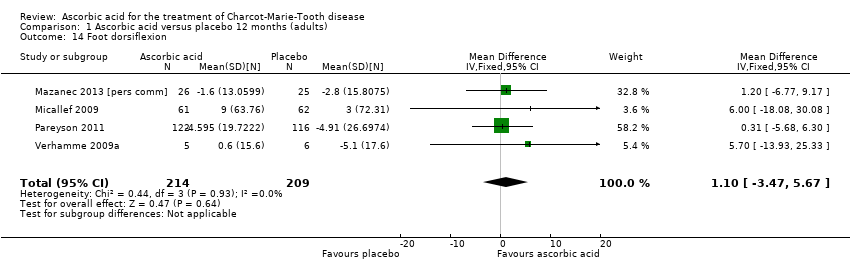
Comparison 1 Ascorbic acid versus placebo 12 months (adults), Outcome 14 Foot dorsiflexion.

Comparison 1 Ascorbic acid versus placebo 12 months (adults), Outcome 15 Quality of life ‐ SF36 ‐ physical functioning.

Comparison 1 Ascorbic acid versus placebo 12 months (adults), Outcome 16 Quality of life ‐ SF36 ‐ bodily pain.

Comparison 1 Ascorbic acid versus placebo 12 months (adults), Outcome 17 Quality of life ‐ SF36 ‐ energy.

Comparison 1 Ascorbic acid versus placebo 12 months (adults), Outcome 18 Quality of life ‐ SF36 ‐ psychological.
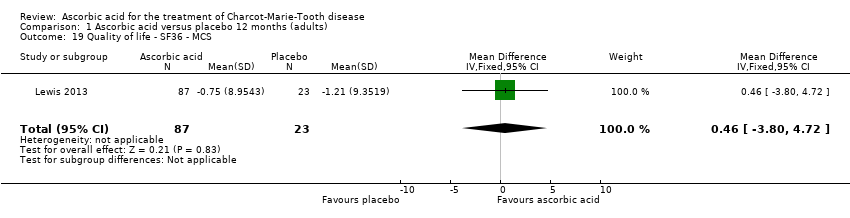
Comparison 1 Ascorbic acid versus placebo 12 months (adults), Outcome 19 Quality of life ‐ SF36 ‐ MCS.
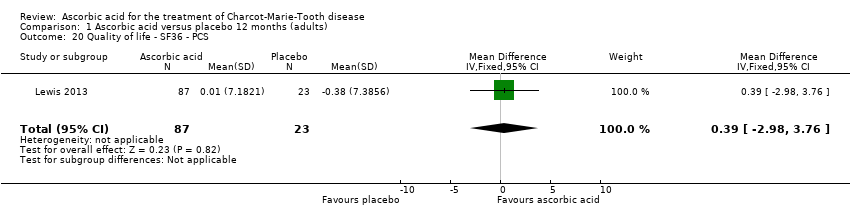
Comparison 1 Ascorbic acid versus placebo 12 months (adults), Outcome 20 Quality of life ‐ SF36 ‐ PCS.
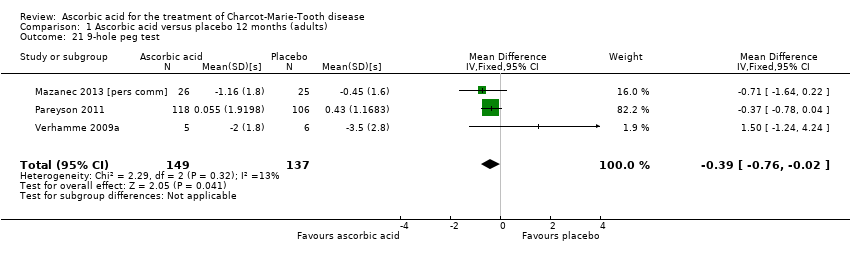
Comparison 1 Ascorbic acid versus placebo 12 months (adults), Outcome 21 9‐hole peg test.
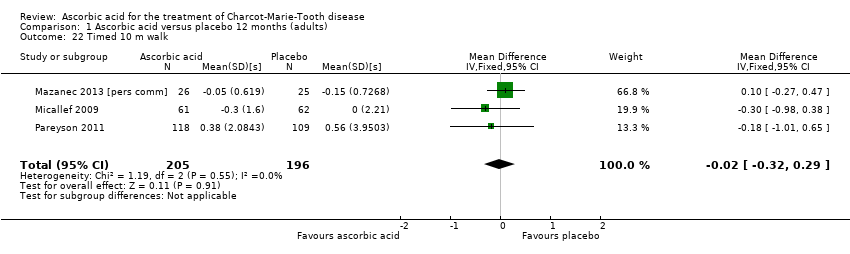
Comparison 1 Ascorbic acid versus placebo 12 months (adults), Outcome 22 Timed 10 m walk.
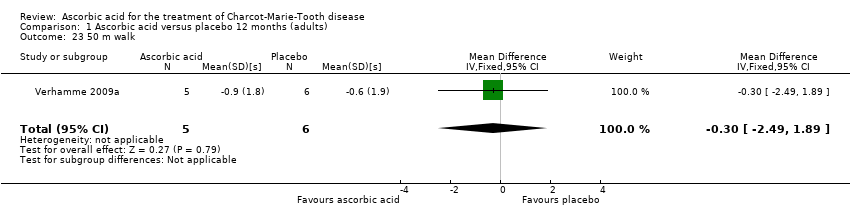
Comparison 1 Ascorbic acid versus placebo 12 months (adults), Outcome 23 50 m walk.

Comparison 2 Ascorbic acid versus placebo 24 months (adults), Outcome 1 Impairment ‐ CMTNS (scale 0 to 36 points).

Comparison 2 Ascorbic acid versus placebo 24 months (adults), Outcome 2 Impairment ‐ CMTES (scale 0 to 28 points).

Comparison 2 Ascorbic acid versus placebo 24 months (adults), Outcome 3 Disability ‐ ONLS (scale 0 to 12 points).
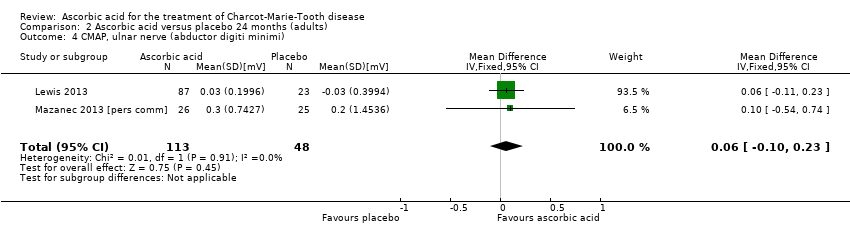
Comparison 2 Ascorbic acid versus placebo 24 months (adults), Outcome 4 CMAP, ulnar nerve (abductor digiti minimi).

Comparison 2 Ascorbic acid versus placebo 24 months (adults), Outcome 5 Hand grip.

Comparison 2 Ascorbic acid versus placebo 24 months (adults), Outcome 6 Three‐point pinch.

Comparison 2 Ascorbic acid versus placebo 24 months (adults), Outcome 7 Foot dorsiflexion.

Comparison 2 Ascorbic acid versus placebo 24 months (adults), Outcome 8 Quality of life ‐ SF36 ‐ physical functioning.
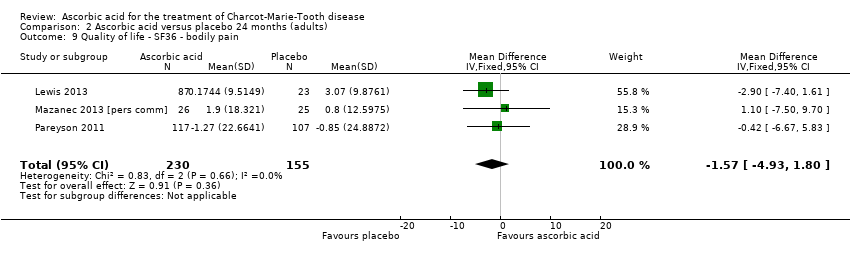
Comparison 2 Ascorbic acid versus placebo 24 months (adults), Outcome 9 Quality of life ‐ SF36 ‐ bodily pain.

Comparison 2 Ascorbic acid versus placebo 24 months (adults), Outcome 10 Quality of life ‐ SF36 ‐ energy.

Comparison 2 Ascorbic acid versus placebo 24 months (adults), Outcome 11 9‐hole peg test.
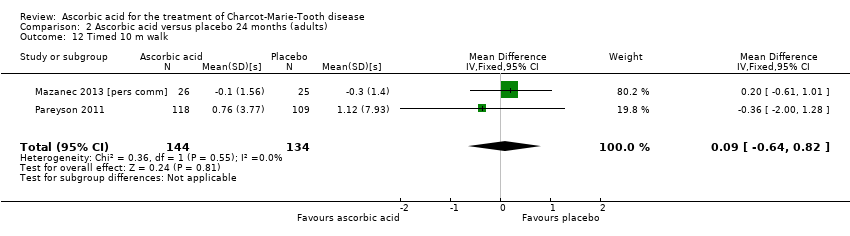
Comparison 2 Ascorbic acid versus placebo 24 months (adults), Outcome 12 Timed 10 m walk.
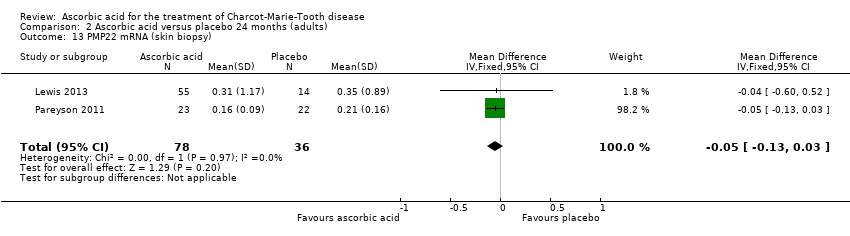
Comparison 2 Ascorbic acid versus placebo 24 months (adults), Outcome 13 PMP22 mRNA (skin biopsy).
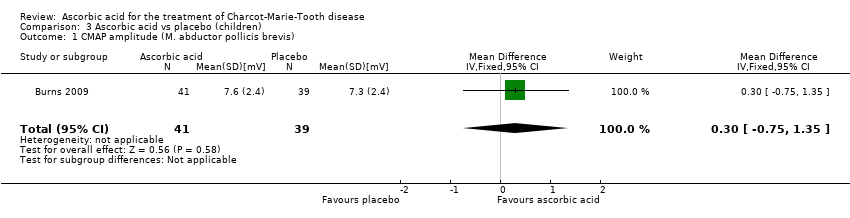
Comparison 3 Ascorbic acid vs placebo (children), Outcome 1 CMAP amplitude (M. abductor pollicis brevis).
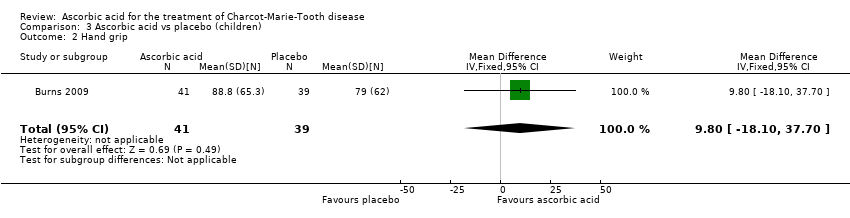
Comparison 3 Ascorbic acid vs placebo (children), Outcome 2 Hand grip.
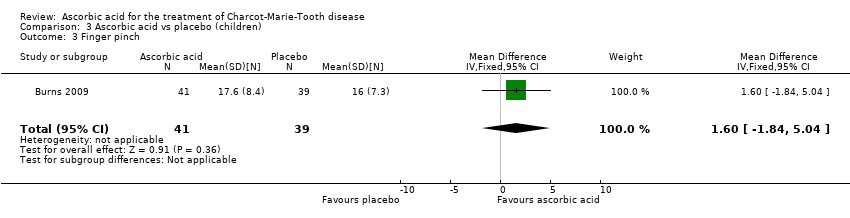
Comparison 3 Ascorbic acid vs placebo (children), Outcome 3 Finger pinch.
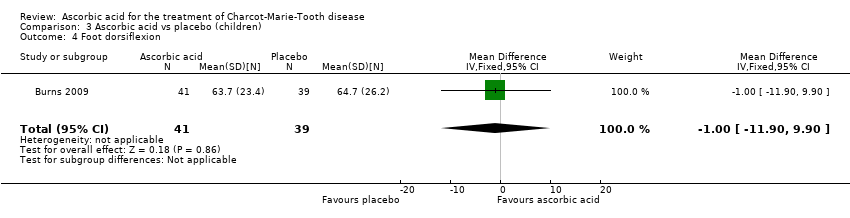
Comparison 3 Ascorbic acid vs placebo (children), Outcome 4 Foot dorsiflexion.
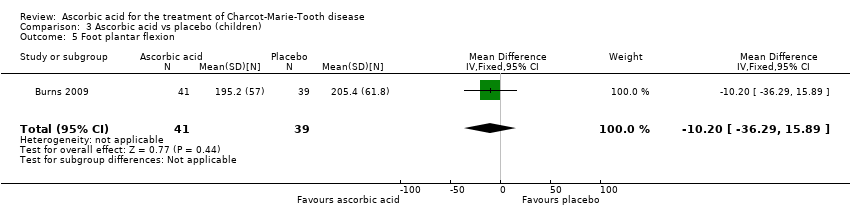
Comparison 3 Ascorbic acid vs placebo (children), Outcome 5 Foot plantar flexion.

Comparison 3 Ascorbic acid vs placebo (children), Outcome 6 Median nerve motor conduction velocity.
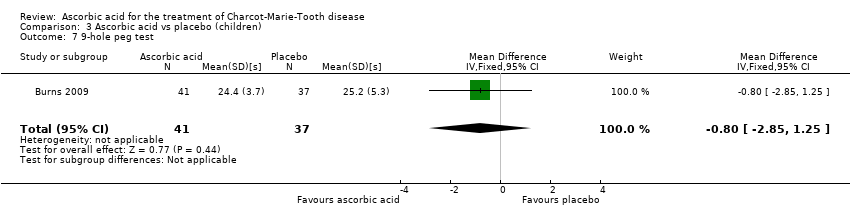
Comparison 3 Ascorbic acid vs placebo (children), Outcome 7 9‐hole peg test.
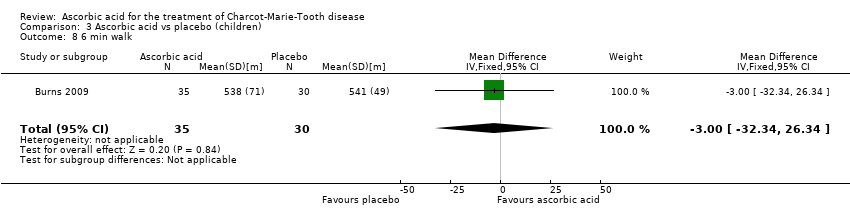
Comparison 3 Ascorbic acid vs placebo (children), Outcome 8 6 min walk.
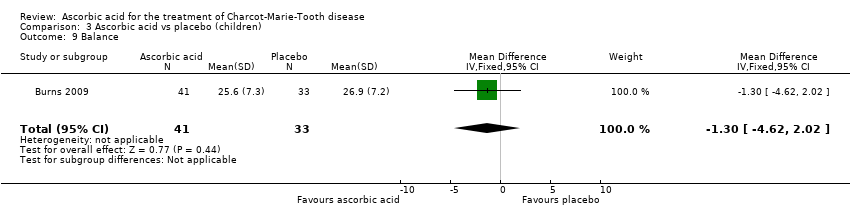
Comparison 3 Ascorbic acid vs placebo (children), Outcome 9 Balance.

Comparison 3 Ascorbic acid vs placebo (children), Outcome 10 Agility.
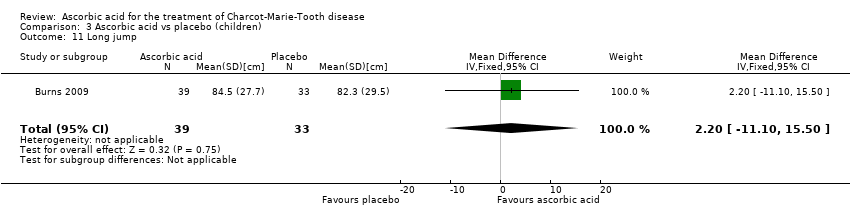
Comparison 3 Ascorbic acid vs placebo (children), Outcome 11 Long jump.

Comparison 3 Ascorbic acid vs placebo (children), Outcome 12 Speed.

Comparison 3 Ascorbic acid vs placebo (children), Outcome 13 Cadence.
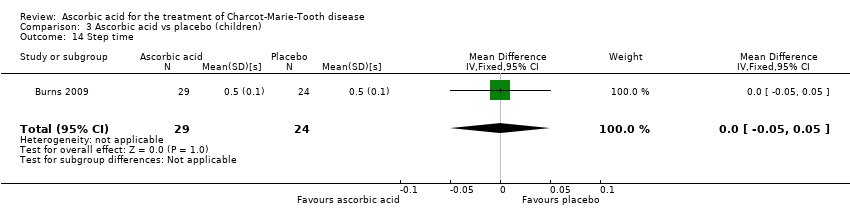
Comparison 3 Ascorbic acid vs placebo (children), Outcome 14 Step time.
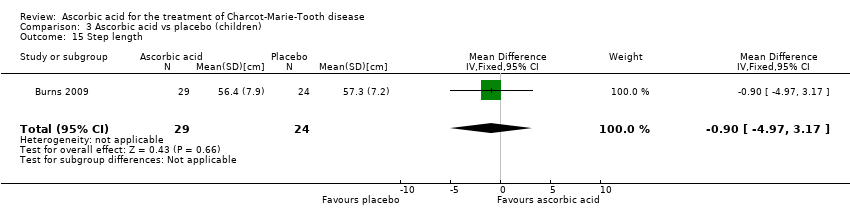
Comparison 3 Ascorbic acid vs placebo (children), Outcome 15 Step length.

Comparison 3 Ascorbic acid vs placebo (children), Outcome 16 Stride length.
| Ascorbic acid treatment compared with placebo for CMT1A in adults | ||||||
| Participants or population: adults with CMT1A Intervention: oral ascorbic acid (1 g to 4 g/day) Comparison: placebo | ||||||
| Outcomes | Illustrative comparative risks* (95% CI) | Relative effect | No of participants | Quality of the evidence | Comments | |
| Assumed risk | Corresponding risk | |||||
| Placebo | Ascorbic acid | |||||
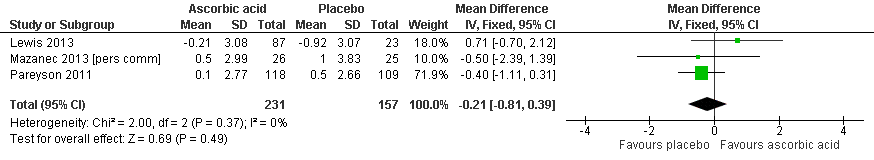
| Impairment ‐ change in CMTNS at 24 months (0 to 36 points) | The mean change in CMTNS ranged across control groups from ‐0.92 to 1 point | The mean change in CMTNS in the intervention groups was 0.21 lower (0.81 lower to 0.39 higher) | ‐0.21 (‐0.81 to 0.39) | 388 (3) | ⊕⊕⊕⊕ | |
| Impairment ‐ change in CMTES at 24 months (0 to 28 points) | The mean change in CMTES ranged across control groups from ‐0.64 to 0.5 point | The mean change in CMTES in the intervention groups was 0.12 lower (0.67 lower to 0.42 higher) | ‐0.12 (‐0.67 to 0.42) | 337 (2) | ⊕⊕⊕⊝ | |
| Change in timed 10‐m walk at 12 months (seconds (s)) | The mean change in timed 10‐m walk ranged across control groups from ‐0.15 to 0.56 s | The mean change in timed 10‐m walk in the intervention groups was 0.02 lower (0.32 lower to 0.29 lower) | ‐0.02 (‐0.32 to 0.29) | 401 (3) | ⊕⊕⊕⊕ | |
| Change in foot dorsiflexion at 12 months (N) | The mean change in foot dorsiflexion force ranged across control groups from | The mean change in foot dorsiflexion force in the intervention groups was 1.1 higher (3.47 lower to 5.67 higher) | 1.1 (‐3.47 to 5.67) | 423 (4) | ⊕⊕⊕⊕ | |
| Change in 9‐hole peg test (HPT) at 12 months (seconds) | The mean change in 9‐HPT ranged across control groups from | The mean change in 9‐HPT in the intervention groups was 0.39 lower (0.76 lower to 0.02 lower) | ‐0.39 (‐0.76 to ‐0.02) | 286 | ⊕⊕⊕⊝ | |
| Serious adverse events (SAE; %) | The relative abundance of SAE was 12% in the placebo group ((number of SAE/number of participants)*100) | The relative abundance of SAE was 11.7% in the intervention groups ((number of SAE/number of participants)*100) | Not estimable | 702 (6, including 1 study in children) | ⊕⊕⊕⊕ | |
| *The assumed risk is based on the mean change or the range of mean change) across control groups in included studies.. The corresponding risk (and its 95% confidence interval) is based on the assumed risk in the comparison group and the relative effect of the intervention (and its 95% CI). | ||||||
| GRADE Working Group grades of evidence | ||||||
| 1 Evidence downgraded because of number of studies and participants, which was lower than for other outcomes. Further research may thus have an impact on our confidence in the estimate of effect and may change the estimate. | ||||||
| Outcome or subgroup title | No. of studies | No. of participants | Statistical method | Effect size |
| 1 Impairment ‐ CMTNS (scale 0 to 36 points) Show forest plot | 5 | 533 | Mean Difference (IV, Fixed, 95% CI) | ‐0.37 [‐0.83, 0.09] |
| 2 Impairment ‐ CMTES (scale 0 to 28 points) Show forest plot | 3 | 460 | Mean Difference (IV, Fixed, 95% CI) | ‐0.15 [‐0.57, 0.27] |
| 3 Impairment ‐ NIS (scale ‐26 to 26 points) Show forest plot | 1 | 110 | Mean Difference (IV, Fixed, 95% CI) | 1.91 [‐2.24, 6.06] |
| 4 Disability ‐ ODSS (scale 0 to 12 points) Show forest plot | 2 | 134 | Mean Difference (IV, Fixed, 95% CI) | ‐0.09 [‐0.36, 0.18] |
| 5 Disability ‐ ONLS (scale 0 to 12 points) Show forest plot | 2 | 289 | Mean Difference (IV, Fixed, 95% CI) | 0.07 [‐0.02, 0.17] |
| 6 Disability ‐ ALDS (scale 0 to 100 points) Show forest plot | 1 | 11 | Mean Difference (IV, Fixed, 95% CI) | ‐1.3 [‐4.28, 1.68] |
| 7 CMAP, ulnar nerve (abductor digiti minimi) Show forest plot | 2 | 161 | Mean Difference (IV, Fixed, 95% CI) | 0.13 [‐0.34, 0.59] |
| 8 CMAP, median nerve (abductor pollicis brevis) Show forest plot | 1 | 11 | Mean Difference (IV, Fixed, 95% CI) | ‐0.18 [‐1.19, 0.83] |
| 9 CMAP summatory from ulnar, median and peroneal nerves Show forest plot | 1 | 217 | Mean Difference (IV, Fixed, 95% CI) | 0.23 [‐0.48, 0.94] |
| 10 Sensation ‐ INCAT Sensory Sum score (scale 0 to 20 points) Show forest plot | 1 | 10 | Mean Difference (IV, Fixed, 95% CI) | ‐2.0 [‐5.53, 1.53] |
| 11 SNAP amplitude Show forest plot | 1 | 123 | Mean Difference (IV, Fixed, 95% CI) | 0.0 [‐0.42, 0.42] |
| 12 Hand grip Show forest plot | 3 | 412 | Mean Difference (IV, Fixed, 95% CI) | 1.39 [‐4.17, 6.95] |
| 13 Three‐point pinch Show forest plot | 3 | 300 | Mean Difference (IV, Fixed, 95% CI) | 0.60 [‐1.53, 2.73] |
| 14 Foot dorsiflexion Show forest plot | 4 | 423 | Mean Difference (IV, Fixed, 95% CI) | 1.10 [‐3.47, 5.67] |
| 15 Quality of life ‐ SF36 ‐ physical functioning Show forest plot | 4 | 522 | Mean Difference (IV, Fixed, 95% CI) | ‐0.05 [‐1.32, 1.22] |
| 16 Quality of life ‐ SF36 ‐ bodily pain Show forest plot | 3 | 401 | Mean Difference (IV, Fixed, 95% CI) | ‐0.53 [‐2.69, 1.62] |
| 17 Quality of life ‐ SF36 ‐ energy Show forest plot | 2 | 291 | Mean Difference (IV, Fixed, 95% CI) | 0.45 [‐2.84, 3.74] |
| 18 Quality of life ‐ SF36 ‐ psychological Show forest plot | 1 | 123 | Mean Difference (IV, Fixed, 95% CI) | 0.90 [‐2.65, 4.45] |
| 19 Quality of life ‐ SF36 ‐ MCS Show forest plot | 1 | 110 | Mean Difference (IV, Fixed, 95% CI) | 0.46 [‐3.80, 4.72] |
| 20 Quality of life ‐ SF36 ‐ PCS Show forest plot | 1 | 110 | Mean Difference (IV, Fixed, 95% CI) | 0.39 [‐2.98, 3.76] |
| 21 9‐hole peg test Show forest plot | 3 | 286 | Mean Difference (IV, Fixed, 95% CI) | ‐0.39 [‐0.76, ‐0.02] |
| 22 Timed 10 m walk Show forest plot | 3 | 401 | Mean Difference (IV, Fixed, 95% CI) | ‐0.02 [‐0.32, 0.29] |
| 23 50 m walk Show forest plot | 1 | 11 | Mean Difference (IV, Fixed, 95% CI) | ‐0.30 [‐2.49, 1.89] |
| Outcome or subgroup title | No. of studies | No. of participants | Statistical method | Effect size |
| 1 Impairment ‐ CMTNS (scale 0 to 36 points) Show forest plot | 3 | 388 | Mean Difference (IV, Fixed, 95% CI) | ‐0.21 [‐0.81, 0.39] |
| 2 Impairment ‐ CMTES (scale 0 to 28 points) Show forest plot | 2 | 337 | Mean Difference (IV, Fixed, 95% CI) | ‐0.12 [‐0.67, 0.42] |
| 3 Disability ‐ ONLS (scale 0 to 12 points) Show forest plot | 2 | 276 | Mean Difference (IV, Fixed, 95% CI) | 0.14 [‐0.05, 0.34] |
| 4 CMAP, ulnar nerve (abductor digiti minimi) Show forest plot | 2 | 161 | Mean Difference (IV, Fixed, 95% CI) | 0.06 [‐0.10, 0.23] |
| 5 Hand grip Show forest plot | 2 | 186 | Mean Difference (IV, Fixed, 95% CI) | 1.25 [‐3.86, 6.37] |
| 6 Three‐point pinch Show forest plot | 2 | 276 | Mean Difference (IV, Fixed, 95% CI) | 0.73 [‐3.62, 5.08] |
| 7 Foot dorsiflexion Show forest plot | 2 | 278 | Mean Difference (IV, Fixed, 95% CI) | 0.77 [‐7.21, 8.76] |
| 8 Quality of life ‐ SF36 ‐ physical functioning Show forest plot | 3 | 382 | Mean Difference (IV, Fixed, 95% CI) | ‐0.07 [‐2.41, 2.26] |
| 9 Quality of life ‐ SF36 ‐ bodily pain Show forest plot | 3 | 385 | Mean Difference (IV, Fixed, 95% CI) | ‐1.57 [‐4.93, 1.80] |
| 10 Quality of life ‐ SF36 ‐ energy Show forest plot | 2 | 267 | Mean Difference (IV, Fixed, 95% CI) | 0.71 [‐3.35, 4.77] |
| 11 9‐hole peg test Show forest plot | 2 | 275 | Mean Difference (IV, Fixed, 95% CI) | ‐1.16 [‐1.96, ‐0.37] |
| 12 Timed 10 m walk Show forest plot | 2 | 278 | Mean Difference (IV, Fixed, 95% CI) | 0.09 [‐0.64, 0.82] |
| 13 PMP22 mRNA (skin biopsy) Show forest plot | 2 | 114 | Mean Difference (IV, Fixed, 95% CI) | ‐0.05 [‐0.13, 0.03] |
| Outcome or subgroup title | No. of studies | No. of participants | Statistical method | Effect size |
| 1 CMAP amplitude (M. abductor pollicis brevis) Show forest plot | 1 | 80 | Mean Difference (IV, Fixed, 95% CI) | 0.30 [‐0.75, 1.35] |
| 2 Hand grip Show forest plot | 1 | 80 | Mean Difference (IV, Fixed, 95% CI) | 9.80 [‐18.10, 37.70] |
| 3 Finger pinch Show forest plot | 1 | 80 | Mean Difference (IV, Fixed, 95% CI) | 1.60 [‐1.84, 5.04] |
| 4 Foot dorsiflexion Show forest plot | 1 | 80 | Mean Difference (IV, Fixed, 95% CI) | ‐1.0 [‐11.90, 9.90] |
| 5 Foot plantar flexion Show forest plot | 1 | 80 | Mean Difference (IV, Fixed, 95% CI) | ‐10.20 [‐36.29, 15.89] |
| 6 Median nerve motor conduction velocity Show forest plot | 1 | 80 | Mean Difference (IV, Fixed, 95% CI) | 2.0 [‐0.89, 4.89] |
| 7 9‐hole peg test Show forest plot | 1 | 78 | Mean Difference (IV, Fixed, 95% CI) | ‐0.80 [‐2.85, 1.25] |
| 8 6 min walk Show forest plot | 1 | 65 | Mean Difference (IV, Fixed, 95% CI) | ‐3.0 [‐32.34, 26.34] |
| 9 Balance Show forest plot | 1 | 74 | Mean Difference (IV, Fixed, 95% CI) | ‐1.30 [‐4.62, 2.02] |
| 10 Agility Show forest plot | 1 | 72 | Mean Difference (IV, Fixed, 95% CI) | ‐1.70 [‐5.43, 2.03] |
| 11 Long jump Show forest plot | 1 | 72 | Mean Difference (IV, Fixed, 95% CI) | 2.20 [‐11.10, 15.50] |
| 12 Speed Show forest plot | 1 | 53 | Mean Difference (IV, Fixed, 95% CI) | ‐0.20 [‐9.33, 8.93] |
| 13 Cadence Show forest plot | 1 | 53 | Mean Difference (IV, Fixed, 95% CI) | 0.80 [‐6.54, 8.14] |
| 14 Step time Show forest plot | 1 | 53 | Mean Difference (IV, Fixed, 95% CI) | 0.0 [‐0.05, 0.05] |
| 15 Step length Show forest plot | 1 | 53 | Mean Difference (IV, Fixed, 95% CI) | ‐0.90 [‐4.97, 3.17] |
| 16 Stride length Show forest plot | 1 | 53 | Mean Difference (IV, Fixed, 95% CI) | ‐1.80 [‐9.58, 5.98] |