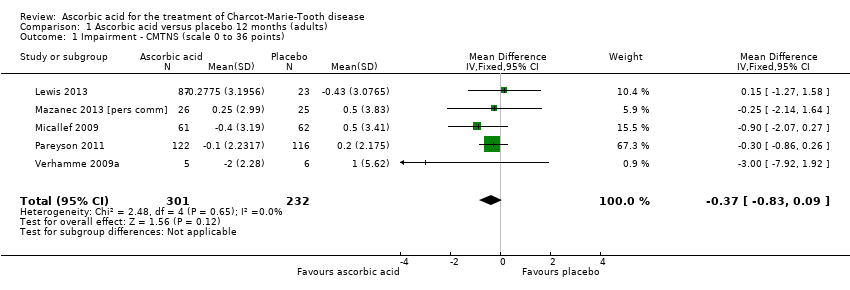
| 1 Impairment ‐ CMTNS (scale 0 to 36 points) Show forest plot | 5 | 533 | Mean Difference (IV, Fixed, 95% CI) | ‐0.37 [‐0.83, 0.09] |
|
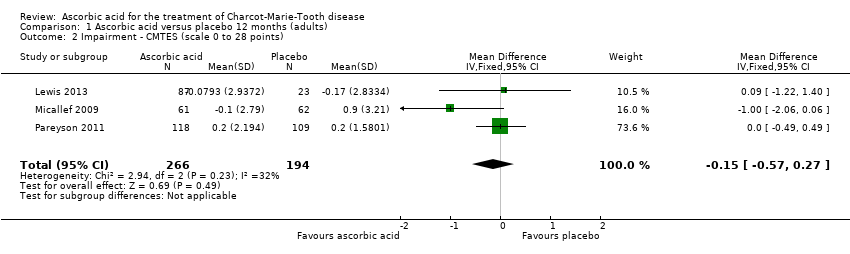
| 2 Impairment ‐ CMTES (scale 0 to 28 points) Show forest plot | 3 | 460 | Mean Difference (IV, Fixed, 95% CI) | ‐0.15 [‐0.57, 0.27] |
|
| 3 Impairment ‐ NIS (scale ‐26 to 26 points) Show forest plot | 1 | 110 | Mean Difference (IV, Fixed, 95% CI) | 1.91 [‐2.24, 6.06] |
|
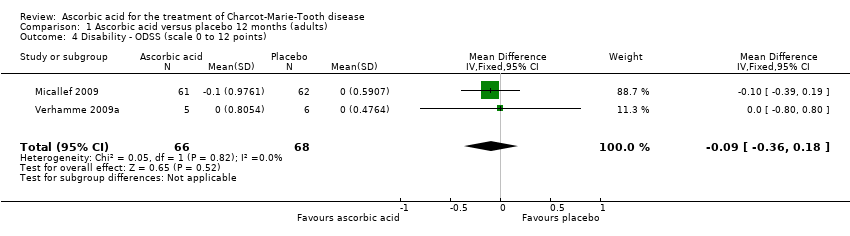
| 4 Disability ‐ ODSS (scale 0 to 12 points) Show forest plot | 2 | 134 | Mean Difference (IV, Fixed, 95% CI) | ‐0.09 [‐0.36, 0.18] |
|
| 5 Disability ‐ ONLS (scale 0 to 12 points) Show forest plot | 2 | 289 | Mean Difference (IV, Fixed, 95% CI) | 0.07 [‐0.02, 0.17] |
|
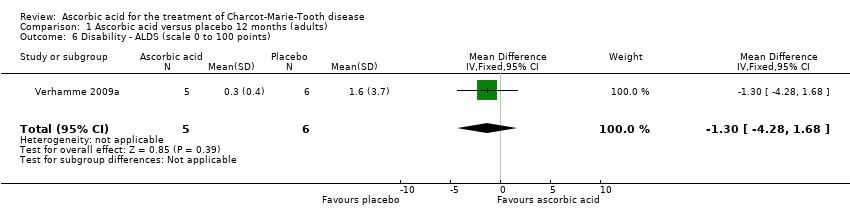
| 6 Disability ‐ ALDS (scale 0 to 100 points) Show forest plot | 1 | 11 | Mean Difference (IV, Fixed, 95% CI) | ‐1.3 [‐4.28, 1.68] |
|
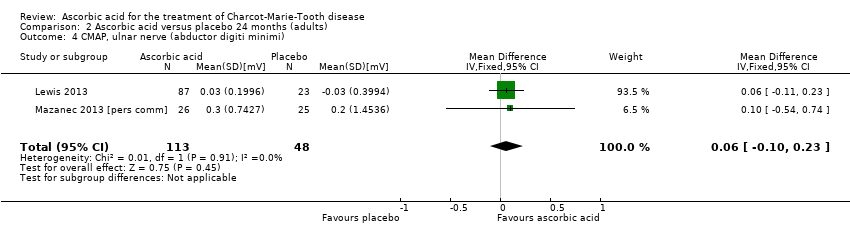
| 7 CMAP, ulnar nerve (abductor digiti minimi) Show forest plot | 2 | 161 | Mean Difference (IV, Fixed, 95% CI) | 0.13 [‐0.34, 0.59] |
|
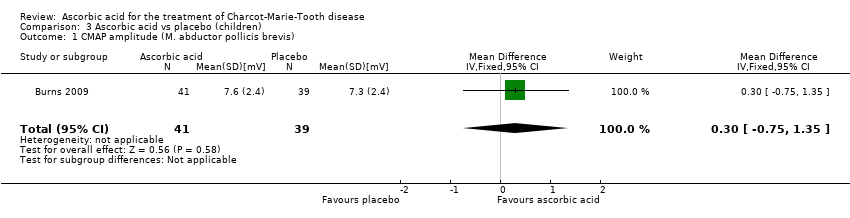
| 8 CMAP, median nerve (abductor pollicis brevis) Show forest plot | 1 | 11 | Mean Difference (IV, Fixed, 95% CI) | ‐0.18 [‐1.19, 0.83] |
|
| 9 CMAP summatory from ulnar, median and peroneal nerves Show forest plot | 1 | 217 | Mean Difference (IV, Fixed, 95% CI) | 0.23 [‐0.48, 0.94] |
|
| 10 Sensation ‐ INCAT Sensory Sum score (scale 0 to 20 points) Show forest plot | 1 | 10 | Mean Difference (IV, Fixed, 95% CI) | ‐2.0 [‐5.53, 1.53] |
|
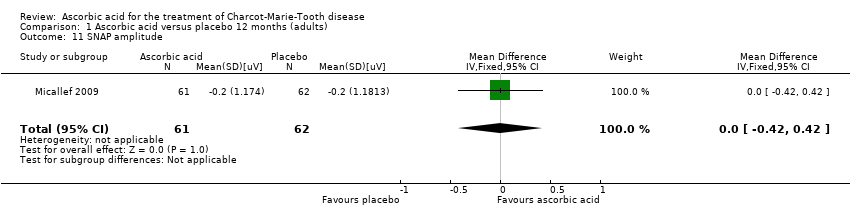
| 11 SNAP amplitude Show forest plot | 1 | 123 | Mean Difference (IV, Fixed, 95% CI) | 0.0 [‐0.42, 0.42] |
|
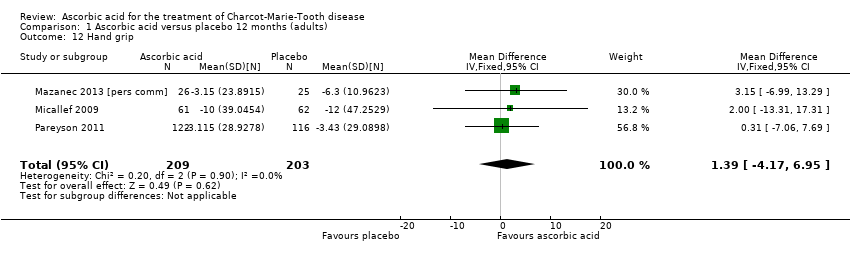
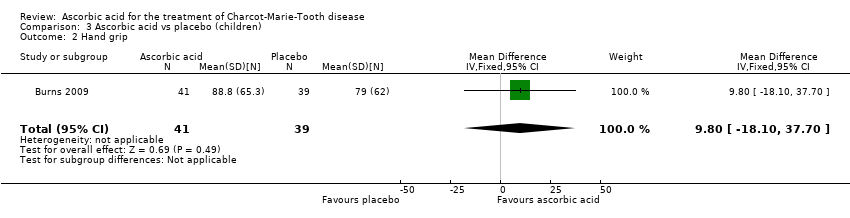
| 12 Hand grip Show forest plot | 3 | 412 | Mean Difference (IV, Fixed, 95% CI) | 1.39 [‐4.17, 6.95] |
|
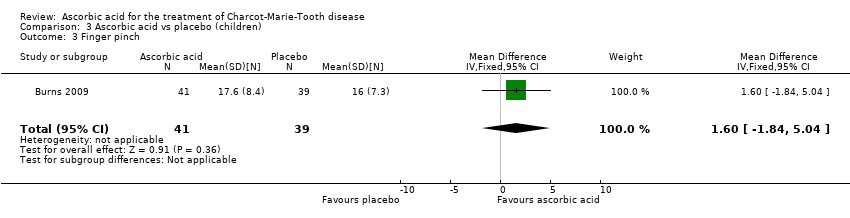
| 13 Three‐point pinch Show forest plot | 3 | 300 | Mean Difference (IV, Fixed, 95% CI) | 0.60 [‐1.53, 2.73] |
|
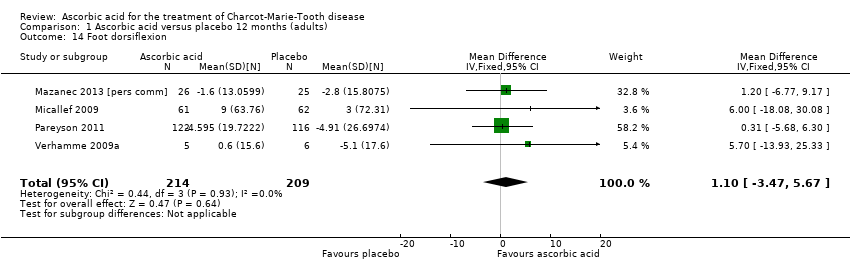
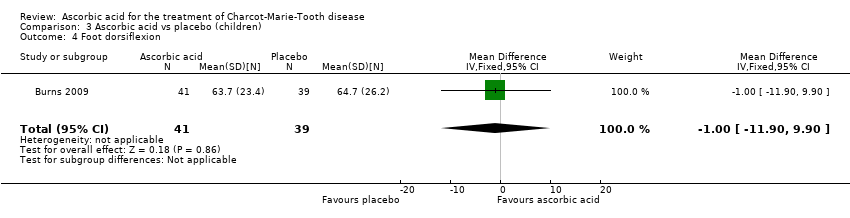
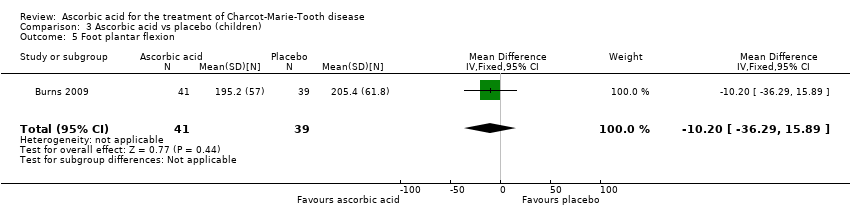
| 14 Foot dorsiflexion Show forest plot | 4 | 423 | Mean Difference (IV, Fixed, 95% CI) | 1.10 [‐3.47, 5.67] |
|
| 15 Quality of life ‐ SF36 ‐ physical functioning Show forest plot | 4 | 522 | Mean Difference (IV, Fixed, 95% CI) | ‐0.05 [‐1.32, 1.22] |
|
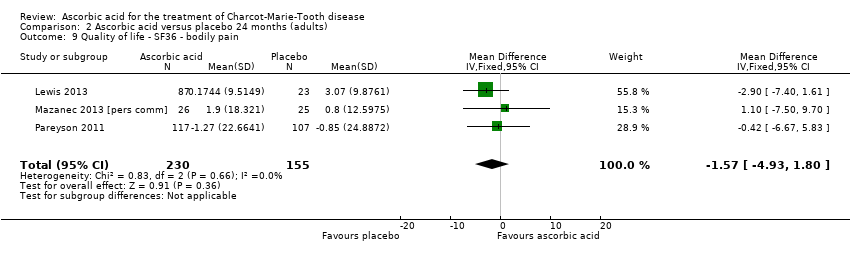
| 16 Quality of life ‐ SF36 ‐ bodily pain Show forest plot | 3 | 401 | Mean Difference (IV, Fixed, 95% CI) | ‐0.53 [‐2.69, 1.62] |
|
| 17 Quality of life ‐ SF36 ‐ energy Show forest plot | 2 | 291 | Mean Difference (IV, Fixed, 95% CI) | 0.45 [‐2.84, 3.74] |
|
| 18 Quality of life ‐ SF36 ‐ psychological Show forest plot | 1 | 123 | Mean Difference (IV, Fixed, 95% CI) | 0.90 [‐2.65, 4.45] |
|
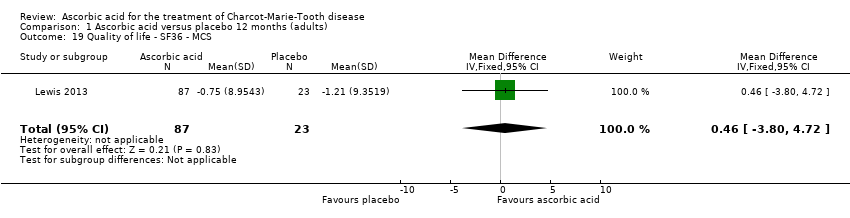
| 19 Quality of life ‐ SF36 ‐ MCS Show forest plot | 1 | 110 | Mean Difference (IV, Fixed, 95% CI) | 0.46 [‐3.80, 4.72] |
|
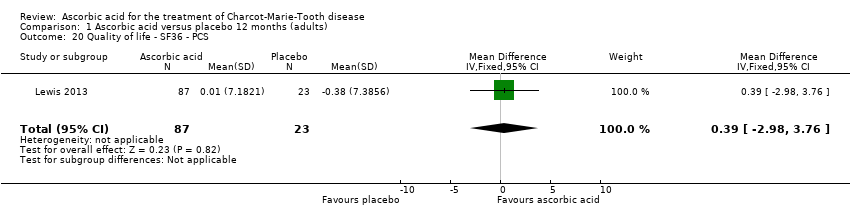
| 20 Quality of life ‐ SF36 ‐ PCS Show forest plot | 1 | 110 | Mean Difference (IV, Fixed, 95% CI) | 0.39 [‐2.98, 3.76] |
|
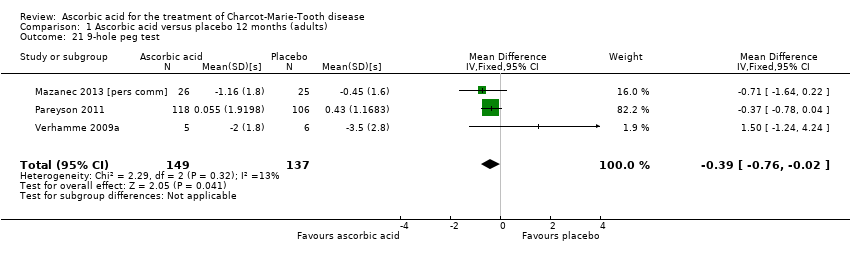
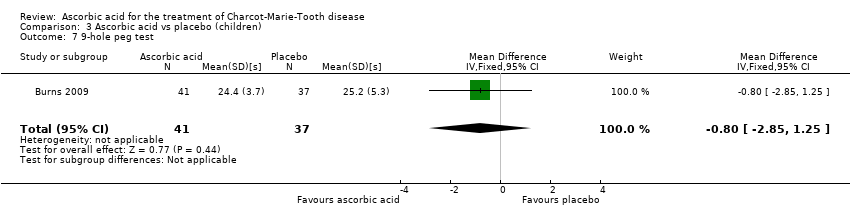
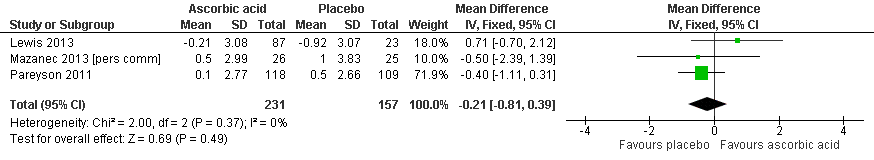
| 21 9‐hole peg test Show forest plot | 3 | 286 | Mean Difference (IV, Fixed, 95% CI) | ‐0.39 [‐0.76, ‐0.02] |
|
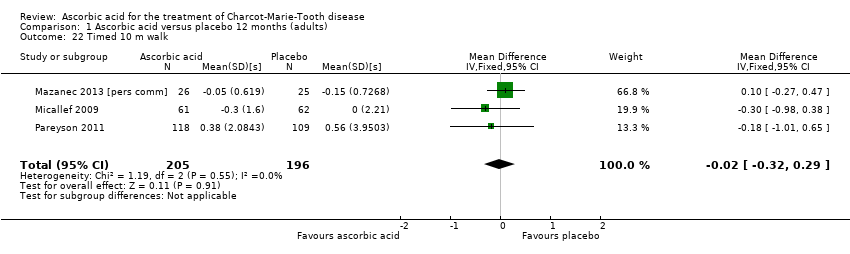
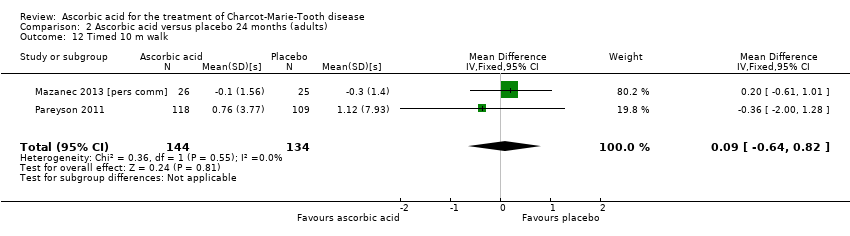
| 22 Timed 10 m walk Show forest plot | 3 | 401 | Mean Difference (IV, Fixed, 95% CI) | ‐0.02 [‐0.32, 0.29] |
|
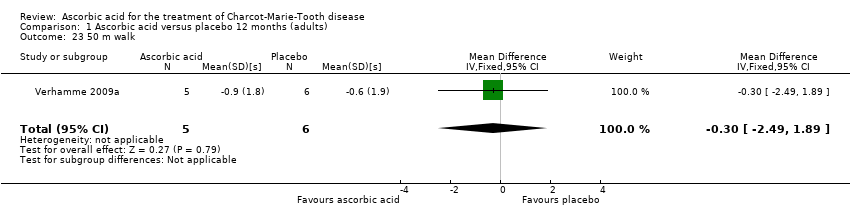
| 23 50 m walk Show forest plot | 1 | 11 | Mean Difference (IV, Fixed, 95% CI) | ‐0.30 [‐2.49, 1.89] |
|


![Forest plot of comparison: 1 Ascorbic acid versus placebo 12 months (adults), outcome: 1.21 9‐hole peg test [s].](/es/cdsr/doi/10.1002/14651858.CD011952/media/CDSR/CD011952/image_n/nCD011952-AFig-FIG04.png)
![Forest plot of comparison: 2 Ascorbic acid versus placebo 24 months (adults), outcome: 2.11 Impairment ‐ 9‐hole peg test [s].](/es/cdsr/doi/10.1002/14651858.CD011952/media/CDSR/CD011952/image_n/nCD011952-AFig-FIG06.png)