Cribado con oximetría de pulso para los defectos cardíacos congénitos graves
Información
- DOI:
- https://doi.org/10.1002/14651858.CD011912.pub2Copiar DOI

- Base de datos:
-
- Cochrane Database of Systematic Reviews
- Versión publicada:
-
- 01 marzo 2018see what's new
- Tipo:
-
- Diagnostic
- Etapa:
-
- Review
- Grupo Editorial Cochrane:
-
Grupo Cochrane de Neonatología
- Copyright:
-
- Copyright © 2018 The Cochrane Collaboration. Published by John Wiley & Sons, Ltd.
Cifras del artículo
Altmetric:
Citado por:
Autores
Contributions of authors
Protocol development: Shakila Thangaratinam, Andrew K. Ewer, Maria Nieves Plana, Javier Zamora, Gautham Suresh.
Selection of studies and data extraction: Maria Nieves Plana, Andrew K. Ewer.
Quality assessment: Maria Nieves Plana, Luis Fernandez‐Pineda, Andrew K. Ewer.
Statistical analysis and interpretation of data: Javier Zamora, Maria Nieves Plana, Shakila Thangaratinam, Andrew K. Ewer.
Drafting of the manuscript: Maria Nieves Plana, Javier Zamora, Shakila Thangaratinam, Andrew K. Ewer.
Critical revision: Shakila Thangaratinam, Andrew K. Ewer, Maria Nieves Plana, Javier Zamora, Gautham Suresh, Luis Fernandez‐Pineda.
Sources of support
Internal sources
-
IRYCIS, Spain.
Instituto Ramón y Cajal de Investigaciones Sanitarias, Madrid
-
Universidad Rey Juan Carlos, Madrid, Spain.
External sources
-
CIBERESP, Spain.
CIBER Epidemiology and Public Heath
-
Eunice Kennedy Shriver National Institute of Child Health and Human Development, National Institutes of Health, Department of Health and Human Services, USA.
Editorial support of the Cochrane Neonatal Review Group has been funded with Federal funds from the Eunice Kennedy Shriver National Institute of Child Health and Human Development, National Institutes of Health, Department of Health and Human Services, USA, under Contract No. HHSN275201600005C
Declarations of interest
Maria Nieves Plana: none to declare.
Javier Zamora: none to declare.
Gautham Suresh: none to declare.
Luis Fernandes‐Pineda: none to declare.
Shakila Thangaratinam: an author of one of the primary studies ‐ Ewer 2011.
Andrew K. Ewer: an author of one of the primary studies ‐ Ewer 2011.
Acknowledgements
We would like to thank Colleen Ovelman (Managing Editor and Assistant Information Specialist), Yolanda Brosseau (Webmaster), and Jennifer Spano (Information Specialist) of the Neonatal Group for their kind and efficient support during preparation of this review.
Version history
| Published | Title | Stage | Authors | Version |
| 2018 Mar 01 | Pulse oximetry screening for critical congenital heart defects | Review | Maria N Plana, Javier Zamora, Gautham Suresh, Luis Fernandez‐Pineda, Shakila Thangaratinam, Andrew K Ewer | |
| 2015 Oct 28 | Diagnostic accuracy of pulse oximetry screening for critical congenital heart defects | Protocol | Maria N Plana, Javier Zamora, Gautham Suresh, Luis Fernandez‐Pineda, Shakila Thangaratinam, Andrew K Ewer | |
Differences between protocol and review
Searching other resources
The protocol describes our plan to search the MEDION database (www.mediondatabase.nl), but this resource is not longer available.
Statistical analysis
We planned to use a 95% saturation level as the primary threshold for the analysis and to perform separate analyses for other thresholds categorized as < 95% and > 95% saturation levels. However, at editorial phase, it was suggested to group thresholds. As many studies used a lower than or lower than or equal to 95% threshold, we decided to group all these studies for the main analysis.
The protocol describes our plan to switch the modeling strategy to fit two univariate random‐effects logistic regression models by assuming no correlation between sensitivity and specificity if the number of studies was small (fewer than four), or if the proposed modeling strategy led to problems in achieving convergence. We identified sufficient studies to fit a bivariate model and had no problem achieving model convergence.
Certainty of the evidence
We decided post hoc to assess the certainty of evidence using the Grading of Recommendations Assessment, Development and Evaluation (GRADE) approach (Schunemann 2008).
Subgroup analysis
We did not perform subgroup analyses by oxygen saturation or study design, given the low power of these subgroup analyses.
Sensitivity analysis
Additionally, we decided to perform ad hoc sensitivity analyses to describe how sensitivity and specificity vary by including or excluding studies with different thresholds.
Keywords
MeSH
Medical Subject Headings (MeSH) Keywords
Medical Subject Headings Check Words
Humans; Infant, Newborn;
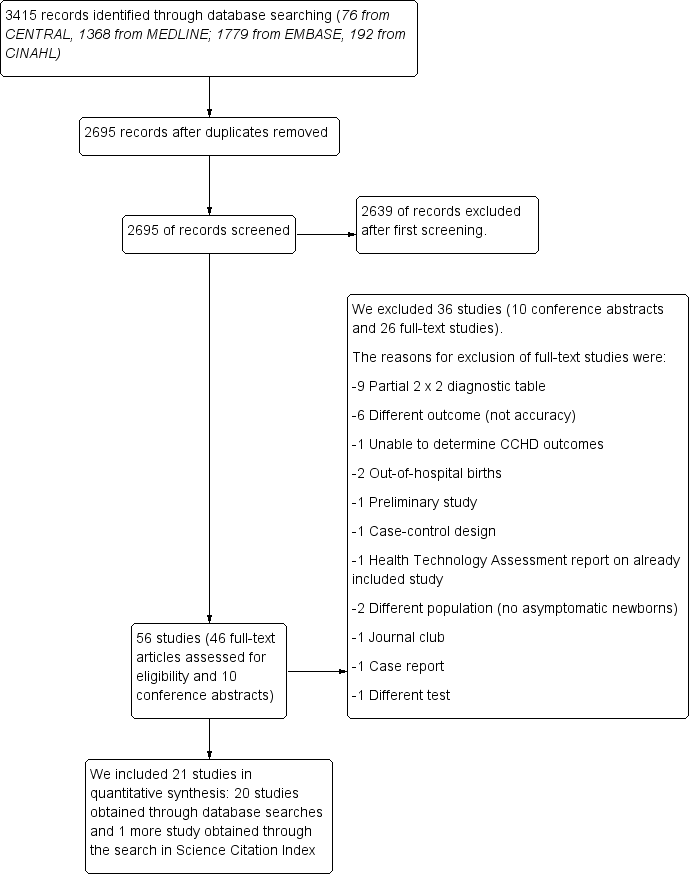
Flow of studies through the screening process. CCHD: critical congenital heart defect.

Risk of bias and applicability concerns summary: review authors' judgements about each domain for each included study.

Risk of bias and applicability concerns graph: review authors' judgements about each domain presented as percentages across included studies.

Forest plot of sensitivity and specificity. The figure shows the estimated sensitivity and specificity of the study (blue square) and its 95% confidence interval (black horizontal line). Studies are ordered by ascending specificity.

Summary ROC plot for pulse oximetry using a threshold lower than or lower than or equal to 95% (n = 19 studies). The solid circle corresponds to the summary estimate of sensitivity and specificity, and is shown with a 95% prediction region (dashed line).


Primary analysis (threshold < 95% or ≤ 95%).
| Should pulse oximetry be used to diagnose CCHD in asymptomatic newborns? | ||||||||
| Patient or population: asymptomatic newborns at the time of pulse oximetry screening | ||||||||
| Setting: hospital births | ||||||||
| Index test: pulse oximetry | ||||||||
| Reference test: Reference standards were both diagnostic echocardiography (echocardiogram) and clinical follow‐up in the first 28 days of life, including postmortem findings and mortality and congenital anomaly databases to identify false‐negative patients. | ||||||||
| Studies: We included prospective or retrospective cohorts and cross‐sectional studies. We excluded case reports and studies of case‐control design. | ||||||||
| Threshold | Summary accuracy (95% CI) | Number of participants (diseased /non‐diseased) Number of studies | Prevalence median (range) | Implications (in a cohort of 10,000 newborns tested [95% CI]) | Certainty of the evidence (GRADE) | |||
| Prevalence 0.6 per 1000 | Prevalence 0.1 per 1000 | Prevalence 3.7 per 1000 | ||||||
| 95% (less than or less than or equal to) | Sensitivity 76.3% (69.5 to 82.0) Specificity 99.9% (99.7 to 99.9) | 436,758 (345/436,413) 19 studies | 0.6 per 1000 (0.1 to 3.7) | True positives (newborns with CCHD) | 5 (4 to 5) | 1 (1 to 1) | 28 (26 to 30) | LOW* ⊕⊕⊝⊝ |
| False negatives (newborns incorrectly classified as not having CCHD) | 1 (1 to 2) | 0 (0 to 0) | 9 (7 to 11) | |||||
| True negatives (newborns without CCHD) | 9980 (9966 to 9987) | 9985 (9971 to 9992) | 9949 (9935 to 9956) | HIGH ⊕⊕⊕⊕ | ||||
| False positives (newborns incorrectly classified as having CCHD) | 14 (7 to 28) | 14 (7 to 28) | 14 (7 to 28) | |||||
| CCHD: critical congenital heart defect; CI: confidence interval. Sensitivity: *We have downgraded certainty of the evidence from high to low because the low number of CCHD cases included in the review (serious imprecision) and secondly, there was a serious risk of differential verification bias (ie, diagnosis was established by echocardiography in test positive cases however test negatives were usually confirmed by clinical follow‐up or by accessing congenital malformation registries and mortality databases)." | ||||||||
| Certainty of the evidence (Balshem 2011) | ||||||||
| Study | Population | Index test | Reference standard(s) | |||||
| Antenatal diagnosis of CHD | Pulse oximeter | Limb | Test timing | Oxygen saturation | Threshold | Positive pulse oximetry | Negative pulse oximetry | |
| Arlettaz 2006 | included | Nellcor NPB‐40 | post‐ductal | within 24 hours | functional | < 95% | echocardiography | NA |
| Bakr 2005 | excluded | Digioxi PO 920 | pre‐ductal and post‐ductal | longer than 24 hours | fractional | ≤ 94% | echocardiography | cardiology database |
| Bhola 2014 | included | Masimo Radical 5 | post‐ductal | longer than 24 hours | functional | < 95% | echocardiography | cardiology database |
| De‐Wahl 2009 | excluded | Radical SET v4 | pre‐ductal and post‐ductal | longer than 24 hours | functional | < 95% | echocardiography | mortality data |
| Ewer 2011 | included | Radical‐7 | pre‐ductal and post‐ductal | within 24 hours | functional | < 95% | echocardiography | clinical follow‐up, cardiology database & congenital registry |
| Gomez‐Rodriguez 2015 | excluded | Radical‐5 | post‐ductal | within 24 hours | functional | < 95% | echocardiography | clinical follow‐up |
| Jones 2016 | excluded | NA | pre‐ductal and post‐ductal | within 24 hours | NA | ≤ 95% | echocardiography | National Congenital Heart Disease Audit |
| Klausner 2017 | excluded | NA | pre‐ductal and post‐ductal | longer than 24 hours | NA | < 95% | echocardiography | clinical follow‐up |
| Koppel 2003 | excluded | Ohmeda Medical | post‐ductal | longer than 24 hours | functional | ≤ 95% | echocardiography | clinical follow‐up & congenital registry |
| Meberg 2008 | excluded | RAD‐5v | post‐ductal | within 24 hours | functional | < 95% | echocardiography | clinical follow‐up |
| Oakley 2015 | excluded | Nellcor NPB 40 | post‐ductal | longer than 24 hours | functional | < 95% | echocardiography | cardiology database & mortality data |
| Ozalkaya 2016 | excluded | Nellcor | pre‐ductal and post‐ductal | longer than 24 hours | functional | ≤ 95% | echocardiography | echocardiography |
| Richmond 2002 | included | Oxi machine | post‐ductal | within 24 hours | fractional | < 95% | echocardiography | mortality data & congenital registry |
| Riede 2010 | excluded | NA | post‐ductal | longer than 24 hours | functional | ≤ 95% | echocardiography | congenital registry |
| Rosati 2005 | excluded | NA | post‐ductal | longer than 24 hours | functional | ≤ 95% | echocardiography | clinical follow‐up |
| Sendelbach 2008 | excluded | Nellcor N‐395 | post‐ductal | within 24 hours | functional | < 96% | echocardiography | clinical follow‐up |
| Singh 2014 | excluded | NA | pre‐ductal and post‐ductal | within 24 hours | functional | < 95% | echocardiography | mortality data & congenital registry & cardiology database |
| Turska 2012 | excluded | Novametrix, Nellcor & Masimo | post‐ductal | within 24 hours | functional | < 95% | echocardiography | clinical follow‐up and Public Health registries |
| Van Niekerk 2016 | excluded | Nellcor | pre‐ductal and post‐ductal | longer than 24 hours | functional | < 95% | echocardiography | NA |
| Zhao 2014 | excluded | RAD‐5V | pre‐ductal and post‐ductal | longer than 24 hours | functional | < 95% | echocardiography | clinical follow‐up |
| Zuppa 2015 | excluded | Ohmeda 3900 | post‐ductal | longer than 24 hours | functional | < 95% | echocardiography | NA |
| NA: not available | ||||||||
| N | Sensitivity (95% CI) | Relative sensitivity P value | False‐positive rate (FPR) (95% CI) | Relative FPR P value | |
| Antenatal diagnosis | |||||
| Included | 4 | 86.3% (71.8 to 94.0) | 0.071 | 0.46% (0.13 to 1.59) | 0.231 |
| Excluded | 15 | 74.1% (65.7 to 81.1) | 0.10% (0.05 to 0.21) | ||
| Test timing | |||||
| Longer than 24 hours | 11 | 73.6% (62.8 to 82.1) | 0.393 | 0.06% (0.03 to 0.13) | 0.027 |
| Within 24 hours | 8 | 79.5% (70.0 to 86.6) | 0.42% (0.20 to 0.89) | ||
| Limb | |||||
| Foot only | 11 | 81.2% (70.9 to 88.4) | 0.197 | 0.13% (0.05 to 0.31) | 0.718 |
| Foot and right hand | 8 | 71.2% (58.5 to 81.3) | 0.17% (0.06 to 0.46) | ||
| Risk of bias ("flow and timing") | |||||
| Unclear risk of bias | 9 | 77.8% (64.1 to 87.3) | 0.937 | 0.05% (0.02 to 0.12) | 0.016 |
| Low risk of bias | 10 | 77.3% (68.8 to 84.0) | 0.34% (0.17 to 0.66) |
| Test | No. of studies | No. of participants |
| 1 All studies Show forest plot | 21 | 457202 |
| 2 Primary analysis (threshold < 95% or ≤ 95%) Show forest plot | 19 | 436758 |