Contenido relacionado
Revisiones y protocolos relacionados
Jennifer Valeska Elli Brown, Nicholas Meader, Jemma Cleminson, William McGuire | 14 enero 2019
Masahiro Iguchi, Yoshinori Noguchi, Shungo Yamamoto, Yuu Tanaka, Hiraku Tsujimoto | 11 junio 2020
Damon Shorter, Timothy Hong, David A Osborn | 7 septiembre 2011
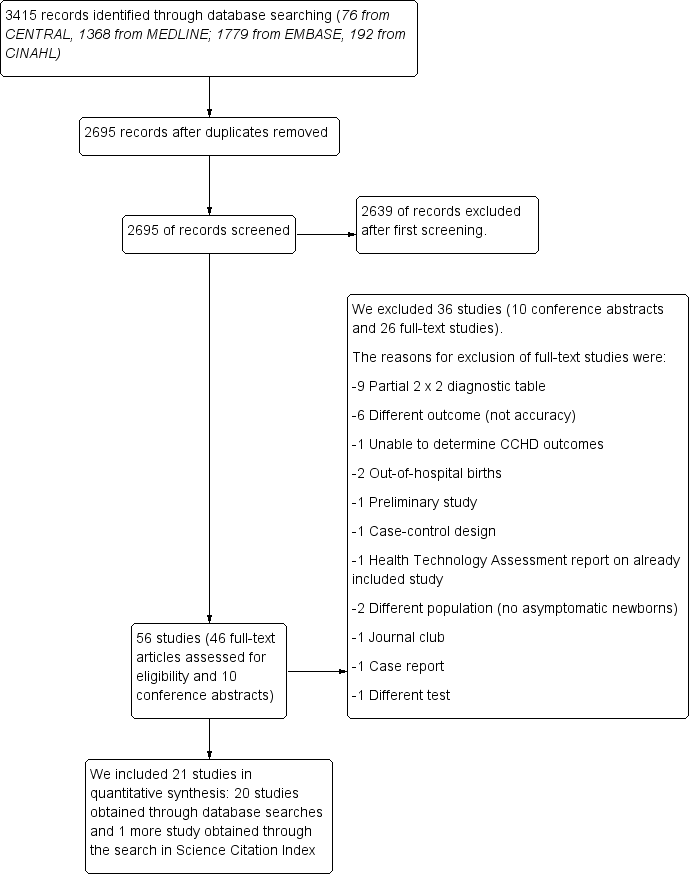
Carlos F. Grillo‐Ardila, Marcela Torres, Hernando G Gaitán | 29 enero 2020
Lalith Wijedoru, Sue Mallett, Christopher M Parry | 25 mayo 2017
Richard Macey, Tanya Walsh, Philip Riley, Richard Hogan, Anne-Marie Glenny, Helen V Worthington, Janet E Clarkson, David Ricketts | 27 enero 2021
Adrienne E Shapiro, Jennifer M Ross, Mandy Yao, Ian Schiller, Mikashmi Kohli, Nandini Dendukuri, Karen R Steingart, David J Horne | 23 marzo 2021
Bryan Vonasek, Tara Ness, Yemisi Takwoingi, Alexander W Kay, Susanna S van Wyk, Lara Ouellette, Ben J Marais, Karen R Steingart, Anna M Mandalakas | 28 junio 2021
Jerry S Zifodya, Jonah S Kreniske, Ian Schiller, Mikashmi Kohli, Nandini Dendukuri, Samuel G Schumacher, Eleanor A Ochodo, Frederick Haraka, Alice A Zwerling, Madhukar Pai, Karen R Steingart, David J Horne | 22 febrero 2021
Sophie Jullien, Harsha A Dissanayake, Marty Chaplin | 26 junio 2020
Respuestas clínicas Cochrane
Jane Burch, Alejandro González Garay | 1 mayo 2020