Bromuro de umeclidinio versus placebo para pacientes con enfermedad pulmonar obstructiva crónica (EPOC)
Información
- DOI:
- https://doi.org/10.1002/14651858.CD011897.pub2Copiar DOI

- Base de datos:
-
- Cochrane Database of Systematic Reviews
- Versión publicada:
-
- 20 junio 2017see what's new
- Tipo:
-
- Intervention
- Etapa:
-
- Review
- Grupo Editorial Cochrane:
-
Grupo Cochrane de Vías respiratorias
- Copyright:
-
- Copyright © 2017 The Cochrane Collaboration. Published by John Wiley & Sons, Ltd.
Cifras del artículo
Altmetric:
Citado por:
Autores
Contributions of authors
HN and AH wrote the protocol with suggestions and input on the methods from SM. SM performed the search of additional resources, and AH and SM screened search results and retrieved full‐text articles. HN and AH selected studies for inclusion. HN contacted trial authors and the manufacturer of umeclidinium (GlaxoSmithKline) for unpublished data. AH and SM independently assessed risk of bias of included studies. AH and HN extracted data, and AH performed data entry, which was checked by HN. HN performed data analysis with statistical expertise and advice obtained from SM. AH and HN drafted the manuscript with statistical input from SM. All review authors revised and agreed on the full review manuscript before submission for editorial review.
Sources of support
Internal sources
-
The review authors declare that no such funding was received for this systematic review, Malaysia.
External sources
-
The review authors declare that no such funding was received for this systematic review, Other.
Declarations of interest
HN: none known.
AH: none known.
SM: none known.
We are conducting this systematic review for academic purposes.
Acknowledgements
We would like to thank the editors and staff of the Cochrane Airways Group and the Cochrane Collaboration for their utmost help and support, especially Managing Editor Dr Emma J Dennett and the Trials Search Co‐ordinator Ms Elizabeth Stovold, for feedback, suggestions, and advice pertaining to this review. We are also grateful to the authoritative persons of respective institutions for their support.
The Background and Methods sections of this review are based on a standard template used by the Cochrane Airways Group. Parts of the review use similar wording to our recent related review and protocol (Ni 2014; Ni 2015).
Philippa Poole was the Editor for this review and commented critically on the review.
This project was supported by the National Institute for Health Research, via Cochrane Infrastructure funding to the Cochrane Airways Group. The views and opinions expressed therein are those of the review authors and do not necessarily reflect those of the Systematic Reviews Programme, NIHR, NHS (National Health Service), or the Department of Health.
Version history
| Published | Title | Stage | Authors | Version |
| 2017 Jun 20 | Umeclidinium bromide versus placebo for people with chronic obstructive pulmonary disease (COPD) | Review | Han Ni, Aung Htet, Soe Moe | |
| 2015 Sep 28 | Umeclidinium bromide versus placebo for people with chronic obstructive pulmonary disease (COPD) | Protocol | Han Ni, Aung Htet, Soe Moe | |
Differences between protocol and review
This review strictly follows the prespecified protocols. We did not plan in the protocol to perform subgroup analysis of the dose for hospital admission; however, we did this because we observed significant heterogeneity for this outcome. Among planned outcomes for the dose subgroup, we applied only quality of life, as remaining outcomes did not reveal significant heterogeneity. We did not perform subgroup analysis based on severity of COPD. Similarly, a funnel plot to explore reporting bias was not applicable to our review, as the review included only four trials.
Keywords
MeSH
Medical Subject Headings (MeSH) Keywords
- Anti-Bacterial Agents [therapeutic use];
- Bromides [adverse effects, *therapeutic use];
- Disease Progression;
- Forced Expiratory Volume;
- Hospitalization [statistics & numerical data];
- Numbers Needed To Treat;
- Placebos [therapeutic use];
- Pulmonary Disease, Chronic Obstructive [*drug therapy];
- Quality of Life;
- Quinuclidines [adverse effects, *therapeutic use];
- Randomized Controlled Trials as Topic;
- Smoking [epidemiology];
- Steroids [therapeutic use];
Medical Subject Headings Check Words
Female; Humans; Male; Middle Aged;
PICO
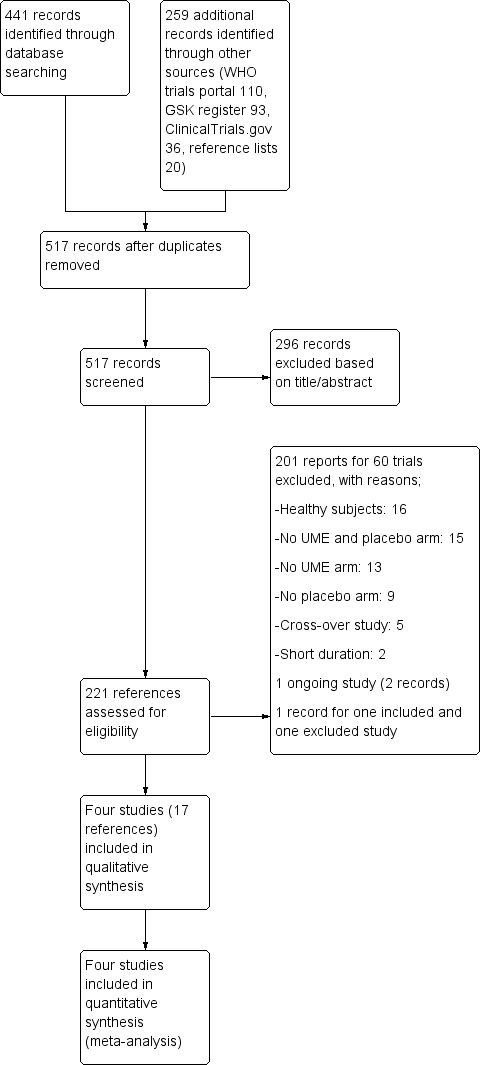
Study flow diagram.

Risk of bias summary: review authors' judgements about each risk of bias item for each included study.

Forest plot of comparison: 1 Umeclidinium bromide versus placebo, outcome: 1.1 Number of participants with exacerbations requiring steroids, antibiotics, or both.
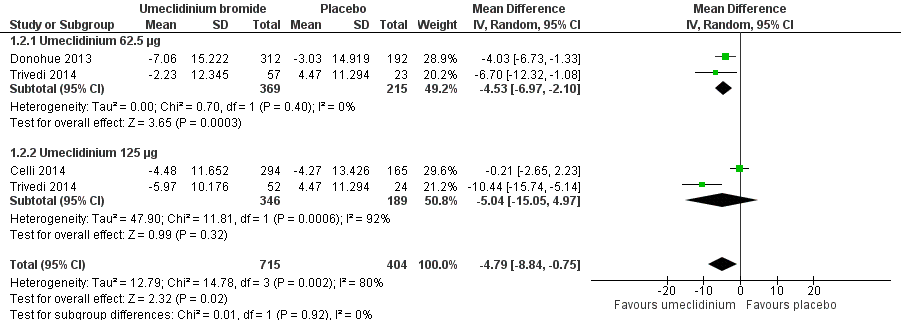
Forest plot of comparison: 1 Umeclidinium bromide versus placebo, outcome: 1.2 Quality of life: change from baseline in SGRQ total score.

Forest plot of comparison: 1 Umeclidinium bromide versus placebo, outcome: 1.8 Number of participants with ≥ 1 unit improvement in TDI focal score.

Forest plot of comparison: 1 Umeclidinium bromide versus placebo, outcome: 1.13 Use of rescue medications (change from baseline in number of puffs per day).
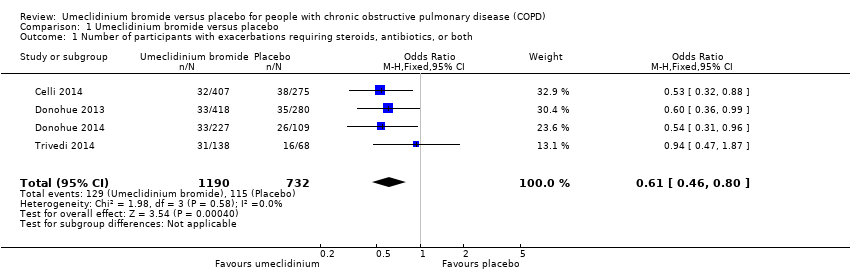
Comparison 1 Umeclidinium bromide versus placebo, Outcome 1 Number of participants with exacerbations requiring steroids, antibiotics, or both.
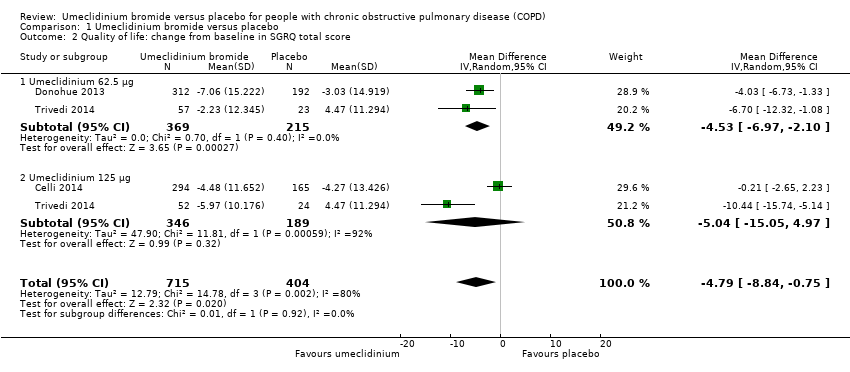
Comparison 1 Umeclidinium bromide versus placebo, Outcome 2 Quality of life: change from baseline in SGRQ total score.
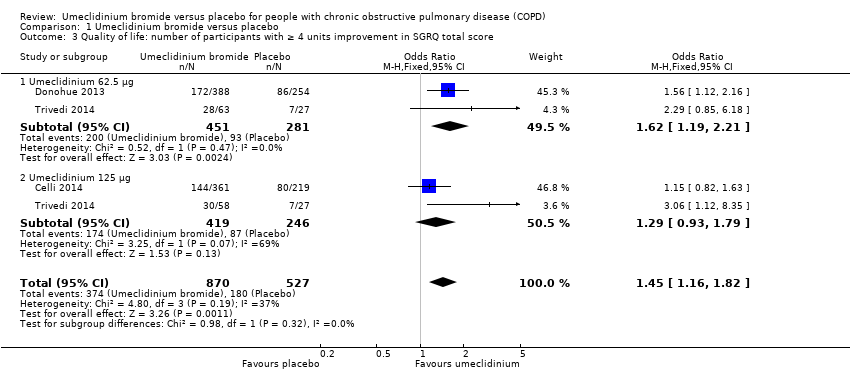
Comparison 1 Umeclidinium bromide versus placebo, Outcome 3 Quality of life: number of participants with ≥ 4 units improvement in SGRQ total score.
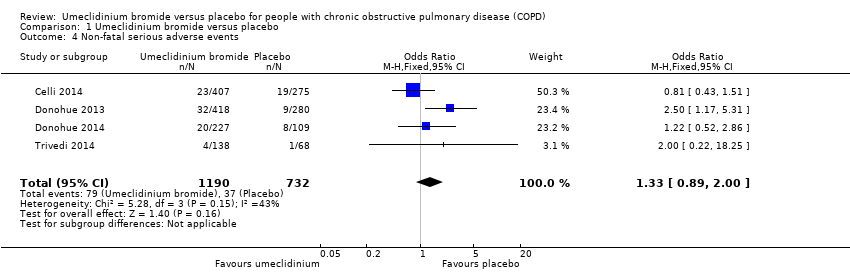
Comparison 1 Umeclidinium bromide versus placebo, Outcome 4 Non‐fatal serious adverse events.

Comparison 1 Umeclidinium bromide versus placebo, Outcome 5 Total number of deaths.

Comparison 1 Umeclidinium bromide versus placebo, Outcome 6 Number of participants with hospital admissions due to COPD exacerbation.

Comparison 1 Umeclidinium bromide versus placebo, Outcome 7 Improvement in symptoms: TDI focal score.

Comparison 1 Umeclidinium bromide versus placebo, Outcome 8 Number of participants with ≥ 1 unit improvement in TDI focal score.

Comparison 1 Umeclidinium bromide versus placebo, Outcome 9 Lung function: change from baseline in trough FEV1 (L).
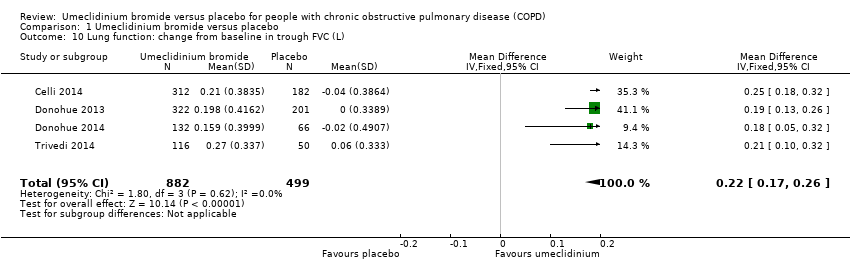
Comparison 1 Umeclidinium bromide versus placebo, Outcome 10 Lung function: change from baseline in trough FVC (L).

Comparison 1 Umeclidinium bromide versus placebo, Outcome 11 Lung function: change from baseline in peak FEV1 (L).

Comparison 1 Umeclidinium bromide versus placebo, Outcome 12 Adverse events (not including serious adverse events).

Comparison 1 Umeclidinium bromide versus placebo, Outcome 13 Use of rescue medications (change from baseline in number of puffs per day).
| Umeclidinium bromide vs placebo for stable chronic obstructive pulmonary disease | ||||||
| Patient or population: people with chronic obstructive pulmonary disease (COPD) | ||||||
| Outcomes | Anticipated absolute effects* (95% CI) | Relative effect | Number of participants | Quality of the evidence | Comments | |
| Risk with placebo | Risk with umeclidinium bromide | |||||
| Number of participants with exacerbations requiring steroids, antibiotics, or both | 157 per 1000 | 102 per 1000 | OR 0.61 | 1922 | ⊕⊕⊕⊕ | |
| Quality of life: number of participants with ≥ 4 units improvement in SGRQ total score | 342 per 1000 | 429 per 1000 | OR 1.45 | 1397 | ⊕⊕⊕⊝ | Mean quality of life: change from baseline in SGRQ total score was 4.79 lower (8.84 lower to 0.75 lower) in umeclidinium group (1119 participants, 3 RCTs) |
| Non‐fatal serious adverse events | 51 per 1000 | 66 per 1000 | OR 1.33 | 1922 | ⊕⊕⊕⊝ | Larger studies may help refine this estimate |
| Number of participants with hospital admissions due to COPD exacerbation | 20 per 1000 | 18 per 1000 | OR 0.86 | 1922 | ⊕⊕⊝⊝ | Few events, so larger studies may help refine this estimate |
| Number of participants with ≥ 1 unit improvement in TDI focal score | 336 per 1000 | 464 per 1000 | OR 1.71 | 1441 | ⊕⊕⊕⊕ | Mean improvement in TDI focal score change from baseline was 0.76 higher (0.43 higher to 1.09 higher) in umeclidinium group (1193 participants, 3 RCTs) |
| Change from baseline in trough FEV1 (L) | Mean change from baseline in trough FEV1 (L) across control groups ranged from 0.123 to 0.139 | Mean change from baseline in trough FEV1 (L) in the intervention group was 0.14 higher (0.12 higher to 0.17 higher) | ‐ | 1381 | ⊕⊕⊕⊕ | |
| Adverse events (not including serious adverse events) | 239 per 1000 | 250 per 1000 | OR 1.06 | 1922 | ⊕⊕⊕⊝ | |
| *The risk in the intervention group (and its 95% confidence interval) is based on assumed risk in the comparison group and relative effect of the intervention (and its 95% CI). | ||||||
| GRADE Working Group grades of evidence | ||||||
| a‐1 for inconsistency: unexplained significant heterogeneity b‐1 for imprecision: the CI includes non‐appreciable benefit and potential harm c‐2 for imprecision: the CI includes both appreciable benefit and harm | ||||||
| Outcome or subgroup title | No. of studies | No. of participants | Statistical method | Effect size |
| 1 Number of participants with exacerbations requiring steroids, antibiotics, or both Show forest plot | 4 | 1922 | Odds Ratio (M‐H, Fixed, 95% CI) | 0.61 [0.46, 0.80] |
| 2 Quality of life: change from baseline in SGRQ total score Show forest plot | 3 | 1119 | Mean Difference (IV, Random, 95% CI) | ‐4.79 [‐8.84, ‐0.75] |
| 2.1 Umeclidinium 62.5 μg | 2 | 584 | Mean Difference (IV, Random, 95% CI) | ‐4.53 [‐6.97, ‐2.10] |
| 2.2 Umeclidinium 125 μg | 2 | 535 | Mean Difference (IV, Random, 95% CI) | ‐5.04 [‐15.05, 4.97] |
| 3 Quality of life: number of participants with ≥ 4 units improvement in SGRQ total score Show forest plot | 3 | 1397 | Odds Ratio (M‐H, Fixed, 95% CI) | 1.45 [1.16, 1.82] |
| 3.1 Umeclidinium 62.5 μg | 2 | 732 | Odds Ratio (M‐H, Fixed, 95% CI) | 1.62 [1.19, 2.21] |
| 3.2 Umeclidinium 125 μg | 2 | 665 | Odds Ratio (M‐H, Fixed, 95% CI) | 1.29 [0.93, 1.79] |
| 4 Non‐fatal serious adverse events Show forest plot | 4 | 1922 | Odds Ratio (M‐H, Fixed, 95% CI) | 1.33 [0.89, 2.00] |
| 5 Total number of deaths Show forest plot | 4 | 1922 | Peto Odds Ratio (Peto, Fixed, 95% CI) | 1.68 [0.52, 5.48] |
| 6 Number of participants with hospital admissions due to COPD exacerbation Show forest plot | 4 | 1922 | Odds Ratio (M‐H, Random, 95% CI) | 0.86 [0.25, 2.92] |
| 6.1 Umeclidinium 62.5 μg | 2 | 801 | Odds Ratio (M‐H, Random, 95% CI) | 3.20 [0.91, 11.24] |
| 6.2 Umeclidinium 125 μg | 3 | 1121 | Odds Ratio (M‐H, Random, 95% CI) | 0.43 [0.18, 1.03] |
| 7 Improvement in symptoms: TDI focal score Show forest plot | 3 | 1193 | Mean Difference (IV, Fixed, 95% CI) | 0.76 [0.43, 1.09] |
| 8 Number of participants with ≥ 1 unit improvement in TDI focal score Show forest plot | 3 | 1441 | Odds Ratio (M‐H, Fixed, 95% CI) | 1.71 [1.37, 2.15] |
| 9 Lung function: change from baseline in trough FEV1 (L) Show forest plot | 4 | 1381 | Mean Difference (IV, Fixed, 95% CI) | 0.14 [0.12, 0.17] |
| 10 Lung function: change from baseline in trough FVC (L) Show forest plot | 4 | 1381 | Mean Difference (IV, Fixed, 95% CI) | 0.22 [0.17, 0.26] |
| 11 Lung function: change from baseline in peak FEV1 (L) Show forest plot | 2 | 1035 | Mean Difference (IV, Fixed, 95% CI) | 0.17 [0.14, 0.19] |
| 12 Adverse events (not including serious adverse events) Show forest plot | 4 | 1922 | Odds Ratio (M‐H, Fixed, 95% CI) | 1.06 [0.85, 1.31] |
| 13 Use of rescue medications (change from baseline in number of puffs per day) Show forest plot | 4 | 1531 | Mean Difference (IV, Fixed, 95% CI) | ‐0.45 [‐0.76, ‐0.14] |