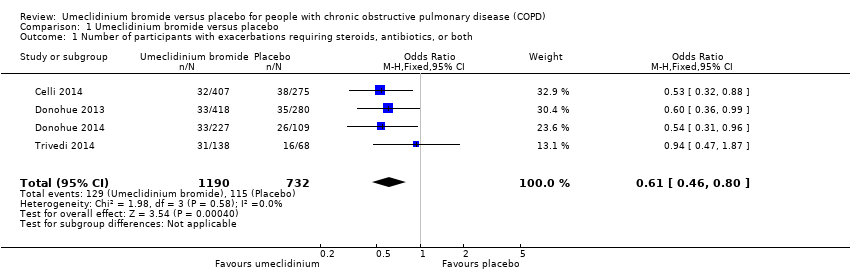
| 1 Number of participants with exacerbations requiring steroids, antibiotics, or both Show forest plot | 4 | 1922 | Odds Ratio (M‐H, Fixed, 95% CI) | 0.61 [0.46, 0.80] |
|
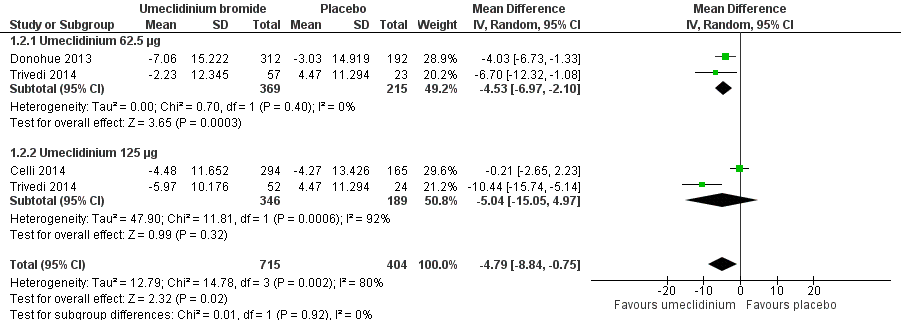
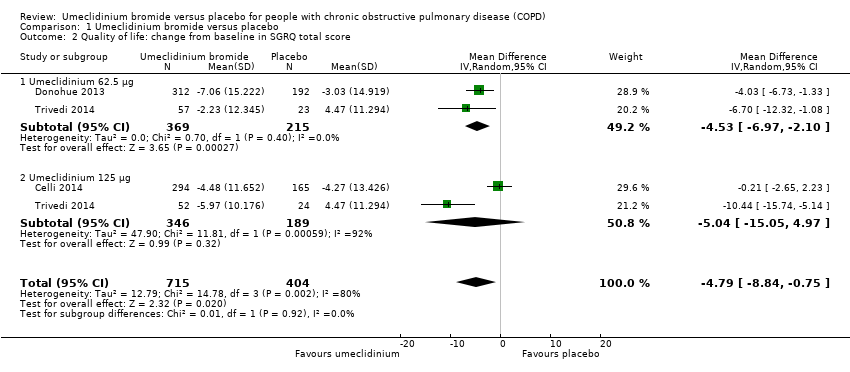
| 2 Quality of life: change from baseline in SGRQ total score Show forest plot | 3 | 1119 | Mean Difference (IV, Random, 95% CI) | ‐4.79 [‐8.84, ‐0.75] |
|
| 2.1 Umeclidinium 62.5 μg | 2 | 584 | Mean Difference (IV, Random, 95% CI) | ‐4.53 [‐6.97, ‐2.10] |
| 2.2 Umeclidinium 125 μg | 2 | 535 | Mean Difference (IV, Random, 95% CI) | ‐5.04 [‐15.05, 4.97] |
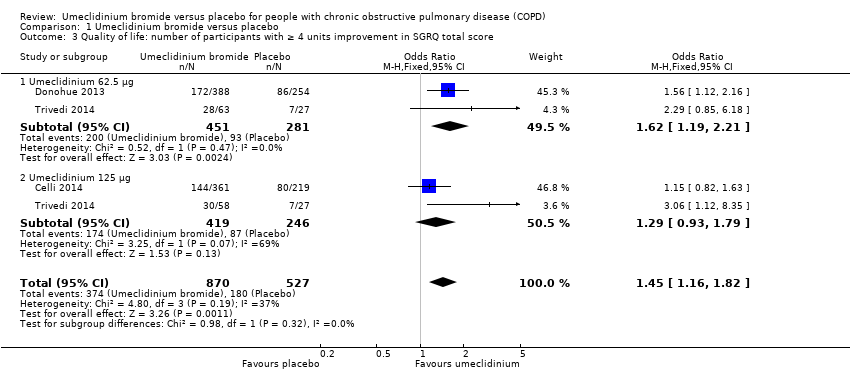
| 3 Quality of life: number of participants with ≥ 4 units improvement in SGRQ total score Show forest plot | 3 | 1397 | Odds Ratio (M‐H, Fixed, 95% CI) | 1.45 [1.16, 1.82] |
|
| 3.1 Umeclidinium 62.5 μg | 2 | 732 | Odds Ratio (M‐H, Fixed, 95% CI) | 1.62 [1.19, 2.21] |
| 3.2 Umeclidinium 125 μg | 2 | 665 | Odds Ratio (M‐H, Fixed, 95% CI) | 1.29 [0.93, 1.79] |
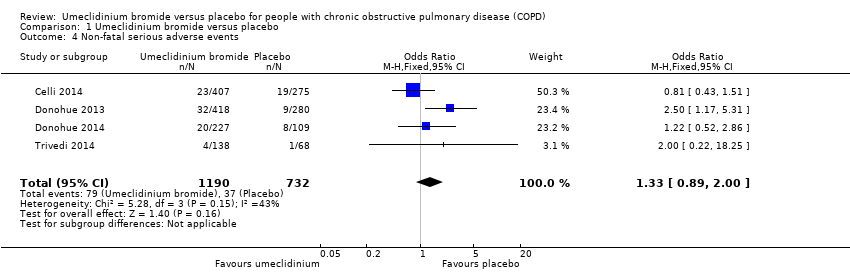
| 4 Non‐fatal serious adverse events Show forest plot | 4 | 1922 | Odds Ratio (M‐H, Fixed, 95% CI) | 1.33 [0.89, 2.00] |
|
| 5 Total number of deaths Show forest plot | 4 | 1922 | Peto Odds Ratio (Peto, Fixed, 95% CI) | 1.68 [0.52, 5.48] |
|
| 6 Number of participants with hospital admissions due to COPD exacerbation Show forest plot | 4 | 1922 | Odds Ratio (M‐H, Random, 95% CI) | 0.86 [0.25, 2.92] |
|
| 6.1 Umeclidinium 62.5 μg | 2 | 801 | Odds Ratio (M‐H, Random, 95% CI) | 3.20 [0.91, 11.24] |
| 6.2 Umeclidinium 125 μg | 3 | 1121 | Odds Ratio (M‐H, Random, 95% CI) | 0.43 [0.18, 1.03] |
| 7 Improvement in symptoms: TDI focal score Show forest plot | 3 | 1193 | Mean Difference (IV, Fixed, 95% CI) | 0.76 [0.43, 1.09] |
|
| 8 Number of participants with ≥ 1 unit improvement in TDI focal score Show forest plot | 3 | 1441 | Odds Ratio (M‐H, Fixed, 95% CI) | 1.71 [1.37, 2.15] |
|
| 9 Lung function: change from baseline in trough FEV1 (L) Show forest plot | 4 | 1381 | Mean Difference (IV, Fixed, 95% CI) | 0.14 [0.12, 0.17] |
|
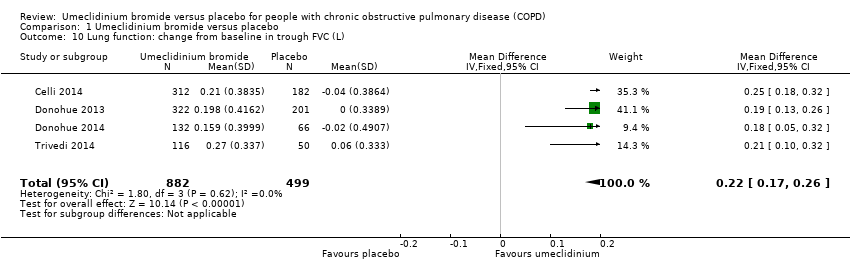
| 10 Lung function: change from baseline in trough FVC (L) Show forest plot | 4 | 1381 | Mean Difference (IV, Fixed, 95% CI) | 0.22 [0.17, 0.26] |
|
| 11 Lung function: change from baseline in peak FEV1 (L) Show forest plot | 2 | 1035 | Mean Difference (IV, Fixed, 95% CI) | 0.17 [0.14, 0.19] |
|
| 12 Adverse events (not including serious adverse events) Show forest plot | 4 | 1922 | Odds Ratio (M‐H, Fixed, 95% CI) | 1.06 [0.85, 1.31] |
|
| 13 Use of rescue medications (change from baseline in number of puffs per day) Show forest plot | 4 | 1531 | Mean Difference (IV, Fixed, 95% CI) | ‐0.45 [‐0.76, ‐0.14] |
|