مقایسه اومکلیدینیوم بروماید در برابر دارونما در درمان افراد مبتلا به بیماری مزمن انسدادی ریه (COPD)
Appendices
Appendix 1. Sources and search methods for the Cochrane Airways Group Specialised Register (CAGR)
Electronic searches: core databases
| Database | Frequency of search |
| CENTRAL (the Cochrane Library) | Monthly |
| MEDLINE (Ovid) | Weekly |
| Embase (Ovid) | Weekly |
| PsycINFO (Ovid) | Monthly |
| CINAHL (EBSCO) | Monthly |
| AMED (EBSCO) | Monthly |
Handsearches: core respiratory conference abstracts
| Conference | Years searched |
| American Academy of Allergy, Asthma and Immunology (AAAAI) | 2001 onwards |
| American Thoracic Society (ATS) | 2001 onwards |
| Asia Pacific Society of Respirology (APSR) | 2004 onwards |
| British Thoracic Society Winter Meeting (BTS) | 2000 onwards |
| Chest Meeting | 2003 onwards |
| European Respiratory Society (ERS) | 1992, 1994, 2000 onwards |
| International Primary Care Respiratory Group Congress (IPCRG) | 2002 onwards |
| Thoracic Society of Australia and New Zealand (TSANZ) | 1999 onwards |
MEDLINE search strategy used to identify trials for the CAGR
COPD search
1. Lung Diseases, Obstructive/
2. exp Pulmonary Disease, Chronic Obstructive/
3. emphysema$.mp.
4. (chronic$ adj3 bronchiti$).mp.
5. (obstruct$ adj3 (pulmonary or lung$ or airway$ or airflow$ or bronch$ or respirat$)).mp.
6. COPD.mp.
7. COAD.mp.
8. COBD.mp.
9. AECB.mp.
10. or/1‐9
Filter to identify RCTs
1. exp "clinical trial [publication type]"/
2. (randomized or randomised).ab,ti.
3. placebo.ab,ti.
4. dt.fs.
5. randomly.ab,ti.
6. trial.ab,ti.
7. groups.ab,ti.
8. or/1‐7
9. Animals/
10. Humans/
11. 9 not (9 and 10)
12. 8 not 11
The MEDLINE strategy and RCT filter are adapted to identify trials in other electronic databases
Appendix 2. Search strategy to identify relevant trials from the CAGR
#1 MeSH DESCRIPTOR Pulmonary Disease, Chronic Obstructive Explode All
#2 MeSH DESCRIPTOR Bronchitis, Chronic
#3 (obstruct*) near3 (pulmonary or lung* or airway* or airflow* or bronch* or respirat*)
#4 COPD:MISC1
#5 (COPD OR COAD OR COBD OR AECOPD):TI,AB,KW
#6 #1 OR #2 OR #3 OR #4 OR #5
#7 umeclidinium*
#8 GSK573719
#9 Incruse*
#10 long* NEAR muscarinic* NEAR antagonist*
#11 #7 or #8 or #9 or #10
#12 #6 AND #11
[Note: in search line #4, MISC1 denotes the field in the record where the reference has been coded for condition, in this case, COPD]
Appendix 3. Search strategy for ClinicalTrials.gov
Search terms: "Umeclidinium bromide" OR "Umeclidinium" OR "Incruse Ellipta"
Conditions: COPD or Chronic Obstructive Pulmonary Disease
Study type: Interventional studies
Appendix 4. Search strategy for WHO trials portal
Search terms: "Umeclidinium bromide" OR "Umeclidinium"
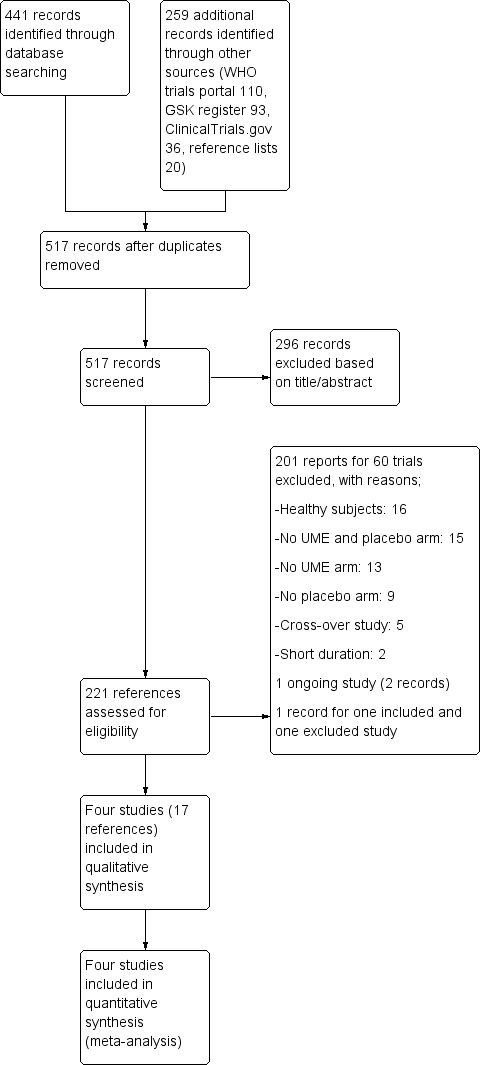
Study flow diagram.

Risk of bias summary: review authors' judgements about each risk of bias item for each included study.

Forest plot of comparison: 1 Umeclidinium bromide versus placebo, outcome: 1.1 Number of participants with exacerbations requiring steroids, antibiotics, or both.
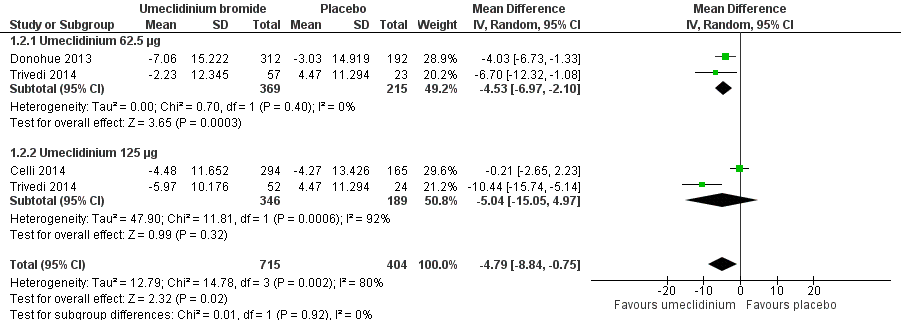
Forest plot of comparison: 1 Umeclidinium bromide versus placebo, outcome: 1.2 Quality of life: change from baseline in SGRQ total score.

Forest plot of comparison: 1 Umeclidinium bromide versus placebo, outcome: 1.8 Number of participants with ≥ 1 unit improvement in TDI focal score.

Forest plot of comparison: 1 Umeclidinium bromide versus placebo, outcome: 1.13 Use of rescue medications (change from baseline in number of puffs per day).
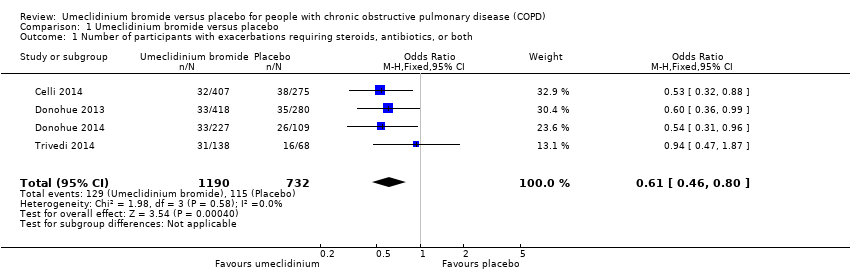
Comparison 1 Umeclidinium bromide versus placebo, Outcome 1 Number of participants with exacerbations requiring steroids, antibiotics, or both.
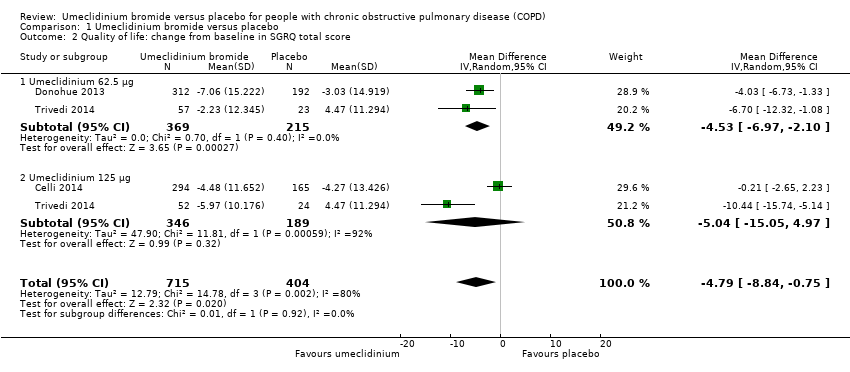
Comparison 1 Umeclidinium bromide versus placebo, Outcome 2 Quality of life: change from baseline in SGRQ total score.
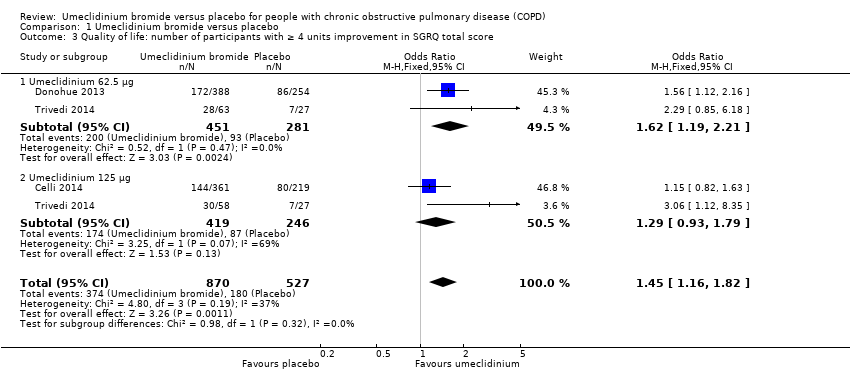
Comparison 1 Umeclidinium bromide versus placebo, Outcome 3 Quality of life: number of participants with ≥ 4 units improvement in SGRQ total score.
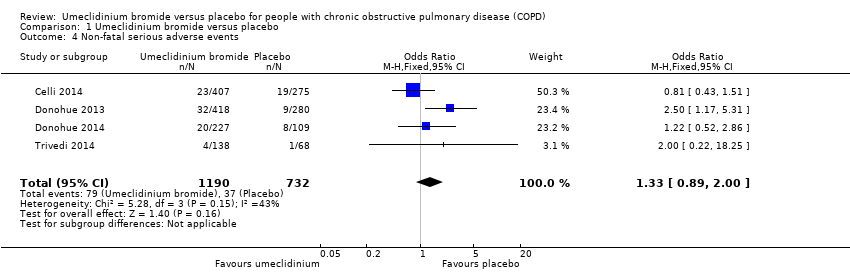
Comparison 1 Umeclidinium bromide versus placebo, Outcome 4 Non‐fatal serious adverse events.

Comparison 1 Umeclidinium bromide versus placebo, Outcome 5 Total number of deaths.

Comparison 1 Umeclidinium bromide versus placebo, Outcome 6 Number of participants with hospital admissions due to COPD exacerbation.

Comparison 1 Umeclidinium bromide versus placebo, Outcome 7 Improvement in symptoms: TDI focal score.

Comparison 1 Umeclidinium bromide versus placebo, Outcome 8 Number of participants with ≥ 1 unit improvement in TDI focal score.

Comparison 1 Umeclidinium bromide versus placebo, Outcome 9 Lung function: change from baseline in trough FEV1 (L).
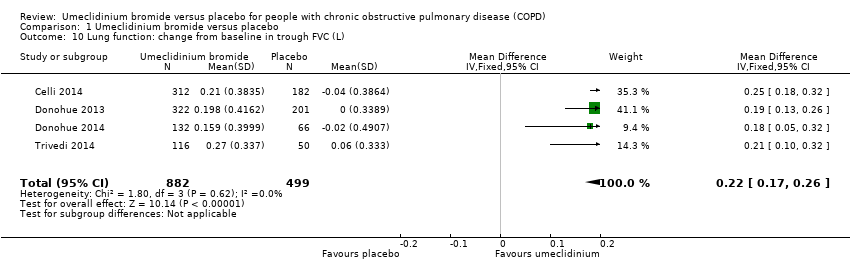
Comparison 1 Umeclidinium bromide versus placebo, Outcome 10 Lung function: change from baseline in trough FVC (L).

Comparison 1 Umeclidinium bromide versus placebo, Outcome 11 Lung function: change from baseline in peak FEV1 (L).

Comparison 1 Umeclidinium bromide versus placebo, Outcome 12 Adverse events (not including serious adverse events).

Comparison 1 Umeclidinium bromide versus placebo, Outcome 13 Use of rescue medications (change from baseline in number of puffs per day).
| Umeclidinium bromide vs placebo for stable chronic obstructive pulmonary disease | ||||||
| Patient or population: people with chronic obstructive pulmonary disease (COPD) | ||||||
| Outcomes | Anticipated absolute effects* (95% CI) | Relative effect | Number of participants | Quality of the evidence | Comments | |
| Risk with placebo | Risk with umeclidinium bromide | |||||
| Number of participants with exacerbations requiring steroids, antibiotics, or both | 157 per 1000 | 102 per 1000 | OR 0.61 | 1922 | ⊕⊕⊕⊕ | |
| Quality of life: number of participants with ≥ 4 units improvement in SGRQ total score | 342 per 1000 | 429 per 1000 | OR 1.45 | 1397 | ⊕⊕⊕⊝ | Mean quality of life: change from baseline in SGRQ total score was 4.79 lower (8.84 lower to 0.75 lower) in umeclidinium group (1119 participants, 3 RCTs) |
| Non‐fatal serious adverse events | 51 per 1000 | 66 per 1000 | OR 1.33 | 1922 | ⊕⊕⊕⊝ | Larger studies may help refine this estimate |
| Number of participants with hospital admissions due to COPD exacerbation | 20 per 1000 | 18 per 1000 | OR 0.86 | 1922 | ⊕⊕⊝⊝ | Few events, so larger studies may help refine this estimate |
| Number of participants with ≥ 1 unit improvement in TDI focal score | 336 per 1000 | 464 per 1000 | OR 1.71 | 1441 | ⊕⊕⊕⊕ | Mean improvement in TDI focal score change from baseline was 0.76 higher (0.43 higher to 1.09 higher) in umeclidinium group (1193 participants, 3 RCTs) |
| Change from baseline in trough FEV1 (L) | Mean change from baseline in trough FEV1 (L) across control groups ranged from 0.123 to 0.139 | Mean change from baseline in trough FEV1 (L) in the intervention group was 0.14 higher (0.12 higher to 0.17 higher) | ‐ | 1381 | ⊕⊕⊕⊕ | |
| Adverse events (not including serious adverse events) | 239 per 1000 | 250 per 1000 | OR 1.06 | 1922 | ⊕⊕⊕⊝ | |
| *The risk in the intervention group (and its 95% confidence interval) is based on assumed risk in the comparison group and relative effect of the intervention (and its 95% CI). | ||||||
| GRADE Working Group grades of evidence | ||||||
| a‐1 for inconsistency: unexplained significant heterogeneity b‐1 for imprecision: the CI includes non‐appreciable benefit and potential harm c‐2 for imprecision: the CI includes both appreciable benefit and harm | ||||||
| Outcome or subgroup title | No. of studies | No. of participants | Statistical method | Effect size |
| 1 Number of participants with exacerbations requiring steroids, antibiotics, or both Show forest plot | 4 | 1922 | Odds Ratio (M‐H, Fixed, 95% CI) | 0.61 [0.46, 0.80] |
| 2 Quality of life: change from baseline in SGRQ total score Show forest plot | 3 | 1119 | Mean Difference (IV, Random, 95% CI) | ‐4.79 [‐8.84, ‐0.75] |
| 2.1 Umeclidinium 62.5 μg | 2 | 584 | Mean Difference (IV, Random, 95% CI) | ‐4.53 [‐6.97, ‐2.10] |
| 2.2 Umeclidinium 125 μg | 2 | 535 | Mean Difference (IV, Random, 95% CI) | ‐5.04 [‐15.05, 4.97] |
| 3 Quality of life: number of participants with ≥ 4 units improvement in SGRQ total score Show forest plot | 3 | 1397 | Odds Ratio (M‐H, Fixed, 95% CI) | 1.45 [1.16, 1.82] |
| 3.1 Umeclidinium 62.5 μg | 2 | 732 | Odds Ratio (M‐H, Fixed, 95% CI) | 1.62 [1.19, 2.21] |
| 3.2 Umeclidinium 125 μg | 2 | 665 | Odds Ratio (M‐H, Fixed, 95% CI) | 1.29 [0.93, 1.79] |
| 4 Non‐fatal serious adverse events Show forest plot | 4 | 1922 | Odds Ratio (M‐H, Fixed, 95% CI) | 1.33 [0.89, 2.00] |
| 5 Total number of deaths Show forest plot | 4 | 1922 | Peto Odds Ratio (Peto, Fixed, 95% CI) | 1.68 [0.52, 5.48] |
| 6 Number of participants with hospital admissions due to COPD exacerbation Show forest plot | 4 | 1922 | Odds Ratio (M‐H, Random, 95% CI) | 0.86 [0.25, 2.92] |
| 6.1 Umeclidinium 62.5 μg | 2 | 801 | Odds Ratio (M‐H, Random, 95% CI) | 3.20 [0.91, 11.24] |
| 6.2 Umeclidinium 125 μg | 3 | 1121 | Odds Ratio (M‐H, Random, 95% CI) | 0.43 [0.18, 1.03] |
| 7 Improvement in symptoms: TDI focal score Show forest plot | 3 | 1193 | Mean Difference (IV, Fixed, 95% CI) | 0.76 [0.43, 1.09] |
| 8 Number of participants with ≥ 1 unit improvement in TDI focal score Show forest plot | 3 | 1441 | Odds Ratio (M‐H, Fixed, 95% CI) | 1.71 [1.37, 2.15] |
| 9 Lung function: change from baseline in trough FEV1 (L) Show forest plot | 4 | 1381 | Mean Difference (IV, Fixed, 95% CI) | 0.14 [0.12, 0.17] |
| 10 Lung function: change from baseline in trough FVC (L) Show forest plot | 4 | 1381 | Mean Difference (IV, Fixed, 95% CI) | 0.22 [0.17, 0.26] |
| 11 Lung function: change from baseline in peak FEV1 (L) Show forest plot | 2 | 1035 | Mean Difference (IV, Fixed, 95% CI) | 0.17 [0.14, 0.19] |
| 12 Adverse events (not including serious adverse events) Show forest plot | 4 | 1922 | Odds Ratio (M‐H, Fixed, 95% CI) | 1.06 [0.85, 1.31] |
| 13 Use of rescue medications (change from baseline in number of puffs per day) Show forest plot | 4 | 1531 | Mean Difference (IV, Fixed, 95% CI) | ‐0.45 [‐0.76, ‐0.14] |