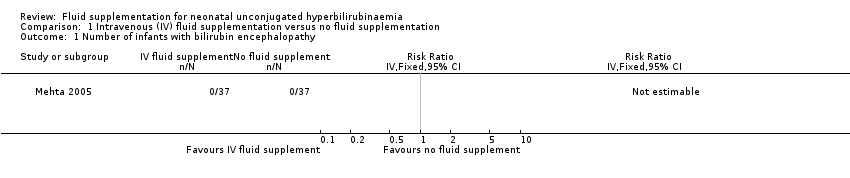
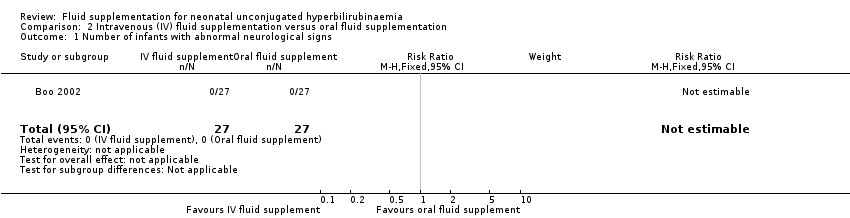
| 1 Number of infants with bilirubin encephalopathy Show forest plot | 1 | | Risk Ratio (IV, Fixed, 95% CI) | Totals not selected |
|
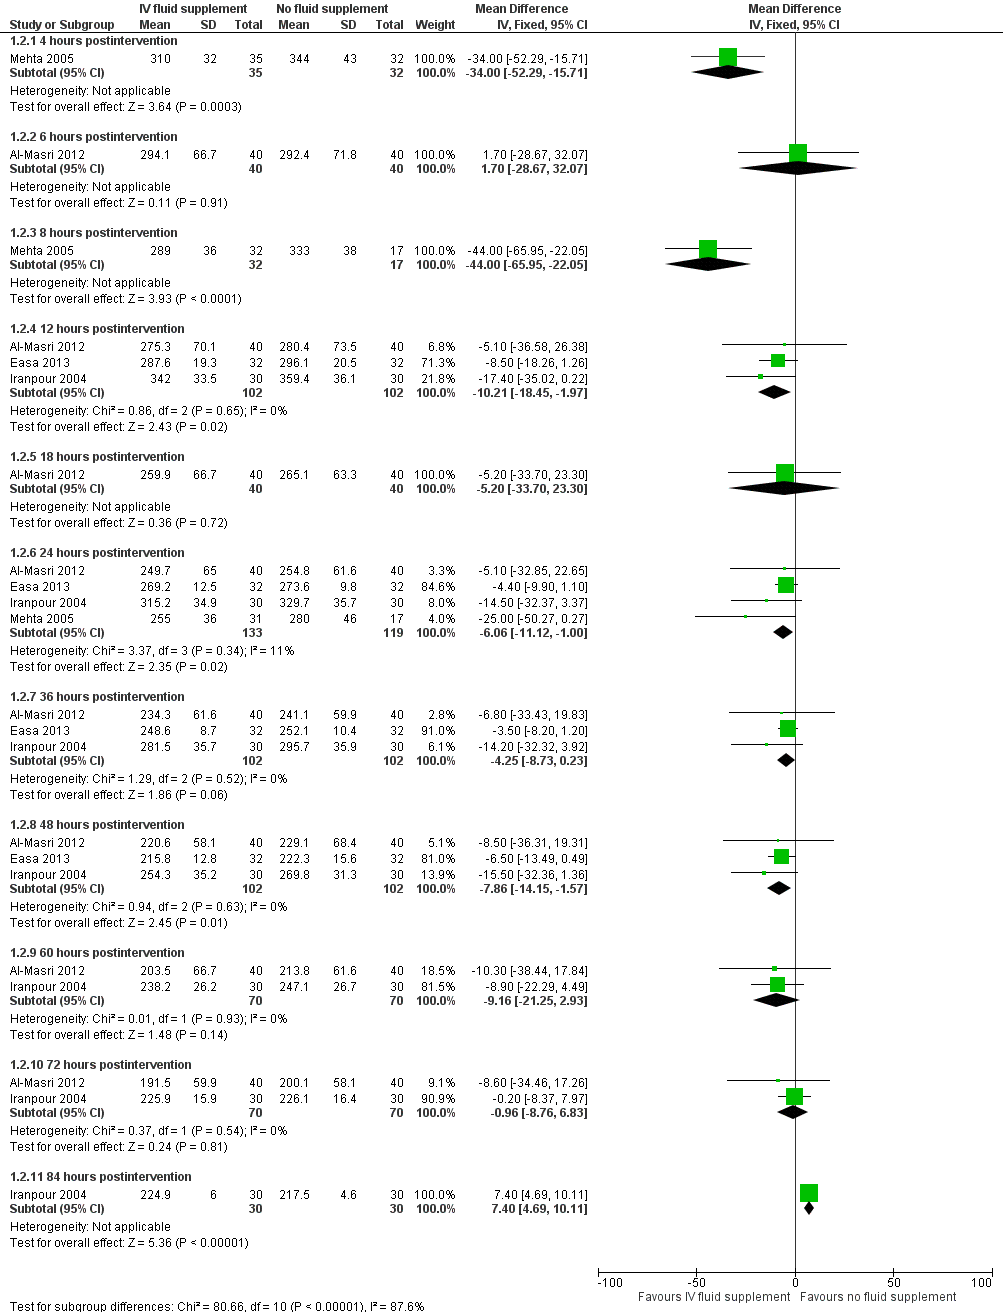
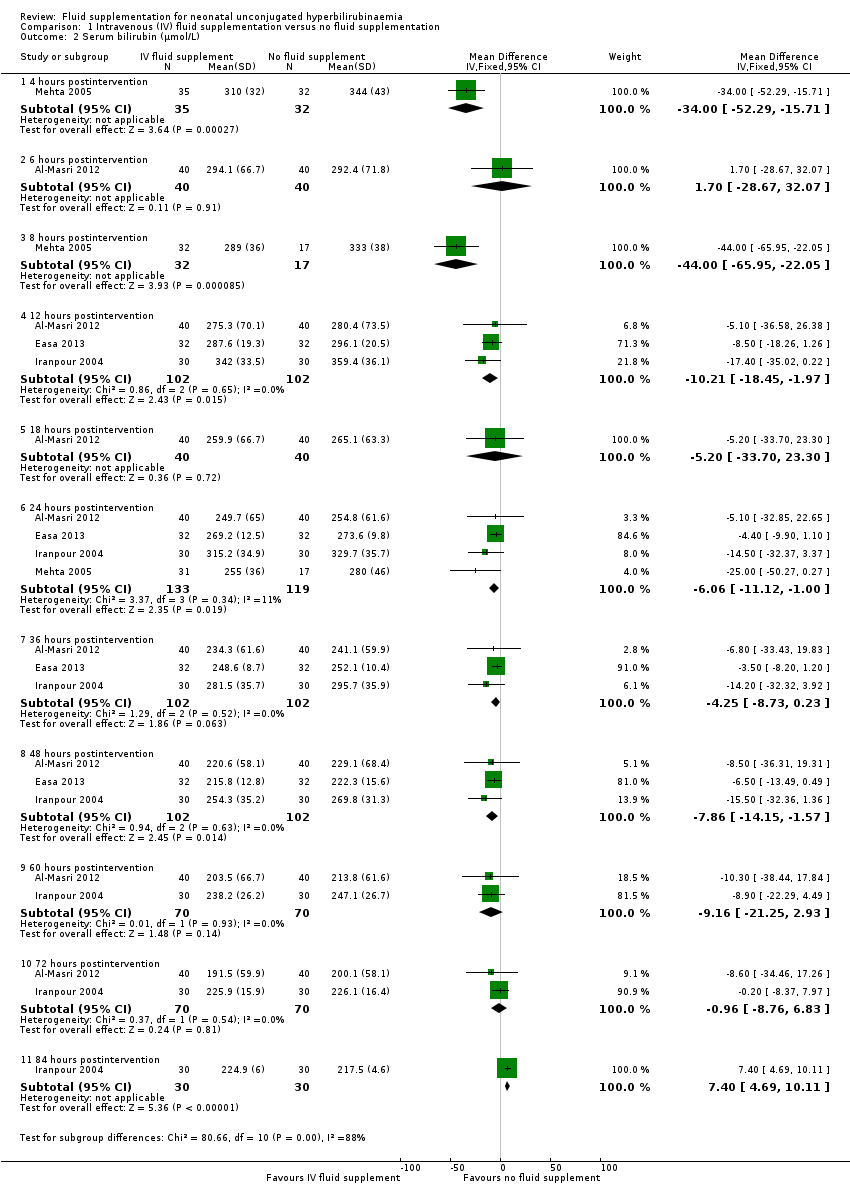
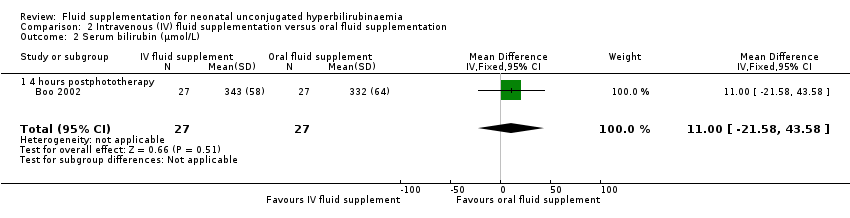
| 2 Serum bilirubin (μmol/L) Show forest plot | 4 | | Mean Difference (IV, Fixed, 95% CI) | Subtotals only |
|
| 2.1 4 hours postintervention | 1 | 67 | Mean Difference (IV, Fixed, 95% CI) | ‐34.0 [‐52.29, ‐15.71] |
| 2.2 6 hours postintervention | 1 | 80 | Mean Difference (IV, Fixed, 95% CI) | 1.70 [‐28.67, 32.07] |
| 2.3 8 hours postintervention | 1 | 49 | Mean Difference (IV, Fixed, 95% CI) | ‐44.0 [‐65.95, ‐22.05] |
| 2.4 12 hours postintervention | 3 | 204 | Mean Difference (IV, Fixed, 95% CI) | ‐10.21 [‐18.45, ‐1.97] |
| 2.5 18 hours postintervention | 1 | 80 | Mean Difference (IV, Fixed, 95% CI) | ‐5.20 [‐33.70, 23.30] |
| 2.6 24 hours postintervention | 4 | 252 | Mean Difference (IV, Fixed, 95% CI) | ‐6.06 [‐11.12, 1.00] |
| 2.7 36 hours postintervention | 3 | 204 | Mean Difference (IV, Fixed, 95% CI) | ‐4.25 [‐8.73, 0.23] |
| 2.8 48 hours postintervention | 3 | 204 | Mean Difference (IV, Fixed, 95% CI) | ‐7.86 [‐14.15, ‐1.57] |
| 2.9 60 hours postintervention | 2 | 140 | Mean Difference (IV, Fixed, 95% CI) | ‐9.16 [‐21.25, 2.93] |
| 2.10 72 hours postintervention | 2 | 140 | Mean Difference (IV, Fixed, 95% CI) | ‐0.96 [‐8.76, 6.83] |
| 2.11 84 hours postintervention | 1 | 60 | Mean Difference (IV, Fixed, 95% CI) | 7.40 [4.69, 10.11] |
| 3 Difference in serum bilirubin (%) Show forest plot | 1 | | Mean Difference (IV, Fixed, 95% CI) | Subtotals only |
|
| 3.1 0‐4 hours of study | 1 | 67 | Mean Difference (IV, Fixed, 95% CI) | 10.5 [6.66, 14.34] |
| 3.2 0‐8 hours of study | 1 | 49 | Mean Difference (IV, Fixed, 95% CI) | 13.0 [7.49, 18.51] |
| 3.3 0‐24 hours of study | 1 | 48 | Mean Difference (IV, Fixed, 95% CI) | 8.0 [1.11, 14.89] |
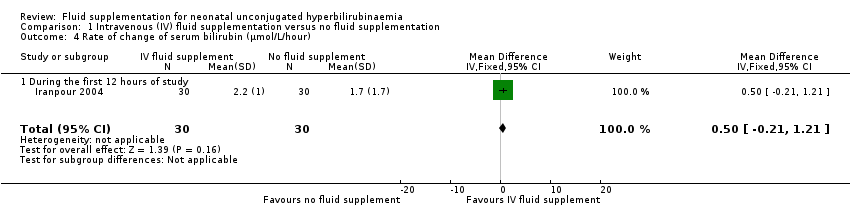
| 4 Rate of change of serum bilirubin (μmol/L/hour) Show forest plot | 1 | 60 | Mean Difference (IV, Fixed, 95% CI) | 0.50 [‐0.21, 1.21] |
|
| 4.1 During the first 12 hours of study | 1 | 60 | Mean Difference (IV, Fixed, 95% CI) | 0.50 [‐0.21, 1.21] |
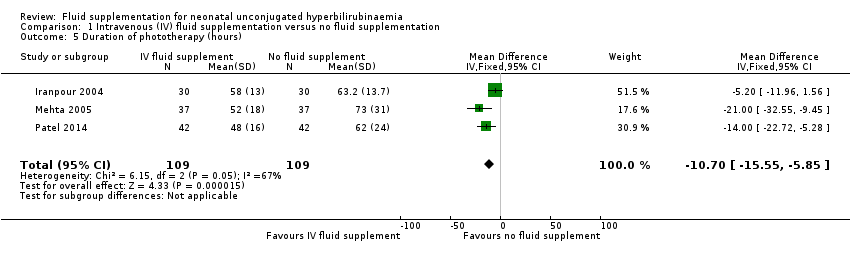
| 5 Duration of phototherapy (hours) Show forest plot | 3 | 218 | Mean Difference (IV, Fixed, 95% CI) | ‐10.70 [‐15.55, ‐5.85] |
|
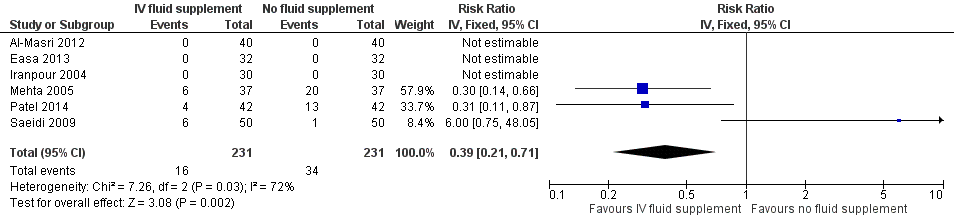
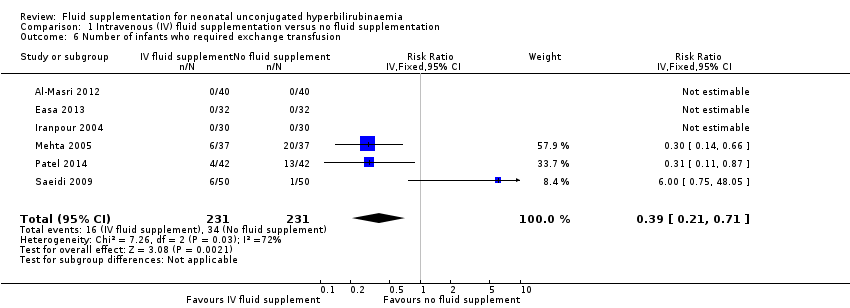
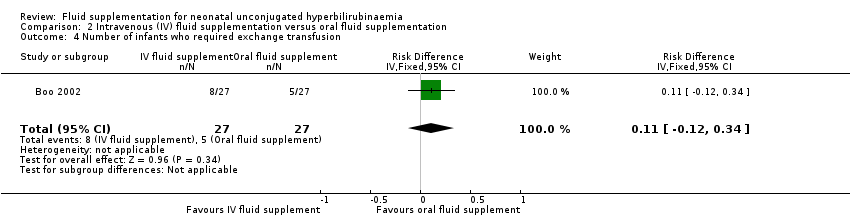
| 6 Number of infants who required exchange transfusion Show forest plot | 6 | 462 | Risk Ratio (IV, Fixed, 95% CI) | 0.39 [0.21, 0.71] |
|
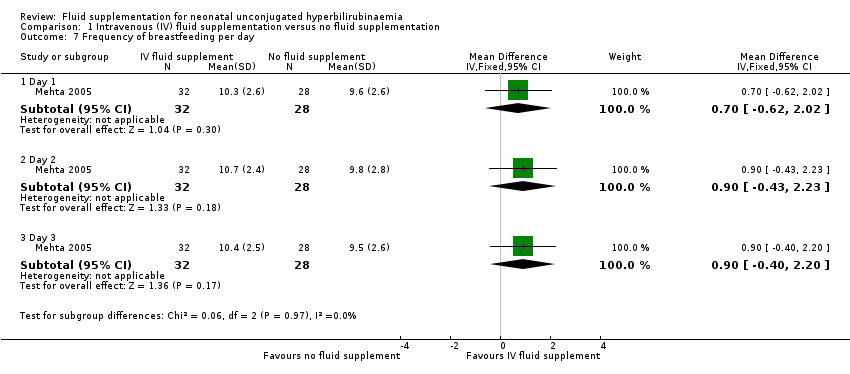
| 7 Frequency of breastfeeding per day Show forest plot | 1 | | Mean Difference (IV, Fixed, 95% CI) | Subtotals only |
|
| 7.1 Day 1 | 1 | 60 | Mean Difference (IV, Fixed, 95% CI) | 0.70 [‐0.62, 2.02] |
| 7.2 Day 2 | 1 | 60 | Mean Difference (IV, Fixed, 95% CI) | 0.90 [‐0.43, 2.23] |
| 7.3 Day 3 | 1 | 60 | Mean Difference (IV, Fixed, 95% CI) | 0.90 [‐0.40, 2.20] |