Augmentation de la dose d'antipsychotique ou changement d'antipsychotique en cas de non‐réponse dans le traitement de la schizophrénie
Résumé scientifique
Contexte
De nombreuses personnes atteintes de schizophrénie ne répondent pas à l’antipsychotique initialement prescrit. Dans de tels cas, une stratégie de traitement pourrait consister à augmenter la dose de l'antipsychotique et une autre stratégie à le remplacer par un autre antipsychotique.
Objectifs
Examiner l'efficacité d'une augmentation de la dose d'antipsychotique par rapport à un changement d'antipsychotique dans le traitement des personnes schizophrènes ne répondant pas au traitement.
Stratégie de recherche documentaire
Nous avons fait des recherches dans le Registre des essais cliniques du groupe Cochrane sur la schizophrénie (10 juin 2014, 6 octobre 2015 et 30 mars 2017). En vue d'autres essais, nous avons étudié les références de toutes les études incluses.
Critères de sélection
Tous les essais contrôlés randomisés (ECR) pertinents comparant l'augmentation de la dose d'antipsychotique par rapport au remplacement par un autre antipsychotique chez les personnes schizophrènes qui n'ont pas répondu à leur traitement antipsychotique initial.
Recueil et analyse des données
Au moins deux auteurs de revue ont extrait les données de manière indépendante. Nous avons analysé les données dichotomiques en utilisant les risques relatifs (RR) et leurs intervalles de confiance (IC) à 95 %. Nous avons analysé les données continues à l'aide de différences moyennes (DM) et de leurs IC à 95 %. Nous avons évalué le risque de biais dans les études incluses et nous avons utilisé GRADE pour créer un tableau de " Résumé des résultats ".
Résultats principaux
Nous incluons un ECR avec des données pertinentes sur 29 participants à cette revue. L'essai a été réalisé en parallèle et en double aveugle, mais les procédures de double aveugle n'ont pas été décrites. L'essai comprenait des personnes qui ne répondaient pas à la fluphénazine administrée à la dose de 20 mg/jour pendant 4 semaines. Les participants ont été assignés au hasard à la poursuite du traitement par la fluphénazine à raison de 20 mg/jour, à une augmentation de la dose de fluphénazine à 80 mg/jour ou au passage à l'halopéridol à raison de 20 mg/jour pendant quatre semaines supplémentaires. Les données n'ont été communiquées que pour 47 des 58 participants initialement randomisés. L'essai a été publié en 1993. Le fait que seul un ECR de petite taille (N = 29) ait été inclus dans l'analyse limite la qualité des preuves. Dans l'ensemble, aucune différence claire n'a été observée entre les groupes en ce qui concerne les trois résultats disponibles : état global (nombre de participants ayant une réponse cliniquement pertinente (RR 1,63, IC à 95 % : 0,17 à 15,99, preuves de très faible qualité) ; état mental général (score du paramètre, BPRS total) (DM 2,00, IC à 95 % : ‐4,20 à 8,20, preuves de très faible qualité) et symptômes négatifs (score du paramètre SANS) (DM : 3,40 ; IC à 95 % : ‐12,56 à 19,36). Aucune donnée n'a été rapportée concernant l'abandon précoce de l'étude, les effets indésirables, le temps passé à l'hôpital, la qualité de vie, la satisfaction à l'égard des soins et le fonctionnement.
Conclusions des auteurs
Les preuves sont extrêmement limitées et aucune conclusion claire ne peut en être tiré. Il est urgent de procéder à d'autres essais afin de déterminer la stratégie de traitement optimale pour les personnes schizophrènes qui ne répondent pas à leur traitement antipsychotique initial.
PICO
Résumé simplifié
Augmenter la dose d'antipsychotique ou le remplacer par un autre antipsychotique pour traiter les schizophrènes qui ne répondent pas au traitement initial
Problématique de la revue
Si une personne schizophrène ne répond pas initialement à un antipsychotique, est‐ce que l'augmentation de la dose de cet antipsychotique est plus efficace et plus sûre que le passage à un autre antipsychotique ?
Contexte
Certaines personnes atteintes du trouble mental grave qu’est la schizophrénie ne réagissent pas complètement (c.‐à‐d. que les symptômes tels que les délires et les hallucinations persistent) à la dose standard du médicament antipsychotique prescrit pour le traitement initial. Dans de tels cas, les cliniciens peuvent envisager d'augmenter la dose d'antipsychotique au‐delà des seuils habituels ou de le remplacer par un autre antipsychotique afin d'accroître l'efficacité des antipsychotiques. Les preuves à l’égard de la stratégie optimale de traitement sont rares.
Recherche de preuves
Le Spécialiste d'information du groupe Cochrane sur la schizophrénie a effectué une recherche électronique (jusqu'au 30 mars 2017) pour trouver des essais randomisés dans lesquels les personnes schizophrènes qui ne répondaient pas à leur traitement antipsychotique initial ont ensuite reçu soit une dose antipsychotique plus élevée soit un médicament antipsychotique différent. Neuf‐cent‐deux enregistrements ont été trouvés et vérifiés par les auteurs de la revue.
Eléments de preuve découverts
Un seul essai a satisfait aux exigences de la revue et a fourni des données utilisables. Des données ont été fournies sur le nombre de participants qui ont répondu au traitement, l'état mental général des participants à la fin de l'essai et la présence de symptômes négatifs à la fin. Aucune donnée n'était disponible pour d’autres résultats. Aucune différence claire n'a été démontrée entre l'augmentation de la dose de l'antipsychotique et le remplacement par un antipsychotique différent. Les preuves disponibles étaient extrêmement limitées et de très faible qualité.
Conclusions
Les résultats de la présente revue montrent qu'il n'existe pas de données probantes de qualité suffisante pour aider les cliniciens à choisir entre l'augmentation de la dose d'antipsychotique ou le remplacement par un autre médicament antipsychotique chez les personnes qui ne répondent pas à au traitement antipsychotique initial. Par conséquent, aucune conclusion claire ne peut être tirée. Des essais de plus grande envergure et bien conçus sont nécessaires.
Authors' conclusions
Summary of findings
| Increasing the antipsychotic dose compared to switching the antipsychotic drug for non responsein schizophrenia | ||||||
| Patient or population: patients with non response in schizophrenia | ||||||
| Outcomes | Illustrative comparative risks* (95% CI) | Relative effect | No of Participants | Quality of the evidence | Comments | |
| Assumed risk | Corresponding risk | |||||
| Switching the atipsychotic drug | Increasing the antipsychotic dose | |||||
| Global state: Clinically relevant response – as defined by trial | 77 per 1000 | 125 per 1000 | RR 1.63 | 29 | ⊕⊝⊝⊝ | |
| Leaving the study early: Tolerability ‒leaving the study early due to side effects | See comment | See comment | Not estimable | 0 | See comment | No studies reported on this outcome. |
| Leaving the study early: Acceptability ‒leaving the study early due to any reason | See comment | See comment | Not estimable | 0 | See comment | No studies reported on this outcome, |
| General mental state ‒BPRS total score at endpoint* | The mean general mental state ‒ BPRS total score at endpoint in the control groups was | The mean general mental state ‐ BPRS total score at endpoint in the intervention groups was | 29 | ⊕⊝⊝⊝ | Data for prespecified outcome: Clinically important change were not reported. | |
| Adverse effects ‒at least one adverse effect | See comment | See comment | Not estimable | 0 | See comment | No studies reported on this outcome. |
| Service use ‒time in hospital | See comment | See comment | Not estimable | 0 | See comment | No studies reported on this outcome. |
| Quality of life ‒average change in quality of life | See comment | See comment | Not estimable | 0 | See comment | No studies reported on this outcome. |
| *The basis for the assumed risk (e.g. the median control group risk across studies) is provided in footnotes. The corresponding risk (and its 95% confidence interval) is based on the assumed risk in the comparison group and the relative effect of the intervention (and its 95% CI). | ||||||
| GRADE Working Group grades of evidence | ||||||
| 1 Imprecision: total (cumulative) sample size was just 29 participants and 95% confidence interval around the estimate of effect included no effect and appreciable benefit and appreciable harm; thus, very serious imprecision was present. | ||||||
Background
A considerable number of people with schizophrenia do not respond to the first antipsychotic drug they are given at a dose their clinicians consider should be adequate (Barnes 2003; Lehmann 2004). Instead, they require multiple trials with different drugs before a satisfactory response is reached. Various strategies are used in such situations such as adding other antipsychotics, adding other psychotropic agents (e.g. mood stabilisers), increasing dose or switching to another antipsychotic. But which strategy is the best one is not clear. Switching antipsychotics is frequently applied in clinical practice, but there are many open questions. Is switching effective at all, for which drugs and after how much time? Guidelines originally recommended waiting for four to eight weeks before switching to another drug, arguing that the full efficacy of a given drug is reached after a longer period of treatment (Lehmann 2004; Falkai 2005). Recent data suggest, however, that non‐responders can be detected as early as two weeks after initiation of treatment (Agid 2003; Samara 2015). Another general possibility is to increase the dose of the currently prescribed antipsychotic. This approach is based on the premise that increasing the dose of an antipsychotic drug would lead to enhanced treatment efficacy (Kinon 2004). We aimed in this review to examine which strategy — increasing the antipsychotic dose or switching the antipsychotic drug — is the more promising in people who have not responded to an initial antipsychotic treatment.
Description of the condition
Schizophrenia is a chronic and disabling psychiatric disorder. It usually has an early onset and severe symptoms. It is one of the leading causes worldwide of long‐term disability, with devastating impact for patients and their families. The degree of distress and disability is considerable; employment rates vary between 4.5% and 50% (Bouwmans 2015); and lifetime suicide prevalence is estimated around 5% (Palmer 2005). Quality of life for people suffering from schizophrenia is significantly low and it usually deteriorates during the course of the disease.
Antipsychotic medication is the current treatment of choice in schizophrenia (Kane 1996). Unfortunately, a large number of people experience no significant improvement despite pharmacological treatment (Lieberman 2005). These patients are often labelled as 'non‐responders'. The exact epidemiology of this phenomenon is not clearly understood, one reason being that the criteria for non response or treatment resistance differ (Howes 2017). But guidelines say that approximately 20% to 30% of patients do not respond to an adequate trial of an antipsychotic drug (Lehmann 2004). There are no clear predictors of non response to antipsychotics, but it is well established that people with a first episode respond better than chronic patients (Jäger 2007).
Description of the intervention
Increasing the antipsychotic dose and switching the antipsychotic drug are two alternative strategies in the case of initial non response; it cannot be stated a priori which one is the intervention and which one the comparator. Thus, we briefly describe both.
Increasing the antipsychotic dose in non‐responsive people with schizophrenia is often carried out in incremental steps: the dose is systematically increased until a clinical response is reached or the side effects become too severe and no further gain in efficacy is obtained. In the 1970s and 1980s there was a notion that people with schizophrenia might benefit from mega doses of antipsychotics which might speed onset of action (sometimes called "rapid neuroleptisation"). Although this concept has been largely abandoned, because narrative reviews suggested that these excessive doses are not more efficacious in "general" patients (Baldessarini 1988), there is a possibility that some non‐responders benefit from such doses. One reason could be that a considerable proportion of patients (up to 7% of Caucasians; Steijns 1998) have genetic polymorphism of liver enzymes of the CYP system which lead to a too‐rapid metabolism of antipsychotics and non response. It could therefore be that at least some individual patients might well need higher doses beyond the officially approved ranges. A list of target doses and maximum doses recommended by international experts in schizophrenia is provided by Gardner 2010, for example. If higher doses than those approved by official labels are given, the major risk for people with schizophrenia is that they might experience more pronounced or severe side effects such as extrapyramidal symptoms, weight gain and prolonged QT interval.
Switching the antipsychotic drug can be broadly defined as changing a currently prescribed drug to a different one. For the current review, the reason for switching that we were interested in was due to insufficient therapeutic response to the original antipsychotic. Antipsychotics can be switched abruptly or gradually, and the timing of switching is also important; that is, how long an initial pharmacological treatment should have lasted. The major risk for people with schizophrenia can be that by switching from one antipsychotic to another, time is lost while patients would have benefited from staying on the same drug. Moreover at some stage during the switching process, patients are usually on two drugs which can lead to more side effects.
How the intervention might work
The idea behind increasing the antipsychotic dose is that for a non‐responsive person with schizophrenia, an individual threshold of sensitivity has to be reached for the drug to be effective. It is well known that considerable individual differences exist in respect to the pharmacokinetics of antipsychotics, which directly influence their efficacy (Miller 2009). A major factor are differences in the expression of cytochrome P450 enzymes which are responsible for the metabolism of many antipsychotic drugs. Polymorphisms in the genes coding these enzymes exist and can lead to their excessive expression and thus too‐fast elimination of drugs (so called "ultrarapid metabolisers") and subsequent non response (Steijns 1998). More recent work suggested that some of the individual differences in response to antipsychotic drugs might have their source in the variability of ABCB1 genotypes, meaning that individuals with a favourable genotypic configuration show a lower risk of developing refractoriness to increasing antipsychotic dose (Vijayan 2012).
The idea behind switching the antipsychotic drug is based on the following: while all antipsychotics block dopamine receptors, they differ substantially in their effects on other receptors (Arnt 1998). Therefore, it could be that patients who do not respond to one antipsychotic drug might well respond to another one. Moreover, even when focusing only on the dopamine receptors there might be differences between individual patients. For example, a recent meta‐analysis established that variations in the dopamine receptor D2 (DRD2) gene encoding the D₂ dopamine receptor are associated with clinical response to antipsychotic treatment (Zhang 2010).
Why it is important to do this review
It is estimated that between one‐fifth and one‐third of people with schizophrenia do not respond adequately to standard antipsychotic treatment (Barnes 2003). One of the major challenges in pharmacological treatment of the disorder is to help such patients to achieve complete remission of symptoms. Next to continuing a current treatment and hoping that patients will start responding with the passing of time, two competing strategies exist: increasing the dose of an antipsychotic; or switching to another one. Unfortunately, there is a lack of clear evidence to what extent these strategies are effective. Our aim is to provide a family of related systematic reviews of this topic in order to contribute to a more evidence‐based clinical practice. The review is also potentially important for policy makers, because the high frequency of non response and treatment resistance leads to high rates of disability and thus costs for society (Vos 2012).
This review is part of three 'sibling' Cochrane Reviews, investigating non response in people with schizophrenia (the others being Increasing antipsychotic dose for non response in schizophrenia (Helfer 2015); and Reducing antipsychotic dose for people with schizophrenia (title only)).
Objectives
To examine the efficacy of increasing the antipsychotic dose versus switching the antipsychotic drug in the treatment of non‐responsive people with schizophrenia.
Methods
Criteria for considering studies for this review
Types of studies
All relevant randomised controlled trials. If a trial had been described as 'double‐blind' but randomisation was implied, we would have included such trials in a sensitivity analysis (see Sensitivity analysis). We excluded quasi‐randomised studies, such as those allocating by alternate days of the week. If people were given additional treatments within increasing dose or switching groups, we only included data if the adjunct treatment was evenly distributed between groups and it was only the increasing dose and switching groups that were randomised.
Types of participants
Adults, however defined, with schizophrenia or related disorders, including schizophreniform disorder, schizoaffective disorder and delusional disorder, by any means of diagnosis, who were non‐responsive to their current antipsychotic treatment, irrespective of age, gender or race. We accepted any definition of non response that was used in the individual studies. It is a general strategy of the Cochrane Schizophrenia Group to also include studies which did not use operationalised diagnostic criteria such as those of the Diagnostic and Statistical Manual of Mental Disorders (DSM‐5), because in clinical routine practice such criteria are not meticulously used either.
Types of interventions
1. Dose increase
Any increase of the antipsychotic dose, irrespectively of how it was defined. The new doses could be either within recommended target dose ranges as described in the antipsychotics' labels or international recommendations, or higher (Gardner 2010).
2. Switching
Switching one antipsychotic to any other one, independently of the switching method or the time when the switch was made. There was no restriction in terms of the dose of the second antipsychotic, but if the dose of the new drug did not obviously match that of the original one (using Gardner 2010 as a standard), we recorded such details in our Assessment of risk of bias in included studies.
Types of outcome measures
We planned to divide, if possible, all outcomes into short term (up to 3 months), medium term (more than 3 months and up to 6 months) and long term (more than 6 months).
We reported binary outcomes, recording clear and clinically meaningful degrees of change (e.g. global impression of 'much improved', or more than 50% improvement on a rating scale, as defined within the trials) before any others. Thereafter we listed outcomes that are continuous.
Primary outcomes
1. Global state: clinically relevant response ‒ as defined by trials*
* We expected that different trials would used different definitions of response. But studies have shown that, as long as relative measures of risk (relative risks, odds ratios) are applied, meta‐analytic results do not differ much depending on the exact cut‐off applied (Furukawa 2011).
2. Global state: exacerbations of psychosis ‒ as defined by the authors
Secondary outcomes
1. Leaving the study early
1.1 Tolerability ‒ leaving early due to adverse effects
1.2 Acceptability ‒ leaving the study early due to any reason
1.3 Efficacy ‒ leaving early due to inefficacy of treatment
2. Mental state
2.1 General mental state
2.1.1 Clinically important change in general mental state ‒ as defined by each of the studies
2.1.2 Average endpoint general mental state score
2.1.3 Average change in general mental state scores
2.2 Positive symptoms
2.2.1 Clinically important change in positive symptoms ‒ as defined by each of the studies
2.2.2 Average endpoint positive symptom score
2.2.3 Average change in positive symptom scores
2.3 Negative symptoms
2.3.1 Clinically important change in negative symptoms ‒ as defined by each of the studies
2.3.2 Average endpoint negative symptom score
2.3.3 Average change in negative symptom scores
3. Depression
3.1 Clinically important change in depressive symptoms ‒ as defined by each of the studies
3.2 Average endpoint depressive symptom score
3.3 Average change in depressive symptom scores
4. Aggressive behaviour
4.1 Clinically important change in aggressive behaviour ‒ as defined by each of the studies
4.2 Average endpoint aggressive behaviour score
4.3 Average change in aggressive behaviour score
5. Exacerbations of psychosis (as defined by the individual studies)
5.1 Time ill (number of days in exacerbation)
6. Service use
6.1 Hospitalisation ‒ time in hospital (days)
7. Adverse effects
7.1 At least one adverse effect
7.2 Specific side effects (as defined by the original authors, based on any reference values they applied)
8. Quality of life
8.1 Clinically important change in quality of life ‒ as defined by each of the studies
8.2 Average endpoint quality of life
8.3 Average change in quality of life
9. Satisfaction with care
9.1 Clinically important change in satisfaction with care ‒ as defined by each of the studies
9.2 Average endpoint satisfaction with care
9.3 Average change in satisfaction with care
'Summary of findings' table
We used the GRADE approach to interpret findings (Schünemann 2011); and the GRADE profiler to export data from this review and create the 'Summary of findings' table (GRADE pro GDT). 'Summary of findings' tables provide outcome‐specific information concerning the overall quality of evidence from each included study in the comparison, the magnitude of effect of the interventions examined, and the sum of available data on all outcomes that review authors rate as important to patient care and decision making.
We aimed to select the following main outcomes for inclusion in the 'Summary of findings' table.
-
Global state: clinically relevant response ‒ as defined by trial.
-
Leaving the study early: tolerability ‒ leaving early due to side effects.
-
Leaving the study early: acceptability ‒ leaving early due to any reason.
-
General mental state ‒ clinically important change in general mental state.
-
Adverse effects ‒ at least one adverse effect.
-
Service use ‒ time in hospital.
-
Quality of life ‒ clinically important change in quality of life.
If data were not available for these pre‐specified outcomes but were available for ones that are similar, we presented the closest outcome to the pre‐specified one in the table but took this into account when grading the finding.
Search methods for identification of studies
We did not apply any language restrictions, within the limitations of the search tools.
Electronic searches
1. Cochrane Schizophrenia Group’s Study‐Based Register of Trials
On 30 March 2017, the Information Specialist searched the register using the following search strategies:
(Dosage Increasing* AND Switch*) in Intervention Field of STUDY
This register is compiled by systematic searches of major resources (including AMED, BIOSIS, CINAHL, Embase, MEDLINE, PsycINFO, PubMed, and registries of clinical trials) and their monthly updates; handsearches; grey literature; and conference proceedings (see Group Module). There are no language, date, document type, or publication status limitations for inclusion of records in the register.
For previous searches, see Appendix 1.
Searching other resources
1. Reference searching
We inspected references of the included study for further relevant studies.
2. Personal contact
We contacted the first author of the included study for information regarding unpublished trials.
Data collection and analysis
Selection of studies
Two authors (MS and EK) independently inspected citations from the searches and identified relevant abstracts. Where disputes arose, we obtained the full‐text reports for further assessment. We retrieved full reports of conference proceedings meeting the review criteria; the two authors (MS and EK) inspected these independently. We resolved disagreements by discussion with a third author (SL). If it had not been possible to resolve disagreement by discussion, we would have attempted to contact the authors of the study for clarification.
Data extraction and management
1. Extraction
Two authors (MS and EK) independently extracted data from the included study. We discussed any disagreement and, if necessary, consulted a third author (SL). We documented our decisions and, if necessary, we would have attempted to contact authors of the study for clarification. We would have extracted data presented only in graphs and figures whenever necessary and possible.
2. Management
2.1 Forms
We extracted data using pre‐standardised data extraction forms.
2.2 Scale‐derived data
We included continuous data from rating scales only if:
a) the psychometric properties of the measuring instrument have been described in a peer‐reviewed journal (Marshall 2000);
b) the measuring instrument had not been written or modified by one of the trialists for that particular trial; and
c) the instrument is not a global assessment of an area of functioning and not sub‐scores which are not, in themselves, validated or shown to be reliable. However there are exceptions: we would have included sub‐scores from mental state scales measuring positive and negative symptoms of schizophrenia.
Ideally the measuring instrument should either be i. a self‐report or ii. completed by an independent rater or relative (not the therapist). We realise that this is not often reported clearly; in 'Description of studies' we noted if this is the case or not.
2.3 Endpoint versus change data
There are advantages of both endpoint and change data. Change data can remove a component of between‐person variability from the analysis. On the other hand calculation of change needs two assessments (baseline and endpoint) which can be difficult in unstable and difficult‐to‐measure conditions such as schizophrenia. We decided to primarily use endpoint data, and only use change data if the latter were not available. We combined endpoint and change data as we preferred to use mean differences (MD) rather than standardised mean differences (Deeks 2011).
2.4 Skewed data
Continuous data on clinical and social outcomes are often not normally distributed. To avoid the pitfall of applying parametric tests to non‐parametric data, we aimed to apply the following standards to relevant continuous data before inclusion.
Standard deviations (SDs) and means that are reported in the paper or obtained from the authors.
For endpoint data from studies including fewer than 200 participants:
-
when a scale starts from the finite number zero, we would have subtracted the lowest possible value from the mean, and divided this by the standard deviation. If this value is lower than one, it strongly suggests that the data are skewed and we would exclude these data. If this ratio is higher than one but less than two, there is a suggestion that the data are skewed: we would enter these data and test whether their inclusion or exclusion would change the results substantially. If such data changed results we would enter as 'other data'. Finally, if the ratio is larger than two we would included these data, because it is less likely that they are skewed (Altman 1996; Higgins 2011a).
-
if a scale starts from a positive value (such as the Positive and Negative Syndrome Scale (PANSS), which can have values from 30 to 210 (Kay 1986)), we would modify the calculation described above to take the scale starting point into account. In these cases skewed data are present if 2 SD > (S − S min), where S is the mean score and 'S min' is the minimum score.
Please note: we would have entered all relevant data from studies of more than 200 participants in the analysis irrespective of the above rules, because skewed data pose less of a problem in large studies. We also would have entered all relevant change data, as when continuous data are presented on a scale that includes a possibility of negative values (such as change data), it is difficult to tell whether or not data are skewed.
2.5 Common measure
To facilitate comparison between trials, we intended to convert variables that could be reported in different metrics, such as days in hospital (mean days per year, per week or per month) to a common metric (e.g. mean days per month).
2.6 Conversion of continuous to binary
Where possible, we converted outcome measures to dichotomous data. This can be done by identifying cut‐off points on rating scales and dividing participants accordingly into 'clinically improved' or 'not clinically improved'. It is generally assumed that if there is a 50% reduction in a scale‐derived score such as the Brief Psychiatric Rating Scale (BPRS) or the Positive and Negative Syndrome Scale (PANSS) (Overall 1962; Kay 1986), this can be considered as a clinically significant response (Leucht 2005a; Leucht 2005b). If data based on these thresholds were not available, we used the primary cut‐off presented by the original authors.
2.7 Direction of graphs
Where possible, we decided to enter data in such a way that the area to the left of the line of no effect would indicate a favourable outcome for the increased dose group. If this way made it impossible to avoid outcome titles with clumsy double‐negatives (e.g. 'Not non‐improved'), we decided to report data where the left of the line would indicate a favourable outcome for the switching group and noted this in the relevant graphs.
Assessment of risk of bias in included studies
Two authors (MS and EK) worked independently to assess risk of bias by using criteria described in the Cochrane Handbook for Systematic Reviews of Interventions (Higgins 2011b). This set of criteria is based on evidence of associations between overestimate of effect and high risk of bias of the article such as sequence generation, allocation concealment, blinding, incomplete outcome data and selective reporting.
If the authors disagreed, we would have made the final rating by consensus with involvement of a third author (SL). If inadequate details of randomisation and other characteristics of the trial were provided, we would have to contacted study authors in order to obtain further information. We would have reported non‐concurrence in quality assessment.
We noted the level of risk of bias in the text of the review (Risk of bias in included studies), the Characteristics of included studies table and summary of findings Table for the main comparison.
Measures of treatment effect
1. Binary data
For binary outcomes we calculated standard estimations of risk ratios (RRs) and their 95% confidence intervals (CIs). It has been shown that RRs are more intuitive than odds ratios (ORs) (Boissel 1999), and that ORs tend to be interpreted as RRs by clinicians (Deeks 2000). The number needed to treat for an additional beneficial outcome (NNTB) and the number needed to treat for an additional harmful outcome (NNTH) with their CIs are intuitively attractive to clinicians but can be problematic both in terms of accurate calculation in meta‐analyses and interpretation (Hutton 2009). For binary data presented in the 'Summary of findings' table, where possible we calculated illustrative comparative risks.
2. Continuous data
For continuous outcomes we estimated mean difference (MD) between groups. We preferred not to calculate effect size measures (standardised mean difference SMD). However, if scales of very considerable similarity were used, we presumed there was a small difference in measurement, and we calculated effect size and transformed the effect back to the units of one or more of the specific instruments.
Unit of analysis issues
1. Cluster trials
Studies increasingly employ 'cluster randomisation' (such as randomisation by clinician or practice) but analysis and pooling of clustered data poses problems. Firstly, authors often fail to account for intra‐class correlation in clustered studies, leading to a 'unit of analysis' error (Divine 1992), whereby P values are spuriously low, CIs unduly narrow and statistical significance overestimated. This causes type I errors (Bland 1997; Gulliford 1999).
If clustering had not been accounted for in primary studies, we would have presented data in a table, with a (*) symbol to indicate the presence of a probable unit of analysis error. We would have attempted to contact first authors of studies to obtain intra‐class correlation coefficients for their clustered data and to adjust for this by using accepted methods (Gulliford 1999). Where clustering is incorporated into the analysis of primary studies, we would have presented these data as if from a non‐cluster randomised study, but adjusted for the clustering effect.
We have sought statistical advice and have been advised that binary data as presented in a report should be divided by a 'design effect'. This can be calculated using the mean number of participants per cluster (m) and the intraclass correlation coefficient (ICC) [Design effect = 1 + (m − 1) * ICC] (Donner 2002). If the ICC were not reported we would have assumed it to be 0.1 (Ukoumunne 1999).
If cluster studies had been appropriately analysed taking into account intra‐class correlation coefficients and relevant data documented in the report, synthesis with other studies would be possible using the generic inverse variance technique.
2. Cross‐over trials
A major concern of cross‐over trials is the carry‐over effect. It occurs if an effect (e.g. pharmacological, physiological or psychological) of the treatment in the first phase is carried over to the second phase. As a consequence on entry to the second phase the participants can differ systematically from their initial state despite a wash‐out phase. For the same reason cross‐over trials are not appropriate if the condition of interest is unstable (Elbourne 2002). As both effects are very likely in people with severe mental illness, we would have used only the data of the first phase of cross‐over studies.
3. Studies with multiple treatment groups
Where a study involves more than two treatment arms, if relevant we would have presented the additional treatment arms in comparisons. If data were binary we would simply have added and combined within the two‐by‐two table. If data were continuous we would have combined data following the formula in the Cochrane Handbook for Systematic Reviews of Interventions (Higgins 2011a). Where the additional treatment arms were not relevant, we would not have used these data.
Dealing with missing data
1. Overall loss of credibility
We share the concern that at some degree of loss to follow‐up, data must lose credibility (Xia 2010). However, it remains unclear which degree of attrition is problematic. Therefore, we did not exclude studies on the basis of degree of attrition, but considered attrition in our 'Risk of bias' assessment.
2. Binary
We decided to present data on a 'once randomised, always analyse' basis (an intention‐to‐treat (ITT) analysis). Those leaving the study early were all assumed to have the same rates of outcome as those who completed.
3. Continuous
3.1 Assumptions about participants who left the trials early or who were lost to follow‐up
Various methods are available to account for participants who left the trials early or were lost to follow‐up. Some trials just present the results of study completers, others use the method of 'last observation carried forward' (LOCF) (Leucht 2007), while more recently methods such as multiple imputation or mixed‐effects models for repeated measurements have become more of a standard. While the second two methods seem to be somewhat better than LOCF (Leon 2006), we feel that the high percentage of participants leaving the studies early and differences in the reasons for leaving the studies early between groups is often the core problem in randomised schizophrenia trials. We therefore did not exclude studies based on the statistical approach used. However, we preferably used the more sophisticated approaches e.g. mixed‐effects models for repeated measurements or multiple‐imputation instead of LOCF, and we only presented completer analyses if some kind of ITT data were not available at all. Moreover, we addressed this issue in the item "incomplete outcome data" of the 'Risk of bias' tool.
3.2 Standard deviations
If standard deviations (SDs) were not reported, we tried to obtain the missing values from the authors. If SDs were not available, but an exact standard error (SE) and confidence intervals (CIs) were available for group means, and either the P value or t value were available for differences in the mean, we decided to calculate them according to the rules described in the Cochrane Handbook for Systematic Reviews of Interventions (Higgins 2011a). When only the standard error (SE) was reported, SDs were calculated by the formula SD = SE * √(n). The Cochrane Handbook for Systematic Reviews of Interventions presents detailed formulae for estimating SDs from P values, t or F values, CIs, ranges or other statistics (Higgins 2011a). If these formulae did not apply, we decided to calculate the SDs according to a validated imputation method which is based on the SDs of the other included studies (Furukawa 2006). Although some of these imputation strategies can introduce error, the alternative would be to exclude a given study’s outcome and thus to lose information. We nevertheless decided to examine the validity of the imputations in a sensitivity analysis excluding imputed values.
Assessment of heterogeneity
1. Clinical heterogeneity
If we had included more than one study, we would have considered all included studies initially, without seeing comparison data, to judge clinical heterogeneity. We simply would have inspected all studies for clearly outlying people or situations which we had not predicted would arise. When such situations or participant groups arose, we would have discussed these.
2. Methodological heterogeneity
If we had included more than one study, we would have considered all included studies initially, without seeing comparison data, to judge methodological heterogeneity. We simply would have inspected all studies for clearly outlying methods which we had not predicted would arise. When such methodological outliers arose, we would have discussed these.
3. Statistical heterogeneity
3.1 Visual inspection
We would have visually inspected graphs to investigate the possibility of statistical heterogeneity.
3.2 Employing the I² statistic
We would have investigated statistical heterogeneity between studies by considering the I² statistic alongside the P value of the Chi² test. The I² statistic provides an estimate of the percentage of inconsistency thought to be due to chance (Higgins 2003). The importance of the observed value of the I² statistic depends on both the magnitude and direction of effects and the strength of evidence for heterogeneity (e.g. P value from the Chi² test, or CIs for the I² statistic). We would have considered an I² statistic estimate equal to or greater than 50%, accompanied by a statistically significant Chi² test (P value < 0.01) as evidence of substantial heterogeneity (Deeks 2011). If substantial levels of heterogeneity were found in the primary outcome, we would have explored reasons for heterogeneity (Subgroup analysis and investigation of heterogeneity).
Assessment of reporting biases
Reporting biases arise when the dissemination of research findings is influenced by the nature and direction of results (Egger 1997). These are described in Chapter 10 of the Cochrane Handbook for Systematic Reviews of Interventions (Sterne 2011).
1. Protocol versus full study
We tried to locate the protocol of the included trial. If the protocol is available, we compared outcomes in the protocol and in the published report . If the protocol is not available, we compared outcomes listed in the Methods section of the trial report with actually reported results.
We tried to locate the protocol of the included trial. If the protocol had been available, we would have compared outcomes in the protocol and in the published report. As the protocol was not available, we compared outcomes listed in the Methods section of the trial report with actually reported results.
2. Funnel plot
We are aware that funnel plots may be useful in investigating reporting biases but are of limited power to detect small‐study effects. We did not plan to use funnel plots for outcomes where there are 10 or fewer studies, or where all studies are of similar size. If funnel plots are possible in future versions, we will seek statistical advice in their interpretation.
Data synthesis
We understand that there is no closed argument for preferring the use of a fixed‐effect model over a random‐effects models, or a random‐effects model over a fixed‐effect model. The random‐effects method incorporates an assumption that the different studies are estimating different, yet related, intervention effects. This does seem true to us as we (a priori) expected some clinical heterogeneity between participants in different trials. We therefore chose the random‐effects model for all analyses (DerSimonian 1986). There is, however, a disadvantage to the random‐effects model: it puts added weight onto small studies which often are the most biased ones. Depending on the direction of effect, these studies can either inflate or deflate the effect size.
Subgroup analysis and investigation of heterogeneity
1. Subgroup analyses
1.1 Antipsychotic drugs
We planned to perform subgroup analyses based on the antipsychotic drugs included in the selected studies.
1.2 Clinical state, stage or problem
We proposed to undertake this review and provide an overview of the effects of switching for people with schizophrenia in general. In addition, however, we aimed to report data on subgroups of people in the same clinical state, stage and with similar problems.
2. Investigation of heterogeneity
We planned to report relevant findings if heterogeneity was found to be high. Firstly, we would have investigated whether data had been entered correctly. Secondly, if data were correct, we would visually inspect the graph and particularly the studies outside of the company of the rest in order to identify reasons that might explain the heterogeneity. Decisions as to whether single studies are to be excluded from the analysis or whether a formal meta‐analysis can be undertaken at all depend on issues such as whether the heterogeneity was due to differences in direction of effect or only to the degree of the differences between intervention and control (Higgins 2011a). If unanticipated clinical or methodological heterogeneity had been obvious we would simply have stated hypotheses regarding these for future reviews or versions of this review. We did not anticipate undertaking analyses relating to these.
Sensitivity analysis
1. Implication of randomisation
We aimed to include trials in a sensitivity analysis if they were described in some way as to imply randomisation. For the primary outcomes we planned to include these studies and if their inclusion did not result in a substantive difference, they would have remained in the analyses. If their inclusion resulted in important clinically significant differences — but not necessarily statistically significant differences — we planned not to add the data from these lower‐quality studies to the results of the better trials, but would have presented such data within a subcategory.
2. Risk of bias
We aimed to analyse the effects of excluding trials that were judged to be at high risk of bias across one or more of the domains; see Assessment of risk of bias in included studies. If the exclusion of trials at high risk of bias did not substantially alter the direction of effect or the precision of the effect estimates, we would have included data from these trials in the analysis. Studies with a high risk of bias in terms of randomisation or allocation concealment would have been excluded right from the start. If randomisation and allocation methods were described (and risk of bias was rated as unclear) we planned to enter such trials in a sensitivity analysis.
3. Imputed values
If assumptions had to be made regarding missing SDs (see Dealing with missing data), we planned to compare the findings of the primary outcomes when we used our assumption/s and when we used data only from studies which provided SDs.
We also planned to undertake a sensitivity analysis to assess the effects of including data from trials where imputed values for ICC in calculating the design effect in cluster randomised trials were used.
4. Fixed effect and random effects
We synthesised data using a random‐effects model; however, if possible, we would have synthesised data for the primary outcomes using a fixed‐effect model to evaluate whether this would alter the results.
If substantial differences had been noted in the direction or precision of effect estimates in any of the sensitivity analyses listed above, we would not have pooled data from the excluded trials with the other trials contributing to the outcome, but would have presented them separately.
Results
Description of studies
For substantive description of studies please see Characteristics of included studies and Characteristics of excluded studies.
Results of the search
The initial search of the Cochrane Schizophrenia Group Trials Register in June 2014 yielded 543 records. We additionally made two later searches of the same Trials Register (using the same search strategy), one in October 2015 which yielded 358 records and one in March 2017 which yielded one record. After we removed duplicates, we screened 819 records and excluded 781 at abstract and title stage. We obtained and closely inspected 38 full‐text reports on 26 studies; and as a result we included one study (referring to two full‐text reports) and excluded 25 studies (referring to 36 full‐text reports) (see Figure 1).

Study flow diagram for trial selection up to March 2017
Included studies
Only one study met inclusion criteria for this review (Kinon 1993). The study was published in 1993 (for more details, see Characteristics of included studies and the accompanying 'Risk of bias' table).
1. Study design
Kinon 1993 had two phases. The first phase was an open‐label, non‐comparative design. The second phase was a double‐blind, randomised, interventional design.
2. Length of trial
Kinon 1993 had a total duration of eight weeks; each phase had a duration of four weeks. In the first phase, all participants received fluphenazine 20 mg/day plus benztropine 4 mg/day openly for four weeks. Non‐responders of the first phase then entered the second, double‐blind phase of another four weeks' duration.
3. Participants
One hundred and fifty‐six participants entered the study. Out of 115 participants that completed the first four weeks of treatment, 37 were responders and 78 were non‐responders. Fifty‐eight of the 78 non‐responder participants entered the double‐blind phase of the study, but data were presented only for 47 of them (see also Characteristics of included studies).
All 156 participants initially entering the Kinon 1993 study were inpatients and had a diagnosis of schizophrenia (76.9%), schizoaffective disorder (16.7%) or schizophreniform disorder (6.4%) according to DSM‐III‐R criteria (American Psychiatric Association 1987). One hundred participants were men; 56 were women. The mean age of participants was 29.4 ± 7.0 years, the age at first hospitalisation was 23.0 ± 6.5 years and the number of previous hospitalisations was 2.6 ± 2.2.
4. Interventions
In the second phase of the Kinon 1993 study, 58 participants (of the 78 non‐responders to fluphenazine 20 mg/day during the first phase of the study) were randomly assigned to double‐blind treatment with either fluphenazine 20 mg/day, fluphenazine 80 mg/day or haloperidol 20 mg/day, all supplemented with benztropine. Data were available for 47 out of 58 participants entering the double‐blind phase of the study: fluphenazine 20 mg/day (N = 18), fluphenazine 80 mg/day (N = 16) and haloperidol 20 mg/day (N = 13). For the purpose of the present review, 29 participants were of interest (fluphenazine 80 mg/day (N = 16) and haloperidol 20 mg/day (N = 13)).
5. Outcomes
5.1 Outcome scales
A variety of scales were used to assess clinical response and adverse events. Details of scales that provided usable data are shown below.
5.1.1 Global state
Clinical Global Impression ‒ CGI (Guy 1976)
CGI is a 7‐point rating instrument that is commonly used in studies on schizophrenia. It enables clinicians to quantify severity of illness (CGI‐Severity) or overall clinical improvement (CGI‐Improvement) during therapy with low scores indicating decreased severity or greater improvement.
5.1.2 Mental state
Brief Psychiatric Rating Scale ‒ BPRS (Overall 1962)
The BPRS is a scale used to measure the severity of psychiatric symptoms, including psychotic symptoms. The scale has usually 18 items (depending on the version the number of items could vary from 16 to 24), and each item is rated on a 7‐point scoring system varying from 'not present' (1) to 'extremely severe' (7). Higher scores indicate more pronounced symptomatology.
Scale for the Assessment of Negative Symptoms ‒ SANS (Andreasen 1982)
The SANS is a scale used to measure the severity of negative symptoms in schizophrenia. The scale is used to evaluate five domains of symptoms: alogia; affective blunting; avolition‒apathy; anhedonia‒asociality; and attention impairment. Each symptom is rated on a 6‐point scoring system varying from 'absent' (0) to 'severe' (5). Higher scores indicate more pronounced symptomatology.
5.1.3 Adverse events
Simpson Angus Scale ‒ SAS (Simpson 1970)
This 10‐item scale, with a scoring system of 0 to 4 for each item, measures drug‐induced parkinsonism, a short‐term drug‐induced movement disorder. A low score indicates low levels of parkinsonism.
Excluded studies
We excluded 36 full‐text articles on 26 trials. We excluded three studies because they were not appropriately randomised (Suzuki 2007; Agid 2013; Kim 2013). We excluded the remaining studies because of wrong interventions, e.g. no antipsychotic dose increase group or no antipsychotic switching group.
Risk of bias in included studies
For graphical representations of our judgements of risk of bias please refer to Figure 2 and Figure 3. Full details of judgements are seen in the ‘Risk of bias’ table.

Risk of bias graph: review authors' judgements about each risk of bias item presented as percentages across all included studies.
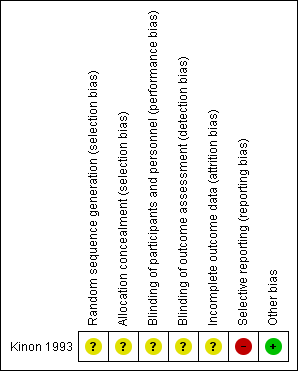
Risk of bias summary: review authors' judgements about each risk of bias item for each included study.
Allocation
Concerning random sequence generation and allocation concealment, we rated Kinon 1993 with an unclear risk of bias for both; it was described as "randomised", but no detail on allocation concealment was provided.
Blinding
Concerning performance bias and detection bias, we rated Kinon 1993 with an unclear risk of bias; it was described as "double‐blind", but no detail was provided regarding blinding of participants, personnel or assessors.
Incomplete outcome data
Concerning attrition bias, we rated Kinon 1993 with an unclear risk of bias since the issue of numbers leaving the study early was not addressed. Furthermore, data were presented for just 81% (47/58) of all randomised participants.
Selective reporting
Concerning reporting bias, we rated Kinon 1993 with a high risk of bias since SAS scores were available only for two items and not total.
Other potential sources of bias
We judged Kinon 1993 to be free of other potential sources of bias.
Effects of interventions
We did not perform any meta‐analysis as only one study was included in the review. In the first phase of Kinon 1993, all participants received fluphenazine 20 mg/day plus benztropine 4 mg/day openly for 4 weeks. In the second phase, 58 non‐responders to fluphenazine 20 mg/day of the first phase were randomly assigned to double‐blind treatment with either fluphenazine 20 mg/day, fluphenazine 80 mg/day or haloperidol 20 mg/day, all supplemented with benztropine 4 mg/day. Data were reported only for 47 out of 58 initially randomised participants.
See: summary of findings Table for the main comparison of the available outcomes for the comparison 'Increasing the antipsychotic dose versus switching the antipsychotic drug'.
1. Increasing the antipsychotic dose versus switching the antipsychotic drug
1.1 Global state
1.1.1 Clinically relevant response ‒ as defined by the authors
Kinon 1993 provided data on the number of responders. Response was defined by a combination of criteria: a rating of 'mild' or better on each of the four BPRS psychotic items and a rating of 'much improved' or better in CGI‐Improvement scale. Two out of 16 participants in the dose increase group, one out of 13 participants in the switching the antipsychotic drug group and one out of 18 participants in the continuing with the same dose and drug group were judged to be responders. There was no clear difference between the antipsychotic dose increase group versus the antipsychotic switching group in this regard (RR 1.63, CI 0.17 to 15.99, 1 RCT, N = 29, very low quality evidence,Analysis 1.1).
1.2 Mental state
1.2.1 General mental state ‒ average endpoint score (BPRS total, high = poor)
Kinon 1993 reported the average BPRS total score at endpoint per group (dose increase: 40.2 points ± 10.4 versus switching: 38.2 points ± 6.5). There was no clear difference between antipsychotic dose increase versus antipsychotic switching group in this regard (MD 2.00, CI −4.20 to 8.20, 1 RCT, N = 29, very low quality evidence, Analysis 1.2 ).
1.2.2 Negative symptoms ‒ average endpoint score (SANS, high = poor)
Kinon 1993 reported the average SANS total score at endpoint per group (dose increase: 55.5 ± 26 versus switching: 52.1 ± 17.67). There was no clear difference between antipsychotic dose increase versus antipsychotic switching group in this regard (MD 3.40, CI −12.56 to 19.36, 1 RCT, N = 29, Analysis 1.3).
2. Subgroup analysis and investigation of heterogeneity
Only one study was included in our review. Therefore, no subgroup analysis could be performed.
3. Publication bias
Only one study was included in our review. Therefore, a funnel plot analysis could not be performed.
4. Sensitivity analyses
Only one study was included in our review. Therefore, no sensitivity analysis could be performed.
Discussion
Summary of main results
Despite our comprehensive search we included just one small study — Kinon 1993 — in the present review. Kinon 1993 compared increasing the antipsychotic dose versus switching the antipsychotic drug versus continuation with the same antipsychotic dose and drug in people with schizophrenia or related disorders who were non‐responsive to their initial antipsychotic treatment. The included study was published in 1993. The initial phase was open treatment with fluphenazine 20 mg/day for four weeks. Non‐responders were then randomised to increasing the fluphenazine dose to 80 mg/day, switching to haloperidol 20 mg/day or continuing treatment with fluphenazine at the same, initial dose of 20 mg/day for four additional weeks. No difference in any efficacy outcome (clinical response, BPRS at endpoint, SANS at endpoint) was shown among the three alternative treatment options.
Overall completeness and applicability of evidence
Only one study examined whether dose increase is more efficacious than switching the antipsychotic drug in people with schizophrenia not responding to their current antipsychotic treatment. We excluded studies that did not exclusively examine non‐responders, but included participants with treatment intolerance as well, from the present review. Conclusions based on the data of the present systematic review are extremely limited by the inclusion of only one RCT with a small number of participants and only three reported outcomes. All in all, at present there is insufficient evidence to draw any firm conclusions and more studies are needed.
Quality of the evidence
Kinon 1993 was described as randomised and double‐blind, but no detail was provided. Therefore it is unclear whether the study was adequately randomised, whether treatment allocation was really concealed and whether blinding worked. Moreover, the study did not address missing outcome data, either in numbers leaving early or regarding reasons, and did not report on other pre‐specified outcomes of importance such as adverse effects, service use and quality of life. But even for the three outcomes (clinical response, overall mental state and negative symptoms) that were adequately reported, the sample size was not large enough (N = 29) to detect any clear difference even if a difference existed (i.e. type II error). Overall the quality of the evidence of Kinon 1993 was very low for all outcomes based on GRADE (Schünemann 2011).
Potential biases in the review process
We attempted to limit bias in every step of the review process. We pre‐specified and published the study protocol, our search was comprehensive, our selection criteria were clear and strict, we extracted all outcomes and at least two authors selected the studies and extracted the data. But we mainly based the search on the Cochrane Schizophrenia’s register of trials which is largely made up of searches of published literature. Therefore, it is possible that there are unpublished studies that we are not aware of and there is a possibility of publication bias. Moreover, we were unable to undertake the proposed funnel plot to investigate the presence of publication bias since only one study was included in this review.
Agreements and disagreements with other studies or reviews
An expert consensus recommended increasing the antipsychotic dose, especially for second generation and depot antipsychotics, before considering switching the antipsychotic drug to a different agent (Kane 2003). Nevertheless, schizophrenia treatment guidelines acknowledge that limited evidence exists in favour of increasing the antipsychotic dose outside the recommended dose ranges for patients with schizophrenia who do not respond to their initial antipsychotic treatment (Lehmann 2004; Buchanan 2010; Hasan 2012). On the other hand, it is recognized that some studies indicate that a switch from first‐generation antipsychotics (FGAs) or second‐generation antipsychotics (SGAs) to certain SGAs might be promising (Hasan 2012). Previous reviews examining the alternative treatment strategies in case of non response to initial antipsychotic treatment — Leucht 2013, Leucht 2015 and Dold 2014 — also only found the Kinon 1993 study for the specific comparison of increasing the dose versus switching the drug, but differences in the inclusion and exclusion criteria were present and no quantitative synthesis (meta‐analysis) was planned to be conducted.

Study flow diagram for trial selection up to March 2017

Risk of bias graph: review authors' judgements about each risk of bias item presented as percentages across all included studies.

Risk of bias summary: review authors' judgements about each risk of bias item for each included study.

Comparison 1 Increasing the antipsychotic dose versus switching the atipsychotic drug, Outcome 1 Global state: clinically relevant response – as defined by trial.
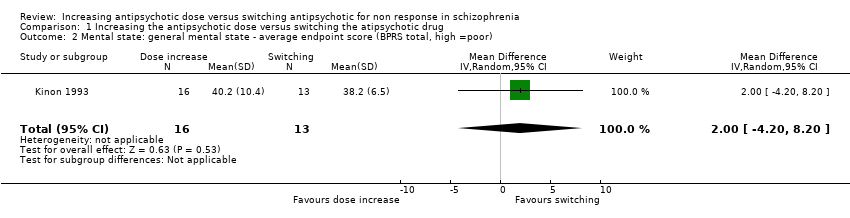
Comparison 1 Increasing the antipsychotic dose versus switching the atipsychotic drug, Outcome 2 Mental state: general mental state ‐ average endpoint score (BPRS total, high =poor).

Comparison 1 Increasing the antipsychotic dose versus switching the atipsychotic drug, Outcome 3 Mental state: negative symptoms ‐ average endpoint score (SANS, high = poor).
| Methods | Randomisation: random |
| Participants | Diagnosis: people with schizophrenia, schizoaffective disorder or schizophreniform disorder N > 450 |
| Interventions | All participants firstly receive treatment with one antipsychotic drug for at least 2 weeks. Those participants who do not at least minimally improve after 2 weeks, are considered non‐responders and are randomised to: 1. increasing the dose of the initial antipsychotic drug above the officially recommended dose range; or 2. switching the initial antipsychotic drug to another one with a different receptor profile; or 3. continuing treatment with the initial antipsychotic drug and at the same, initial dose (within the officially recommended dose range). |
| Outcomes | Response (defined as PANSS or BPRS decrease ≥ 50%)* Relapse Leaving the study early due to any reason Leaving the study early due to side effects General mental state: average change in general mental state scores Adverse effects: at least one adverse effect; clinically important general adverse effects; sudden and unexpected death Service use: time in hospital Quality of life All outcomes by time ‒ short term (up to 12 weeks), medium term (13 to 26 weeks) and long term (over 26 weeks) |
| Notes | *Primary outcome of interest |
| Increasing the antipsychotic dose compared to switching the antipsychotic drug for non responsein schizophrenia | ||||||
| Patient or population: patients with non response in schizophrenia | ||||||
| Outcomes | Illustrative comparative risks* (95% CI) | Relative effect | No of Participants | Quality of the evidence | Comments | |
| Assumed risk | Corresponding risk | |||||
| Switching the atipsychotic drug | Increasing the antipsychotic dose | |||||
| Global state: Clinically relevant response – as defined by trial | 77 per 1000 | 125 per 1000 | RR 1.63 | 29 | ⊕⊝⊝⊝ | |
| Leaving the study early: Tolerability ‒leaving the study early due to side effects | See comment | See comment | Not estimable | 0 | See comment | No studies reported on this outcome. |
| Leaving the study early: Acceptability ‒leaving the study early due to any reason | See comment | See comment | Not estimable | 0 | See comment | No studies reported on this outcome, |
| General mental state ‒BPRS total score at endpoint* | The mean general mental state ‒ BPRS total score at endpoint in the control groups was | The mean general mental state ‐ BPRS total score at endpoint in the intervention groups was | 29 | ⊕⊝⊝⊝ | Data for prespecified outcome: Clinically important change were not reported. | |
| Adverse effects ‒at least one adverse effect | See comment | See comment | Not estimable | 0 | See comment | No studies reported on this outcome. |
| Service use ‒time in hospital | See comment | See comment | Not estimable | 0 | See comment | No studies reported on this outcome. |
| Quality of life ‒average change in quality of life | See comment | See comment | Not estimable | 0 | See comment | No studies reported on this outcome. |
| *The basis for the assumed risk (e.g. the median control group risk across studies) is provided in footnotes. The corresponding risk (and its 95% confidence interval) is based on the assumed risk in the comparison group and the relative effect of the intervention (and its 95% CI). | ||||||
| GRADE Working Group grades of evidence | ||||||
| 1 Imprecision: total (cumulative) sample size was just 29 participants and 95% confidence interval around the estimate of effect included no effect and appreciable benefit and appreciable harm; thus, very serious imprecision was present. | ||||||
| Outcome or subgroup title | No. of studies | No. of participants | Statistical method | Effect size |
| 1 Global state: clinically relevant response – as defined by trial Show forest plot | 1 | 29 | Risk Ratio (M‐H, Random, 95% CI) | 1.63 [0.17, 15.99] |
| 2 Mental state: general mental state ‐ average endpoint score (BPRS total, high =poor) Show forest plot | 1 | 29 | Mean Difference (IV, Random, 95% CI) | 2.0 [‐4.20, 8.20] |
| 3 Mental state: negative symptoms ‐ average endpoint score (SANS, high = poor) Show forest plot | 1 | 29 | Mean Difference (IV, Random, 95% CI) | 3.40 [‐12.56, 19.36] |