Administración intravesical de fármacos electromotrices para el cáncer de vejiga sin invasión muscular
Resumen
Antecedentes
La administración de fármacos electromotrices (AFEM) incluye el uso de corriente eléctrica para mejorar la administración de los agentes intravesicales con objeto de reducir el riesgo de recidiva en pacientes con cáncer de vejiga sin invasión muscular (CVSIM). No está clara su eficacia en comparación con otras formas de tratamiento intravesical.
Objetivos
Evaluar los efectos de la AFEM intravesical para el tratamiento del CVSIM.
Métodos de búsqueda
Se realizó una búsqueda exhaustiva mediante el uso de múltiples bases de datos (CENTRAL, MEDLINE, EMBASE), dos registros de ensayos clínicos y un archivo de literatura gris. Se buscaron las listas de referencias de las publicaciones y las actas de resúmenes relevantes. No se aplicaron restricciones de idiomas. La última búsqueda fue febrero 2017.
Criterios de selección
Se buscaron estudios aleatorios que compararan la AFEM de cualquier agente intravesical usado para reducir la recidiva del cáncer de vejiga conjuntamente con la resección transuretral del tumor vesical (RTUTV).
Obtención y análisis de los datos
Dos autores de la revisión examinaron de forma independiente la bibliografía, extrajeron los datos, evaluaron el riesgo de sesgo y calificaron la calidad de la evidencia (CE) según GRADE en una base por resultado.
Resultados principales
Se incluyeron tres ensayos con 672 participantes que describieron cinco comparaciones distintas. El mismo investigador principal realizó los tres ensayos. Todos los estudios usaron mitomicina C (MMC) como el agente quimioterapéutico para la AFEM.
1. Inducción posoperatoria con AFEM‐MMC versus inducción posoperatoria con Bacillus Calmette‐Guérin (BCG): basado en un estudio con 72 participantes con carcinoma in situ (CIS) y carcinoma urotelial pT1 concurrente, no existe seguridad (CE muy baja) acerca del efecto de la AFEM‐MMC sobre el tiempo hasta la recidiva (cociente de riesgos [CR] 1,06; intervalo de confianza [IC] del 95%: 0,64 a 1,76; correspondiente a 30 más por 1000 participantes, IC del 95%: 180 menos a 380 más). No hubo evolución de la enfermedad en ninguno de los brazos de tratamiento a los tres meses de seguimiento. No existe seguridad (CE muy baja) acerca de los eventos adversos graves (CR 0,75; IC del 95%: 0,18 a 3,11).
2 Inducción posoperatoria con AFEM‐MMC versus inducción con difusión pasiva (DP) de MMC: basado en un estudio con 72 participantes con CIS y carcinoma urotelial pT1 concurrente, la AFEM‐MMC posoperatoria puede (CE baja) reducir la recidiva de la enfermedad (CR 0,65; IC del 95%: 0,44 a 0,98; correspondiente a 147 menos por 1000 participantes, IC del 95%: 235 menos a 8 menos). No hubo evolución de la enfermedad en ninguno de los brazos de tratamiento a los tres meses de seguimiento. No existe seguridad (CE muy baja) acerca del efecto de la AFEM‐MMC en los eventos adversos graves (CR 1,50; IC del 95%: 0,27 a 8,45).
3. AFEM‐MMC posoperatoria con inducción secuencial de BCG y mantenimiento versus inducción posoperatoria de BCG y mantenimiento: basado en un estudio con 212 participantes con carcinoma urotelial pT1 de la vejiga con o sin CIS, la AFEM‐MMC posoperatoria con BCG secuencial puede resultar (CE baja) en un tiempo más prolongado hasta la recidiva (cociente de riesgos instantáneos [CRI] 0,51; IC del 95%: 0,34 a 0,77; correspondiente a 181 menos por 1000 participantes, IC del 95%: 256 menos a 79 menos) y un tiempo más prolongado hasta la progresión (CRI 0,36; IC del 95%: 0,17 a 0,75; correspondiente a 63 menos por 1000 participantes, IC del 95%: 82 menos a 24 menos). No existe seguridad (CE muy baja) acerca del efecto de la AFEM‐MMC en los eventos adversos graves (CR 1,02; IC del 95%: 0,21 a 4,94).
4. AFEM‐MMC preoperatoria de dosis única versus DP‐MMC posoperatoria de dosis única: basado en un estudio con 236 participantes con carcinoma urotelial primario pT1 y pTa, la AFEM‐MMC preoperatoria probablemente resulta (CE moderada) en un tiempo más prolongado hasta la recidiva (CRI 0,47; IC del 95%: 0,32 a 0,69; correspondiente a 247 menos por 1000 participantes, IC del 95%: 341 menos a 130 menos) para una mediana de seguimiento de 86 meses. No existe seguridad (CE muy baja) acerca del efecto de la AFEM‐MMC en el tiempo hasta la progresión (CRI 0,81; IC del 95%: 0,00 a 259,93; correspondiente a 34 menos por 1000 participantes, IC del 95%: 193 menos a 807 más) y los eventos adversos graves (CR 0,79; IC del 95%: 0,30 a 2,05).
5. AFEM‐MMC preoperatoria de dosis única versus RTUTV solamente: basado en un estudio con 233 participantes con carcinoma urotelial primario pT1 y pTa, la AFEM‐MMC preoperatoria probablemente resulta (CE moderada) en un tiempo más prolongado hasta la recidiva (CRI 0,40; IC del 95%: 0,28 a 0,57; correspondiente a 304 menos por 1000 participantes, IC del 95%: 390 menos a 198 menos) para una mediana de seguimiento de 86 meses. No existe seguridad (CE muy baja) acerca del efecto de la AFEM‐MMC en el tiempo hasta la progresión (CRI 0,74; IC del 95%: 0,00 a 247,93; correspondiente a 49 menos por 1000 participantes, IC del 95%: 207 menos a 793 más) o los eventos adversos graves (CRI 1,74; IC del 95%: 0,52 a 5,77).
Conclusiones de los autores
Aunque la AFEM para aplicar la MMC intravesical puede dar lugar a un retraso en el tiempo hasta la recidiva en poblaciones de pacientes seleccionadas, no existe seguridad acerca de su impacto sobre los eventos adversos graves en todos los contextos. Las razones comunes de la disminución de la CE fueron las limitaciones y la imprecisión de los estudios. Una posible función de la administración de MMC basada en AFEM puede residir en los ámbitos en no se dispone de los agentes más establecidos (como el BCG). En el contexto de una CE baja o muy baja para la mayoría de las comparaciones, la confianza en los cálculos del efecto es limitada y los tamaños verdaderos del efecto pueden ser significativamente diferentes de los informados aquí.
PICO
Resumen en términos sencillos
Técnica de administración de fármacos con corriente eléctrica para el tratamiento del cáncer de vejiga sin invasión muscular
Pregunta de la revisión
¿En los pacientes con cáncer de vejiga sin invasión muscular (CVSIM), cómo se comparan los métodos con corriente eléctrica para aplicar la medicación con los métodos sin corriente eléctrica?
Antecedentes
El CVSIM es un cáncer (tumor) del recubrimiento interno de la vejiga que puede eliminarse del interior con instrumentos pequeños y una fuente de luz, lo cual se denomina cirugía endoscópica. Estos tumores pueden reaparecer con el transcurso del tiempo y propagarse a las capas más profundas de la pared vesical. Se sabe que los diferentes tipos de medicación que pueden instilarse en la vejiga ayudan a prevenir lo anterior. Los investigadores han considerado la administración de corriente eléctrica para lograr que la medicación funcione mejor. En esta revisión, se deseó descubrir si la administración de corriente eléctrica fue mejor o peor que ninguna administración de corriente eléctrica.
Características de los estudios
La evidencia está actualizada hasta el 7 febrero 2017. Se encontraron tres estudios que se realizaron entre 1994 y 2003 con 672 participantes que compararon cinco formas diferentes de dar este tratamiento. La mitomicina (MMC) fue el único fármaco utilizado junto con corriente eléctrica. Los tres estudios provienen del mismo equipo de investigación.
Resultados clave
Existe mucha inseguridad en cuanto a si la administración de una corriente eléctrica para administrar un ciclo de MMC después de la cirugía endoscópica es mejor o peor en comparación con la administración de un ciclo de Bacillus Calmette‐Guérin (BCG; vacuna generalmente utilizada en la tuberculosis) o la MMC sin corriente eléctrica. La MMC administrada con corriente eléctrica junto con BCG durante un período prolongado puede ser mejor que el BCG solo para retardar la recidiva del tumor y su propagación a la capa más profunda de la pared vesical. La administración de una dosis de MMC con corriente eléctrica antes de la cirugía endoscópica puede ser mejor que una dosis de MMC sin corriente eléctrica después de la cirugía o la cirugía sola sin tratamiento adicional. No existe seguridad sobre si los pacientes presentan más o menos probabilidades de tener reacciones adversas causadas por estos tratamientos.
Calidad de la evidencia
La calidad de la evidencia fue baja o muy baja para la mayoría de los tratamientos comparados, lo cual significa que a menudo no hubo seguridad acerca de si los hallazgos fueron ciertos. Es probable que la investigación adicional cambie estos hallazgos.
Authors' conclusions
Summary of findings
| Participants: people with non‐muscle invasive bladder cancer (multifocal carcinoma in situ or concurrent pT1, or both) Setting: multicentre study in Italy (all comparisons in the review stemmed from same study group) Intervention: initial 6 MMC‐EMDA intravesical instillations at weekly interval about 3 weeks after TURBT Control: initial 6 BCG intravesical instillations at weekly interval about 3 weeks after TURBT | |||||
| Outcomes | No of participants | Quality of the evidence | Relative effect | Anticipated absolute effects* (95% CI) | |
| Risk with BCG | Risk difference with postoperative MMC‐EMDA | ||||
| Time to recurrence Follow‐up: mean 3 months | 72 | ⊕⊝⊝⊝ | RR 1.06 | Study population | |
| 444 per 1000 | 27 more per 1000 | ||||
| Moderate | |||||
| 500 per 1000 3 | 30 more per 1000 | ||||
| Time to progression Follow‐up: mean 3 months | 72 | ⊕⊕⊝⊝ | Not estimable | Study population | |
| ‐ | ‐ | ||||
| Serious adverse events Follow‐up: mean 3 months | 72 | ⊕⊝⊝⊝ | RR 0.75 | Study population | |
| 111 per 1000 | 28 fewer per 1000 | ||||
| High | |||||
| 60 per 1000 5 | 15 fewer per 1000 | ||||
| Disease‐specific survival Follow‐up: mean 3 months | 72 | ⊕⊕⊝⊝ | Not estimable | Study population | |
| ‐ | ‐ | ||||
| Disease‐specific quality of life ‐ not reported | ‐ | ‐ | ‐ | ‐ | ‐ |
| *The risk in the intervention group (and its 95% confidence interval) is based on the assumed risk in the comparison group and the relative effect of the intervention (and its 95% CI). BCG: Bacillus Calmette‐Guérin; CI: confidence interval; MMC‐EMDA: electromotive drug administration of mitomycin C; RCT: randomised controlled trial; RR: risk ratio; TURBT: transurethral resection of bladder tumour. | |||||
| GRADE Working Group grades of evidence | |||||
| 1 Downgraded by one level for study limitations: unclear risk of selection bias and high risk of performance, detection and other bias. 2 Downgraded by two level for imprecision: confidence interval was wide and crossed assumed clinically meaningful threshold. 3Gontero 2016: recurrence rate of bladder cancer after TURBT with postoperative six induction instillations of BCG was 50.7% on median follow‐up of 5.2 years. 4 Downgraded by one level for imprecision: no event. 5Witjes 1998: incidence of systemic adverse events after TURBT with postoperative BCG instillations for 6 consecutive weeks was 6% on a long‐term median follow‐up of more than 7 years. | |||||
| Participants: people with non‐muscle invasive bladder cancer (carcinoma in situ or concurrent pT1, or both) Setting: multicentre study in Italy (all comparisons in the review stemmed from same study group) Intervention: initial 6 MMC‐EMDA intravesical instillations at weekly interval about 3 weeks after TURBT Control: initial 6 MMC‐PD intravesical instillations at weekly interval about 3 weeks after TURBT | |||||
| Outcomes | No of participants | Quality of the evidence | Relative effect | Anticipated absolute effects* (95% CI) | |
| Risk with MMC‐PD | Risk difference with postoperative MMC‐EMDA | ||||
| Time to recurrence Follow‐up: mean 3 months | 72 | ⊕⊕⊝⊝ | RR 0.65 | Study population | |
| 722 per 1000 | 253 fewer per 1000 | ||||
| Moderate | |||||
| 420 per 1000 3 | 147 fewer per 1000 | ||||
| Time to progression Follow‐up: mean 3 months | 72 | ⊕⊕⊝⊝ | Not estimable | Study population | |
| ‐ | ‐ | ||||
| Serious adverse events Follow‐up: mean 3 months | 72 | ⊕⊝⊝⊝ | RR 1.50 | Study population | |
| 56 per 1000 | 28 more per 1000 | ||||
| High | |||||
| 30 per 10003 | 15 more per 1000 | ||||
| Disease‐specific survival Follow‐up: mean 3 months | 72 | ⊕⊕⊝⊝ | Not estimable | Study population | |
| ‐ | ‐ | ||||
| Disease‐specific quality of life ‐ not reported | ‐ | ‐ | ‐ | ‐ | ‐ |
| *The risk in the intervention group (and its 95% confidence interval) is based on the assumed risk in the comparison group and the relative effect of the intervention (and its 95% CI). CI: confidence interval; MMC‐EMDA: electromotive drug administration of mitomycin C; MMC‐PD: passive diffusion of mitomycin C; RCT: randomised controlled trial; RR: risk ratio; TURBT: transurethral resection of bladder tumour. | |||||
| GRADE Working Group grades of evidence | |||||
| 1 Downgraded by one level for study limitations: unclear risk of selection bias, high risk of performance, detection and other bias. 2 Downgraded by one level for imprecision: confidence interval crossed assumed clinically meaningful threshold. 3Witjes 1998: recurrence rate of bladder cancer after TURBT with postoperative MMC‐PD instillations (total 5 instillations) was 42.8% and incidence of systemic adverse events was 3% based on a long‐term median follow‐up of more than 7 years. 4 Downgraded by one level for imprecision: no event. 5 Downgraded by two level for imprecision: confidence interval was wide and crossed assumed clinically meaningful threshold. | |||||
| Participants: people with non‐muscle invasive bladder cancer (pT1 or carcinoma in situ of the bladder, or both) Setting: multicentre study in Italy (all comparisons in the review stemmed from same study group) Intervention: initial 3 cycles of MMC‐EMDA with BCG intravesical instillation (cycle: 2 BCG followed by 1 MMC‐EMDA) at weekly interval about 3 weeks after TURBT, and 3 cycles of MMC‐EMDA with BCG intravesical instillations (monthly instillation, cycle: 2 MMC‐EMDA followed by 1 BCG) for 9 months Control: initial 6 BCG intravesical instillations at weekly interval about 3 weeks after TURBT, and BCG monthly instillation for 10 months | |||||
| Outcomes | No of participants | Quality of the evidence | Relative effect | Anticipated absolute effects* (95% CI) | |
| Risk with BCG | Risk difference with postoperative MMC‐EMDA with BCG | ||||
| Time to recurrence Follow‐up: median 88 months | 212 | ⊕⊕⊝⊝ | HR 0.51 | Study population | |
| 581 per 1000 | 223 fewer per 1000 | ||||
| Moderate | |||||
| 430 per 1000 3 | 181 fewer per 1000 | ||||
| Time to progression Follow‐up: median 88 months | 212 | ⊕⊕⊝⊝ | HR 0.36 | Study population | |
| 215 per 1000 | 132 fewer per 1000 | ||||
| Moderate | |||||
| 100 per 1000 3 | 63 fewer per 1000 | ||||
| Serious adverse events Follow‐up: median 88 months | 212 | ⊕⊝⊝⊝ | RR 1.02 | Study population | |
| 28 per 1000 | 1 more per 1000 | ||||
| High | |||||
| 70 per 1000 3 | 1 more per 1000 | ||||
| Disease‐specific survival Follow‐up: median 88 months | 212 | ⊕⊕⊝⊝ | HR 0.31 | Study population | |
| 159 per 1000 | 107 fewer per 1000 | ||||
| Moderate | |||||
| 60 per 1000 3 | 41 fewer per 1000 | ||||
| Disease‐specific quality of life ‐ not reported | ‐ | ‐ | ‐ | ‐ | ‐ |
| *The risk in the intervention group (and its 95% confidence interval) is based on the assumed risk in the comparison group and the relative effect of the intervention (and its 95% CI). BCG: Bacillus Calmette‐Guérin; CI: confidence interval; HR: hazard ratio; MMC‐EMDA: electromotive drug administration of mitomycin C; RCT: randomised controlled trial; RR: risk ratio; TURBT: transurethral resection of bladder tumour. | |||||
| GRADE Working Group grades of evidence | |||||
| 1 Downgrade by one level for study limitations: unclear risk of selection and attrition bias and high risk of performance and detection bias. 2 Downgrade by one level for imprecision: confidence interval crossed assumed clinically meaningful threshold. 3Oddens 2013: disease recurrence, progression and disease‐specific death after TURBT with BCG maintenance therapy (once a week for 6 weeks, followed by three weekly instillations at months 3, 6 and 12) were 42.8%, 9.1% and 5.9%, respectively and stopped treatment due to local or systemic adverse events was 7% based on a long‐term median follow‐up of more than 7.1 years. 4 Downgrade by one level for study limitations: unclear risk of selection bias and high risk of performance and detection bias. 5 Downgraded by two level for imprecision: confidence interval was wide and crossed assumed clinically meaningful threshold. | |||||
| Participants: people with non‐muscle invasive bladder cancer (primary pTa and pT1 urothelial carcinoma) Setting: multicentre study in Italy (all comparisons in the review stemmed from same study group) Intervention: single MMC‐EMDA intravesical instillation about 30 minutes before spinal or general anaesthesia for TURBT Control: single MMC‐PD intravesical instillation immediately after TURBT | |||||
| Outcomes | No of participants | Quality of the evidence | Relative effect | Anticipated absolute effects* (95% CI) | |
| Risk with MMC‐PD | Risk difference with preoperative MMC‐EMDA | ||||
| Time to recurrence Follow‐up: median 86 months | 236 | ⊕⊕⊕⊝ | HR 0.47 | Study population | |
| 588 per 1000 | 247 fewer per 1000 | ||||
| Low 2 | |||||
| 100 per 1000 | 52 fewer per 1000 | ||||
| High 2 | |||||
| 500 per 1000 | 222 fewer per 1000 | ||||
| Time to progression Follow‐up: median 86 months | 236 | ⊕⊝⊝⊝ | HR 0.81 | Study population | |
| 193 per 1000 | 34 fewer per 1000 | ||||
| Low 2 | |||||
| 20 per 1000 | 4 fewer per 1000 | ||||
| High 2 | |||||
| 100 per 1000 | 18 fewer per 1000 | ||||
| Serious adverse events Follow‐up: median 86 months | 236 | ⊕⊝⊝⊝ | RR 0.79 | Study population | |
| 76 per 1000 | 16 fewer per 1000 | ||||
| High 4 | |||||
| 30 per 1000 | 6 fewer per 1000 | ||||
| Disease‐specific survival Follow‐up: median 86 months | 236 | ⊕⊕⊝⊝ | HR 0.99 | Study population | |
| 126 per 1000 | 1 fewer per 1000 | ||||
| Low 2 | |||||
| 20 per 1000 | 0 fewer per 1000 | ||||
| High 2 | |||||
| 60 per 1000 | 1 fewer per 1000 | ||||
| Disease‐specific quality of life ‐ not reported | ‐ | ‐ | ‐ | ‐ | ‐ |
| *The risk in the intervention group (and its 95% confidence interval) is based on the assumed risk in the comparison group and the relative effect of the intervention (and its 95% CI). CI: confidence interval; HR: hazard ratio; MMC‐EMDA: electromotive drug administration of mitomycin C; MMC‐PD: passive diffusion of mitomycin C; RCT: randomised controlled trial; RR: risk ratio; TURBT: transurethral resection of bladder tumour. | |||||
| GRADE Working Group grades of evidence | |||||
| 1 Downgraded by one level for study limitations: high risk of performance bias. 2Sylvester 2016: baseline risks of time to recurrence and progression, and disease‐specific survival were estimated from included studies in a systematic review and meta‐analysis of RCTs comparing the efficacy of a single instillation of MMC after TURBT with TURBTs alone. 3 Downgraded by two level for imprecision: confidence interval was wide and crossed clinically meaningful threshold. 4Witjes 1998: incidence of systemic adverse events after TURBT with postoperative MMC‐PD instillations (total 5 instillations) was 3% based on a long‐term median follow‐up of more than 7 years. | |||||
| Participants: people with non‐muscle invasive bladder cancer (primary pTa and pT1 urothelial carcinoma) Setting: multicentre study in Italy (all comparisons in the review stemmed from same study group) Intervention: single MMC‐EMDA intravesical instillation about 30 minutes before spinal or general anaesthesia for TURBT Control: TURBT alone | |||||
| Outcomes | No of participants | Quality of the evidence | Relative effect | Anticipated absolute effects* (95% CI) | |
| Risk with TURBT alone | Risk difference with preoperative MMC‐EMDA | ||||
| Time to recurrence Follow‐up: median 86 months | 233 | ⊕⊕⊕⊝ | HR 0.40 | Study population | |
| 638 per 1000 | 304 fewer per 1000 | ||||
| Low 2 | |||||
| 400 per 1000 | 215 fewer per 1000 | ||||
| High 2 | |||||
| 700 per 1000 | 318 fewer per 1000 | ||||
| Time to progression Follow‐up: median 86 months | 233 | ⊕⊝⊝⊝ | HR 0.74 | Study population | |
| 207 per 1000 | 49 fewer per 1000 | ||||
| Low 2 | |||||
| 20 per 1000 | 5 fewer per 1000 | ||||
| High 2 | |||||
| 100 per 1000 | 25 fewer per 1000 | ||||
| Serious adverse events Follow‐up: median 86 months | 233 | ⊕⊝⊝⊝ | RR 1.74 | Study population | |
| 34 per 1000 | 26 more per 1000 | ||||
| Moderate 4 | |||||
| 30 per 1000 | 22 more per 1000 | ||||
| Disease‐specific survival Follow‐up: median 86 months | 233 | ⊕⊕⊕⊝ | HR 1.06 | Study population | |
| 129 per 1000 | 7 more per 1000 | ||||
| Low 2 | |||||
| 20 per 1000 | 1 more per 1000 | ||||
| High 2 | |||||
| 100 per 1000 | 6 more per 1000 | ||||
| Disease‐specific quality of life ‐ not reported | ‐ | ‐ | ‐ | ‐ | ‐ |
| *The risk in the intervention group (and its 95% confidence interval) is based on the assumed risk in the comparison group and the relative effect of the intervention (and its 95% CI). CI: confidence interval; HR: hazard ratio; MMC‐EMDA: electromotive drug administration of mitomycin C; RCT: randomised controlled trial; RR: risk ratio; TURBT: transurethral resection of bladder tumour. | |||||
| GRADE Working Group grades of evidence | |||||
| 1 Downgraded by one level for study limitations: high risk of performance bias. 2Sylvester 2016: baseline risks of time to recurrence and progression, and disease‐specific survival were estimated from included studies in a systematic review and meta‐analysis of RCTs comparing the efficacy of a single instillation of MMC after TURBT with TURBT alone. 3 Downgraded by two level for imprecision: confidence interval was wide and crossed assumed clinically meaningful threshold. 4Matulewicz 2015: rates of death and overall adverse events rate after TURBT were 2.8% and 5.8%. 5 Downgraded by one level for imprecision: confidence interval crossed assumed clinically meaningful threshold. | |||||
Background
Description of the condition
Urothelial carcinoma of the bladder is the sixth most common cancer in men and the 19th most common cancer in women (Ferlay 2013). It is estimated that the age‐standardised incidence rate is 5.3 per 100,000 and mortality rate is 1.9 per 100,000 for both sexes (Ferlay 2013). Based on their prognostic risk, people with urothelial bladder cancer can be broadly categorised into those with non‐muscle invasive bladder cancer (NMIBC) and those with muscle invasive bladder cancer (MIBC). People with NMIBC are at risk for recurrence of the tumour as well as progression to MIBC, which is associated with the risk of lymphatic and vascular metastatic spread and portends a markedly worse prognosis. Approximately 75% of people with bladder cancer have NMIBC at the time of diagnosis (Babjuk 2017). NMIBC can be localised either to the mucosa (Ta or carcinoma in situ; CIS) or to the submucosa (T1). Important risk factors for NMIBC are incorporated in the European Organisation for Research and Treatment of Cancer (EORTC) scoring system, which includes six clinical and pathological factors (i.e. number of tumours, tumour size, prior recurrence rate, T category, presence of concurrent CIS and tumour grade) to predict short‐ and long‐term probabilities of recurrence and progression (Sylvester 2006). Based on these parameters, people with NMIBC can be stratified into three risk groups (i.e. low risk, intermediate risk and high risk) using EORTC recurrence and progression parameters (Babjuk 2017; Brausi 2011). CIS is a flat and non‐invasive urothelial carcinoma; however, people with CIS are at high risk of progression (Sylvester 2005). Approximately 54% of these people progress to MIBC when no treatment is given (Lamm 1992).
Standard treatment for NMIBC is complete transurethral resection of bladder tumour (TURBT), followed by close cystoscopic surveillance and intermittent upper tract imaging. After TURBT alone, five‐year‐recurrence risk varies from 31% (for Ta, low‐grade tumours) to 78% (for T1, high‐grade tumours), while progression risk varies from 0.8% to 45% (Sylvester 2006). In addition, it is recommended that select patients at high risk for recurrence, progression, or both, undergo adjuvant intravesical treatment (Babjuk 2017; Chang 2016).
Two approaches to intravesical treatment are routinely used. First, intravesical chemotherapy instillation immediately after TURBT is recommended to destroy exfoliated tumour cells and residual tumour cells at the resection site (Babjuk 2017). One systematic review by Sylvester et al. demonstrated that a single intravesical chemotherapy instillation after TURBT reduced the recurrence rate when compared to TURBT alone (48.4% versus 36.7%, P < 0.0001) (Sylvester 2004).
Second, intravesical agents can be used in delayed, adjuvant settings to reduce the risk of recurrence (Shelley 2000). Of these, intravesical immunotherapy with Bacillus Calmette‐Guérin (BCG), given by induction and maintenance regimens, has been shown to be more effective than intravesical chemotherapy with agents such as mitomycin or epirubicin (Shang 2011; Shelley 2003). Despite adjuvant BCG treatment, the risk of recurrence (39%) and progression (10%) remains high (Böhle 2003; Sylvester 2002). Moreover, cystitis symptoms are very common (Brausi 2014; Shang 2011). Despite some studies that have demonstrated improved compliance rates, treatment discontinuation due to adverse effects remains an issue (Brausi 2014; Lamm 2000; Saint 2001).
Because of the limited effectiveness and side effect profiles of these agents, there is considerable interest in alternative agents and delivery forms. An innovative approach to adjuvant therapy is electromotive drug administration (EMDA). Similar to EMDA, hyperthermia may also potentiate the cytotoxic effect of chemotherapeutic agents. There are promising, improved outcomes with thermochemotherapy modalities in other types of cancer, as well as bladder cancer (Maffezzini 2014; Van Driel 2015).
Description of the intervention
EMDA represents a novel intravesical drug administration modality for people with bladder cancer. It is defined as the intravesical instillation of a drug, accompanied by electrical current, designed to promote drug uptake. EMDA can be used for immediate (before or after TURBT) induction or maintenance treatment for NMIBC (Di Stasi 2003; Di Stasi 2006; Di Stasi 2011).
How the intervention might work
One ex‐vivo study suggested that EMDA of mitomycin increased the mitomycin tissue concentration in urothelium, lamina propria and superficial muscle layers in fresh human bladder tissue when compared with the passive diffusion of mitomycin C (MMC‐PD; Di Stasi 1999). Additionally, previous reports showed a significant increase in peak plasma mitomycin levels in electromotive mitomycin administration when compared with MMC‐PD (Di Stasi 1999). The combined effects are thought to be the basis for a potentially increased therapeutic effect of EMDA compared with PD.
Why it is important to do this review
While EMDA has the potential to improve the outcomes of people with NMIBC (Brausi 1998; Di Stasi 1999), there has been no systematic review to critically appraise the current best evidence on the therapeutic effectiveness and adverse effects of EMDA. We performed this review to provide a methodologically rigorous systematic review that included a comprehensive literature search, a focus on patient‐important outcomes and rating of the quality of the evidence (QoE) using GRADE. We expect this review to be helpful to guide clinicians', guideline developers' and policy‐makers' decision‐making about the use and implementation of EMDA technology in NMIBC.
Objectives
To assess the effects of the intravesical EMDA treatment modality for NMIBC.
Methods
Criteria for considering studies for this review
Types of studies
We searched for randomised and quasi‐randomised studies, which we included regardless of their publication status or language of publication.
Types of participants
We included studies of participants with NMIBC (Ta, T1 or CIS), as determined by pathological evaluation of the TURBT, with no lymph node involvement and no metastases (clinically N0, M0). We considered studies of participants with both primary and recurrent disease. We excluded trials that included participants with known MIBC, non‐urothelial type bladder cancer or upper urinary tract urothelial carcinoma at the time of presentation.
According to our published protocol (Gudeloglu 2015), we planned to classify participants who had NMIBC as using low‐, intermediate‐ or high‐risk categories in accordance with the European Association of Urology (EAU) classification system (Babjuk 2017).
Types of interventions
We planned to investigate the following comparisons of experimental intervention versus comparator intervention. Concomitant interventions had to be the same in the experimental and comparator groups to establish fair comparisons.
Experimental interventions
-
EMDA of any intravesical chemotherapeutic agent (e.g. mitomycin, epirubicin, gemcitabine or other).
We excluded studies of other types of drug delivery methods such as chemohyperthermia, which is based on a different mechanism of action than EMDA.
Comparator interventions
-
Placebo.
-
Passive instillation of any chemotherapeutic agent.
-
BCG instillation.
-
TURBT without intravesical instillation.
Comparisons
-
EMDA of any intravesical chemotherapeutic agent versus placebo.
-
EMDA of any intravesical chemotherapeutic agent versus passive instillation of any chemotherapeutic agent.
-
EMDA of any intravesical chemotherapeutic agent versus BCG instillation.
-
EMDA of any intravesical chemotherapeutic agent versus TURBT without intravesical instillation.
We distinguished and separately analysed the use of EMDA in the preoperative setting and postoperative, adjuvant setting. We expected to find multiple distinct comparisons between EMDA with each chemotherapeutic agent and passive instillation of any chemotherapeutic agent, placebo, BCG, or TURBT alone. These comparisons were separately performed and analysed for both the preoperative and postoperative settings.
There were no eligibility criteria related to delivery, dosing, duration, and intensity of experimental and comparator interventions.
If a study included more than two intervention arms, we included only those experimental and comparator intervention groups that met the eligibility criteria of the review.
Types of outcome measures
We did not use the measurement of the outcomes included in this review as an eligibility criterion.
Primary outcomes
-
Time to recurrence.
-
Time to progression.
-
Serious adverse events.
Secondary outcomes
-
Disease‐specific survival.
-
Time to death due to any cause.
-
Minor adverse events.
-
Disease‐specific quality of life.
Method and timing of outcome measurement
-
Time to recurrence: measured from the date of randomisation to the date of biopsy or resection, with confirmation of tumour of any grade or stage.
-
Time to progression: measured from the date of randomisation to the date of biopsy or resection, with confirmation of MIBC (development of muscle invasive disease).
-
Serious adverse events: determined the Common Toxicity Criteria Grade 3 or higher complications as serious (e.g. intraperitoneal bladder injury and need to surgically repair, sepsis). If the authors did not use Common Toxicity Criteria, we graded the adverse events as described in the respective studies.
-
Disease‐specific survival: measured from the date of randomisation to the date of death from bladder cancer.
-
Time to death due to any cause: measured from the date of randomisation to date of death from any cause.
-
Minor adverse events: determined the Common Toxicity Criteria Grade 1 or 2 complications as minor (e.g. haematuria, dysuria). If the authors did not use Common Toxicity Criteria, we graded the adverse events as described in the respective studies.
-
Disease‐specific quality of life: mean change assessed with validated questionnaire such as EORTC core quality of life questionnaire version 3.0 (QLQ C‐30).
We used previously reported minimally clinical important difference (MCID) for the review outcomes to rate overall QoE in 'Summary of finding' tables (Jaeschke 1989; Johnston 2013). When the mean difference (MD), risk ratio (RR), or hazard ratio (HR) was equal to or larger than the MCID, we considered that many participants may have gained detectable benefits from treatment (Johnston 2013). We considered MCIDs of EORTC QLQ C‐30 based on the previous literature (Bedard 2014). In settings where we could not find established thresholds for MCID in the literature, we used a relative risk reduction of at least 25% based on guidance by Guyatt 2011a.
We planned to assess the outcomes as short‐term, mid‐term and long‐term outcomes.
-
Short‐term: up to six months after randomisation.
-
Mid‐term: later than six months up to 24 months.
-
Long‐term: later than 24 months.
When there were insufficient data to analyse time‐to‐event outcomes, we assessed event rate for dichotomised outcomes (e.g. recurrence, mortality) at the time points of completion of the primary intervention. To allow meaningful interpretation, we truncated data analysis at three months for Di Stasi 2003 at the time point when treatment deviated from the standard of care (further course of intravesical therapy instead of TURBT) and subsequent cross‐over at six months.
Main outcomes for 'Summary of findings' table
-
Time to recurrence.
-
Time to progression.
-
Serious adverse events.
-
Disease‐specific survival.
-
Disease‐specific quality of life.
Search methods for identification of studies
We employed a combination of electronic and manual searches. No language restrictions were imposed.
Electronic searches
We initially searched the following sources from inception of each database to 1 June 2016. We re‐ran the searches in all relevant databases on 7 February 2017, and incorporated any identified relevant studies into the review.
-
Cochrane Central Register of Controlled Trials (CENTRAL) (part of the Cochrane Library; 2017, Issue 1 Appendix 1).
-
MEDLINE (from 1950 to 2017; Appendix 2).
-
EMBASE (from 1980 to 2017; Appendix 3).
We searched CENTRAL via the Wiley Online Library, MEDLINE via PubMed and EMBASE via Ovid, with the assistance of a dedicated information specialist (GMK).
We searched the following trials registers on 1 June 2016 and again on 7 February 2017.
-
ClinicalTrials.gov (clinicaltrials.gov/; Appendix 4).
-
World Health Organization International Clinical Trials Registry Platform (WHO ICTRP; www.who.int/ictrp/en/; Appendix 5).
-
The grey literature repository from the current Grey Literature Report (www.greylit.org/).
Searching other resources
We also searched three major urological society abstract proceedings for 2015 to 2017 before publication, namely the American Urological Association, EAU, and American Society of Clinical Oncology. We contacted the authors of existing studies, experts in the field and the companies making the EMDA device to request information about additional trials. We further searched the reference lists of existing reviews on the same topic.
Data collection and analysis
Selection of studies
We used reference management software to identify and remove potential duplicate records (EndNote 2016). Two review authors (AG, HK or JHJ) independently assessed the titles, abstract, or both, of records identified in the search against the predefined inclusion criteria to determine which studies should be assessed further using Covidence. Two review authors (JHJ, AM) investigated all potentially relevant records as full text, mapped records to studies, and classified studies as included studies, excluded studies, studies awaiting classification or ongoing studies in accordance with the criteria for each provided in the Cochrane Handbook for Systematic Reviews of Interventions (Higgins 2011a). We resolved any discrepancies through discussion or arbitration by a third review author (PD). If resolution of a disagreement was not possible, we planned to designate the study as 'awaiting classification' and contact study authors for clarification. We documented reasons for exclusion of studies that may have reasonably been expected to be included in the review in the Characteristics of excluded studies table. We presented an adapted PRISMA flow diagram showing the process of study selection (Liberati 2009).
Data extraction and management
Two review authors (AG, JHJ) independently extracted data using a piloted data extraction form and compared their extracted data. A third review author (PD) resolved differences in the extracted data. The extracted data included the following.
-
Record citation (e.g. authors' names, article title).
-
Details of methods: study design, dates when the study was conducted.
-
Details of participants: inclusion and exclusion criteria; setting; country; age; sex; number of included participants; participants' risk factors for recurrence, progression, or both (number of tumours, tumour size, prior recurrence rate, T category, presence of concurrent CIS, tumour grade); and number of participants in each risk group.
-
Details of interventions: drug, dosage and dilution details, duration of instillation, number of participants randomly assigned to each intervention group; for EMDA, we recorded the current used, number of administrations, and duration of administration.
-
Details of outcomes: outcomes included in this review that were assessed in each study, including how measured and the times at which they were measured.
-
Study funding sources.
-
Declarations of interest among the primary study authors.
-
Study characteristics relevant to risk of bias assessment (e.g. randomisation method, allocation concealment method, blinding methods, completeness of follow‐up, intention‐to‐treat and selective reporting).
We extracted outcome data relevant to this review. For time‐to‐event outcomes, we obtained log HRs with standard errors and HR with 95% confidence intervals (CIs). For dichotomous outcomes, we obtained numbers of events and totals for population of a 2 × 2 table, as well as summary statistics with corresponding measures of variance. For continuous outcomes, we planned to obtain means and standard deviations or data necessary to calculate this information.
We provided information about potentially relevant ongoing studies, including the trial identifier, in the Characteristics of ongoing studies table. We attempted to contact authors of included studies to obtain key missing data as needed.
Dealing with duplicate and companion publications
In the event of duplicate publications, companion documents or multiple reports of a primary study, we maximised yield of information by mapping all publications to unique studies and collating all available data. We used the most complete data‐set aggregated across all known publications. In case of doubt, we gave priority to the publication reporting the longest follow‐up associated with our primary or secondary outcomes.
Assessment of risk of bias in included studies
Two review authors (JHJ, AM) independently assessed the risk of bias of each included study. We resolved disagreements by consensus, or by consultation with a third review author (PD).
We assessed risk of bias using Cochrane's 'Risk of bias' assessment tool for the following domains (Higgins 2011b).
-
Random sequence generation (selection bias).
-
Allocation concealment (selection bias).
-
Blinding of participants and personnel (performance bias).
-
Blinding of outcome assessment (detection bias).
-
Incomplete outcome data (attrition bias).
-
Selective reporting (reporting bias).
-
Other sources of bias.
We judged risk of bias domains as 'low risk,' 'high risk' or 'unclear risk' and evaluated individual bias items as described in the Cochrane Handbook for Systematic Reviews of Interventions (Higgins 2011b). We presented a 'Risk of bias' summary figure to illustrate these findings.
For selection bias (random sequence generation and allocation concealment) and reporting bias (selective reporting), we evaluated risk of bias at a trial level.
For performance bias (blinding of participants and personnel), we evaluated the risk of bias separately for each outcome.
We defined the following outcomes susceptible to performance bias:
-
time to recurrence;
-
time to progression;
-
serious and minor adverse events;
-
disease‐specific quality of life.
We defined the following outcomes non‐susceptible to performance bias:
-
disease‐specific survival;
-
time to death.
For detection bias (blinding of outcome assessment), we grouped outcomes as susceptible to detection bias (subjective) or not susceptible to detection bias (objective) outcomes.
We defined the following outcomes as subjective outcomes:
-
time to recurrence;
-
time to progression;
-
disease‐specific survival;
-
serious and minor adverse events;
-
disease‐specific quality of life.
We defined the following outcome as objective outcomes:
-
time to death.
We assessed attrition bias (incomplete outcome data) on a per outcome basis but sought to create groups of outcomes based on similar reporting characteristics.
We further summarised the risk of bias across domains for each outcome in each included study, as well as across studies and domains for each outcome, in accordance with the approach for summary assessments of the risk of bias presented in the Cochrane Handbook for Systematic Reviews of Interventions (Higgins 2011b).
Measures of treatment effect
For time‐to‐event outcomes, we calculated HRs and corresponding 95% CIs to assess the intervention effect. For dichotomous data, we calculated the RRs with 95% CIs. We planned to express continuous data as MDs with 95% CIs unless different studies used different measures to assess the same outcome, in which case we expressed data as standardised mean differences with 95% CIs. We analysed the data using Review Manager 5 software (RevMan 2014).
Unit of analysis issues
The unit of analysis was the individual participant. When we identified cross‐over trials, cluster‐randomised trials or trials with more than two intervention groups for inclusion in the review, we handled these in accordance with guidance provided in the Cochrane Handbook for Systematic Reviews of Interventions (Higgins 2011c).
Dealing with missing data
We obtained missing data from study authors and performed intention‐to‐treat analyses if data were available; otherwise we performed available case analyses. We investigated attrition rates, (e.g. dropouts, losses to follow‐up and withdrawals), and critically appraised issues of missing data. We did not impute missing data.
Assessment of heterogeneity
We had planned to identify heterogeneity (inconsistency) through visual inspection of forest plots to assess the amount of overlap of CIs, and the I2 statistic, which quantifies inconsistency across studies to assess the impact of heterogeneity in the meta‐analysis (Higgins 2002; Higgins 2003); we had planned to interpret the I2 statistic as follows (Deeks 2011).
-
0% to 40%: may not be important.
-
30% to 60%: may indicate moderate heterogeneity.
-
50% to 90%: may indicate substantial heterogeneity.
-
75% to 100%: considerable heterogeneity.
When we found heterogeneity, we attempted to determine possible reasons for it by examining individual study and subgroup characteristics.
Assessment of reporting biases
We attempted to obtain study protocols to assess for selective outcome reporting. We could not produce funnel plots for the visual detection of publication bias since there were fewer than 10 studies included in each meta‐analysis.
Data synthesis
If a meta‐analysis was appropriate to calculate the estimate of effect, we used a random‐effects model to combine data from the included studies. For dichotomous outcomes, we planned to use the Mantel‐Haenszel method; for continuous outcomes, we planned to use the inverse variance method; and for time‐to‐event outcomes, we planned to use the generic inverse variance method. Analyses were carried out using Review Manager 5 software (RevMan 2014). If meta‐analysis was not appropriate, or if sufficient data were unavailable, we provided a narrative synthesis of the data and planned to perform meta‐analysis in a future update of this review.
Subgroup analysis and investigation of heterogeneity
For the case that we had sufficient data, we planned to perform a predefined subgroup analysis for low‐, intermediate‐ and high‐risk participants, according to the EAU risk classification system (Babjuk 2017). We planned that should we be unable to stratify the analysis based on the EAU risk categories, we would use its main components, namely the number of tumours (one versus more than one), tumour size (less than 3 cm versus 3 cm or greater), tumour stage (Ta versus T1), presence of CIS (absent versus present), tumour grade (Grade 1 versus Grades 2 and 3) and primary versus recurrent disease.
The rationale for the planned EAU risk classification subgroup analysis was that people in different risk groups have different recurrence and progression rates, and may be managed differently (i.e. cystoscopic follow‐up only versus adjuvant intravesical therapy); therefore, their outcomes are of great interest to clinicians. We planned to investigate heterogeneity for the results of subgroups by inspecting the overlap of CIs and using the test for subgroup differences in Review Manager 5 (RevMan 2014). In the presence of a suspected subgroup effect, we planned to perform statistical tests for interaction. If applicable, we would have also assessed methodological quality as a source of heterogeneity, comparing studies at low, high and unclear risk of bias. However, too few studies were identified for this to be meaningful.
Sensitivity analysis
If the number of included studies had permitted, we would have performed sensitivity analyses based on the risk of bias, by excluding studies that we judged to have high or unclear risk of bias for the particular outcome. However, too few studies were available for this to be meaningful.
'Summary of findings' tables
We presented the overall QoE for each outcome according to the GRADE approach, which takes into account five criteria related to internal validity (risk of bias, inconsistency, imprecision and publication bias), and external validity (directness of results) (Guyatt 2008). For each comparison, two review authors (JHJ, AM) independently rated the QoE for each outcome as 'high,' 'moderate,' 'low' or 'very low' using GRADEpro GDT. We resolved any discrepancies by consensus, or, if needed, by arbitration by a third review author (PD). For each comparison, we presented a summary of the evidence for the main outcomes in a 'Summary of findings' table, which provides key information about the best estimate of the magnitude of the effect in relative terms and absolute differences for each relevant comparison of alternative management strategies; numbers of participants and studies addressing each important outcome; and the rating of the overall confidence in effect estimates for each outcome (Guyatt 2011b; Schünemann 2011). If meta‐analysis was not possible, we planned to present results in a narrative 'Summary of findings' table.
Results
Description of studies
Results of the search
We identified 538 records through our electronic database search including one record from a trial registry. We found no additional record in the grey literature repository. We found no additional records through handsearching of abstract proceedings. After removal of 75 duplicates, we screened the titles and abstracts of 463 records, and excluded references. We screened 19 full‐text articles and ultimately included three studies (reported in 16 references) in this review (Figure 1). The updated search in 7 February 2017 yielded three citations but did not reveal any further relevant studies for full‐text review.
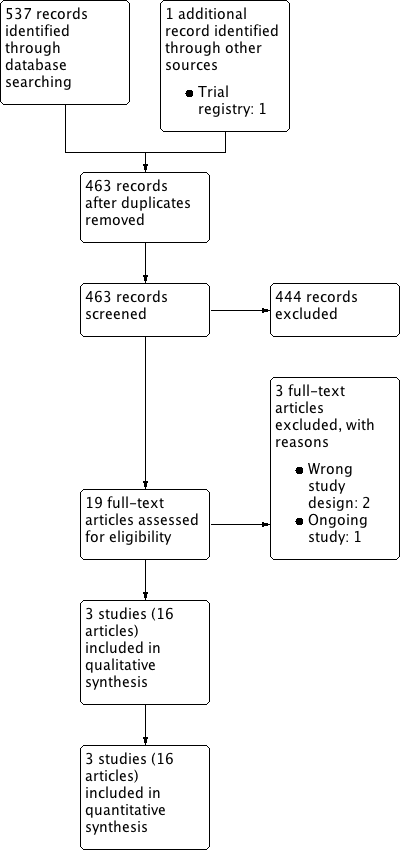
Study flow diagram.
Included studies
Three randomised controlled trials (RCTs) investigating intravesical EMDA treatment met the inclusion criteria for this review (Di Stasi 2003; Di Stasi 2006; Di Stasi 2011). We required more information for all of the included trials and were able to contact the author by email (Di Stasi 2003; Di Stasi 2006; Di Stasi 2011). See Characteristics of included studies; Table 1; and Table 2 for details.
| Study name | Trial | Setting | Participants | Intervention(s) and comparator(s) | Description of intervention | Median age (years, interquartile range) | Disease characteristics (n) | Median follow‐up (months, interquartile range) |
| June 1994 to March 2001 | Multicentre/Italy | People with histologically confirmed multifocal CIS of the bladder and most had concurrent pT1 papillary transitional‐cell carcinoma (all primary disease). | MMC‐EMDA induction after TURBT | 6 intravesical instillation at weekly intervals. | 64.5 (not reported) | Ta/T1: 0/32 Grade: not reported CIS: 36 | 43 (not reported) | |
| MMC‐PD induction after TURBT | 68.5 (not reported) | Ta/T1: 0/33 Grade: not reported CIS: 36 | ||||||
| BCG induction after TURBT | 66.5 (not reported) | Ta/T1: 0/33 Grade: not reported CIS: 36 | ||||||
| 1 January 1994 to 30 June 2002 | Multicentre/Italy | People with histologically confirmed stage pT1 transitional‐cell carcinoma of the bladder were regarded as being at high risk for tumour recurrence and at moderate to high risk for progression because of: multifocal pT1, primary or recurrent, grade 2 transitional‐cell carcinoma; primary or recurrent pT1, multifocal or solitary, grade 3 transitional‐cell carcinoma; or pT1 with CIS. | MMC‐EMDA with sequential BCG induction and maintenance after TURBT | Induction: 3 cycles of treatment per week for 9 weeks for which 1 cycle consisted of 2 BCG infusions and 1 MMC infusion Maintenance: 1 infusion per month for 9 months: 3 cycles of MMC, MMC and BCG. | 66.0 (56.0‐73.0) | Ta/T1: all T1 disease Grade: 0/65/42 CIS: 29 | 88 (63‐110) | |
| BCG induction and maintenance after TURBT | Induction: 6 intravesical treatments at weekly intervals Maintenance: monthly infusion of BCG for 10 months. | 67.0 (61.0‐73.0) | Ta/T1: all T1 disease Grade: 0/64/41 CIS: 28 | |||||
| 1 January 1994 to 31 December 2003 | Multicentre/Italy | People with pTa and pT1 urothelial carcinoma. | Single‐dose, MMC‐EMDA before TURBT | Single intravesical instillation about 30 minutes before spinal or general anaesthesia. | 67.0 (63.0‐74.0) | Ta/T1: 63/54 Grade: 22/62/33 CIS: not reported | 86 (57‐125) | |
| Single‐dose, MMC‐PD immediately after TURBT | Single intravesical instillation within 6 hours of TURBT. | 67.0 (61.0‐72.0) | Ta/T1: 64/55 Grade: 23/64/32 CIS: not reported | |||||
| TURBT alone | No intravesical instillation. | 66.5 (60.0‐73.0) | Ta/T1: 63/53 Grade: 21/63/32 CIS: not reported |
BCG: Bacillus Calmette‐Guérin; CIS: carcinoma in situ; MMC‐EMDA: electromotive drug administration of mitomycin C; MMC‐PD: passive diffusion of mitomycin C; TURBT: transurethral resection of bladder tumour.
| Study name | Intervention(s) and comparator(s) | Screened/eligible (n) | Randomised (n) | Treatment completion (n (%)) | Analysed (n (%)) |
| MMC‐EMDA induction after TURBT | Not reported/117 | 36 | 36 (100) | 36 (100) | |
| MMC‐PD induction after TURBT | 36 | 36 (100) | 36 (100) | ||
| BCG induction after TURBT | 36 | 36 (100) | 36 (100) | ||
| Total | 108 | 108 (100) | 108 (100) | ||
| MMC‐EMDA with sequential BCG induction and maintenance after TURBT | 241/212 | 107 | 96 (89) | 107 (100) | |
| BCG induction and maintenance after TURBT | 105 | 94 (89) | 105 (100) | ||
| Total | 212 | 190 (89) | 212 (100) | ||
| Single‐dose, MMC‐EMDA before TURBT | 398/374 | 124 | 117 (94) | 117 (94) | |
| Single‐dose, MMC‐PD immediately after TURBT | 126 | 119 (94) | 119 (94) | ||
| TURBT alone | 124 | 116 (93) | 116 (93) | ||
| Total | 374 | 352 (94) | 352 (94) | ||
| Grand total | 694 | 650 (93) | 672 (96) | ||
BCG: Bacillus Calmette‐Guérin; MMC‐EMDA: electromotive drug administration of mitomycin C; MMC‐PD: passive diffusion of mitomycin C; n: number of participants; TURBT: transurethral resection of bladder tumour.
Study design
Two included studies were parallel and multicentre RCTs (Di Stasi 2006; Di Stasi 2011), and one study was a randomised controlled, parallel group trial which permitted additional sessions of intravesical therapy at three months and cross‐over at six months (Di Stasi 2003). All included studies were conducted by the same study group in Italy.
Participants
We evaluated 672 participants (528 males, 144 females) with NMIBC (Di Stasi 2003; Di Stasi 2006: CIS or concurrent T1 (or both); Di Stasi 2011: Ta or T1), as determined by pathological evaluation of TURBT. Mean age of included studies ranged from 64.5 to 68.5 years. Two studies enrolled people with primary disease (Di Stasi 2003; Di Stasi 2011), and one study enrolled the people with both primary and recurrent disease (Di Stasi 2006).
Interventions and comparisons
MMC was the only intravesical agent used in all trials. Two studies used EMDA in the postoperative setting (Di Stasi 2003; Di Stasi 2006). Di Stasi 2011 used EMDA in the preoperative setting.
Di Stasi 2003 compared MMC‐EMDA with BCG and MMC‐PD. Participants received an initial six intravesical instillations according to their assigned intervention at weekly intervals starting about three weeks after TURBT. If cancer persisted at three months, participants received an additional six‐week course. If disease persisted at six months, there was cross‐over to a six‐week additional course of BCG for people who underwent the MMC‐EMDA or MMC‐PD instillation. The participants in the BCG group were crossed over to a six‐week MMC‐EMDA course.
Di Stasi 2006 compared MMC‐EMDA with sequential BCG with BCG alone. MMC‐EMDA with sequential BCG instillations consisted of an initial three cycles of MMC‐EMDA with BCG intravesical instillation. One cycle consisted of two BCG installations followed by one MMC‐EMDA installation at weekly intervals about three weeks after TURBT. Subsequently, participants received three cycles of MMC‐EMDA with BCG intravesical instillation. One subsequent cycle consisted of two MMC‐EMDA installations followed by one BCG installation at monthly intervals for nine months. In comparison, an initial six BCG intravesical instillations were performed at weekly intervals about three weeks after TURBT and BCG monthly instillations for 10 months.
Di Stasi 2011 compared a single MMC‐EMDA intravesical instillation about 30 minutes before spinal or general anaesthesia for TURBT with a single MMC‐EMDA intravesical instillation immediately after TURBT and TURBT without immediate intravesical instillation. Participants received adjuvant intravesical therapy if indicated based on EAU guidelines (Babjuk 2017).
Outcomes
All included studies reported time to recurrence, time to progression, disease‐specific survival, time to death and serious adverse events. Two studies reported minor adverse events as count data (Di Stasi 2003; Di Stasi 2006). None of the studies reported disease‐specific quality of life.
Median follow‐up of included studies ranged from 43 to 88 months. However, as Di Stasi 2003 was designed to allow cross‐over, we used data up to three months after intervention only (before additional session of intravesical therapy and cross‐over) in our data analysis. For further descriptive information about the studies, refer to the Characteristics of included studies table.
Funding sources and conflicts of interests
Two studies specified funding sources (Di Stasi 2003: Tor Vergata University of Rome and Physion Srl, Medolla, Italy, Di Stasi 2011: none). Di Stasi 2006 did not report the funding sources. Two studies reported no conflicts of interests (Di Stasi 2006; Di Stasi 2011), and Di Stasi 2003 reported financial interest or other relationships with Physion Srl (or both).
Excluded studies
We excluded two publications because they had the wrong study design (non‐RCT: Brausi 1998, commentary: Grossman 2006). See Characteristics of excluded studies table.
Study awaiting classification
We found one study waiting classification (NCT01920269). We contacted the author but did not receive a reply. See Characteristics of studies awaiting classification.
Risk of bias in included studies
We did not assess risk of bias for quality of life due to the lack of data. Detailed results of the 'Risk of bias' assessment are provided in Figure 2, Figure 3 and judgement of individual domains are in the Characteristics of included studies table.

Risk of bias graph: review authors' judgements about each risk of bias item presented as percentages across all included studies.

Risk of bias summary: review authors' judgements about each risk of bias item for each included study.
Allocation
Random sequence generation
All included studies used stratified blocked randomisation. We judged the risk of bias to be low for random sequence generation for all three studies (Di Stasi 2003; Di Stasi 2006; Di Stasi 2011).
Allocation concealment
We considered allocation concealment to be at low risk of bias in one trial (Di Stasi 2011). Two trials did not describe an adequate method of allocation concealment and was at unclear risk of bias in this domain (Di Stasi 2003; Di Stasi 2006).
Blinding
Blinding of participants and personnel
According to our protocol, we grouped the outcomes with an expected similar risk of bias together.
-
Blinding of time to recurrence and progression, serious and minor adverse events: all trials had inadequate blinding for these outcomes and were at high risk of bias (Di Stasi 2003; Di Stasi 2006; Di Stasi 2011).
-
Blinding of disease‐specific survival and time to death: we rated all trials at low risk of bias given that lack of blinding was unlikely to have affected these outcomes (Di Stasi 2003; Di Stasi 2006; Di Stasi 2011).
Blinding of outcome assessment
-
Blinding of subjective outcomes (time to recurrence and progression, serious and minor adverse event, disease‐specific survival): Di Stasi 2011 had an adequate method of blinding for these outcomes so we judged the risk of bias as low. Other trials did not use blinding and were at high risk (Di Stasi 2003; Di Stasi 2006).
-
Blinding of objective outcomes (time to death): we rated all three trials at low risk due to the objective nature of the outcomes (Di Stasi 2003; Di Stasi 2006; Di Stasi 2011).
Incomplete outcome data
-
Time to recurrence and progression: we judged all studies to be at low risk of bias (Di Stasi 2003; Di Stasi 2006; Di Stasi 2011). Attrition and exclusion were clearly described and the vast majority of randomised participants were included in the analysis.
Selective reporting
Two trials reported all outcomes intended to be investigated by published protocol and we judged both trials at low risk of bias (Di Stasi 2006; Di Stasi 2011). One study rated unclear risk of bias due to absence of published protocol (Di Stasi 2003).
Other potential sources of bias
All trials appeared to be free from other sources of bias (low risk of bias).
Effects of interventions
See: Summary of findings for the main comparison Postoperative MMC‐EMDA induction versus postoperative BCG induction therapy for non‐muscle invasive bladder cancer; Summary of findings 2 Postoperative MMC‐EMDA induction versus MMC‐PD induction therapy for non‐muscle invasive bladder cancer; Summary of findings 3 Postoperative MMC‐EMDA with sequential BCG induction and maintenance versus postoperative BCG induction and maintenance therapy for non‐muscle invasive bladder cancer; Summary of findings 4 Single‐dose, preoperative MMC‐EMDA versus single‐dose, postoperative MMC‐PD for non‐muscle invasive bladder cancer; Summary of findings 5 Single‐dose, preoperative MMC‐EMDA versus TURBT alone for non‐muscle invasive bladder cancer
We included three unique studies with 672 participants analysed (694 randomised) across five comparisons. See summary of findings Table for the main comparison; summary of findings Table 2; summary of findings Table 3; summary of findings Table 4; summary of findings Table 5.
We used previous data from EORTC trials, the American College of Surgeons National Surgical Quality Improvement Program and systematic reviews to assume baseline risk of main outcomes for the 'Summary of findings' tables (Bouffioux 1995; Gontero 2016; Matulewicz 2015; Oddens 2013; Sylvester 2016).
1. Postoperative MMC‐EMDA induction versus postoperative BCG induction therapy (short term)
We included one study with 72 participants (intervention 36, control 36) with CIS and concurrent pT1 urothelial carcinoma, which compared MMC‐EMDA intravesical instillation with BCG about three weeks after TURBT (Di Stasi 2003). While the median follow‐up period was 43 months, we used the data at three months after intervention (before second session of additional intravesical therapy and cross‐over).
1.1. Time to recurrence
We are uncertain about the effect of MMC‐EMDA on time to recurrence (RR 1.06, 95% CI 0.64 to 1.76). We rated the QoE as very low according to GRADE, downgrading for study limitations and imprecision.
1.2. Time to progression, disease‐specific survival and time to death due to any cause
There was no disease progression, disease‐specific death, and death due to any cause in either intervention group.
1.3. Serious adverse events
We are uncertain about the effect of MMC‐EMDA on serious adverse events (RR 0.75, 95% CI 0.18 to 3.11). We rated the QoE as very low according to GRADE, downgrading for study limitations and imprecision.
1.4. Minor adverse events
We were unable to use data related to minor adverse events due to unit of analysis errors/likely double‐counting of participants.
1.5. Disease‐specific quality of life
We found no data related to disease‐specific quality of life.
Subgroup and sensitivity analysis
We could not perform a subgroup analysis or sensitivity analysis due to lack of relevant data.
2. Postoperative MMC‐EMDA induction versus MMC‐PD induction therapy (short term)
We included one study with 72 participants (intervention 36, control 36) with CIS and concurrent pT1 urothelial carcinoma, which compared MMC‐EMDA intravesical instillation with MMC‐PD about three weeks after TURBT (Di Stasi 2003). Median follow‐up period was 43 months. We used the data at three months after intervention (before second session of additional intravesical therapy and cross‐over).
2.1. Time to recurrence
Postoperative MMC‐EMDA intravesical instillation may reduce disease recurrence but may not represent a clinically important difference (RR 0.65, 95% CI 0.44 to 0.98). We rated the QoE as low according to GRADE, downgrading for study limitations and imprecision. Assuming a baseline risk of recurrence of 42.0% (Witjes 1998), postoperative EMDA would result in 147 fewer recurrences per 1000 participants (95% CI 235 fewer to 8 fewer).
2.2. Time to progression, disease‐specific survival and time to death due to any cause
There was no disease progression, disease‐specific death, and death due to any cause in either intervention group (RR 1.00, 95% CI not estimable).
2.3. Serious adverse events
We are uncertain about the effect of postoperative MMC‐EMDA intravesical instillation on serious adverse events (RR 1.50, 95% CI 0.27 to 8.45). We rated the QoE as very low according to GRADE, downgrading for study limitations and imprecision.
2.4. Minor adverse events
We were unable to use data related to minor adverse events due to unit of analysis error.
2.5. Disease‐specific quality of life
We found no data related to disease‐specific quality of life.
Subgroup and sensitivity analysis
We could not perform a subgroup analysis or sensitivity analysis due to no relevant data.
3. Postoperative MMC‐EMDA with sequential BCG induction and maintenance versus postoperative BCG induction and maintenance therapy (long term)
We included only one study with 212 participants (intervention 107, control 105) with pT1 urothelial carcinoma of the bladder with or without concomitant CIS (Di Stasi 2006). The study compared MMC‐EMDA with sequential BCG with BCG about three weeks after TURBT. Median follow‐up period was 88 months.
3.1. Time to recurrence
Postoperative MMC‐EMDA intravesical instillation with sequential BCG may result in a longer time to recurrence but may not represent a clinically important difference (HR 0.51, 95% CI 0.34 to 0.77). We rated the QoE as low according to GRADE, downgrading for study limitations and imprecision. Assuming a baseline risk of recurrence of 43.0% (Oddens 2013), postoperative EMDA with sequential BCG would result in 181 fewer recurrences per 1000 participants (95% CI 256 fewer to 79 fewer).
3.2. Time to progression
Postoperative MMC‐EMDA intravesical instillation with sequential BCG may result in a longer time to progression but may not represent a clinically important difference (HR 0.36, 95% CI 0.17 to 0.75). We rated the QoE as low according to GRADE, downgrading for study limitations and imprecision. Assuming a baseline risk of progression of 10.0% (Oddens 2013), postoperative EMDA with sequential BCG instillation would result in 63 fewer progressions per 1000 participants (95% CI 82 fewer to 24 fewer).
3.3. Serious adverse events
We are uncertain about the effect of MMC‐EMDA in serious adverse events (RR 1.02, 95% CI 0.21 to 4.94). We rated the QoE as very low according to GRADE, downgrading for study limitations and imprecision.
3.4. Disease‐specific survival
Postoperative MMC‐EMDA with sequential BCG intravesical instillation may improve disease‐specific survival but may not represent a clinically important difference (HR 0.31, 95% CI 0.12 to 0.80). We rated the QoE as low according to GRADE, with downgrading for study limitations and imprecision. Assuming a baseline risk of disease‐specific death of 6.0% (Oddens 2013), postoperative EMDA with sequential BCG instillation would result in 41 fewer deaths per 1000 participants (95% CI 53 fewer to 12 fewer).
3.5. Time to death due to any cause
Postoperative MMC‐EMDA with sequential BCG intravesical instillation may result in little or no difference in time to death (HR 0.59, 95% CI 0.35 to 1.00). We rated the QoE as low according to GRADE, downgrading for study limitations and imprecision.
3.6. Minor adverse events
We found no data related to minor adverse events.
3.7. Disease‐specific quality of life
We found no data related to disease‐specific quality of life.
Subgroup and sensitivity analysis
We did not perform a subgroup analysis or sensitivity analysis due to no relevant data.
4. Single‐dose, preoperative MMC‐EMDA versus single‐dose, postoperative MMC‐PD (long term)
We included only one study with 236 participants (intervention 117, control 119) with primary pTa and pT1 urothelial carcinoma (people with concomitant CIS were excluded), which compared MMC‐EMDA before TURBT with MMC‐PD immediately after TURBT (Di Stasi 2011). Median follow‐up period was 86 months.
4.1. Time to recurrence
Preoperative MMC‐EMDA intravesical instillation likely results in a longer time to recurrence (HR 0.47, 95% CI 0.32 to 0.69). We rated the QoE as moderate according to GRADE, downgrading for study limitations. Assuming a baseline risk of recurrence of 10% (low risk; Sylvester 2016) or 50% (high risk; Sylvester 2016), preoperative MMC‐EMDA would result in 52 fewer recurrences per 1000 participants (95% CI 67 fewer to 30 fewer) (low risk) or 222 fewer recurrences per 1000 participants (95% CI 301 fewer to 120 fewer) (high risk).
4.2. Time to progression
We are uncertain about the effect of preoperative MMC‐EMDA in time to progression (HR 0.81, 95% CI 0.00 to 259.93). We rated the QoE as very low according to GRADE, downgrading for study limitations and imprecision.
4.3. Serious adverse events
We are uncertain about the effect of preoperative MMC‐EMDA in serious adverse events (RR 0.79, 95% CI 0.30 to 2.05). We rated the QoE as very low according to GRADE, downgrading for study limitations and imprecision.
4.4. Disease‐specific survival
Preoperative MMC‐EMDA intravesical instillation may result in little to no difference in disease‐specific survival (HR 0.99, 95% CI 0.74 to 1.32). We rated the QoE as low according to GRADE, downgrading for imprecision.
4.5. Time to death due to any cause
Preoperative MMC‐EMDA intravesical instillation may result in little to no difference in time to death (HR 0.89, 95% CI 0.62 to 1.28). We rated the QoE as low according to GRADE, downgrading for imprecision.
4.6. Minor adverse events
Preoperative MMC‐EMDA intravesical instillation likely reduces minor adverse events (HR 0.55, 95% CI 0.42 to 0.72). We rated the QoE as moderate according to GRADE, downgrading for study limitations. Assuming a baseline risk of minor adverse events of 10.0% (low risk; Bouffioux 1995) and 40.0% (high risk; Witjes 1998), preoperative MMC‐EMDA would result in 45 fewer minor adverse events per 1000 participants (95% CI 58 fewer to 28 fewer) (low risk) and 180 fewer minor adverse events per 1000 participants (95% CI 232 fewer to 112 fewer) (high risk).
4.7. Disease‐specific quality of life
We found no data related to disease‐specific quality of life.
Subgroup and sensitivity analysis
We did not perform a subgroup analysis or sensitivity analysis due to no relevant data.
5. Single‐dose, preoperative MMC‐EMDA versus TURBT alone (long term)
We included only one study with 233 participants (intervention 117, control 116) with primary pTa and pT1 urothelial carcinoma (participants with concomitant CIS were excluded), which compared MMC‐EMDA before TURBT with TURBT without intravesical instillation (Di Stasi 2011). Median follow‐up period was 86 months.
5.1. Time to recurrence
Preoperative MMC‐EMDA intravesical instillation likely results in a longer time to recurrence (HR 0.40, 95% CI 0.28 to 0.57). We rated the QoE as moderate according to GRADE, downgrading for study limitations. Assuming a baseline risk of recurrence of 40% (low risk; Sylvester 2016) and 70% (high risk; Sylvester 2016), preoperative MMC‐EMDA would result in 215 fewer recurrences per 1000 participants (95% CI 267 fewer to 147 fewer) (low risk) and 318 fewer recurrences per 1000 participants (95% CI 414 fewer to 203 fewer) (high risk).
5.2. Time to progression
We are uncertain about the effect of preoperative MMC‐EMDA intravesical instillation in time to progression (HR 0.74, 95% CI 0.00 to 247.93). We rated the QoE as very low according to GRADE, downgrading for study limitations and imprecision.
5.3. Serious adverse events
We are uncertain about the effect of preoperative MMC‐EMDA intravesical instillation in serious adverse events (HR 1.74, 95% CI 0.52 to 5.77). We rated the QoE as very low according to GRADE, downgrading for study limitations and imprecision.
5.4. Disease‐specific survival
Preoperative MMC‐EMDA intravesical instillation likely results in little to no difference in disease‐specific survival (HR 1.06, 95% CI 0.80 to 1.40). We rated the QoE as moderate according to GRADE, downgrading for imprecision.
5.5. Time to death due to any cause
Preoperative MMC‐EMDA intravesical instillation may result in little to no difference in time to death (HR 1.07, 95% CI 0.73 to 1.57). We rated the QoE as low according to GRADE, downgrading for imprecision.
5.6. Minor adverse events
Preoperative MMC‐EMDA intravesical instillation may increase minor adverse events (HR 1.68, 95% CI 1.11 to 2.53). We rated the QoE as low according to GRADE, downgrading for study limitations and imprecision. Assuming a baseline risk of recurrence of 4% (low risk; Matulewicz 2015) or 11% (high risk; Matulewicz 2015), preoperative MMC‐EMDA would result in 27 more minor adverse events per 1000 participants (95% CI 4 more to 61 more) (low risk) or 75 more minor adverse events per 1000 participants (95% CI 12 more to 168 more) (high risk).
5.7. Disease‐specific quality of life
We found no data related to disease‐specific quality of life.
Subgroup and sensitivity analysis
We did not perform a subgroup analysis or sensitivity analysis due to the lack of relevant data.
Discussion
Summary of main results
We identified only three RCTs which informed five separate comparisons (Di Stasi 2003; Di Stasi 2006; Di Stasi 2011). We evaluated 672 participants with NMIBC (Di Stasi 2003; Di Stasi 2006: CIS or concurrent T1 (or both), Di Stasi 2011: Ta or T1). The mean age of included participants ranged from 64.5 to 68.5 years. Two studies enrolled people with primary disease (Di Stasi 2003; Di Stasi 2011), and one study enrolled the people with both primary and recurrent disease (Di Stasi 2006). Median follow‐up of included studies ranged from 43 to 88 months. We were able to use the data at three months after intervention in data analysis due to cross‐over study design (Di Stasi 2003).
1. Postoperative MMC‐EMDA induction versus postoperative BCG induction (short term): we are uncertain about the effect on time to disease recurrence and serious adverse events (very low QoE). There were no events of disease progression at three months to analyse; follow‐up was likely too short to assess this outcome.
2. Postoperative MMC‐EMDA induction versus MMC‐PD induction (short term): based on low QoE, postoperative MMC‐EMDA may reduce disease recurrence. We are uncertain about the effect on serious adverse events (very low QoE). There were no events of disease progression at three months to analyse; follow‐up was likely too short to assess this outcome.
3. Postoperative MMC‐EMDA with sequential BCG induction and maintenance versus postoperative BCG induction and maintenance (long term): based on low QoE, postoperative MMC‐EMDA with sequential BCG may result in a longer time to recurrence and time to progression. We are uncertain about the effect on serious adverse events (very low QoE).
4. Single‐dose, preoperative MMC‐EMDA versus single‐dose, postoperative MMC‐PD (long term): based on moderate QoE, preoperative MMC‐EMDA resulted in a longer time to recurrence. We are uncertain about its effect on time to progression and serious adverse events (very low QoE).
5. Single‐dose, preoperative MMC‐EMDA versus TURBT alone (long term): based on moderate QoE, preoperative MMC‐EMDA resulted in a longer time to recurrence. We are uncertain about its effect on time to progression and serious adverse events (very low QoE).
Overall completeness and applicability of evidence
In this review, we found three trials of five treatment comparisons. These trials were conducted by the same study group based in Italy which has pioneered this technology; however, none of the study findings have been independently replicated by other centres. Similar studies performed by other investigators in other countries would be valuable in validating these findings.
The five comparisons described in this review are of varying degree of clinical interest. For example, the comparison of preoperative MMC‐EMDA intravesical instillation versus TURBT alone is not very informative since TURBT alone is not the standard of practice for this patient population. Similarly, in Di Stasi 2003, people with recurrent tumours received an additional six‐week course of the same agent after an initial course of induction therapy, whereas repeat TURBT would be the standard of care. Therefore, we only used data up to three months of follow‐up, which is of limited value.
Based on current evidence‐based guidelines (Babjuk 2017; Chang 2016), after TURBT, people should undergo immediate postoperative installation of MMC followed by an induction course of MMC or BCG, with or without maintenance therapy based on their risk of recurrence. None of the trials we identified used this comparison, which is considered the standard of care and therefore the most appropriate comparison. These issues limit clinical applicability. Future studies should compare EMDA to established standards of care. In addition, a number of other clinical factors may impact the effectiveness of intravesical therapy in the intervention and control arms; these include fluid status, drug concentration and BCG strain; assessing their impact was beyond the scope of this review.
All included studies in this review used MMC as the EMDA agent. We found no studies using other chemotherapeutic agents (Porten 2015; Veeratterapillay 2016). It is unknown whether EMDA has utility in conjunction with other intravesical agents.
We were unable to analyse data for minor adverse events from the studies due to the way the information was reported. Using the presented data would have resulted in double‐ and triple counting of participants with more than one adverse event resulting in a unit of analysis issue (Di Stasi 2003; Di Stasi 2006). We were unable to obtain additional data to address this issue from the study investigators. We did not find information on disease‐specific quality of life.
The use of EMDA requires additional equipment which may be costly. Although an economic analysis was outside the scope of this review, this may represent a barrier to its uptake in clinical practice.
Quality of the evidence
We consistently downgraded the QoE for all five comparisons. The QoE was most commonly rated as very low to low; in select cases, we found moderate QoE. Issues that lowered our confidence in the estimates of effect were study limitations, specifically unclear allocation concealment (selection bias) and the lack of blinding (performance and detection bias). We also frequently downgraded for imprecision due to relatively low event rates that resulted in wide CIs. Due to the paucity of studies, we were unable to formally assess the possibility of publication bias.
Potential biases in the review process
Although we conducted this systematic review with a comprehensive search strategy identical with current standards of Cochrane, we found only three RCTs. There is a possibility that despite our best efforts, which included contacting the principal investigator of the existing studies as well as inquiring with experts in the field, we may have missed additional studies. This may be because they were published in languages other than English (although we applied no language restrictions), were published in non‐indexed journals or were unpublished.
We contacted the study authors on several occasions and they provided feedback to several of our queries. However, we did not obtain data for minor adverse events in studies that used MMC‐EMDA postoperatively. This may represent a source of bias with potential under‐reporting of the true treatment burden.
Agreements and disagreements with other studies or reviews
We identified one rapid review performed by the Canadian Agency for Drugs and Technologies in Health (CADTH 2014). They included one trial (Di Stasi 2011), which was also included in our review. Their review was based on a limited search (English language documents published between January 2009 and August 2014) and concluded that there was little evidence on the efficacy and safety of EMDA to treat NMIBC (CADTH 2014).
Narrative reviews suggested that EMDA appears to improve response rates that might be equivalent to BCG in the short term but long‐term efficacy data are lacking in cases of high‐grade NMIBC (Porten 2015; Veeratterapillay 2016). These narrative reviews also included the same RCTs that were included in the present review (Di Stasi 2003; Di Stasi 2006; Di Stasi 2011), but lacked a formal assessment of the QoE.

Study flow diagram.

Risk of bias graph: review authors' judgements about each risk of bias item presented as percentages across all included studies.
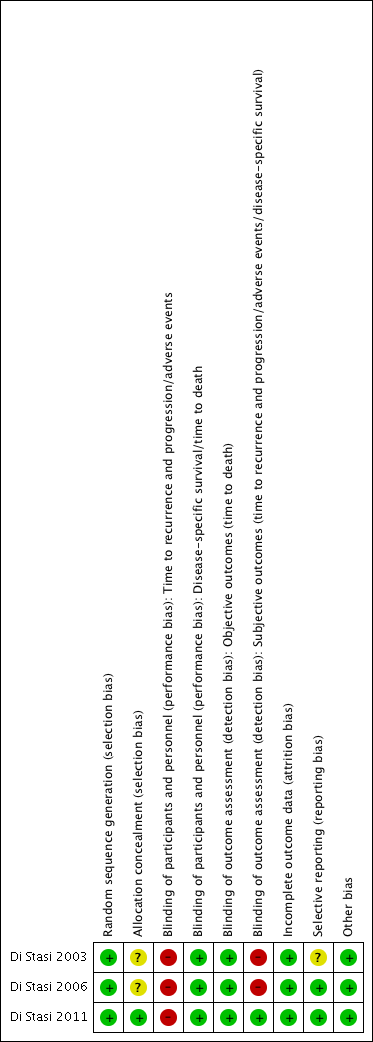
Risk of bias summary: review authors' judgements about each risk of bias item for each included study.

Comparison 1 Postoperative MMC‐EMDA induction versus postoperative BCG induction (short term), Outcome 1 Time to recurrence.

Comparison 1 Postoperative MMC‐EMDA induction versus postoperative BCG induction (short term), Outcome 2 Time to progression.
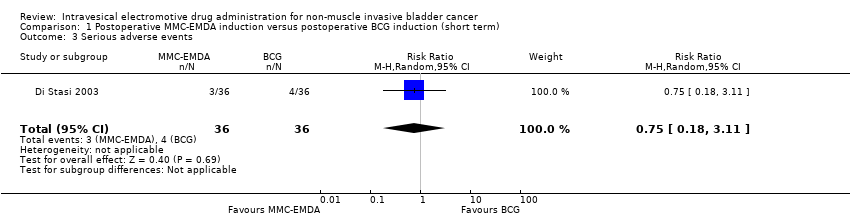
Comparison 1 Postoperative MMC‐EMDA induction versus postoperative BCG induction (short term), Outcome 3 Serious adverse events.

Comparison 1 Postoperative MMC‐EMDA induction versus postoperative BCG induction (short term), Outcome 4 Disease‐specific survival.

Comparison 1 Postoperative MMC‐EMDA induction versus postoperative BCG induction (short term), Outcome 5 Time to death.

Comparison 2 Postoperative MMC‐EMDA induction versus MMC‐PD induction (short term), Outcome 1 Time to recurrence.
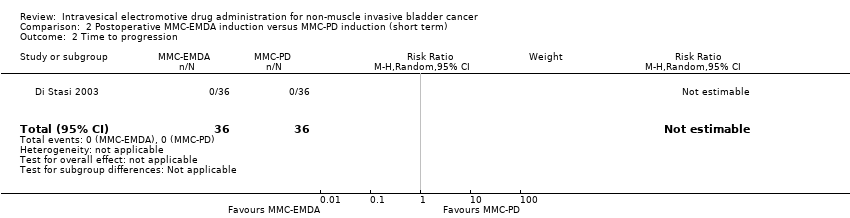
Comparison 2 Postoperative MMC‐EMDA induction versus MMC‐PD induction (short term), Outcome 2 Time to progression.
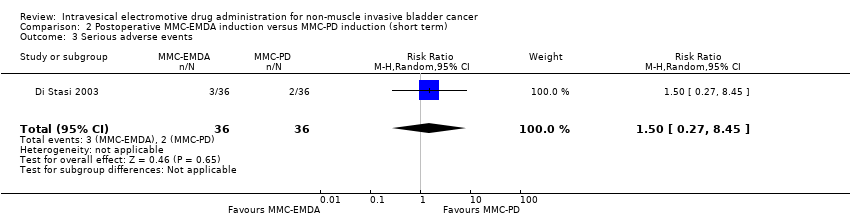
Comparison 2 Postoperative MMC‐EMDA induction versus MMC‐PD induction (short term), Outcome 3 Serious adverse events.

Comparison 2 Postoperative MMC‐EMDA induction versus MMC‐PD induction (short term), Outcome 4 Disease‐specific survival.

Comparison 2 Postoperative MMC‐EMDA induction versus MMC‐PD induction (short term), Outcome 5 Time to death.
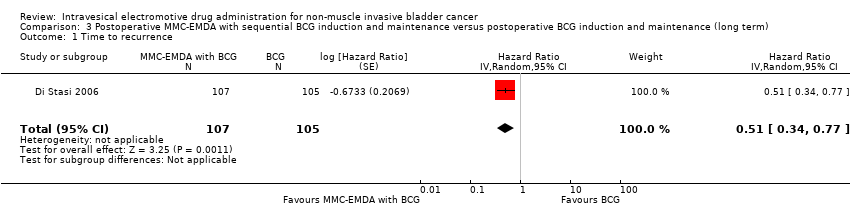
Comparison 3 Postoperative MMC‐EMDA with sequential BCG induction and maintenance versus postoperative BCG induction and maintenance (long term), Outcome 1 Time to recurrence.
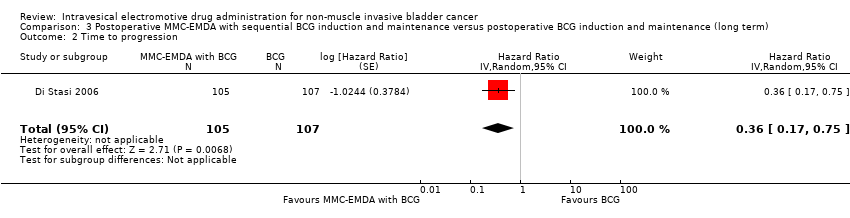
Comparison 3 Postoperative MMC‐EMDA with sequential BCG induction and maintenance versus postoperative BCG induction and maintenance (long term), Outcome 2 Time to progression.
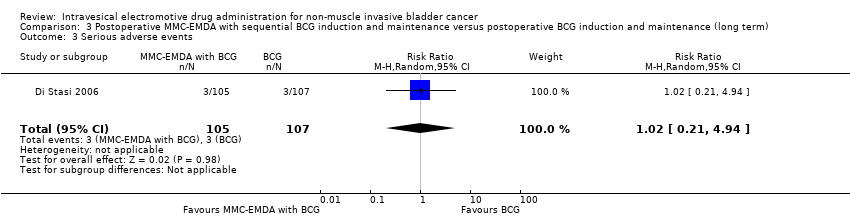
Comparison 3 Postoperative MMC‐EMDA with sequential BCG induction and maintenance versus postoperative BCG induction and maintenance (long term), Outcome 3 Serious adverse events.

Comparison 3 Postoperative MMC‐EMDA with sequential BCG induction and maintenance versus postoperative BCG induction and maintenance (long term), Outcome 4 Disease‐specific survival.
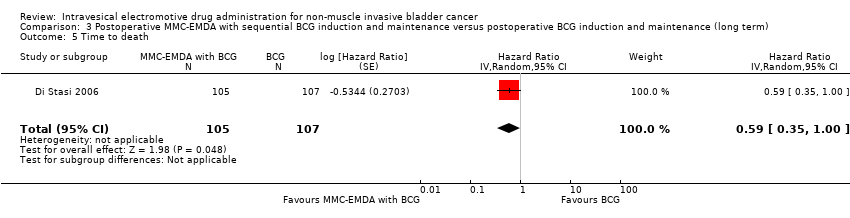
Comparison 3 Postoperative MMC‐EMDA with sequential BCG induction and maintenance versus postoperative BCG induction and maintenance (long term), Outcome 5 Time to death.
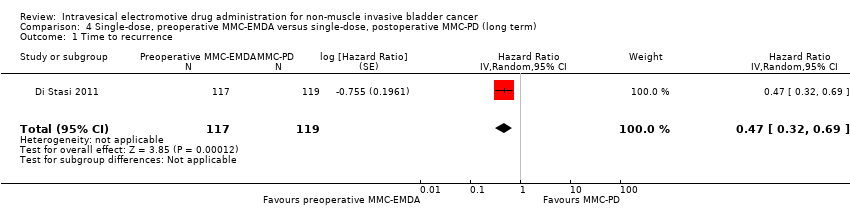
Comparison 4 Single‐dose, preoperative MMC‐EMDA versus single‐dose, postoperative MMC‐PD (long term), Outcome 1 Time to recurrence.
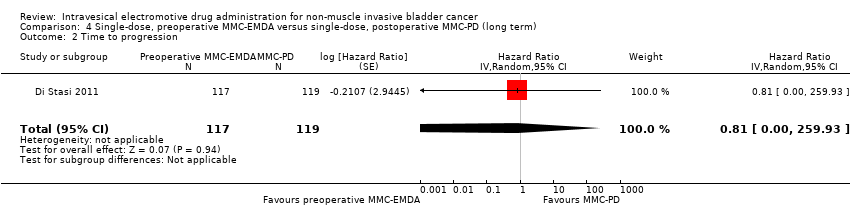
Comparison 4 Single‐dose, preoperative MMC‐EMDA versus single‐dose, postoperative MMC‐PD (long term), Outcome 2 Time to progression.
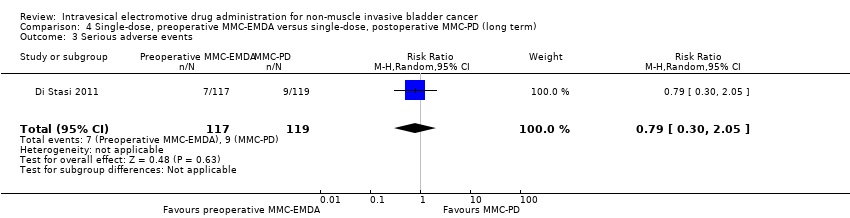
Comparison 4 Single‐dose, preoperative MMC‐EMDA versus single‐dose, postoperative MMC‐PD (long term), Outcome 3 Serious adverse events.
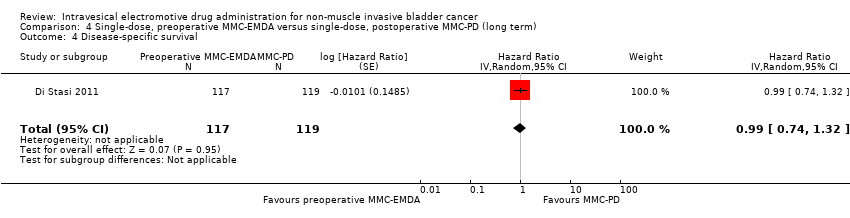
Comparison 4 Single‐dose, preoperative MMC‐EMDA versus single‐dose, postoperative MMC‐PD (long term), Outcome 4 Disease‐specific survival.
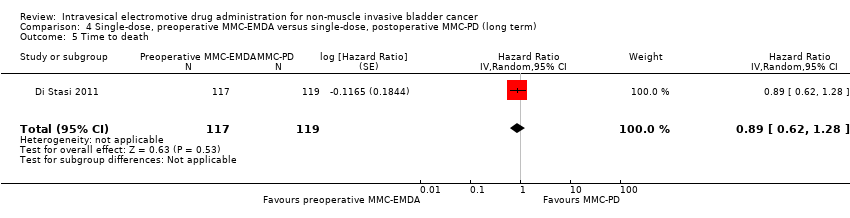
Comparison 4 Single‐dose, preoperative MMC‐EMDA versus single‐dose, postoperative MMC‐PD (long term), Outcome 5 Time to death.

Comparison 4 Single‐dose, preoperative MMC‐EMDA versus single‐dose, postoperative MMC‐PD (long term), Outcome 6 Minor adverse events.

Comparison 5 Single‐dose, preoperative MMC‐EMDA versus TURBT alone (long term), Outcome 1 Time to recurrence.

Comparison 5 Single‐dose, preoperative MMC‐EMDA versus TURBT alone (long term), Outcome 2 Time to progression.

Comparison 5 Single‐dose, preoperative MMC‐EMDA versus TURBT alone (long term), Outcome 3 Serious adverse events.
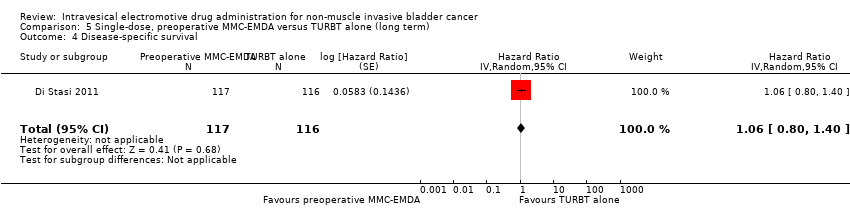
Comparison 5 Single‐dose, preoperative MMC‐EMDA versus TURBT alone (long term), Outcome 4 Disease‐specific survival.

Comparison 5 Single‐dose, preoperative MMC‐EMDA versus TURBT alone (long term), Outcome 5 Time to death.
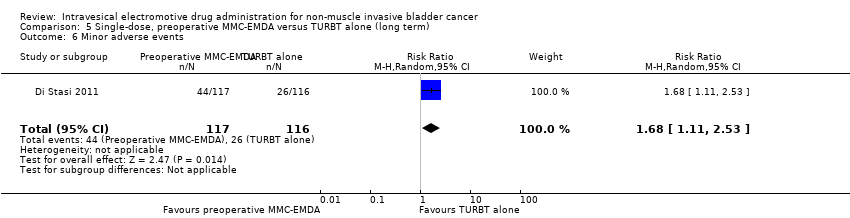
Comparison 5 Single‐dose, preoperative MMC‐EMDA versus TURBT alone (long term), Outcome 6 Minor adverse events.
| Participants: people with non‐muscle invasive bladder cancer (multifocal carcinoma in situ or concurrent pT1, or both) Setting: multicentre study in Italy (all comparisons in the review stemmed from same study group) Intervention: initial 6 MMC‐EMDA intravesical instillations at weekly interval about 3 weeks after TURBT Control: initial 6 BCG intravesical instillations at weekly interval about 3 weeks after TURBT | |||||
| Outcomes | No of participants | Quality of the evidence | Relative effect | Anticipated absolute effects* (95% CI) | |
| Risk with BCG | Risk difference with postoperative MMC‐EMDA | ||||
| Time to recurrence Follow‐up: mean 3 months | 72 | ⊕⊝⊝⊝ | RR 1.06 | Study population | |
| 444 per 1000 | 27 more per 1000 | ||||
| Moderate | |||||
| 500 per 1000 3 | 30 more per 1000 | ||||
| Time to progression Follow‐up: mean 3 months | 72 | ⊕⊕⊝⊝ | Not estimable | Study population | |
| ‐ | ‐ | ||||
| Serious adverse events Follow‐up: mean 3 months | 72 | ⊕⊝⊝⊝ | RR 0.75 | Study population | |
| 111 per 1000 | 28 fewer per 1000 | ||||
| High | |||||
| 60 per 1000 5 | 15 fewer per 1000 | ||||
| Disease‐specific survival Follow‐up: mean 3 months | 72 | ⊕⊕⊝⊝ | Not estimable | Study population | |
| ‐ | ‐ | ||||
| Disease‐specific quality of life ‐ not reported | ‐ | ‐ | ‐ | ‐ | ‐ |
| *The risk in the intervention group (and its 95% confidence interval) is based on the assumed risk in the comparison group and the relative effect of the intervention (and its 95% CI). BCG: Bacillus Calmette‐Guérin; CI: confidence interval; MMC‐EMDA: electromotive drug administration of mitomycin C; RCT: randomised controlled trial; RR: risk ratio; TURBT: transurethral resection of bladder tumour. | |||||
| GRADE Working Group grades of evidence | |||||
| 1 Downgraded by one level for study limitations: unclear risk of selection bias and high risk of performance, detection and other bias. 2 Downgraded by two level for imprecision: confidence interval was wide and crossed assumed clinically meaningful threshold. 3Gontero 2016: recurrence rate of bladder cancer after TURBT with postoperative six induction instillations of BCG was 50.7% on median follow‐up of 5.2 years. 4 Downgraded by one level for imprecision: no event. 5Witjes 1998: incidence of systemic adverse events after TURBT with postoperative BCG instillations for 6 consecutive weeks was 6% on a long‐term median follow‐up of more than 7 years. | |||||
| Participants: people with non‐muscle invasive bladder cancer (carcinoma in situ or concurrent pT1, or both) Setting: multicentre study in Italy (all comparisons in the review stemmed from same study group) Intervention: initial 6 MMC‐EMDA intravesical instillations at weekly interval about 3 weeks after TURBT Control: initial 6 MMC‐PD intravesical instillations at weekly interval about 3 weeks after TURBT | |||||
| Outcomes | No of participants | Quality of the evidence | Relative effect | Anticipated absolute effects* (95% CI) | |
| Risk with MMC‐PD | Risk difference with postoperative MMC‐EMDA | ||||
| Time to recurrence Follow‐up: mean 3 months | 72 | ⊕⊕⊝⊝ | RR 0.65 | Study population | |
| 722 per 1000 | 253 fewer per 1000 | ||||
| Moderate | |||||
| 420 per 1000 3 | 147 fewer per 1000 | ||||
| Time to progression Follow‐up: mean 3 months | 72 | ⊕⊕⊝⊝ | Not estimable | Study population | |
| ‐ | ‐ | ||||
| Serious adverse events Follow‐up: mean 3 months | 72 | ⊕⊝⊝⊝ | RR 1.50 | Study population | |
| 56 per 1000 | 28 more per 1000 | ||||
| High | |||||
| 30 per 10003 | 15 more per 1000 | ||||
| Disease‐specific survival Follow‐up: mean 3 months | 72 | ⊕⊕⊝⊝ | Not estimable | Study population | |
| ‐ | ‐ | ||||
| Disease‐specific quality of life ‐ not reported | ‐ | ‐ | ‐ | ‐ | ‐ |
| *The risk in the intervention group (and its 95% confidence interval) is based on the assumed risk in the comparison group and the relative effect of the intervention (and its 95% CI). CI: confidence interval; MMC‐EMDA: electromotive drug administration of mitomycin C; MMC‐PD: passive diffusion of mitomycin C; RCT: randomised controlled trial; RR: risk ratio; TURBT: transurethral resection of bladder tumour. | |||||
| GRADE Working Group grades of evidence | |||||
| 1 Downgraded by one level for study limitations: unclear risk of selection bias, high risk of performance, detection and other bias. 2 Downgraded by one level for imprecision: confidence interval crossed assumed clinically meaningful threshold. 3Witjes 1998: recurrence rate of bladder cancer after TURBT with postoperative MMC‐PD instillations (total 5 instillations) was 42.8% and incidence of systemic adverse events was 3% based on a long‐term median follow‐up of more than 7 years. 4 Downgraded by one level for imprecision: no event. 5 Downgraded by two level for imprecision: confidence interval was wide and crossed assumed clinically meaningful threshold. | |||||
| Participants: people with non‐muscle invasive bladder cancer (pT1 or carcinoma in situ of the bladder, or both) Setting: multicentre study in Italy (all comparisons in the review stemmed from same study group) Intervention: initial 3 cycles of MMC‐EMDA with BCG intravesical instillation (cycle: 2 BCG followed by 1 MMC‐EMDA) at weekly interval about 3 weeks after TURBT, and 3 cycles of MMC‐EMDA with BCG intravesical instillations (monthly instillation, cycle: 2 MMC‐EMDA followed by 1 BCG) for 9 months Control: initial 6 BCG intravesical instillations at weekly interval about 3 weeks after TURBT, and BCG monthly instillation for 10 months | |||||
| Outcomes | No of participants | Quality of the evidence | Relative effect | Anticipated absolute effects* (95% CI) | |
| Risk with BCG | Risk difference with postoperative MMC‐EMDA with BCG | ||||
| Time to recurrence Follow‐up: median 88 months | 212 | ⊕⊕⊝⊝ | HR 0.51 | Study population | |
| 581 per 1000 | 223 fewer per 1000 | ||||
| Moderate | |||||
| 430 per 1000 3 | 181 fewer per 1000 | ||||
| Time to progression Follow‐up: median 88 months | 212 | ⊕⊕⊝⊝ | HR 0.36 | Study population | |
| 215 per 1000 | 132 fewer per 1000 | ||||
| Moderate | |||||
| 100 per 1000 3 | 63 fewer per 1000 | ||||
| Serious adverse events Follow‐up: median 88 months | 212 | ⊕⊝⊝⊝ | RR 1.02 | Study population | |
| 28 per 1000 | 1 more per 1000 | ||||
| High | |||||
| 70 per 1000 3 | 1 more per 1000 | ||||
| Disease‐specific survival Follow‐up: median 88 months | 212 | ⊕⊕⊝⊝ | HR 0.31 | Study population | |
| 159 per 1000 | 107 fewer per 1000 | ||||
| Moderate | |||||
| 60 per 1000 3 | 41 fewer per 1000 | ||||
| Disease‐specific quality of life ‐ not reported | ‐ | ‐ | ‐ | ‐ | ‐ |
| *The risk in the intervention group (and its 95% confidence interval) is based on the assumed risk in the comparison group and the relative effect of the intervention (and its 95% CI). BCG: Bacillus Calmette‐Guérin; CI: confidence interval; HR: hazard ratio; MMC‐EMDA: electromotive drug administration of mitomycin C; RCT: randomised controlled trial; RR: risk ratio; TURBT: transurethral resection of bladder tumour. | |||||
| GRADE Working Group grades of evidence | |||||
| 1 Downgrade by one level for study limitations: unclear risk of selection and attrition bias and high risk of performance and detection bias. 2 Downgrade by one level for imprecision: confidence interval crossed assumed clinically meaningful threshold. 3Oddens 2013: disease recurrence, progression and disease‐specific death after TURBT with BCG maintenance therapy (once a week for 6 weeks, followed by three weekly instillations at months 3, 6 and 12) were 42.8%, 9.1% and 5.9%, respectively and stopped treatment due to local or systemic adverse events was 7% based on a long‐term median follow‐up of more than 7.1 years. 4 Downgrade by one level for study limitations: unclear risk of selection bias and high risk of performance and detection bias. 5 Downgraded by two level for imprecision: confidence interval was wide and crossed assumed clinically meaningful threshold. | |||||
| Participants: people with non‐muscle invasive bladder cancer (primary pTa and pT1 urothelial carcinoma) Setting: multicentre study in Italy (all comparisons in the review stemmed from same study group) Intervention: single MMC‐EMDA intravesical instillation about 30 minutes before spinal or general anaesthesia for TURBT Control: single MMC‐PD intravesical instillation immediately after TURBT | |||||
| Outcomes | No of participants | Quality of the evidence | Relative effect | Anticipated absolute effects* (95% CI) | |
| Risk with MMC‐PD | Risk difference with preoperative MMC‐EMDA | ||||
| Time to recurrence Follow‐up: median 86 months | 236 | ⊕⊕⊕⊝ | HR 0.47 | Study population | |
| 588 per 1000 | 247 fewer per 1000 | ||||
| Low 2 | |||||
| 100 per 1000 | 52 fewer per 1000 | ||||
| High 2 | |||||
| 500 per 1000 | 222 fewer per 1000 | ||||
| Time to progression Follow‐up: median 86 months | 236 | ⊕⊝⊝⊝ | HR 0.81 | Study population | |
| 193 per 1000 | 34 fewer per 1000 | ||||
| Low 2 | |||||
| 20 per 1000 | 4 fewer per 1000 | ||||
| High 2 | |||||
| 100 per 1000 | 18 fewer per 1000 | ||||
| Serious adverse events Follow‐up: median 86 months | 236 | ⊕⊝⊝⊝ | RR 0.79 | Study population | |
| 76 per 1000 | 16 fewer per 1000 | ||||
| High 4 | |||||
| 30 per 1000 | 6 fewer per 1000 | ||||
| Disease‐specific survival Follow‐up: median 86 months | 236 | ⊕⊕⊝⊝ | HR 0.99 | Study population | |
| 126 per 1000 | 1 fewer per 1000 | ||||
| Low 2 | |||||
| 20 per 1000 | 0 fewer per 1000 | ||||
| High 2 | |||||
| 60 per 1000 | 1 fewer per 1000 | ||||
| Disease‐specific quality of life ‐ not reported | ‐ | ‐ | ‐ | ‐ | ‐ |
| *The risk in the intervention group (and its 95% confidence interval) is based on the assumed risk in the comparison group and the relative effect of the intervention (and its 95% CI). CI: confidence interval; HR: hazard ratio; MMC‐EMDA: electromotive drug administration of mitomycin C; MMC‐PD: passive diffusion of mitomycin C; RCT: randomised controlled trial; RR: risk ratio; TURBT: transurethral resection of bladder tumour. | |||||
| GRADE Working Group grades of evidence | |||||
| 1 Downgraded by one level for study limitations: high risk of performance bias. 2Sylvester 2016: baseline risks of time to recurrence and progression, and disease‐specific survival were estimated from included studies in a systematic review and meta‐analysis of RCTs comparing the efficacy of a single instillation of MMC after TURBT with TURBTs alone. 3 Downgraded by two level for imprecision: confidence interval was wide and crossed clinically meaningful threshold. 4Witjes 1998: incidence of systemic adverse events after TURBT with postoperative MMC‐PD instillations (total 5 instillations) was 3% based on a long‐term median follow‐up of more than 7 years. | |||||
| Participants: people with non‐muscle invasive bladder cancer (primary pTa and pT1 urothelial carcinoma) Setting: multicentre study in Italy (all comparisons in the review stemmed from same study group) Intervention: single MMC‐EMDA intravesical instillation about 30 minutes before spinal or general anaesthesia for TURBT Control: TURBT alone | |||||
| Outcomes | No of participants | Quality of the evidence | Relative effect | Anticipated absolute effects* (95% CI) | |
| Risk with TURBT alone | Risk difference with preoperative MMC‐EMDA | ||||
| Time to recurrence Follow‐up: median 86 months | 233 | ⊕⊕⊕⊝ | HR 0.40 | Study population | |
| 638 per 1000 | 304 fewer per 1000 | ||||
| Low 2 | |||||
| 400 per 1000 | 215 fewer per 1000 | ||||
| High 2 | |||||
| 700 per 1000 | 318 fewer per 1000 | ||||
| Time to progression Follow‐up: median 86 months | 233 | ⊕⊝⊝⊝ | HR 0.74 | Study population | |
| 207 per 1000 | 49 fewer per 1000 | ||||
| Low 2 | |||||
| 20 per 1000 | 5 fewer per 1000 | ||||
| High 2 | |||||
| 100 per 1000 | 25 fewer per 1000 | ||||
| Serious adverse events Follow‐up: median 86 months | 233 | ⊕⊝⊝⊝ | RR 1.74 | Study population | |
| 34 per 1000 | 26 more per 1000 | ||||
| Moderate 4 | |||||
| 30 per 1000 | 22 more per 1000 | ||||
| Disease‐specific survival Follow‐up: median 86 months | 233 | ⊕⊕⊕⊝ | HR 1.06 | Study population | |
| 129 per 1000 | 7 more per 1000 | ||||
| Low 2 | |||||
| 20 per 1000 | 1 more per 1000 | ||||
| High 2 | |||||
| 100 per 1000 | 6 more per 1000 | ||||
| Disease‐specific quality of life ‐ not reported | ‐ | ‐ | ‐ | ‐ | ‐ |
| *The risk in the intervention group (and its 95% confidence interval) is based on the assumed risk in the comparison group and the relative effect of the intervention (and its 95% CI). CI: confidence interval; HR: hazard ratio; MMC‐EMDA: electromotive drug administration of mitomycin C; RCT: randomised controlled trial; RR: risk ratio; TURBT: transurethral resection of bladder tumour. | |||||
| GRADE Working Group grades of evidence | |||||
| 1 Downgraded by one level for study limitations: high risk of performance bias. 2Sylvester 2016: baseline risks of time to recurrence and progression, and disease‐specific survival were estimated from included studies in a systematic review and meta‐analysis of RCTs comparing the efficacy of a single instillation of MMC after TURBT with TURBT alone. 3 Downgraded by two level for imprecision: confidence interval was wide and crossed assumed clinically meaningful threshold. 4Matulewicz 2015: rates of death and overall adverse events rate after TURBT were 2.8% and 5.8%. 5 Downgraded by one level for imprecision: confidence interval crossed assumed clinically meaningful threshold. | |||||
| Study name | Trial | Setting | Participants | Intervention(s) and comparator(s) | Description of intervention | Median age (years, interquartile range) | Disease characteristics (n) | Median follow‐up (months, interquartile range) |
| June 1994 to March 2001 | Multicentre/Italy | People with histologically confirmed multifocal CIS of the bladder and most had concurrent pT1 papillary transitional‐cell carcinoma (all primary disease). | MMC‐EMDA induction after TURBT | 6 intravesical instillation at weekly intervals. | 64.5 (not reported) | Ta/T1: 0/32 Grade: not reported CIS: 36 | 43 (not reported) | |
| MMC‐PD induction after TURBT | 68.5 (not reported) | Ta/T1: 0/33 Grade: not reported CIS: 36 | ||||||
| BCG induction after TURBT | 66.5 (not reported) | Ta/T1: 0/33 Grade: not reported CIS: 36 | ||||||
| 1 January 1994 to 30 June 2002 | Multicentre/Italy | People with histologically confirmed stage pT1 transitional‐cell carcinoma of the bladder were regarded as being at high risk for tumour recurrence and at moderate to high risk for progression because of: multifocal pT1, primary or recurrent, grade 2 transitional‐cell carcinoma; primary or recurrent pT1, multifocal or solitary, grade 3 transitional‐cell carcinoma; or pT1 with CIS. | MMC‐EMDA with sequential BCG induction and maintenance after TURBT | Induction: 3 cycles of treatment per week for 9 weeks for which 1 cycle consisted of 2 BCG infusions and 1 MMC infusion Maintenance: 1 infusion per month for 9 months: 3 cycles of MMC, MMC and BCG. | 66.0 (56.0‐73.0) | Ta/T1: all T1 disease Grade: 0/65/42 CIS: 29 | 88 (63‐110) | |
| BCG induction and maintenance after TURBT | Induction: 6 intravesical treatments at weekly intervals Maintenance: monthly infusion of BCG for 10 months. | 67.0 (61.0‐73.0) | Ta/T1: all T1 disease Grade: 0/64/41 CIS: 28 | |||||
| 1 January 1994 to 31 December 2003 | Multicentre/Italy | People with pTa and pT1 urothelial carcinoma. | Single‐dose, MMC‐EMDA before TURBT | Single intravesical instillation about 30 minutes before spinal or general anaesthesia. | 67.0 (63.0‐74.0) | Ta/T1: 63/54 Grade: 22/62/33 CIS: not reported | 86 (57‐125) | |
| Single‐dose, MMC‐PD immediately after TURBT | Single intravesical instillation within 6 hours of TURBT. | 67.0 (61.0‐72.0) | Ta/T1: 64/55 Grade: 23/64/32 CIS: not reported | |||||
| TURBT alone | No intravesical instillation. | 66.5 (60.0‐73.0) | Ta/T1: 63/53 Grade: 21/63/32 CIS: not reported | |||||
| BCG: Bacillus Calmette‐Guérin; CIS: carcinoma in situ; MMC‐EMDA: electromotive drug administration of mitomycin C; MMC‐PD: passive diffusion of mitomycin C; TURBT: transurethral resection of bladder tumour. | ||||||||
| Study name | Intervention(s) and comparator(s) | Screened/eligible (n) | Randomised (n) | Treatment completion (n (%)) | Analysed (n (%)) |
| MMC‐EMDA induction after TURBT | Not reported/117 | 36 | 36 (100) | 36 (100) | |
| MMC‐PD induction after TURBT | 36 | 36 (100) | 36 (100) | ||
| BCG induction after TURBT | 36 | 36 (100) | 36 (100) | ||
| Total | 108 | 108 (100) | 108 (100) | ||
| MMC‐EMDA with sequential BCG induction and maintenance after TURBT | 241/212 | 107 | 96 (89) | 107 (100) | |
| BCG induction and maintenance after TURBT | 105 | 94 (89) | 105 (100) | ||
| Total | 212 | 190 (89) | 212 (100) | ||
| Single‐dose, MMC‐EMDA before TURBT | 398/374 | 124 | 117 (94) | 117 (94) | |
| Single‐dose, MMC‐PD immediately after TURBT | 126 | 119 (94) | 119 (94) | ||
| TURBT alone | 124 | 116 (93) | 116 (93) | ||
| Total | 374 | 352 (94) | 352 (94) | ||
| Grand total | 694 | 650 (93) | 672 (96) | ||
| BCG: Bacillus Calmette‐Guérin; MMC‐EMDA: electromotive drug administration of mitomycin C; MMC‐PD: passive diffusion of mitomycin C; n: number of participants; TURBT: transurethral resection of bladder tumour. | |||||
| Outcome or subgroup title | No. of studies | No. of participants | Statistical method | Effect size |
| 1 Time to recurrence Show forest plot | 1 | 72 | Risk Ratio (M‐H, Random, 95% CI) | 1.06 [0.64, 1.76] |
| 2 Time to progression Show forest plot | 1 | 72 | Risk Ratio (M‐H, Random, 95% CI) | 0.0 [0.0, 0.0] |
| 3 Serious adverse events Show forest plot | 1 | 72 | Risk Ratio (M‐H, Random, 95% CI) | 0.75 [0.18, 3.11] |
| 4 Disease‐specific survival Show forest plot | 1 | 72 | Risk Ratio (M‐H, Random, 95% CI) | 0.0 [0.0, 0.0] |
| 5 Time to death Show forest plot | 1 | 72 | Risk Ratio (M‐H, Random, 95% CI) | 0.0 [0.0, 0.0] |
| Outcome or subgroup title | No. of studies | No. of participants | Statistical method | Effect size |
| 1 Time to recurrence Show forest plot | 1 | 72 | Risk Ratio (M‐H, Random, 95% CI) | 0.65 [0.44, 0.98] |
| 2 Time to progression Show forest plot | 1 | 72 | Risk Ratio (M‐H, Random, 95% CI) | 0.0 [0.0, 0.0] |
| 3 Serious adverse events Show forest plot | 1 | 72 | Risk Ratio (M‐H, Random, 95% CI) | 1.5 [0.27, 8.45] |
| 4 Disease‐specific survival Show forest plot | 1 | 72 | Risk Ratio (M‐H, Random, 95% CI) | 0.0 [0.0, 0.0] |
| 5 Time to death Show forest plot | 1 | 72 | Risk Ratio (M‐H, Random, 95% CI) | 0.0 [0.0, 0.0] |
| Outcome or subgroup title | No. of studies | No. of participants | Statistical method | Effect size |
| 1 Time to recurrence Show forest plot | 1 | 212 | Hazard Ratio (Random, 95% CI) | 0.51 [0.34, 0.77] |
| 2 Time to progression Show forest plot | 1 | 212 | Hazard Ratio (Random, 95% CI) | 0.36 [0.17, 0.75] |
| 3 Serious adverse events Show forest plot | 1 | 212 | Risk Ratio (M‐H, Random, 95% CI) | 1.02 [0.21, 4.94] |
| 4 Disease‐specific survival Show forest plot | 1 | 212 | Hazard Ratio (Random, 95% CI) | 0.31 [0.12, 0.80] |
| 5 Time to death Show forest plot | 1 | 212 | Hazard Ratio (Random, 95% CI) | 0.59 [0.35, 1.00] |
| Outcome or subgroup title | No. of studies | No. of participants | Statistical method | Effect size |
| 1 Time to recurrence Show forest plot | 1 | 236 | Hazard Ratio (Random, 95% CI) | 0.47 [0.32, 0.69] |
| 2 Time to progression Show forest plot | 1 | 236 | Hazard Ratio (Random, 95% CI) | 0.81 [0.00, 259.93] |
| 3 Serious adverse events Show forest plot | 1 | 236 | Risk Ratio (M‐H, Random, 95% CI) | 0.79 [0.30, 2.05] |
| 4 Disease‐specific survival Show forest plot | 1 | 236 | Hazard Ratio (Random, 95% CI) | 0.99 [0.74, 1.32] |
| 5 Time to death Show forest plot | 1 | 236 | Hazard Ratio (Random, 95% CI) | 0.89 [0.62, 1.28] |
| 6 Minor adverse events Show forest plot | 1 | 236 | Risk Ratio (M‐H, Random, 95% CI) | 0.55 [0.42, 0.72] |
| Outcome or subgroup title | No. of studies | No. of participants | Statistical method | Effect size |
| 1 Time to recurrence Show forest plot | 1 | 233 | Hazard Ratio (Random, 95% CI) | 0.40 [0.28, 0.57] |
| 2 Time to progression Show forest plot | 1 | 233 | Hazard Ratio (Random, 95% CI) | 0.74 [0.00, 247.93] |
| 3 Serious adverse events Show forest plot | 1 | 233 | Risk Ratio (M‐H, Random, 95% CI) | 1.74 [0.52, 5.77] |
| 4 Disease‐specific survival Show forest plot | 1 | 233 | Hazard Ratio (Random, 95% CI) | 1.06 [0.80, 1.40] |
| 5 Time to death Show forest plot | 1 | 233 | Hazard Ratio (Random, 95% CI) | 1.07 [0.73, 1.57] |
| 6 Minor adverse events Show forest plot | 1 | 233 | Risk Ratio (M‐H, Random, 95% CI) | 1.68 [1.11, 2.53] |