Intervenciones para la coriorretinopatía serosa central: un metanálisis en red
Información
- DOI:
- https://doi.org/10.1002/14651858.CD011841.pub2Copiar DOI

- Base de datos:
-
- Cochrane Database of Systematic Reviews
- Versión publicada:
-
- 22 diciembre 2015see what's new
- Tipo:
-
- Intervention
- Etapa:
-
- Review
- Grupo Editorial Cochrane:
-
Grupo Cochrane de Salud ocular y de la visión
- Copyright:
-
- Copyright © 2015 The Cochrane Collaboration. Published by John Wiley & Sons, Ltd.
Cifras del artículo
Altmetric:
Citado por:
Autores
Contributions of authors
Each author has undertaken all of the following tasks listed:
-
conceived or designed the study, or both;
-
drafted the review or commented on it critically for intellectual content;
-
provided final approval of the document to be published.
MS, AL, and JE performed study screening and data extraction.
Sources of support
Internal sources
-
National Institute of Health Research (NIHR), UK.
This review was funded through the NIHR Cochrane Incentive Scheme and partly funded Jennifer Evan's salary.
External sources
-
Cochrane Eyes and Vision US Project, supported by cooperative agreement 1 U01 EY020522, National Eye Institute, National Institutes of Health, Department of Health and Human Services, USA.
-
National Institute for Health Research (NIHR), UK.
-
Richard Wormald, Co‐ordinating Editor for Cochrane Eyes and Vision (CEV) acknowledges financial support for his CEV research sessions from the Department of Health through the award made by the National Institute for Health Research to Moorfields Eye Hospital NHS Foundation Trust and UCL Institute of Ophthalmology for a Specialist Biomedical Research Centre for Ophthalmology.
-
The NIHR also funds the CEV Editorial Base in London.
The views expressed in this publication are those of the authors and not necessarily those of the NIHR, NHS, or the Department of Health.
-
Declarations of interest
None known.
Acknowledgements
We thank Iris Gordon, Trials Search Co‐ordinator for Cochrane Eyes and Vision, for creating and executing the electronic search strategies. We gratefully acknowledge Barbara Hawkins, Kristina Lindsley, Adriani Nikolakopoulou, and Gianni Virgili for their comments to this protocol.
Version history
| Published | Title | Stage | Authors | Version |
| 2015 Dec 22 | Interventions for central serous chorioretinopathy: a network meta‐analysis | Review | Mahsa Salehi, Adam S Wenick, Hua Andrew Law, Jennifer R Evans, Peter Gehlbach | |
| 2015 Aug 17 | Interventions for central serous chorioretinopathy: a network meta‐analysis | Protocol | Mahsa Salehi, Adam S Wenick, Hua Andrew Law, Jennifer R Evans, Peter Gehlbach | |
Differences between protocol and review
We made the following amendments to our protocol (Salehi 2015).
-
We excluded trials of traditional Chinese medicine. This is because we did not have a clear rationale for these treatments and these interventions may not be applicable to the settings covered by this review.
-
We restricted the network to interventions applied directly to the eye (ocular interventions) because we felt that a key assumption of the network ‐ participants should be equally likely to be randomized to any of the interventions ‐ would be unlikely to hold otherwise.
-
We did not consistently contact trial investigators for clarification of risk of bias as 'unclear' based on unreported or poorly reported information: some of the studies were completed many years ago and we took the judgment that the information was unlikely to be forthcoming.
We omitted to describe the GRADE assessment and 'Summary of findings' table in our protocol and have included that in the review methods.
The following methods set out in our protocol were not done due to lack of data. They may be applicable in future editions of the review.
Unit of analysis
If any studies enroll bilateral CSC cases and randomize eyes in participants to intervention versus comparator (within‐person study), we will refer to Chapter 16 of the Cochrane Handbook for Systematic Reviews of Interventions as a guide for analysis of matched data (Higgins 2011b).
Assessing reporting bias
When future versions of this review's meta‐analysis include 10 or more studies, we will investigate small‐study effects using a funnel plot. The funnel plot will have the effect estimate on the horizontal axis and the standard error on the vertical axis for each trial. We will conduct a qualitative interpretation of funnel plot asymmetry using guidance from Chapter 10 of the Cochrane Handbook for Systematic Reviews of Interventions (Sterne 2011).
Keywords
MeSH
Medical Subject Headings (MeSH) Keywords
- Carbonic Anhydrase Inhibitors [therapeutic use];
- Central Serous Chorioretinopathy [*therapy];
- Helicobacter Infections [drug therapy];
- Helicobacter pylori;
- Laser Therapy [methods];
- Photochemotherapy [methods];
- Propranolol [therapeutic use];
- Randomized Controlled Trials as Topic;
- Remission, Spontaneous;
- Treatment Outcome;
- Vascular Endothelial Growth Factor A [antagonists & inhibitors];
- Visual Acuity;
- Watchful Waiting;
Medical Subject Headings Check Words
Humans;
PICO

Theoretical treatment network.

Study flow diagram.

Risk of bias summary: review authors' judgments about each risk of bias item for each included study.
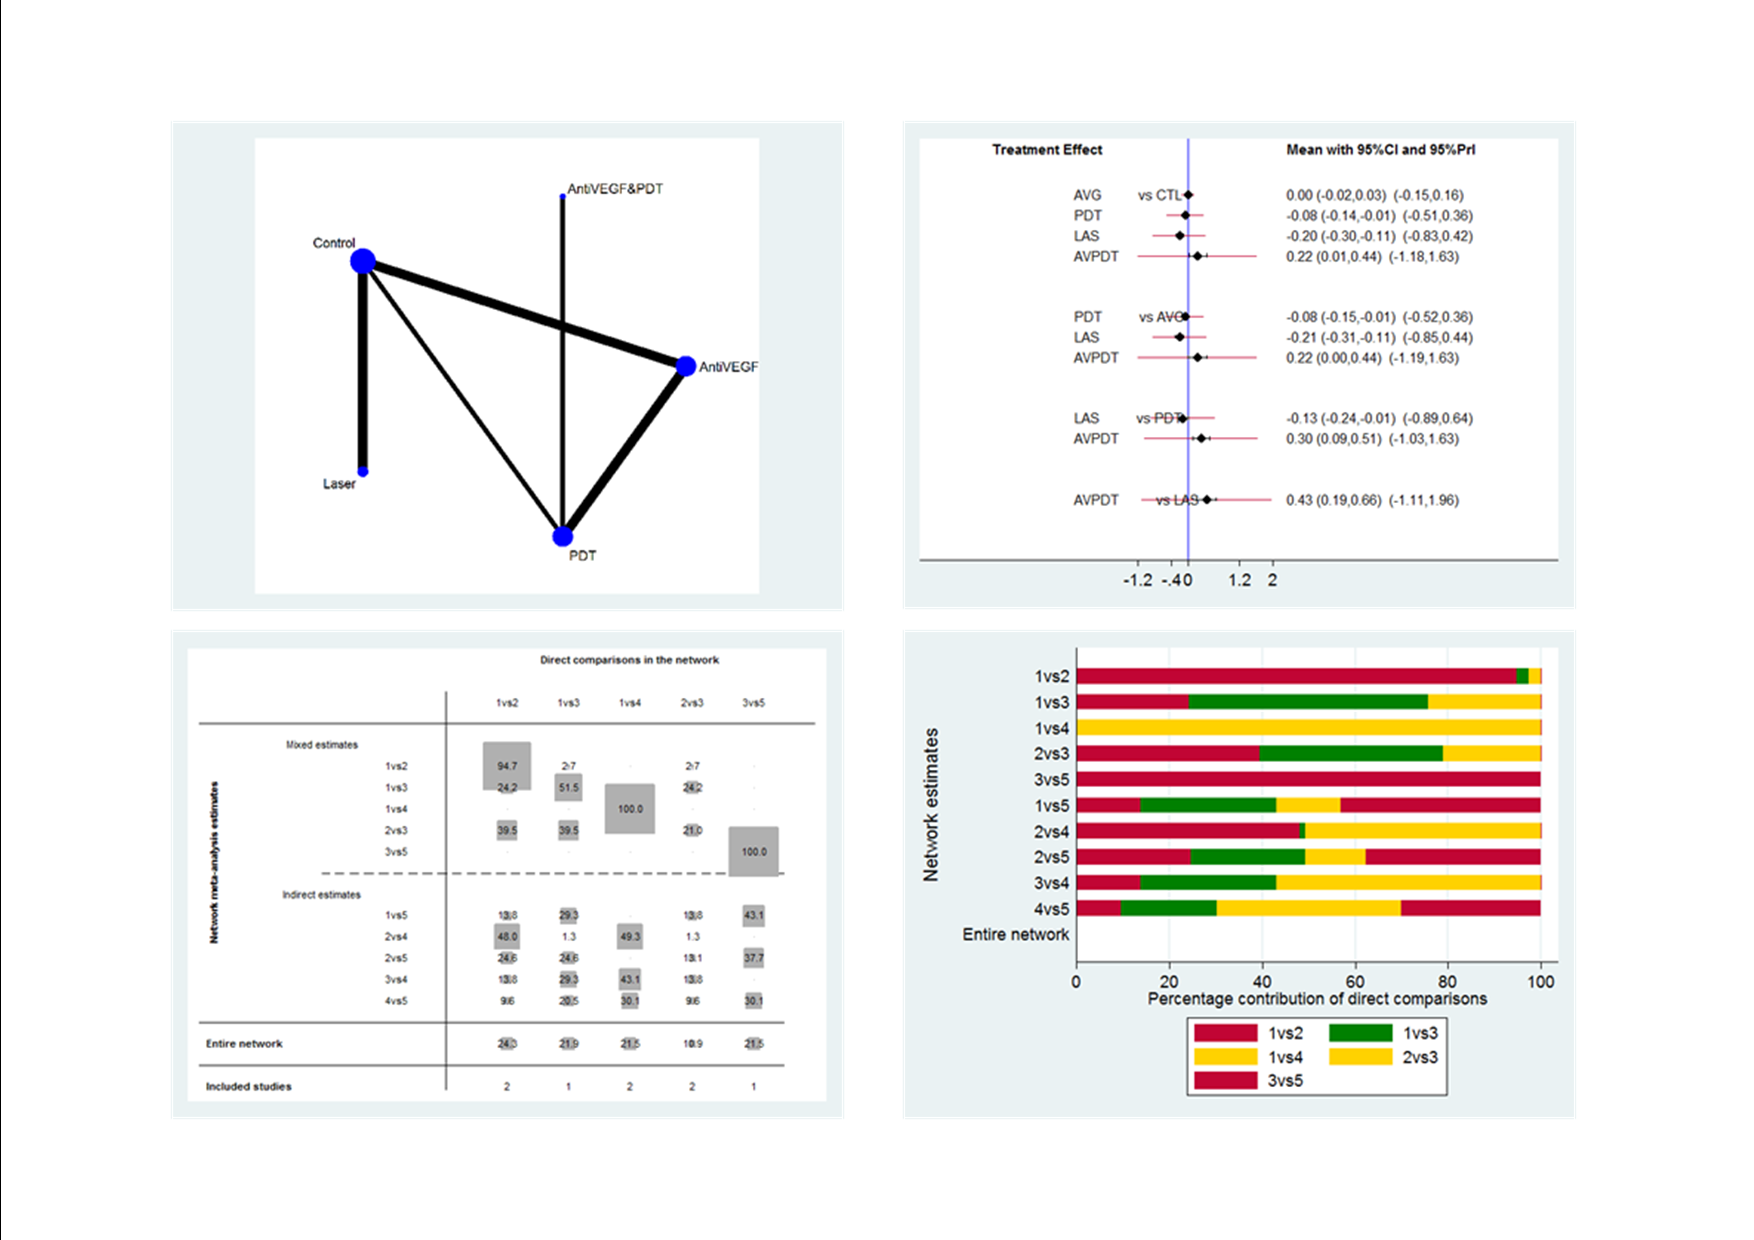
Visual acuity network: network plot, interval plot, contribution matrix and risk of bias.
AVG: Anti‐VEGF PDT: photodynamic therapy LAS: laser AVPDT: anti‐VEGF plus PDT.
1 = control; 2 = anti‐VEGF; 3 = PDT; 4 = laser; 5 = anti‐VEGF plus PDT.
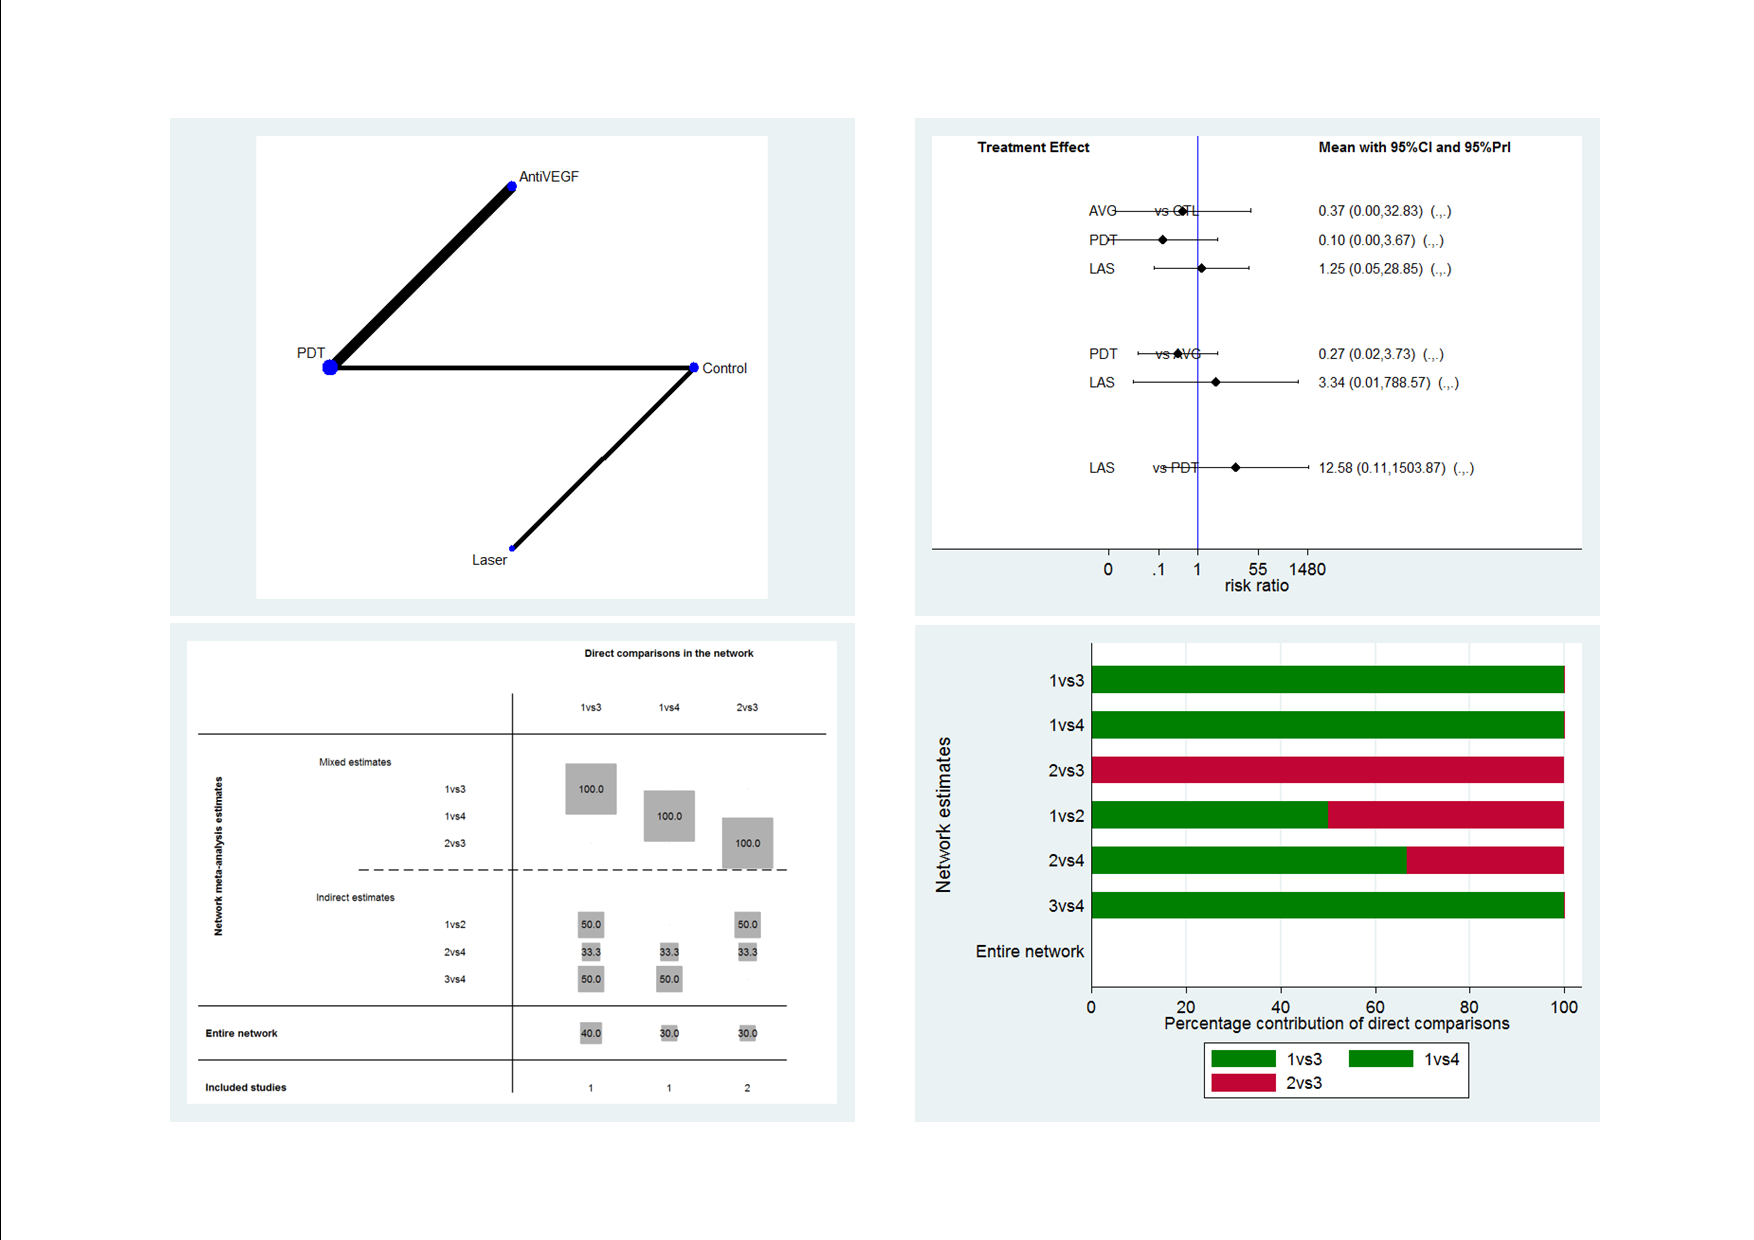
Recurrence CSC network: network plot, interval plot, contribution matrix and risk of bias.
AVG: Anti‐VEGF; PDT: photodynamic therapy; LAS: laser: CTL: control.
1 = control; 2 = anti‐VEGF; 3 = PDT; 4 = laser.
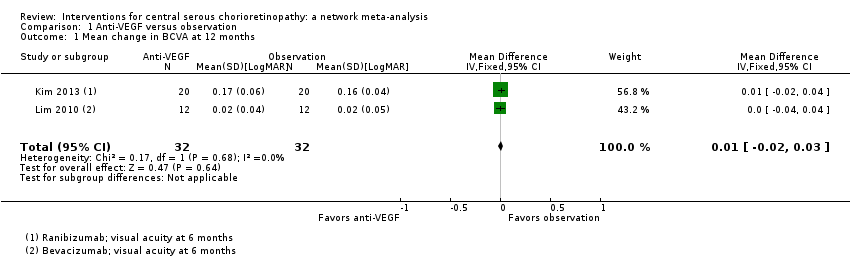
Comparison 1 Anti‐VEGF versus observation, Outcome 1 Mean change in BCVA at 12 months.

Comparison 1 Anti‐VEGF versus observation, Outcome 2 Mean change in CRT at 12 months.
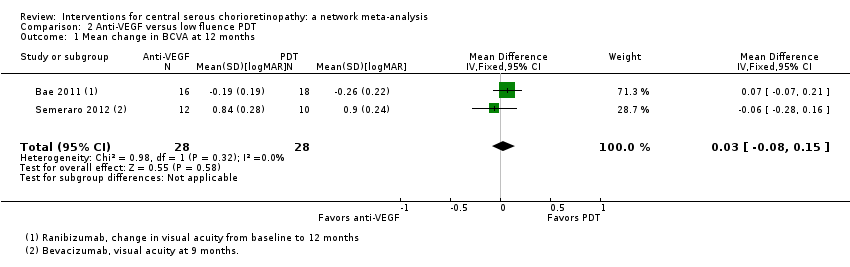
Comparison 2 Anti‐VEGF versus low fluence PDT, Outcome 1 Mean change in BCVA at 12 months.
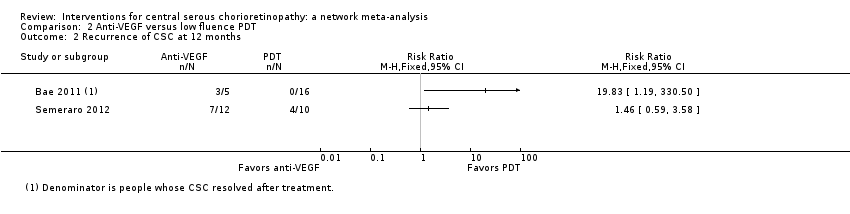
Comparison 2 Anti‐VEGF versus low fluence PDT, Outcome 2 Recurrence of CSC at 12 months.

Comparison 2 Anti‐VEGF versus low fluence PDT, Outcome 3 Persistent CSC at 12 months.
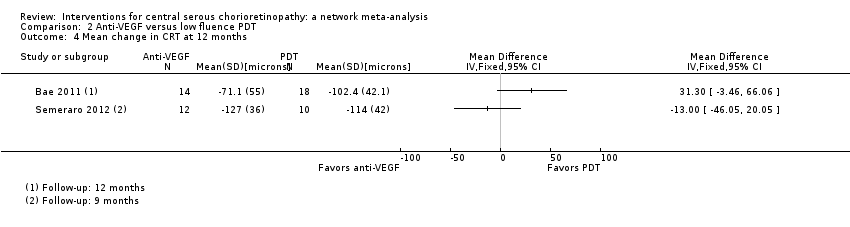
Comparison 2 Anti‐VEGF versus low fluence PDT, Outcome 4 Mean change in CRT at 12 months.
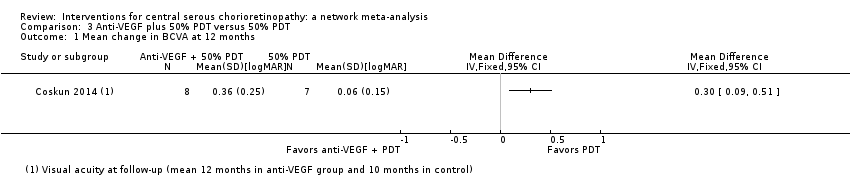
Comparison 3 Anti‐VEGF plus 50% PDT versus 50% PDT, Outcome 1 Mean change in BCVA at 12 months.

Comparison 3 Anti‐VEGF plus 50% PDT versus 50% PDT, Outcome 2 Persistent CSC at 12 months.

Comparison 3 Anti‐VEGF plus 50% PDT versus 50% PDT, Outcome 3 Mean change in CRT at 12 months.
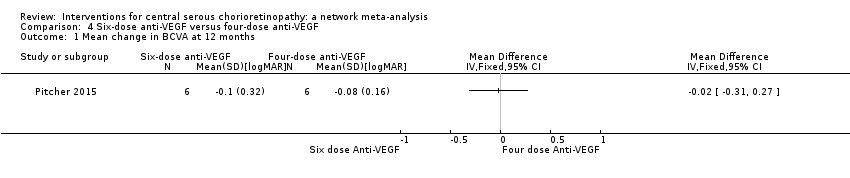
Comparison 4 Six‐dose anti‐VEGF versus four‐dose anti‐VEGF, Outcome 1 Mean change in BCVA at 12 months.
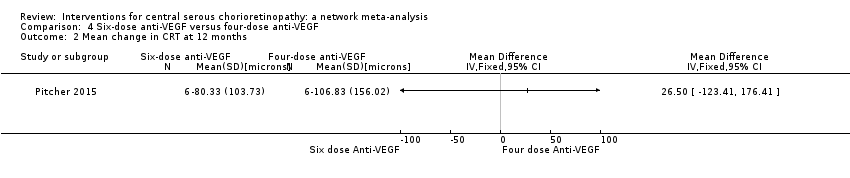
Comparison 4 Six‐dose anti‐VEGF versus four‐dose anti‐VEGF, Outcome 2 Mean change in CRT at 12 months.

Comparison 5 50% PDT versus sham treatment, Outcome 1 Mean BCVA at 12 months.
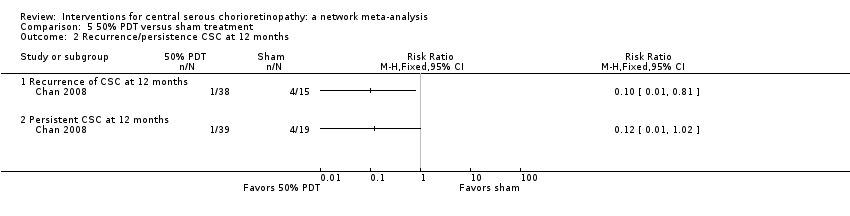
Comparison 5 50% PDT versus sham treatment, Outcome 2 Recurrence/persistence CSC at 12 months.
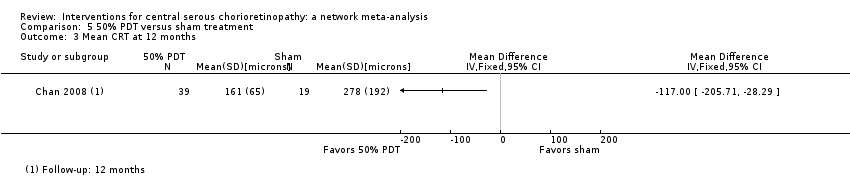
Comparison 5 50% PDT versus sham treatment, Outcome 3 Mean CRT at 12 months.

Comparison 6 30% PDT versus PDT, Outcome 1 Mean BCVA at 12 months.
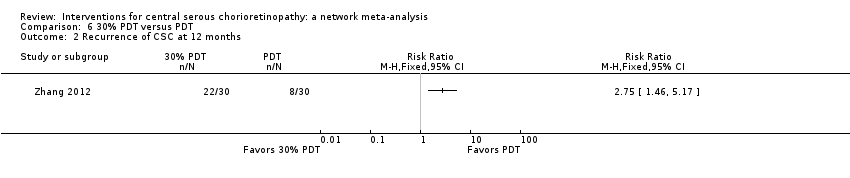
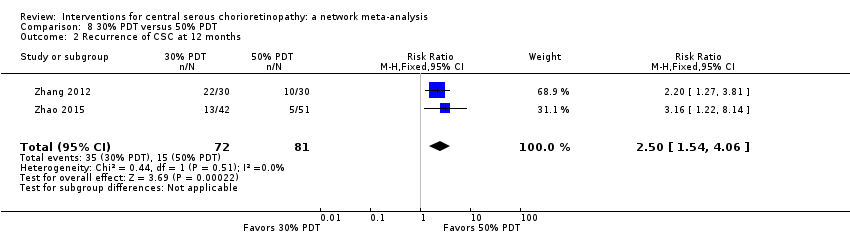
Comparison 6 30% PDT versus PDT, Outcome 2 Recurrence of CSC at 12 months.
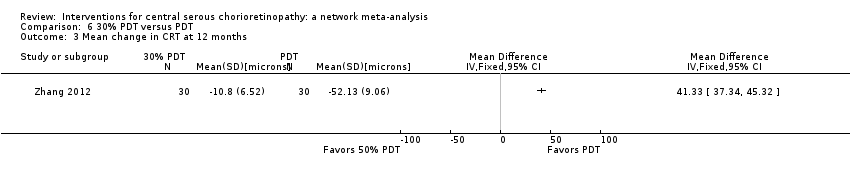
Comparison 6 30% PDT versus PDT, Outcome 3 Mean change in CRT at 12 months.
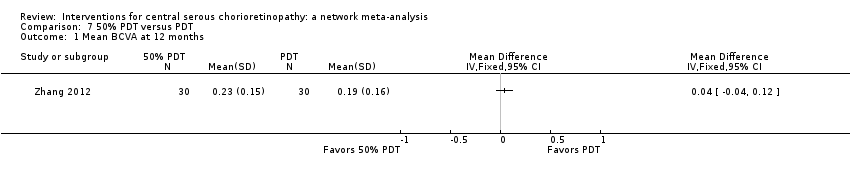
Comparison 7 50% PDT versus PDT, Outcome 1 Mean BCVA at 12 months.

Comparison 7 50% PDT versus PDT, Outcome 2 Recurrence of CSC at 12 months.
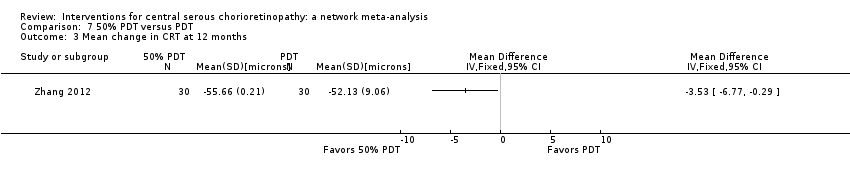
Comparison 7 50% PDT versus PDT, Outcome 3 Mean change in CRT at 12 months.

Comparison 8 30% PDT versus 50% PDT, Outcome 1 Mean change in BCVA at 12 months.
Comparison 8 30% PDT versus 50% PDT, Outcome 2 Recurrence of CSC at 12 months.

Comparison 8 30% PDT versus 50% PDT, Outcome 3 Persistent CSC at 12 months.

Comparison 8 30% PDT versus 50% PDT, Outcome 4 Mean change in CRT at 12 months.
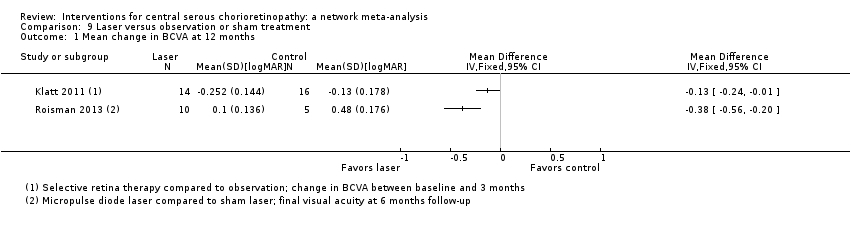
Comparison 9 Laser versus observation or sham treatment, Outcome 1 Mean change in BCVA at 12 months.

Comparison 9 Laser versus observation or sham treatment, Outcome 2 Recurrence of CSC at 12 months.

Comparison 9 Laser versus observation or sham treatment, Outcome 3 Mean change in CRT at 12 months.
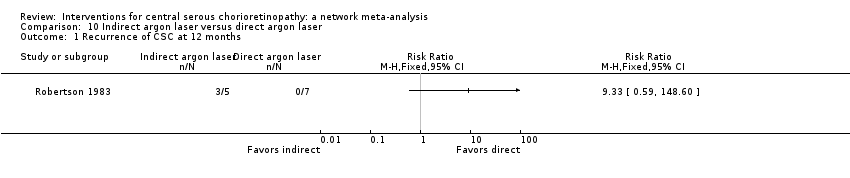
Comparison 10 Indirect argon laser versus direct argon laser, Outcome 1 Recurrence of CSC at 12 months.
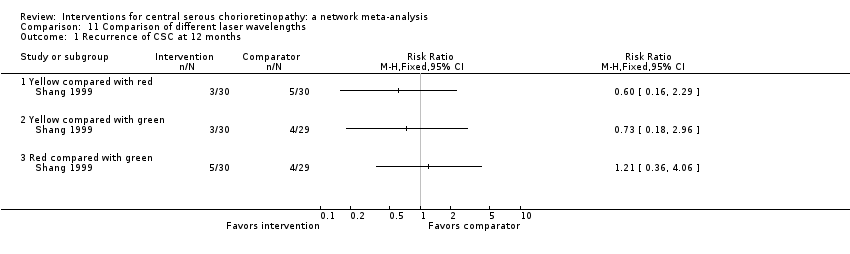
Comparison 11 Comparison of different laser wavelengths, Outcome 1 Recurrence of CSC at 12 months.
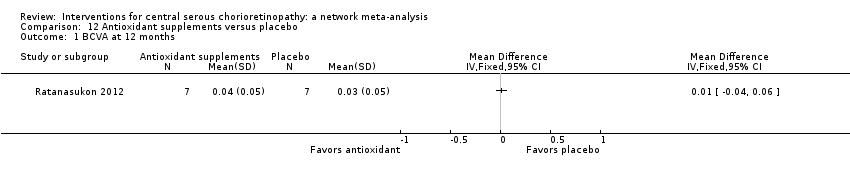
Comparison 12 Antioxidant supplements versus placebo, Outcome 1 BCVA at 12 months.
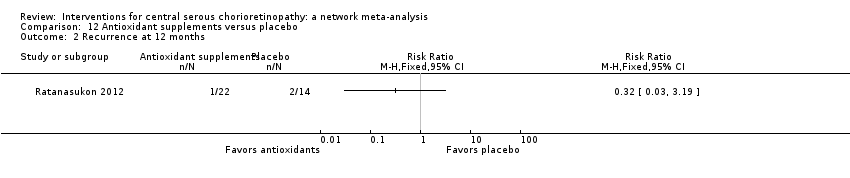
Comparison 12 Antioxidant supplements versus placebo, Outcome 2 Recurrence at 12 months.

Comparison 12 Antioxidant supplements versus placebo, Outcome 3 Persistence at 12 months.

Comparison 12 Antioxidant supplements versus placebo, Outcome 4 CRT at 12 months.

Comparison 13 Beta‐blocker versus placebo, Outcome 1 Mean BCVA at 12 months.

Comparison 13 Beta‐blocker versus placebo, Outcome 2 Recurrence of CSC at 12 months.

Comparison 13 Beta‐blocker versus placebo, Outcome 3 BCVA ≥ 20/40 at 12 months.
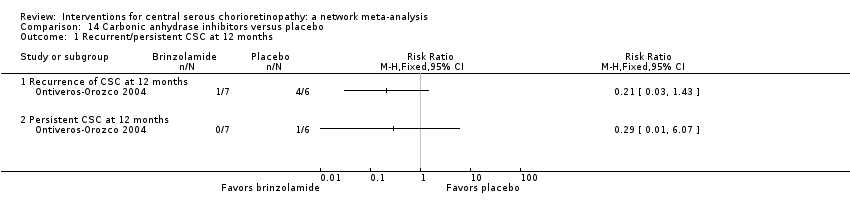
Comparison 14 Carbonic anhydrase inhibitors versus placebo, Outcome 1 Recurrent/persistent CSC at 12 months.

Comparison 15 Helicobacter pylori treatment versus placebo or observation, Outcome 1 Mean BCVA at 12 months.
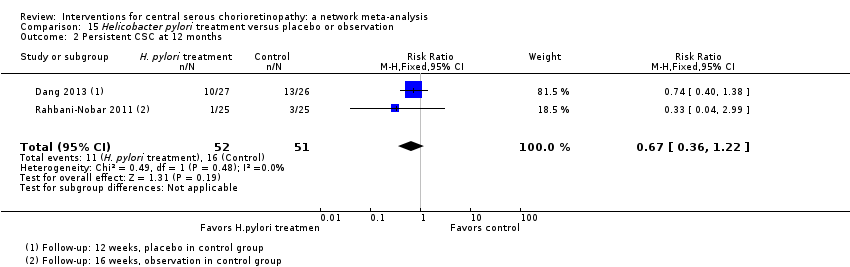
Comparison 15 Helicobacter pylori treatment versus placebo or observation, Outcome 2 Persistent CSC at 12 months.
| Interventions for central serous chorioretinopathy: direct comparisons | ||||||
| Patient or population: people with central serous chorioretinopathy Settings: eye hospital | ||||||
| Comparison (intervention vs. comparator) | Anticipated absolute effects (95% CI) | Effect estimate from direct comparison | Comments | |||
| Relative effect | No of participants | Quality | ||||
| Risk with comparator | Mean difference (95% CI) Negative values are in favor of intervention; positive values in favor of comparator | |||||
| Change in visual acuity at 12 months (logMAR) | ||||||
| Anti‐VEGF vs. observation | ‐ | 0.01 LogMAR (‐0.02 to 0.03) | ‐ | 64 (2) | Low1,2 | Both studies enrolled participants with acute CSC and reported mean change in visual acuity at 6 months |
| Anti‐VEGF vs. low‐fluence PDT | ‐ | 0.03 logMAR (‐0.08 to 0.15) | ‐ | 56 (2) | Low1,2 | Both studies enrolled participants with chronic CSC |
| Anti‐VEGF and 50% PDT vs. 50% PDT | ‐ | 0.30 logMAR (0.09 to 0.51) | ‐ | 15 (1) | Low1,2 | Participants had chronic CSC |
| 6‐dose anti‐VEGF vs. 4‐dose anti‐VEGF | ‐ | ‐0.02 logMAR (‐0.31 to 0.27) | ‐ | 12 (1) | Low1,2 | Participants had chronic CSC and were followed to 6 months |
| 50% PDT vs. observation or sham treatment | ‐ | ‐0.10 logMAR (‐0.18 to ‐0.02) | ‐ | 58 (1) | Low1,2 | Participants had acute CSC |
| 30% PDT vs. PDT | ‐ | ‐0.16 logMAR (‐0.22 to ‐0.10) | ‐ | 60 (1) | Low1,2 | Type of CSC not specified |
| 30% PDT vs. 50% PDT | ‐ | ‐0.12 logMAR (‐0.15 to ‐0.08) | ‐ | 60 (1) | Low1,2 | Type of CSC not specified |
| 50% PDT vs. PDT | ‐ | 0.04 logMAR (‐0.04 to 0.12 | ‐ | 60 (1) | Low1,2 | Type of CSC not specified |
| Selective retina therapy vs. observation | ‐ | ‐0.13 logMAR (‐0.24 to ‐0.01) | ‐ | 30 (1) | Low1,2 | Participants had acute CSC, followed up to 3 months |
| Micropulse diode laser vs. sham laser | ‐ | ‐0.38 logMAR (‐0.56 to ‐0.20) | ‐ | 15 (1) | Low1,2 | Participants had chronic CSC |
| Antioxidant vs. placebo | ‐ | 0.01 logMAR (‐0.04 to 0.06) | ‐ | 14 (1) | Low1,2 | Lutein and acute CSC |
| Propranolol vs. placebo | ‐ | 0.01 logMAR (‐0.07 to 0.09) | ‐ | 60 (1) | Low1,2 | Type of CSC not specified |
| Carbonic anhydrase inhibitors vs. placebo | See comment | ‐ | ‐ | 13 (1) | ‐ | Outcome not reported |
| Helicobacter pylori treatment vs. placebo | ‐ | ‐0.04 logMAR (‐0.07 to ‐0.02) | ‐ | 103 (2) | Low1,2 | Participants had acute CSC, follow‐up 12‐16 weeks |
| Comparison (intervention vs. comparator) | Anticipated absolute effects (95% CI) | Effect estimate from direct comparison | Comments | |||
| Risk with comparator* | Risk with intervention | Relative effect (95% CI) | No of participants | Quality | ||
| Persistent CSC at 12 months | ||||||
| Anti‐VEGF vs. observation | See comment | ‐ | ‐ | 64 (2) | ‐ | Participants had acute CSC. Both trials reported that all participants in treatment and control groups were resolved by 6 months |
| Anti‐VEGF vs. low‐fluence PDT | 111 per 1000 | 688 per 1000 (179 to 1000) | RR 6.19 (1.61 to 23.81) | 34 (1) | Low1,2 | Participants had chronic CSC |
| Anti‐VEGF and 50% PDT vs. 50% PDT | 143 per 1000 | 126 (10 to 1000) | RR 0.88 (0.07 to 11.54) | 15 (1) | Very low1,2,3 | Participants had chronic CSC |
| 6‐dose anti‐VEGF vs. 4‐dose anti‐VEGF | See comment | ‐ | ‐ | 12 (1) | ‐ | Outcome not reported |
| 50% PDT vs. sham treatment | 211 per 1000 | 25 per 1000 (2 to 215) | RR 0.12 (0.01 to 1.02) | 58 (1) | Low1,2 | Participants had acute CSC |
| 30% PDT vs. PDT | See comment | ‐ | ‐ | 60 (1) | ‐ | Outcome not reported |
| 30% PDT vs. 50% PDT | See comment | ‐ | ‐ | 60 (1) | ‐ | Outcome not reported |
| 50% PDT vs. PDT | See comment | ‐ | ‐ | 60 (1) | ‐ | Outcome not reported |
| Selective retina therapy vs. observation | See comment | ‐ | ‐ | 30 (1) | ‐ | Outcome not reported |
| Micropulse diode laser | See comment | ‐ | ‐ | 15 (1) | ‐ | Outcome not reported |
| Antioxidant vs. placebo | See comment | ‐ | ‐ | 51 (1) | ‐ | People in the antioxidant group were less likely to have "complete resolution" at 3 months (RR 0.35, 95% CI 0.13 to 0.95; 51 participants) |
| Propranolol vs. placebo | See comment | ‐ | ‐ | 60 (1) | ‐ | Outcome not reported |
| Brinzolamide vs. placebo | 167 per 1000 | 48 (2 to 1000) | RR 0.29 (0.01 to 6.07) | 13 (1) | Very low2,3 | Participants had acute CSC |
| Helicobacter pylori treatment vs. placebo | 314 per 1000 | 210 (113 to 383) | RR 0.67 (0.36 to 1.22) | 103 (2) | Low1,2 | Participants had acute CSC |
| Comparison (intervention vs. comparator) | Anticipated absolute effects (95% CI) | Effect estimate from direct comparison | ||||
| Risk with comparator* | Risk with intervention | Relative effect (95% CI) | No of participants | Quality | Comment | |
| Recurrent CSC at 12 months | ||||||
| Anti‐VEGF vs. observation | See comment | ‐ | ‐ | 64 (2) | ‐ | Outcome not reported |
| Anti‐VEGF vs. low‐fluence PDT | See comment | ‐ | ‐ | 56 (2) | Very low1,2,4 | Participants had chronic CSC. The 2 studies had different results for this outcome (I2 = 71%). In Bae 2011, there was a much higher risk of recurrence in the anti‐VEGF group (ranibizumab) compared with the PDT group (RR 19.83, 95% CI 1.19 to 330.50; 21 eyes); in Semeraro 2012, there was also an increased risk of recurrence in the anti‐VEGF (bevacizumab) group but the size of the effect was much smaller and the CIs include 1 (no effect) (RR 1.46, 95% CI 0.59 to 3.58; 22 eyes) |
| Anti‐VEGF and 50% PDT vs. 50% PDT | See comment | ‐ | ‐ | 15 (1) | ‐ | Outcome not reported |
| 6‐dose anti‐VEGF vs. 4‐dose anti‐VEGF | See comment | ‐ | ‐ | 12 (1) | ‐ | Outcome not reported |
| 50% PDT vs. sham treatment | 267 per 1000 | 27 per 1000 (3 to 216) | RR 0.10 (0.01 to 0.81) | 53 (1) | Low1,2 | Participants had acute CSC |
| 30% PDT vs. PDT | See comment | ‐ | ‐ | 60 (1) | ‐ | Outcome not reported |
| 30% PDT vs. 50% PDT | See comment | ‐ | ‐ | 60 (1) | ‐ | Outcome not reported |
| 50% PDT vs. PDT | 270 per 1000 | 338 per 1000 (154 to 737) | RR 1.25 (0.57 to 2.73) | 60 (1) | ‐ | Type of CSC not specified |
| Selective retina therapy vs. observation | See comment | ‐ | ‐ | 30 (1) | ‐ | Outcome not reported |
| Micropulse diode laser | See comment | ‐ | ‐ | 15 (1) | ‐ | Outcome not reported |
| Antioxidant vs. placebo | 143 per 1000 | 46 (4 to 456) | RR 0.32 (0.03 to 3.19) | 36 (1) | Very low2,3 | Participants had acute CSC |
| Propranolol vs. placebo | 167 per 1000 | 100 (27 to 382) | RR 0.60 (0.16 to 2.29) | 60 (1) | Low1,2 | Type of CSC not reported |
| Brinzolamide vs. placebo | 314 per 1000 | 140 (20 to 953) | RR 0.21 (0.03 to 1.43 | 13 (1) | Low1,2 | Participants had acute CSC |
| Helicobacter pylori treatment vs. placebo | See comment | ‐ | ‐ | 103 (2) | ‐ | Outcome not reported |
| Adverse effects | ||||||
| All studies reported no ocular or systematic adverse effects, or did not comment on adverse effects | ||||||
| anti‐VEGF: anti‐vascular endothelial growth factor; CI: confidence interval; CSC: central serous chorioretinopathy; logMAR: logarithm of the minimal angle of resolution; PDT: photodynamic therapy; RR: risk ratio. * Risk was estimated from the comparator group in the included studies 1 Downgraded for imprecision (‐1) 2 Downgraded for risk of bias (‐1) 3 Downgraded for imprecision (‐2) 4 Downgraded for inconsistency (‐1) | ||||||
| Treatment comparison | Study | Type of CSC | Date study conducted | Industry sponsored |
| Anti‐VEGF vs. PDT | Chronic Chronic | 2009‐2012 2009‐2010 | Yes NR | |
| PDT vs. no treatment | Acute | 2004‐2005 | NR | |
| Laser vs. no treatment | Acute | 1977‐1981 | No | |
| One additional study for the comparison PDT vs. no treatment was reported in abstract form only and no data on outcome so was not included in the network meta‐analysis (Boscia 2008). anti‐VEGF: anti‐vascular endothelial growth factor; CSC: central serous chorioretinopathy; NR: not reported; PDT: photodynamic therapy. | ||||
| Anti‐VEGF | ‐0.08 (‐0.14 to ‐0.01) | ‐0.20 (‐0.30 to ‐0.11) | 0.00 (‐0.02 to 0.03) | 0.22 (0.01 to 0.44) |
| 0.08 (0.01 to 0.14) | PDT | ‐0.13 (‐0.24 to ‐0.01) | 0.08 (0.01 to 0.15) | 0.30 (0.09 to 0.51) |
| 0.20 (0.11 to 0.30) | 0.13 (0.01 to 0.24) | Laser | 0.21 (0.11 to 0.31) | 0.43 (0.19 to 0.66) |
| ‐0.00 (‐0.03 to 0.02) | ‐0.08 (‐0.15 to ‐0.01) | ‐0.21 (‐0.31 to ‐0.11) | Anti‐VEGF and PDT | 0.22 (0.00 to 0.44) |
| ‐0.22 (‐0.44 to ‐0.01) | ‐0.30 (‐0.51 to ‐0.09) | ‐0.43 (‐0.66 to ‐0.19) | ‐0.22 (‐0.44 to ‐0.00) | Control (no treatment or sham treatment) |
| Effect estimate is the mean difference (95% confidence interval). Negative values favor the first intervention. In the lower left hand triangle, the first intervention is anti‐VEGF, PDT, laser etc. In the upper right hand triangle, the first intervention is control, anti‐VEGF and PDT, laser etc. So, for example, visual acuity with anti‐VEGF was 0.22 logMAR units better than control 95% CI 0.44 better to 0.01 better. anti‐VEGF: anti‐vascular endothelial growth factor; logMAR: logarithm of the minimal angle of resolution; PDT: photodynamic therapy. | ||||
| Treatment comparison | Study | Type of CSC | Date study conducted | Industry sponsored |
| Anti‐VEGF vs. no treatment | Acute Acute | 2010‐2011 2008 | No No | |
| Anti‐VEGF vs. PDT | Chronic Chronic | 2009‐2012 2009‐2010 | Yes NR | |
| Anti‐VEGF + PDT vs. PDT alone | Chronic | NR (published 2014) | NR | |
| PDT vs. no treatment | Acute | 2004‐2005 | NR | |
| Laser vs. no treatment | Acute Acute Chronic | 2007‐2008 1977‐1981 NR (published 2013) | NR No NR | |
| One additional study for the comparison PDT vs no treatment was reported in abstract form only and no data on outcome so was not included in the network meta‐analysis (Boscia 2008). anti‐VEGF: anti‐vascular endothelial growth factor; CSC: central serous chorioretinopathy; NR: not reported; PDT: photodynamic therapy. | ||||
| Anti‐VEGF | 0.27 (0.02 to 3.73) | 3.34 (0.01 to 788.57) | 2.67 (0.03 to 234.08) |
| 3.77 (0.27 to 52.94) | PDT | 12.58 (0.11 to 1503.87) | 10.07 (0.27 to 371.91) |
| 0.30 (0.00 to 70.79) | 0.08 (0.00 to 9.50) | Laser | 0.80 (0.03 to 18.46) |
| 0.37 (0.00 to 32.83) | 0.10 (0.00 to 3.67) | 1.25 (0.05 to 28.85) | Control |
| Effect estimate is the risk ratio (95% CI). anti‐VEGF: anti‐vascular endothelial growth factor; logMAR: logarithm of the minimal angle of resolution; PDT: photodynamic therapy. | |||
| Outcome or subgroup title | No. of studies | No. of participants | Statistical method | Effect size |
| 1 Mean change in BCVA at 12 months Show forest plot | 2 | 64 | Mean Difference (IV, Fixed, 95% CI) | 0.01 [‐0.02, 0.03] |
| 2 Mean change in CRT at 12 months Show forest plot | 2 | 64 | Mean Difference (IV, Fixed, 95% CI) | 8.73 [‐18.08, 35.54] |
| Outcome or subgroup title | No. of studies | No. of participants | Statistical method | Effect size |
| 1 Mean change in BCVA at 12 months Show forest plot | 2 | 56 | Mean Difference (IV, Fixed, 95% CI) | 0.03 [‐0.08, 0.15] |
| 2 Recurrence of CSC at 12 months Show forest plot | 2 | Risk Ratio (M‐H, Fixed, 95% CI) | Totals not selected | |
| 3 Persistent CSC at 12 months Show forest plot | 1 | Risk Ratio (M‐H, Fixed, 95% CI) | Totals not selected | |
| 4 Mean change in CRT at 12 months Show forest plot | 2 | Mean Difference (IV, Fixed, 95% CI) | Totals not selected | |
| Outcome or subgroup title | No. of studies | No. of participants | Statistical method | Effect size |
| 1 Mean change in BCVA at 12 months Show forest plot | 1 | Mean Difference (IV, Fixed, 95% CI) | Totals not selected | |
| 2 Persistent CSC at 12 months Show forest plot | 1 | Risk Ratio (M‐H, Fixed, 95% CI) | Totals not selected | |
| 3 Mean change in CRT at 12 months Show forest plot | 1 | Mean Difference (IV, Fixed, 95% CI) | Totals not selected | |
| Outcome or subgroup title | No. of studies | No. of participants | Statistical method | Effect size |
| 1 Mean change in BCVA at 12 months Show forest plot | 1 | Mean Difference (IV, Fixed, 95% CI) | Totals not selected | |
| 2 Mean change in CRT at 12 months Show forest plot | 1 | Mean Difference (IV, Fixed, 95% CI) | Totals not selected | |
| Outcome or subgroup title | No. of studies | No. of participants | Statistical method | Effect size |
| 1 Mean BCVA at 12 months Show forest plot | 1 | Mean Difference (IV, Fixed, 95% CI) | Totals not selected | |
| 2 Recurrence/persistence CSC at 12 months Show forest plot | 1 | Risk Ratio (M‐H, Fixed, 95% CI) | Totals not selected | |
| 2.1 Recurrence of CSC at 12 months | 1 | Risk Ratio (M‐H, Fixed, 95% CI) | 0.0 [0.0, 0.0] | |
| 2.2 Persistent CSC at 12 months | 1 | Risk Ratio (M‐H, Fixed, 95% CI) | 0.0 [0.0, 0.0] | |
| 3 Mean CRT at 12 months Show forest plot | 1 | Mean Difference (IV, Fixed, 95% CI) | Totals not selected | |
| Outcome or subgroup title | No. of studies | No. of participants | Statistical method | Effect size |
| 1 Mean BCVA at 12 months Show forest plot | 1 | Mean Difference (IV, Fixed, 95% CI) | Totals not selected | |
| 2 Recurrence of CSC at 12 months Show forest plot | 1 | Risk Ratio (M‐H, Fixed, 95% CI) | Totals not selected | |
| 3 Mean change in CRT at 12 months Show forest plot | 1 | Mean Difference (IV, Fixed, 95% CI) | Totals not selected | |
| Outcome or subgroup title | No. of studies | No. of participants | Statistical method | Effect size |
| 1 Mean change in BCVA at 12 months Show forest plot | 2 | 177 | Mean Difference (IV, Fixed, 95% CI) | ‐0.12 [‐0.15, ‐0.08] |
| 2 Recurrence of CSC at 12 months Show forest plot | 2 | 153 | Risk Ratio (M‐H, Fixed, 95% CI) | 2.50 [1.54, 4.06] |
| 3 Persistent CSC at 12 months Show forest plot | 1 | Risk Ratio (M‐H, Fixed, 95% CI) | Totals not selected | |
| 4 Mean change in CRT at 12 months Show forest plot | 2 | 177 | Mean Difference (IV, Fixed, 95% CI) | 44.90 [42.57, 47.23] |
| Outcome or subgroup title | No. of studies | No. of participants | Statistical method | Effect size |
| 1 Mean change in BCVA at 12 months Show forest plot | 2 | Mean Difference (IV, Fixed, 95% CI) | Totals not selected | |
| 2 Recurrence of CSC at 12 months Show forest plot | 1 | Risk Ratio (M‐H, Fixed, 95% CI) | Totals not selected | |
| 3 Mean change in CRT at 12 months Show forest plot | 1 | Mean Difference (IV, Fixed, 95% CI) | Totals not selected | |
| Outcome or subgroup title | No. of studies | No. of participants | Statistical method | Effect size |
| 1 Recurrence of CSC at 12 months Show forest plot | 1 | Risk Ratio (M‐H, Fixed, 95% CI) | Totals not selected | |
| Outcome or subgroup title | No. of studies | No. of participants | Statistical method | Effect size |
| 1 Recurrence of CSC at 12 months Show forest plot | 1 | Risk Ratio (M‐H, Fixed, 95% CI) | Totals not selected | |
| 1.1 Yellow compared with red | 1 | Risk Ratio (M‐H, Fixed, 95% CI) | 0.0 [0.0, 0.0] | |
| 1.2 Yellow compared with green | 1 | Risk Ratio (M‐H, Fixed, 95% CI) | 0.0 [0.0, 0.0] | |
| 1.3 Red compared with green | 1 | Risk Ratio (M‐H, Fixed, 95% CI) | 0.0 [0.0, 0.0] | |
| Outcome or subgroup title | No. of studies | No. of participants | Statistical method | Effect size |
| 1 BCVA at 12 months Show forest plot | 1 | Mean Difference (IV, Fixed, 95% CI) | Totals not selected | |
| 2 Recurrence at 12 months Show forest plot | 1 | Risk Ratio (M‐H, Fixed, 95% CI) | Totals not selected | |
| 3 Persistence at 12 months Show forest plot | 1 | Risk Ratio (M‐H, Fixed, 95% CI) | Totals not selected | |
| 4 CRT at 12 months Show forest plot | 1 | Mean Difference (IV, Fixed, 95% CI) | Totals not selected | |
| Outcome or subgroup title | No. of studies | No. of participants | Statistical method | Effect size |
| 1 Mean BCVA at 12 months Show forest plot | 1 | Mean Difference (IV, Fixed, 95% CI) | Totals not selected | |
| 2 Recurrence of CSC at 12 months Show forest plot | 1 | Risk Ratio (M‐H, Fixed, 95% CI) | Totals not selected | |
| 3 BCVA ≥ 20/40 at 12 months Show forest plot | 1 | Risk Ratio (M‐H, Fixed, 95% CI) | Totals not selected | |
| Outcome or subgroup title | No. of studies | No. of participants | Statistical method | Effect size |
| 1 Recurrent/persistent CSC at 12 months Show forest plot | 1 | Risk Ratio (M‐H, Fixed, 95% CI) | Totals not selected | |
| 1.1 Recurrence of CSC at 12 months | 1 | Risk Ratio (M‐H, Fixed, 95% CI) | 0.0 [0.0, 0.0] | |
| 1.2 Persistent CSC at 12 months | 1 | Risk Ratio (M‐H, Fixed, 95% CI) | 0.0 [0.0, 0.0] | |
| Outcome or subgroup title | No. of studies | No. of participants | Statistical method | Effect size |
| 1 Mean BCVA at 12 months Show forest plot | 2 | 103 | Mean Difference (IV, Fixed, 95% CI) | ‐0.04 [‐0.07, ‐0.02] |
| 2 Persistent CSC at 12 months Show forest plot | 2 | 103 | Risk Ratio (M‐H, Fixed, 95% CI) | 0.67 [0.36, 1.22] |