| Interventions for central serous chorioretinopathy: direct comparisons |
| Patient or population: people with central serous chorioretinopathy Settings: eye hospital |
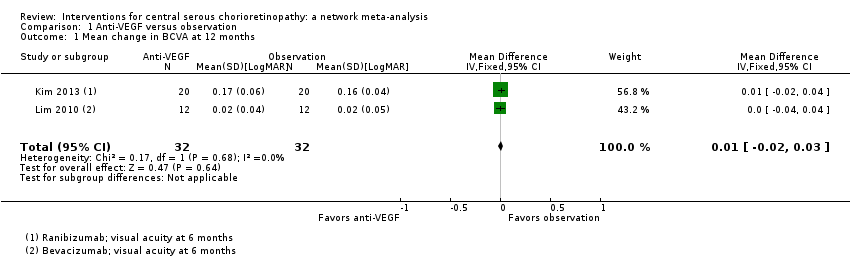
| Anti‐VEGF vs. observation | ‐ | 0.01 LogMAR (‐0.02 to 0.03) | ‐ | 64 (2) | Low1,2 | Both studies enrolled participants with acute CSC and reported mean change in visual acuity at 6 months |
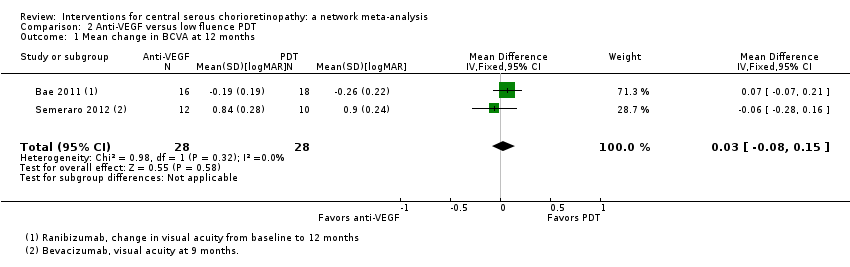
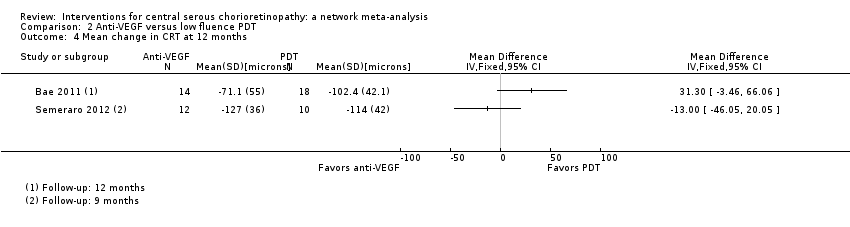
| Anti‐VEGF vs. low‐fluence PDT | ‐ | 0.03 logMAR (‐0.08 to 0.15) | ‐ | 56 (2) | Low1,2 | Both studies enrolled participants with chronic CSC |
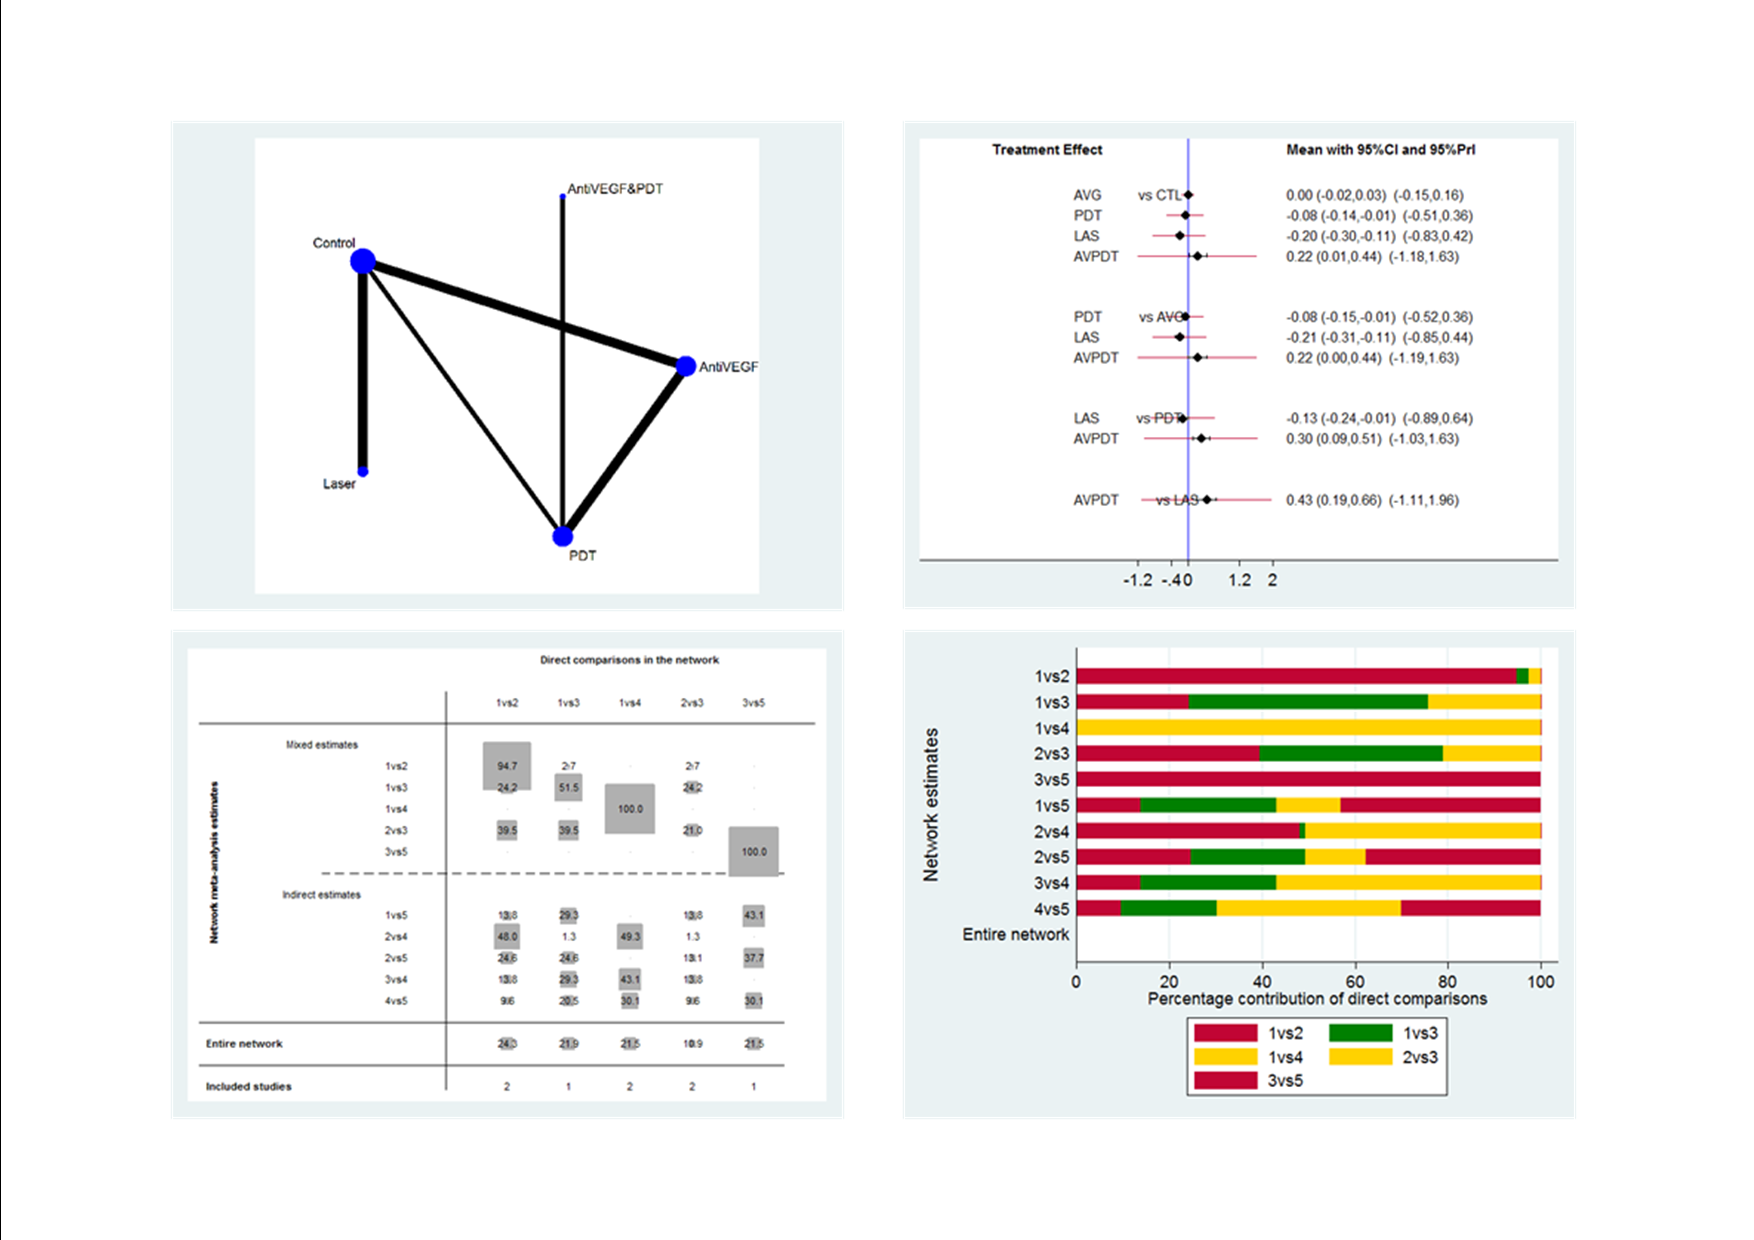
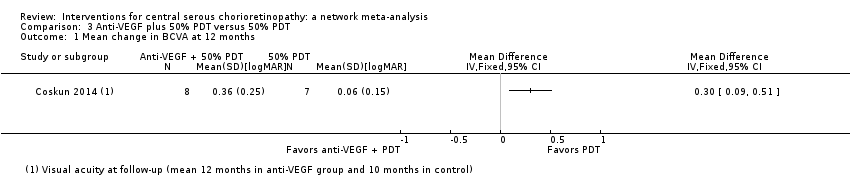
| Anti‐VEGF and 50% PDT vs. 50% PDT | ‐ | 0.30 logMAR (0.09 to 0.51) | ‐ | 15 (1) | Low1,2 | Participants had chronic CSC |
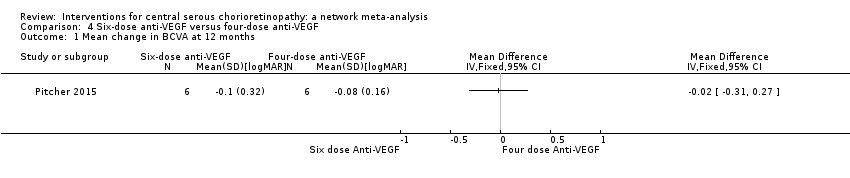
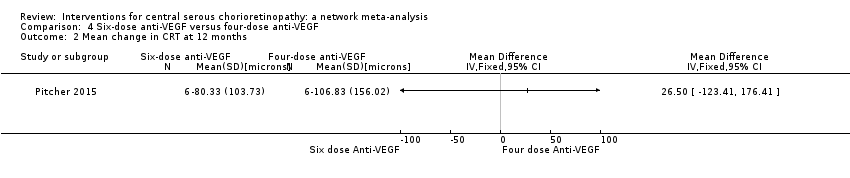
| 6‐dose anti‐VEGF vs. 4‐dose anti‐VEGF | ‐ | ‐0.02 logMAR (‐0.31 to 0.27) | ‐ | 12 (1) | Low1,2 | Participants had chronic CSC and were followed to 6 months |
| 50% PDT vs. observation or sham treatment | ‐ | ‐0.10 logMAR (‐0.18 to ‐0.02) | ‐ | 58 (1) | Low1,2 | Participants had acute CSC |
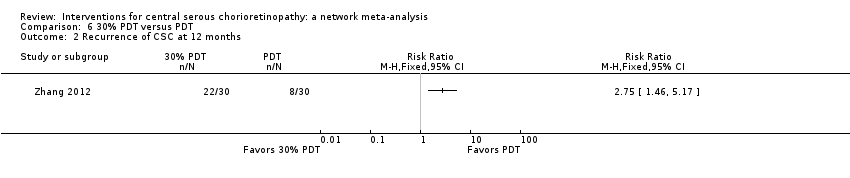
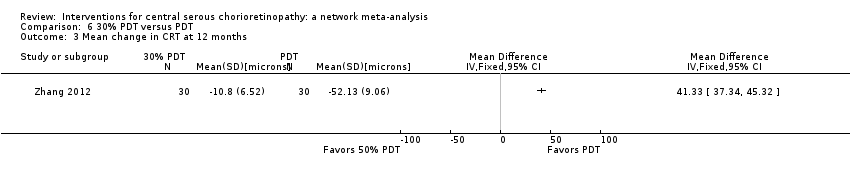
| 30% PDT vs. PDT | ‐ | ‐0.16 logMAR (‐0.22 to ‐0.10) | ‐ | 60 (1) | Low1,2 | Type of CSC not specified |
| 30% PDT vs. 50% PDT | ‐ | ‐0.12 logMAR (‐0.15 to ‐0.08) | ‐ | 60 (1) | Low1,2 | Type of CSC not specified |
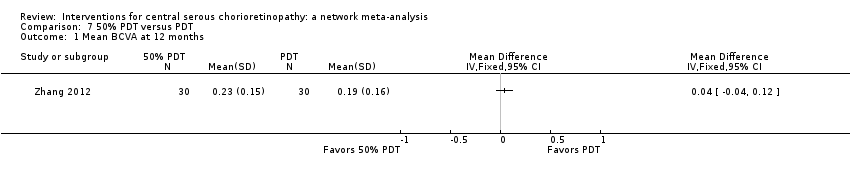
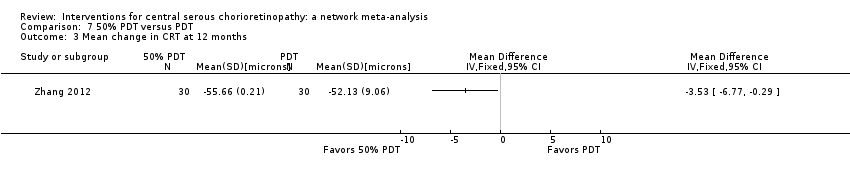
| 50% PDT vs. PDT | ‐ | 0.04 logMAR (‐0.04 to 0.12 | ‐ | 60 (1) | Low1,2 | Type of CSC not specified |
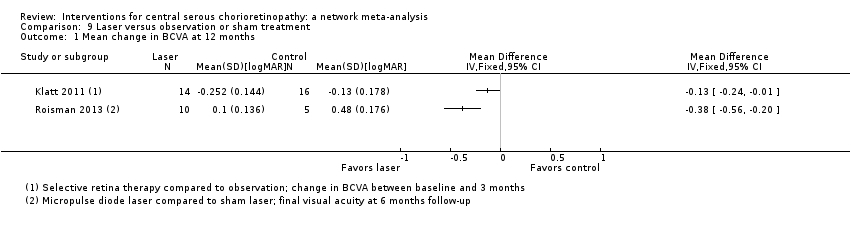
| Selective retina therapy vs. observation | ‐ | ‐0.13 logMAR (‐0.24 to ‐0.01) | ‐ | 30 (1) | Low1,2 | Participants had acute CSC, followed up to 3 months |
| Micropulse diode laser vs. sham laser | ‐ | ‐0.38 logMAR (‐0.56 to ‐0.20) | ‐ | 15 (1) | Low1,2 | Participants had chronic CSC |
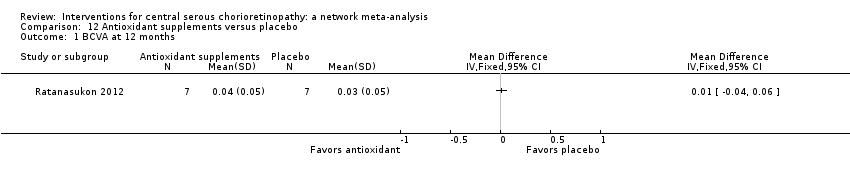
| Antioxidant vs. placebo | ‐ | 0.01 logMAR (‐0.04 to 0.06) | ‐ | 14 (1) | Low1,2 | Lutein and acute CSC |
| Propranolol vs. placebo | ‐ | 0.01 logMAR (‐0.07 to 0.09) | ‐ | 60 (1) | Low1,2 | Type of CSC not specified |
| Carbonic anhydrase inhibitors vs. placebo | See comment | ‐ | ‐ | 13 (1) | ‐ | Outcome not reported |
| Helicobacter pylori treatment vs. placebo | ‐ | ‐0.04 logMAR (‐0.07 to ‐0.02) | ‐ | 103 (2) | Low1,2 | Participants had acute CSC, follow‐up 12‐16 weeks |
| Anti‐VEGF vs. observation | See comment | ‐ | ‐ | 64 (2) | ‐ | Participants had acute CSC. Both trials reported that all participants in treatment and control groups were resolved by 6 months |
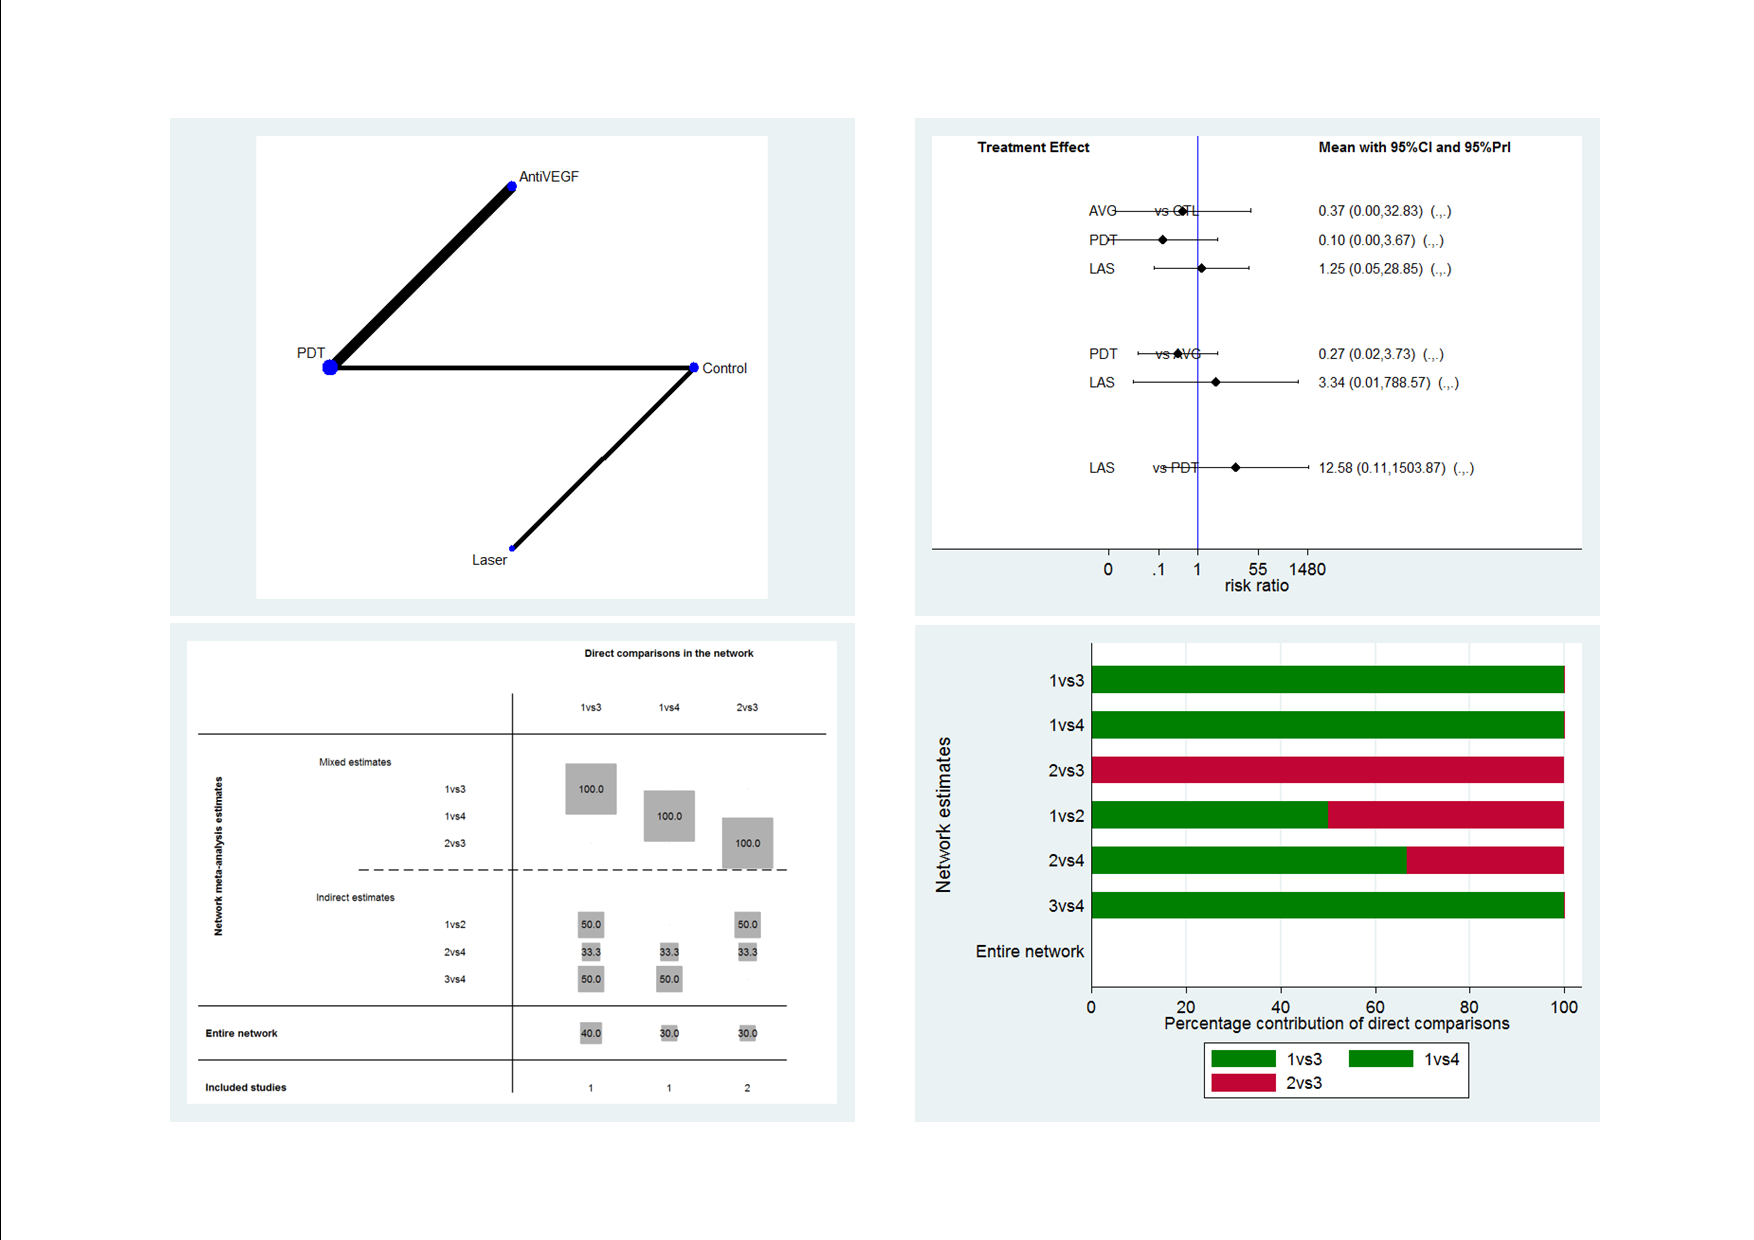
| Anti‐VEGF vs. low‐fluence PDT | 111 per 1000 | 688 per 1000 (179 to 1000) | RR 6.19 (1.61 to 23.81) | 34 (1) | Low1,2 | Participants had chronic CSC |
| Anti‐VEGF and 50% PDT vs. 50% PDT | 143 per 1000 | 126 (10 to 1000) | RR 0.88 (0.07 to 11.54) | 15 (1) | Very low1,2,3 | Participants had chronic CSC |
| 6‐dose anti‐VEGF vs. 4‐dose anti‐VEGF | See comment | ‐ | ‐ | 12 (1) | ‐ | Outcome not reported |
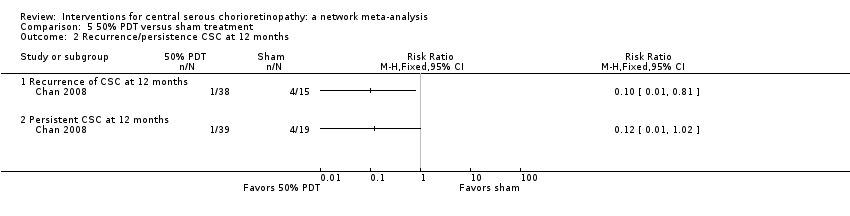
| 50% PDT vs. sham treatment | 211 per 1000 | 25 per 1000 (2 to 215) | RR 0.12 (0.01 to 1.02) | 58 (1) | Low1,2 | Participants had acute CSC |
| 30% PDT vs. PDT | See comment | ‐ | ‐ | 60 (1) | ‐ | Outcome not reported |
| 30% PDT vs. 50% PDT | See comment | ‐ | ‐ | 60 (1) | ‐ | Outcome not reported |
| 50% PDT vs. PDT | See comment | ‐ | ‐ | 60 (1) | ‐ | Outcome not reported |
| Selective retina therapy vs. observation | See comment | ‐ | ‐ | 30 (1) | ‐ | Outcome not reported |
| Micropulse diode laser | See comment | ‐ | ‐ | 15 (1) | ‐ | Outcome not reported |
| Antioxidant vs. placebo | See comment | ‐ | ‐ | 51 (1) | ‐ | People in the antioxidant group were less likely to have "complete resolution" at 3 months (RR 0.35, 95% CI 0.13 to 0.95; 51 participants) |
| Propranolol vs. placebo | See comment | ‐ | ‐ | 60 (1) | ‐ | Outcome not reported |
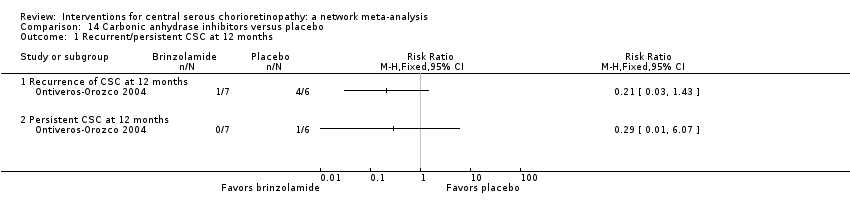
| Brinzolamide vs. placebo | 167 per 1000 | 48 (2 to 1000) | RR 0.29 (0.01 to 6.07) | 13 (1) | Very low2,3 | Participants had acute CSC |
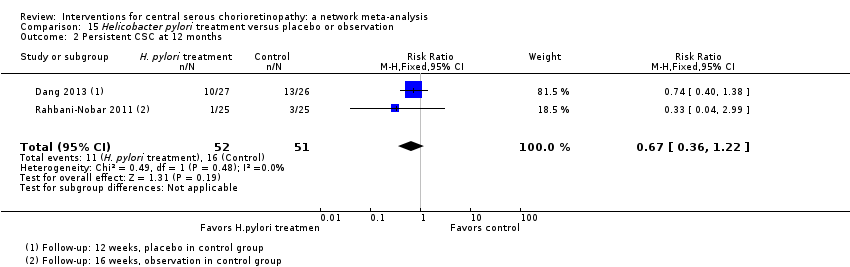
| Helicobacter pylori treatment vs. placebo | 314 per 1000 | 210 (113 to 383) | RR 0.67 (0.36 to 1.22) | 103 (2) | Low1,2 | Participants had acute CSC |
| Anti‐VEGF vs. observation | See comment | ‐ | ‐ | 64 (2) | ‐ | Outcome not reported |
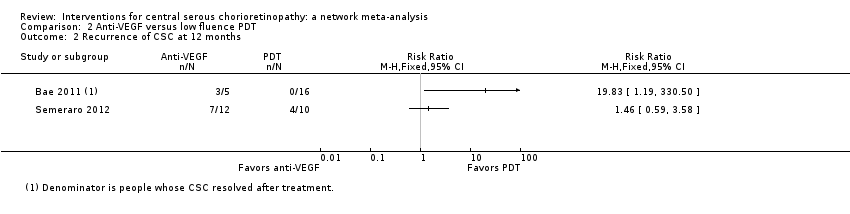
| Anti‐VEGF vs. low‐fluence PDT | See comment | ‐ | ‐ | 56 (2) | Very low1,2,4 | Participants had chronic CSC. The 2 studies had different results for this outcome (I2 = 71%). In Bae 2011, there was a much higher risk of recurrence in the anti‐VEGF group (ranibizumab) compared with the PDT group (RR 19.83, 95% CI 1.19 to 330.50; 21 eyes); in Semeraro 2012, there was also an increased risk of recurrence in the anti‐VEGF (bevacizumab) group but the size of the effect was much smaller and the CIs include 1 (no effect) (RR 1.46, 95% CI 0.59 to 3.58; 22 eyes) |
| Anti‐VEGF and 50% PDT vs. 50% PDT | See comment | ‐ | ‐ | 15 (1) | ‐ | Outcome not reported |
| 6‐dose anti‐VEGF vs. 4‐dose anti‐VEGF | See comment | ‐ | ‐ | 12 (1) | ‐ | Outcome not reported |
| 50% PDT vs. sham treatment | 267 per 1000 | 27 per 1000 (3 to 216) | RR 0.10 (0.01 to 0.81) | 53 (1) | Low1,2 | Participants had acute CSC |
| 30% PDT vs. PDT | See comment | ‐ | ‐ | 60 (1) | ‐ | Outcome not reported |
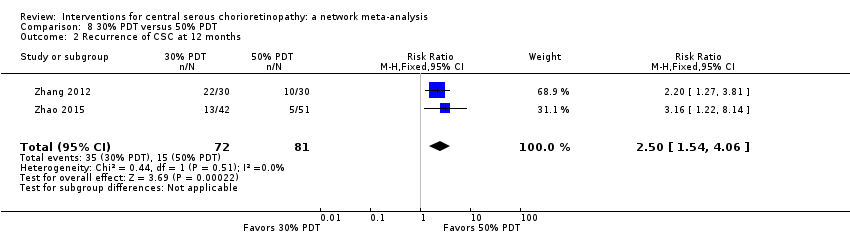
| 30% PDT vs. 50% PDT | See comment | ‐ | ‐ | 60 (1) | ‐ | Outcome not reported |
| 50% PDT vs. PDT | 270 per 1000 | 338 per 1000 (154 to 737) | RR 1.25 (0.57 to 2.73) | 60 (1) | ‐ | Type of CSC not specified |
| Selective retina therapy vs. observation | See comment | ‐ | ‐ | 30 (1) | ‐ | Outcome not reported |
| Micropulse diode laser | See comment | ‐ | ‐ | 15 (1) | ‐ | Outcome not reported |
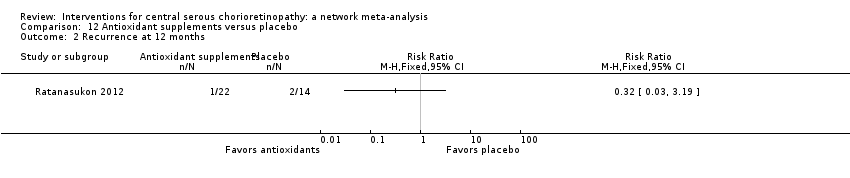
| Antioxidant vs. placebo | 143 per 1000 | 46 (4 to 456) | RR 0.32 (0.03 to 3.19) | 36 (1) | Very low2,3 | Participants had acute CSC |
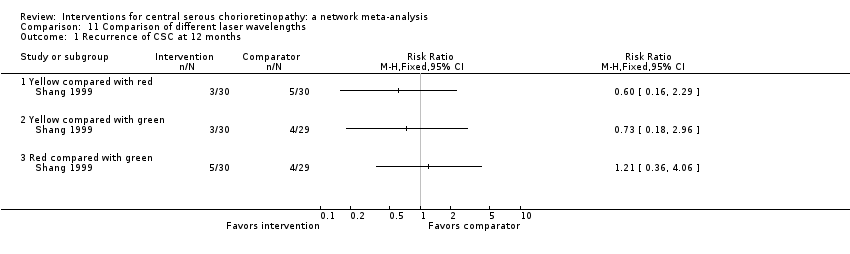
| Propranolol vs. placebo | 167 per 1000 | 100 (27 to 382) | RR 0.60 (0.16 to 2.29) | 60 (1) | Low1,2 | Type of CSC not reported |
| Brinzolamide vs. placebo | 314 per 1000 | 140 (20 to 953) | RR 0.21 (0.03 to 1.43 | 13 (1) | Low1,2 | Participants had acute CSC |
| Helicobacter pylori treatment vs. placebo | See comment | ‐ | ‐ | 103 (2) | ‐ | Outcome not reported |
| All studies reported no ocular or systematic adverse effects, or did not comment on adverse effects |