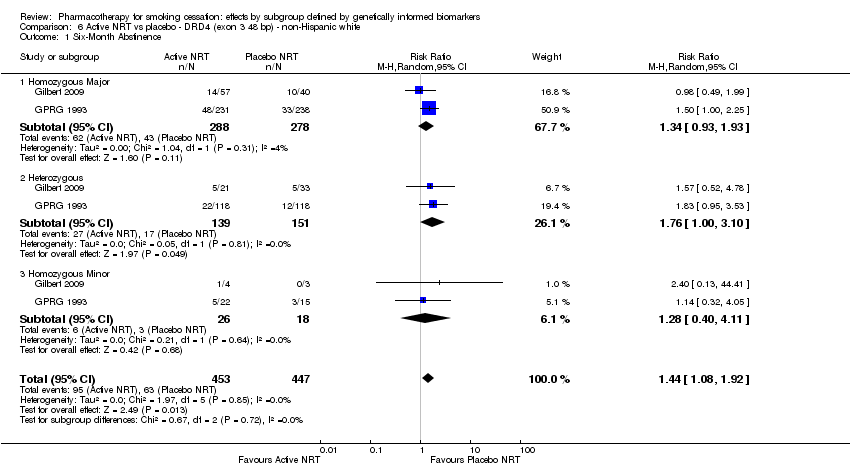
| Active NRT compared with placebo ‐ DRD4 (exon 3 48 bp) ‐ non‐Hispanic white for smoking cessation |
| Patient or population: people who smoke
Setting: community and healthcare settings
Intervention: active NRT
Comparison: placebo |
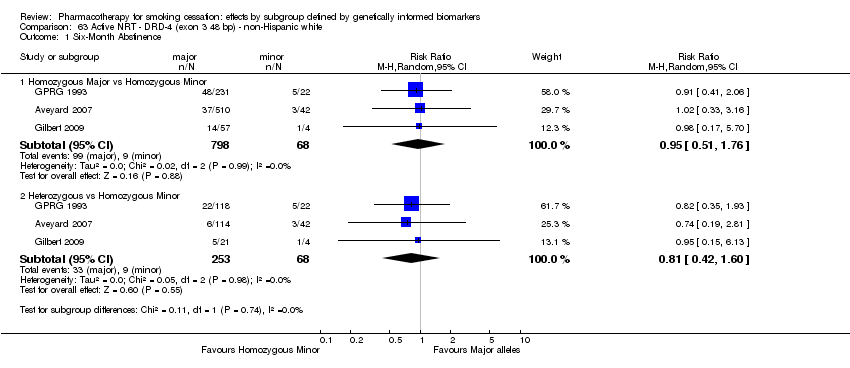
| 6‐Month abstinence | Study population | RR 1.44
(1.08 to 1.92) | 900
(2 RCTs) | ⊕⊕⊝⊝
LOWa,b | Pooled result across studies, including all genotypes. Between‐genotype group heterogeneity P value = 0.85 (see results for individual subgroups in below rows) |
| 141 per 1000 | 203 per 1000
(152 to 271) |
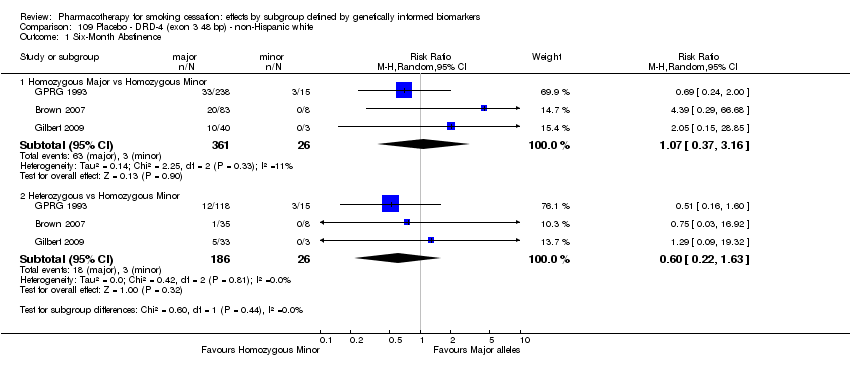
| 6‐month abstinence ‐ homozygous major | Study population | RR 1.34
(0.93 to 1.93) | 566
(2 RCTs) | ⊕⊝⊝⊝
VERY LOWa,b,c | For participants with homozygous major genotype, very low‐quality evidence suggests that point estimate favours intervention, but 95% CI crosses null effect. |
| 155 per 1000 | 207 per 1000
(144 to 299) |
| 6‐Month abstinence ‐ heterozygous | Study population | RR 1.76
(1.00 to 3.10) | 290
(2 RCTs) | ⊕⊕⊝⊝
LOWa,b | For participants with heterozygous genotype, low‐quality evidence suggests effect in favour of intervention. |
| 113 per 1000 | 198 per 1000
(113 to 349) |
| 6‐Month abstinence ‐ homozygous minor | Study population | RR 1.28
(0.40 to 4.11) | 44
(2 RCTs) | ⊕⊝⊝⊝
VERY LOWa,b,c | For participants with homozygous minor genotype, very low‐quality evidence suggests that point estimate favours intervention, but 95% CI crosses null effect. |
| 167 per 1000 | 213 per 1000
(67 to 685) |
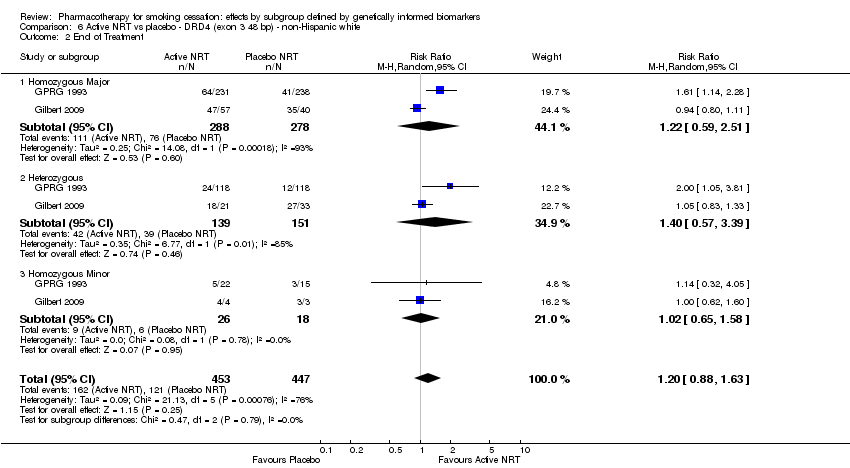
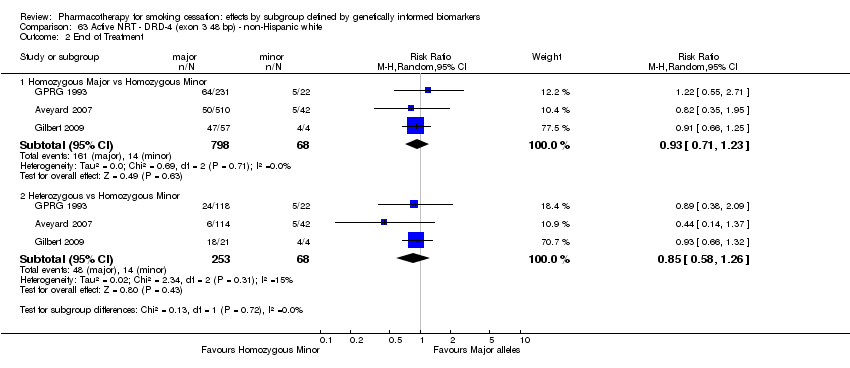
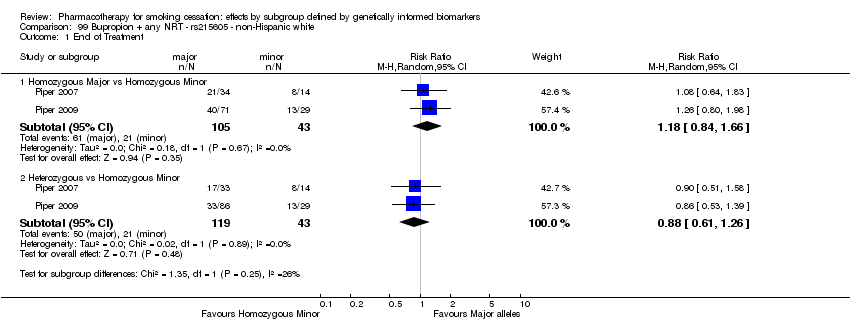
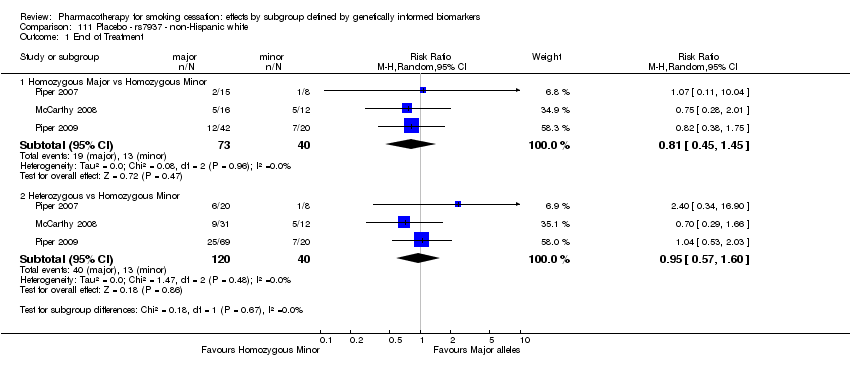
| End of treatment | Study population | RR 1.20
(0.88 to 1.63) | 900
(2 RCTs) | ⊕⊕⊝⊝
LOWa,b | Pooled result across studies, including all genotypes. Between‐genotype group heterogeneity P value = 0.78 (see results for individual subgroups in below rows) |
| 271 per 1000 | 325 per 1000
(238 to 441) |
| End of treatment ‐ homozygous major | Study population | RR 1.22
(0.59 to 2.51) | 566
(2 RCTs) | ⊕⊝⊝⊝
VERY LOWa,b,c | For participants with homozygous major genotype, very low‐quality evidence suggests that point estimate favours intervention, but 95% CI crosses null effect. |
| 273 per 1000 | 334 per 1000
(161 to 686) |
| End of treatment ‐ heterozygous | Study population | RR 1.40
(0.57 to 3.39) | 290
(2 RCTs) | ⊕⊝⊝⊝
VERY LOWa,b,c | For participants with heterozygous genotype, very low‐quality evidence suggests that point estimate favours intervention, but 95% CI crosses null effect. |
| 258 per 1000 | 362 per 1000
(147 to 876) |
| End of treatment ‐ homozygous minor | Study population | RR 1.02
(0.65 to 1.58) | 44
(2 RCTs) | ⊕⊕⊝⊝
LOWa,b | For participants with homozygous minor genotype, low‐quality evidence suggests no effect. |
| 333 per 1000 | 340 per 1000
(217 to 527) |
| *The risk in the intervention group (and its 95% confidence interval) is based on the assumed risk in the comparison group and the relative effect of the intervention (and its 95% CI).
CI: confidence interval; NRT: nicotine replacement therapy; RCT: randomised controlled trial; RR: risk ratio. |
| GRADE Working Group grades of evidence.
High quality: We are very confident that the true effect lies close to that of the estimate of the effect.
Moderate quality: We are moderately confident in the effect estimate: The true effect is likely to be close to the estimate of the effect, but there is a possibility that it is substantially different.
Low quality: Our confidence in the effect estimate is limited: The true effect may be substantially different from the estimate of the effect.
Very low quality: We have very little confidence in the effect estimate: The true effect is likely to be substantially different from the estimate of effect. |