Reducción de la dosis de corticosteroides inhalados para pacientes adultos con asma
Información
- DOI:
- https://doi.org/10.1002/14651858.CD011802.pub2Copiar DOI

- Base de datos:
-
- Cochrane Database of Systematic Reviews
- Versión publicada:
-
- 01 febrero 2017see what's new
- Tipo:
-
- Intervention
- Etapa:
-
- Review
- Grupo Editorial Cochrane:
-
Grupo Cochrane de Vías respiratorias
- Copyright:
-
- Copyright © 2017 The Cochrane Collaboration. Published by John Wiley & Sons, Ltd.
Cifras del artículo
Altmetric:
Citado por:
Autores
Contributions of authors
All review authors contributed to drafting of the protocol, reviewed it critically for intellectual content, provided final approval of the version to be published and are accountable for all aspects of the work.
Sources of support
Internal sources
-
The authors declare that no funding was received for this systematic review, Other.
External sources
-
IC, PM and NH declare that no funding was received for this systematic review, Other.
-
DE: National Institute for Health Research, UK.
Evidence to guide care in adults and children with asthma, 13/89/14
Declarations of interest
Iain Crossingham: none.
Paul Marsden: received lecture fees and conference accommodation/fees from industry unrelated to the current review.
Nathan Halcovitch: none.
David Evans: provides freelance writing services to medical communication agencies.
Acknowledgements
The Background and Methods sections of this review are based on a standard template used by the Cochrane Airways Review Group. Thank you to Elizabeth Stovold for assisting with the search strategy, and to Chris Cates, Emma Welsh, Sally Spencer and Steve Milan for providing advice and support.
Rebecca Normansell was the Editor for this review and commented critically on the review.
The National Institute for Health Research (NIHR) is the largest single funder of the work carried out by the Cochrane Airways Review Group. The views and opinions expressed therein are those of the review authors and do not necessarily reflect those of the NIHR, the National Health Service or the Department of Health.
Version history
| Published | Title | Stage | Authors | Version |
| 2017 Feb 01 | Stepping down the dose of inhaled corticosteroids for adults with asthma | Review | Iain Crossingham, David JW Evans, Nathan R Halcovitch, Paul A Marsden | |
| 2015 Aug 05 | Stepping down the dose of inhaled corticosteroids for adults with asthma | Protocol | Iain Crossingham, David JW Evans, Nathan R Halcovitch, Paul A Marsden | |
Differences between protocol and review
We used the mean difference instead of the standardised mean difference, as a combination of different scales would make clinical interpretation of the effect measure difficult.
Keywords
MeSH
Medical Subject Headings (MeSH) Keywords
Medical Subject Headings Check Words
Adolescent; Adult; Aged; Aged, 80 and over; Humans; Middle Aged;
PICO
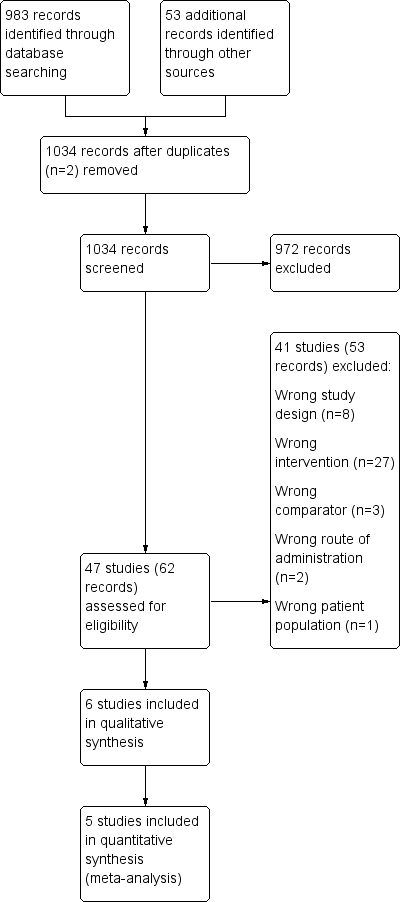
Study flow diagram.

Risk of bias summary: review authors' judgements about each risk of bias item for each included study.

Risk of bias graph: review authors' judgements about each risk of bias item presented as percentages across all included studies.
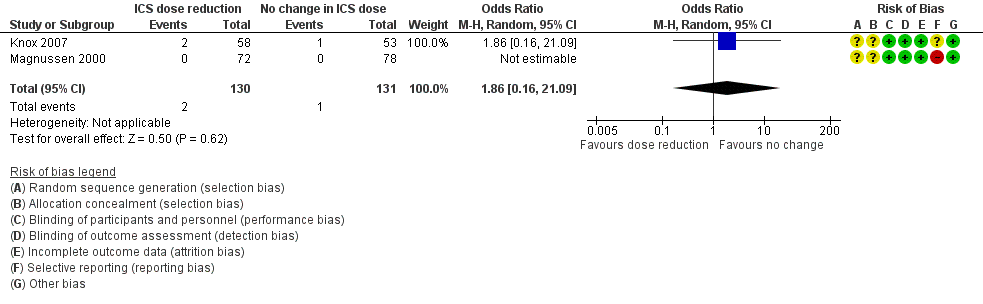
Forest plot of comparison: 1 ICS dose reduction versus no change in ICS dose (no concomitant LABA), outcome: 1.1 Exacerbation requiring OCS.
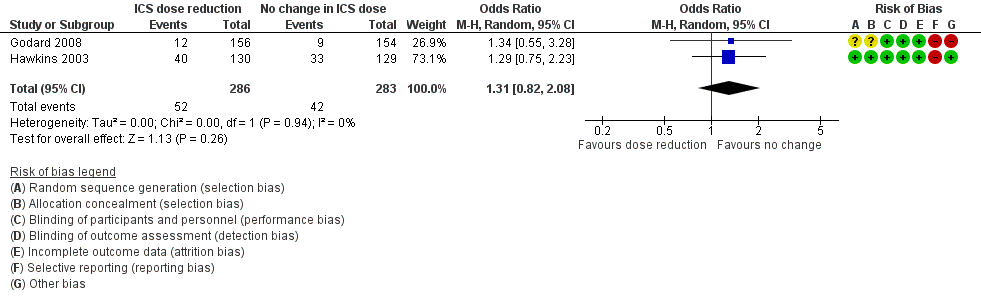
Forest plot of comparison: 2 ICS dose reduction versus no change in ICS dose (concomitant LABA), outcome: 2.1 Exacerbation requiring OCS.
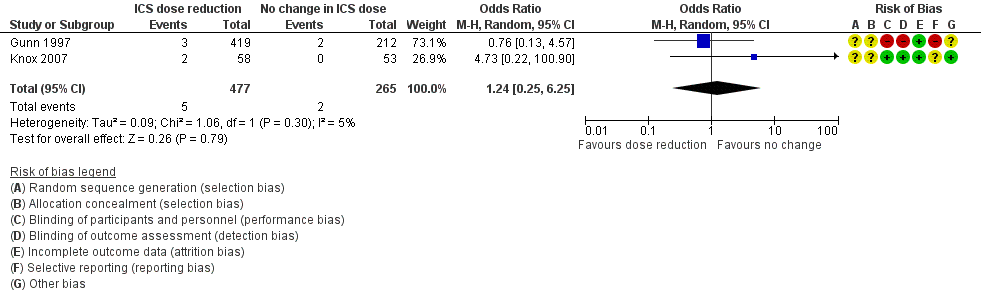
Forest plot of comparison: 1 ICS dose reduction versus no change in ICS dose (no concomitant LABA), outcome: 1.3 All‐cause SAEs.
Forest plot of comparison: 2 ICS dose reduction versus no change in ICS dose (concomitant LABA), outcome: 2.4 All‐cause SAEs.
Forest plot of comparison: 1 ICS dose reduction versus no change in ICS dose (no concomitant LABA), outcome: 1.4 Steroid‐related AEs.

Forest plot of comparison: 1 ICS dose reduction versus no change in ICS dose (no concomitant LABA), outcome: 1.7 Lung function, FEV1 (L).
Forest plot of comparison: 1 ICS dose reduction versus no change in ICS dose (no concomitant LABA), outcome: 1.6 Lung function, PEFR morning (L/min).

Forest plot of comparison: 2 ICS dose reduction versus no change in ICS dose (concomitant LABA), outcome: 2.9 Exacerbation requiring hospitalisation.

Comparison 1 ICS dose reduction versus no change in ICS dose (no concomitant LABA), Outcome 1 Exacerbation requiring OCS.
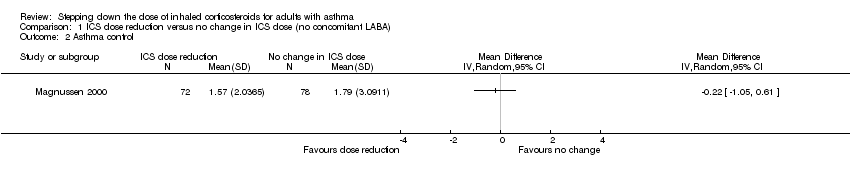
Comparison 1 ICS dose reduction versus no change in ICS dose (no concomitant LABA), Outcome 2 Asthma control.
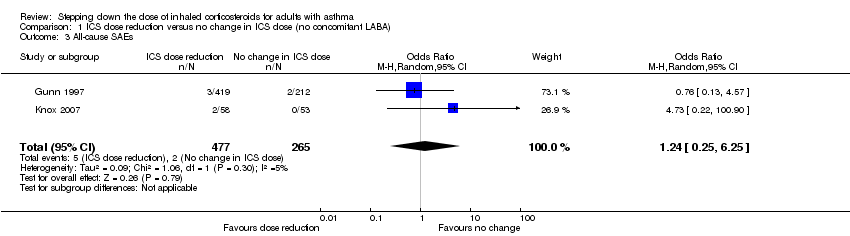
Comparison 1 ICS dose reduction versus no change in ICS dose (no concomitant LABA), Outcome 3 All‐cause SAEs.
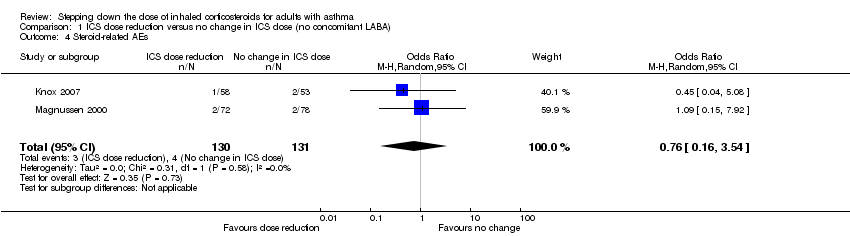
Comparison 1 ICS dose reduction versus no change in ICS dose (no concomitant LABA), Outcome 4 Steroid‐related AEs.
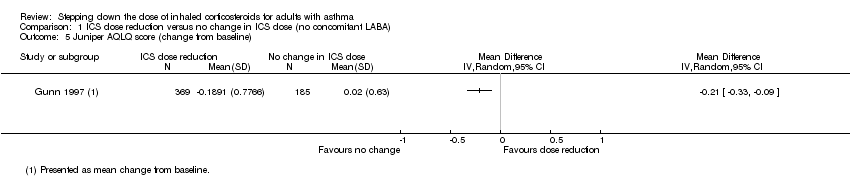
Comparison 1 ICS dose reduction versus no change in ICS dose (no concomitant LABA), Outcome 5 Juniper AQLQ score (change from baseline).

Comparison 1 ICS dose reduction versus no change in ICS dose (no concomitant LABA), Outcome 6 Lung function, PEFR morning (L/min).

Comparison 1 ICS dose reduction versus no change in ICS dose (no concomitant LABA), Outcome 7 Lung function, FEV1 (L).
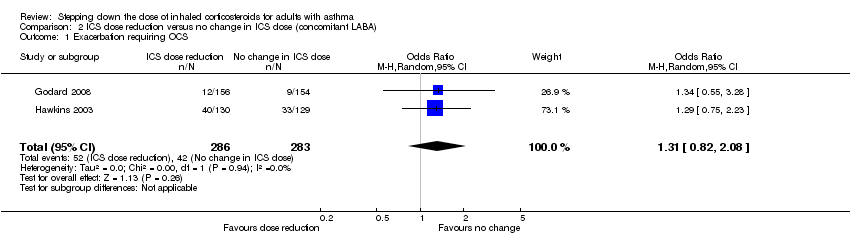
Comparison 2 ICS dose reduction versus no change in ICS dose (concomitant LABA), Outcome 1 Exacerbation requiring OCS.
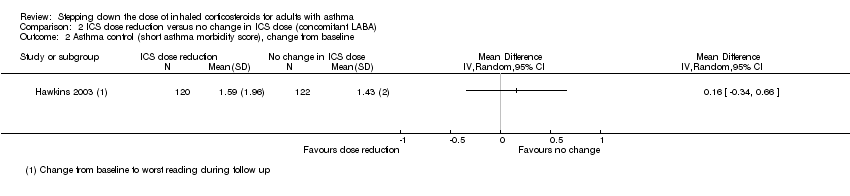
Comparison 2 ICS dose reduction versus no change in ICS dose (concomitant LABA), Outcome 2 Asthma control (short asthma morbidity score), change from baseline.
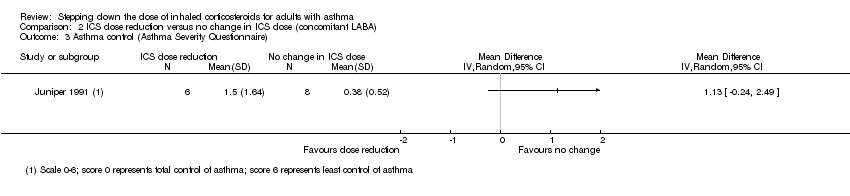
Comparison 2 ICS dose reduction versus no change in ICS dose (concomitant LABA), Outcome 3 Asthma control (Asthma Severity Questionnaire).
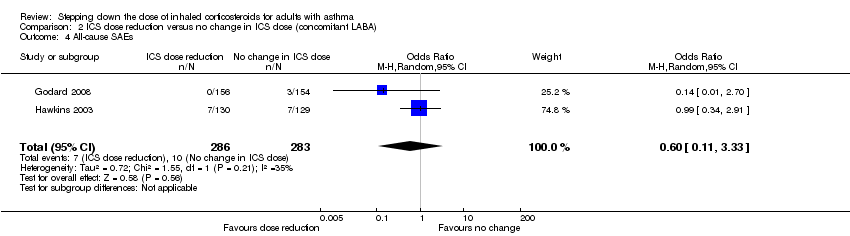
Comparison 2 ICS dose reduction versus no change in ICS dose (concomitant LABA), Outcome 4 All‐cause SAEs.
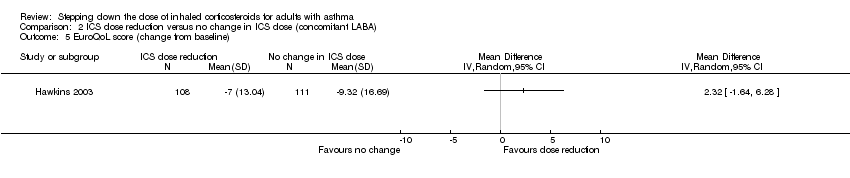
Comparison 2 ICS dose reduction versus no change in ICS dose (concomitant LABA), Outcome 5 EuroQoL score (change from baseline).

Comparison 2 ICS dose reduction versus no change in ICS dose (concomitant LABA), Outcome 6 St. George's Respiratory Scale score (change from baseline).
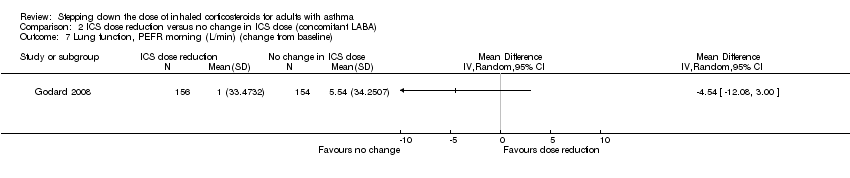
Comparison 2 ICS dose reduction versus no change in ICS dose (concomitant LABA), Outcome 7 Lung function, PEFR morning (L/min) (change from baseline).

Comparison 2 ICS dose reduction versus no change in ICS dose (concomitant LABA), Outcome 8 Lung function, reduction in FEV1 (% predicted, change from baseline).

Comparison 2 ICS dose reduction versus no change in ICS dose (concomitant LABA), Outcome 9 Exacerbation requiring hospitalisation.
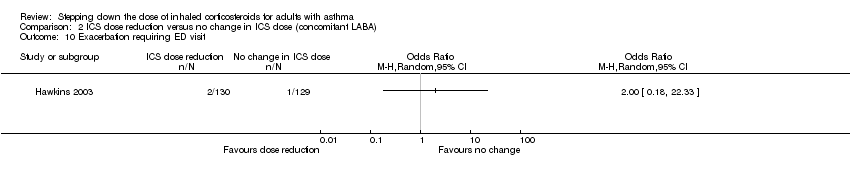
Comparison 2 ICS dose reduction versus no change in ICS dose (concomitant LABA), Outcome 10 Exacerbation requiring ED visit.

Comparison 2 ICS dose reduction versus no change in ICS dose (concomitant LABA), Outcome 11 Mortality.
| ICS dose reduction compared with no change in ICS dose (no concomitant LABA) for adults with asthma | ||||||
| Patient or population: adults with asthma | ||||||
| Outcomes | Anticipated absolute effects* (95% CI) | Relative effect | Number of participants | Quality of the evidence | Comments | |
| Risk with no change in ICS dose (no concomitant LABA) | Risk with ICS dose reduction | |||||
| Exacerbation requiring OCS | 8 per 1000 | 14 per 1000 | OR 1.86 | 261 | ⊕⊝⊝⊝ | No clear benefit or harm of stepping down the dose of ICS (very low‐quality evidence) |
| Asthma control | Mean asthma control score in the no change in ICS dose group was 1.79. | MD 0.22 lower | ‐ | 150 | ⊕⊕⊝⊝ | No clear benefit or harm of stepping down the dose of ICS (low‐quality evidence) |
| All‐cause SAEs | 8 per 1000 | 9 per 1000 | OR 1.24 | 742 | ⊕⊕⊝⊝ | No clear benefit or harm of stepping down the dose of ICS (low‐quality evidence) |
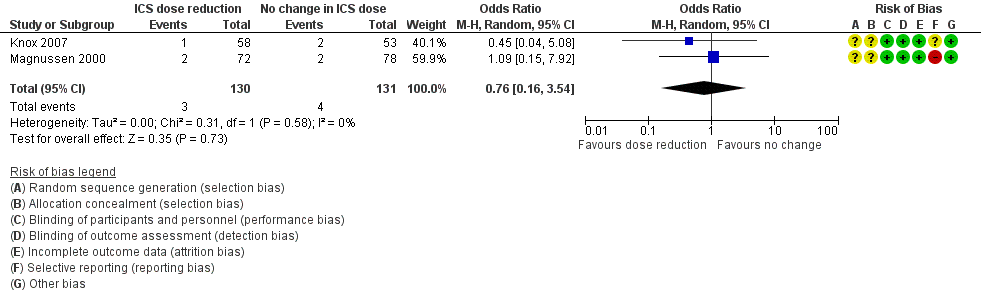
| Steroid‐related AEs | 31 per 1000 | 23 per 1000 | OR 0.76 | 261 | ⊕⊝⊝⊝ | No clear benefit or harm of stepping down the dose of ICS (very low‐quality evidence) |
| Health‐related quality of life (change from baseline) | Mean change from baseline in health‐related quality of life for the no change in ICS dose group was 0.02. | MD 0.21 lower | ‐ | 554 | ⊕⊝⊝⊝ | No clear benefit or harm of stepping down the dose of ICS (very low‐quality evidence); MCID is 0.5 for AQLQ |
| Lung function, FEV1 (L) | Mean FEV1 in the no change in ICS dose group was 3.15 litres. | MD 0.02 litres lower | ‐ | 261 | ⊕⊕⊝⊝ | No clear benefit or harm of stepping down the dose of ICS (low‐quality evidence) |
| Exacerbations requiring hospitalisation ‐ not reported | ‐ | ‐ | ‐ | ‐ | ‐ | Outcome not reported by included studies |
| *Risk in the intervention group (and its 95% confidence interval) is based on assumed risk in the comparison group and the relative effect of the intervention (and its 95% CI). bThe quality of the evidence was downgraded once for risk of bias (selective reporting) and once for indirectness (single study representative of one setting and drug regimen). cThe quality of the evidence was downgraded once for risk of bias (selective reporting) and once for imprecision (confidence intervals include null effect and appreciable benefit or harm). dThe quality of the evidence was downgraded once for risk of bias (selective reporting), once for indirectness (representative of specialist centres) and once for imprecision (confidence intervals include null effect and appreciable benefit or harm). eThe quality of the evidence was downgraded twice for risk of bias (selective reporting and lack of blinding (subjective outcome)) and once for indirectness (single study representative of one setting and drug regimen). fThe quality of the evidence was downgraded once for risk of bias (selective reporting) and once for imprecision (confidence intervals include null effect and appreciable benefit or harm). | ||||||
| GRADE Working Group grades of evidence | ||||||
| ICS dose reduction compared with no change in ICS dose (concomitant LABA) for adults with asthma | ||||||
| Patient or population: adults with asthma | ||||||
| Outcomes | Anticipated absolute effects* (95% CI) | Relative effect | Number of participants | Quality of the evidence | Comments | |
| Risk with no change in ICS dose (concomitant LABA) | Risk with ICS dose reduction | |||||
| Exacerbation requiring OCS | 148 per 1000 | 186 per 1000 | OR 1.31 | 569 | ⊕⊕⊝⊝ | No clear benefit or harm of stepping down the dose of ICS with respect to exacerbations requiring OCS (low‐quality evidence) |
| Asthma control (short asthma morbidity score) | Mean asthma control score was 1.43. | MD 0.16 higher | ‐ | 242 | ⊕⊕⊝⊝ | No clear benefit or harm of stepping down the dose of ICS with respect to asthma control (low‐quality evidence) |
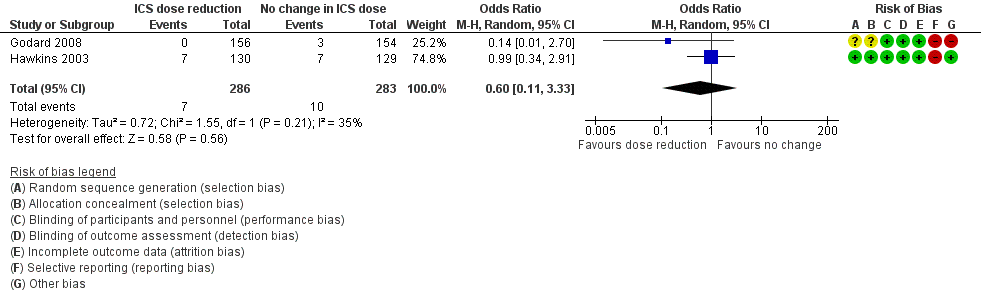
| All‐cause SAEs | 35 per 1000 | 22 per 1000 | OR 0.60 | 569 | ⊕⊕⊝⊝ | No clear benefit or harm of stepping down the dose of ICS with respect to all‐cause SAEs (low‐quality evidence) |
| Steroid‐related AEs ‐ not reported | ‐ | ‐ | ‐ | ‐ | ‐ | |
| St. George's Respiratory Scale score (change from baseline) Score 0‐100. 100 = greatest impact of chest disease on life; MCID is 4 units. | Mean change from baseline in HRQoL score was 7.4.c | MD 0.13 higher | ‐ | 229 | ⊕⊕⊝⊝ | No clear benefit or harm of stepping down the dose of ICS with respect to HRQoL (low‐quality evidence) |
| Exacerbation requiring hospitalisation | 4 per 1000 | 14 per 1000 | OR 4.06 | 569 | ⊕⊕⊝⊝ | No clear benefit or harm of stepping down the dose of ICS with respect to exacerbations requiring hospitalisation (low‐quality evidence) |
| Lung function, reduction in FEV1 (% predicted, change from baseline) | Mean change from baseline in % predicted FEV1 was ‐0.75%. | MD 2.45 lower | ‐ | 14 | ⊕⊝⊝⊝ | No clear benefit or harm of stepping down the dose of ICS with respect to lung function (very low‐quality evidence) |
| *Risk in the intervention group (and its 95% confidence interval) is based on assumed risk in the comparison group and the relative effect of the intervention (and its 95% CI). bThe quality of the evidence was downgraded once for risk of bias (selective reporting) and once for indirectness (single study representative of one setting and drug regimen). cNote that study authors reported the change to the lowest SGRQ score during follow‐up. dThe quality of the evidence was downgraded once for risk of bias (selective reporting) and once for imprecision (confidence intervals include null effect and appreciable benefit or harm). eThe quality of the evidence was downgraded once for risk of bias (selective reporting), once for indirectness (single study representative of one setting or drug regimen) and once for imprecision (wide CI). AE, adverse event; CI, confidence interval; FEV1, forced expiratory volume in one second; GRADE, Grades of Recommendation, Assessment, Development and Evaluation; HRQoL, health‐related quality of life; ICS, inhaled corticosteroid; LABA, long‐acting beta agonist; MCID, minimum clinically important difference; MD, mean difference; OCS, oral corticosteroid; OR, odds ratio; RCT, randomised controlled trial; RR, risk ratio; SAE, serious adverse event. | ||||||
| GRADE Working Group grades of evidence | ||||||
| Outcome or subgroup title | No. of studies | No. of participants | Statistical method | Effect size |
| 1 Exacerbation requiring OCS Show forest plot | 2 | 261 | Odds Ratio (M‐H, Random, 95% CI) | 1.86 [0.16, 21.09] |
| 2 Asthma control Show forest plot | 1 | Mean Difference (IV, Random, 95% CI) | Totals not selected | |
| 3 All‐cause SAEs Show forest plot | 2 | 742 | Odds Ratio (M‐H, Random, 95% CI) | 1.24 [0.25, 6.25] |
| 4 Steroid‐related AEs Show forest plot | 2 | 261 | Odds Ratio (M‐H, Random, 95% CI) | 0.76 [0.16, 3.54] |
| 5 Juniper AQLQ score (change from baseline) Show forest plot | 1 | Mean Difference (IV, Random, 95% CI) | Totals not selected | |
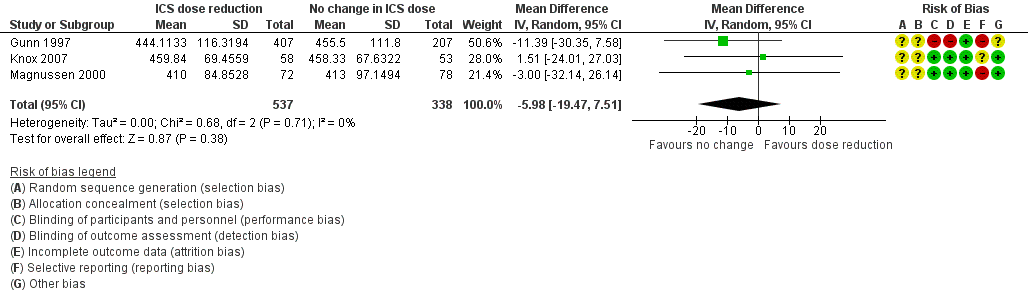
| 6 Lung function, PEFR morning (L/min) Show forest plot | 3 | 875 | Mean Difference (IV, Random, 95% CI) | ‐5.98 [‐19.47, 7.51] |
| 7 Lung function, FEV1 (L) Show forest plot | 2 | 261 | Mean Difference (IV, Random, 95% CI) | ‐0.02 [‐0.12, 0.08] |
| Outcome or subgroup title | No. of studies | No. of participants | Statistical method | Effect size |
| 1 Exacerbation requiring OCS Show forest plot | 2 | 569 | Odds Ratio (M‐H, Random, 95% CI) | 1.31 [0.82, 2.08] |
| 2 Asthma control (short asthma morbidity score), change from baseline Show forest plot | 1 | Mean Difference (IV, Random, 95% CI) | Totals not selected | |
| 3 Asthma control (Asthma Severity Questionnaire) Show forest plot | 1 | Mean Difference (IV, Random, 95% CI) | Totals not selected | |
| 4 All‐cause SAEs Show forest plot | 2 | 569 | Odds Ratio (M‐H, Random, 95% CI) | 0.60 [0.11, 3.33] |
| 5 EuroQoL score (change from baseline) Show forest plot | 1 | Mean Difference (IV, Random, 95% CI) | Totals not selected | |
| 6 St. George's Respiratory Scale score (change from baseline) Show forest plot | 1 | Mean Difference (IV, Random, 95% CI) | Totals not selected | |
| 7 Lung function, PEFR morning (L/min) (change from baseline) Show forest plot | 1 | Mean Difference (IV, Random, 95% CI) | Totals not selected | |
| 8 Lung function, reduction in FEV1 (% predicted, change from baseline) Show forest plot | 1 | Mean Difference (IV, Random, 95% CI) | Totals not selected | |
| 9 Exacerbation requiring hospitalisation Show forest plot | 2 | 569 | Odds Ratio (M‐H, Random, 95% CI) | 4.06 [0.45, 36.86] |
| 10 Exacerbation requiring ED visit Show forest plot | 1 | Odds Ratio (M‐H, Random, 95% CI) | Totals not selected | |
| 11 Mortality Show forest plot | 1 | 310 | Odds Ratio (M‐H, Random, 95% CI) | 0.0 [0.0, 0.0] |