Diferentes regímenes de corticosteroides orales para el asma aguda
Información
- DOI:
- https://doi.org/10.1002/14651858.CD011801.pub2Copiar DOI

- Base de datos:
-
- Cochrane Database of Systematic Reviews
- Versión publicada:
-
- 13 mayo 2016see what's new
- Tipo:
-
- Intervention
- Etapa:
-
- Review
- Grupo Editorial Cochrane:
-
Grupo Cochrane de Vías respiratorias
- Copyright:
-
- Copyright © 2016 The Cochrane Collaboration. Published by John Wiley & Sons, Ltd.
Cifras del artículo
Altmetric:
Citado por:
Autores
Contributions of authors
RN drafted the protocol and the review with substantial input, advice and revisions from KMK. RN, GM and KMK screened the search and extracted data from the included studies. RN entered the data into the review, and KMK performed cross‐checks. RN and KMK contributed to interpretation of the data, and all three authors contributed to the Discussion.
Sources of support
Internal sources
-
Rebecca Normansell and Kayleigh Kew, Cochrane Airways Group, UK.
Cochrane Airways Group is hosted by the Population Health Research Institute, St George's, University of London.
External sources
-
National Institute of Health Research, UK.
Evidence to guide care in adults and children with asthma, 13/89/14. This project was supported by the National Institute for Health Research, via Cochrane Infrastructure, Cochrane Programme Grant or Cochrane Incentive funding to Cochrane Airways. The views and opinions expressed therein are those of the review authors and do not necessarily reflect those of the Systematic Reviews Programme, NIHR, NHS or the Department of Health.
Declarations of interest
None known.
Acknowledgements
Chris Cates was the Editor for this review and commented critically on the protocol and the review.
Thank you to our user representative, Sarah Hymas, for her valuable input and advice.
Thank you to Chris Cates and Emma Welsh for editorial base support and advice.
The Background and Methods sections of this review are based on a standard template used by the Cochrane Airways Group.
We thank Dr. Joel Kravitz for confirming methodological details of his trial (Kravitz 2011) and Professor Joseph Zorc (NCT00257933) for providing unpublished details of his trial. We are also very grateful for translations provided by Goto Yoshihito and Keiji Hayashi.
Version history
| Published | Title | Stage | Authors | Version |
| 2016 May 13 | Different oral corticosteroid regimens for acute asthma | Review | Rebecca Normansell, Kayleigh M Kew, George Mansour | |
| 2015 Jul 14 | Different oral corticosteroid regimens for acute asthma | Protocol | Rebecca Normansell, Kayleigh M Kew, George Mansour | |
Differences between protocol and review
In a change to our protocol, we did not search manufacturers' websites, as the intervention medication is made generically by a large number of manufacturers worldwide. In addition, only one review author (RN) extracted study characteristics from included studies, and another review author (KMK) independently spot‐checked the extracted information for accuracy.
We stated that we would contact study authors to ask for more information when a trial was reported as an abstract only. In a change to our protocol, we did not contact the authors of Ghafouri 2010, as the trial was prospectively registered and all outcomes were clearly reported in tables that accompanied the abstract. We contacted the authors of Aboeed 2014, NCT00257933 and Viska 2008 to ask for additional details.
Keywords
MeSH
Medical Subject Headings (MeSH) Keywords
- Acute Disease;
- Administration, Oral;
- Adrenal Cortex Hormones;
- Anti‐Asthmatic Agents [*administration & dosage];
- Asthma [*drug therapy];
- Dexamethasone [*administration & dosage];
- Glucocorticoids [*administration & dosage];
- Hospitalization;
- Prednisolone [*administration & dosage];
- Randomized Controlled Trials as Topic;
Medical Subject Headings Check Words
Adult; Child; Humans;
PICO

Study flow diagram.

Risk of bias summary: review authors' judgements about each risk of bias item for each included study.

Comparison 1 Adults: higher dose/longer course vs lower dose/shorter course, Outcome 1 Re‐admission during follow‐up period.

Comparison 1 Adults: higher dose/longer course vs lower dose/shorter course, Outcome 2 Asthma symptoms: asthma severity score.

Comparison 1 Adults: higher dose/longer course vs lower dose/shorter course, Outcome 3 Asthma symptoms: complete resolution.

Comparison 1 Adults: higher dose/longer course vs lower dose/shorter course, Outcome 4 New exacerbation during follow‐up period: requiring visit to healthcare provider.

Comparison 1 Adults: higher dose/longer course vs lower dose/shorter course, Outcome 5 New exacerbation during follow‐up period: oral corticosteroids prescribed.

Comparison 1 Adults: higher dose/longer course vs lower dose/shorter course, Outcome 6 Lung function tests: trough PEFR.

Comparison 1 Adults: higher dose/longer course vs lower dose/shorter course, Outcome 7 Lung function tests: FEV1% predicted.

Comparison 1 Adults: higher dose/longer course vs lower dose/shorter course, Outcome 8 Lung function tests: number of participants achieving personal best at 4 weeks.

Comparison 1 Adults: higher dose/longer course vs lower dose/shorter course, Outcome 9 All adverse events.

Comparison 2 Adults: prednisolone vs dexamethasone, Outcome 1 Re‐admission during follow‐up period.

Comparison 2 Adults: prednisolone vs dexamethasone, Outcome 2 Asthma symptoms: returned to normal activities within 3 days.
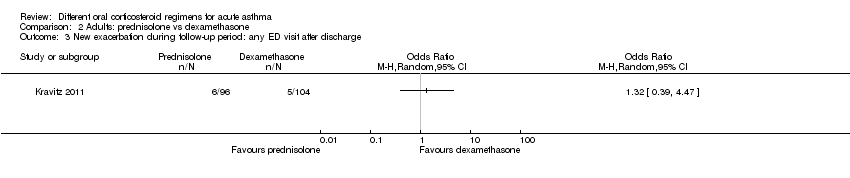
Comparison 2 Adults: prednisolone vs dexamethasone, Outcome 3 New exacerbation during follow‐up period: any ED visit after discharge.

Comparison 2 Adults: prednisolone vs dexamethasone, Outcome 4 New exacerbation during follow‐up period: unscheduled visit to primary healthcare provider.

Comparison 3 Children: higher dose/longer course vs lower dose/shorter course, Outcome 1 Admission at initial presentation.

Comparison 3 Children: higher dose/longer course vs lower dose/shorter course, Outcome 2 Re‐admission during follow‐up period.

Comparison 3 Children: higher dose/longer course vs lower dose/shorter course, Outcome 3 Asthma symptoms: clinical asthma score at discharge.

Comparison 3 Children: higher dose/longer course vs lower dose/shorter course, Outcome 4 Asthma symptoms: symptom free by 7 days.

Comparison 3 Children: higher dose/longer course vs lower dose/shorter course, Outcome 5 Serious adverse events.

Comparison 3 Children: higher dose/longer course vs lower dose/shorter course, Outcome 6 New exacerbation during follow‐up period: oral corticosteroids prescribed.
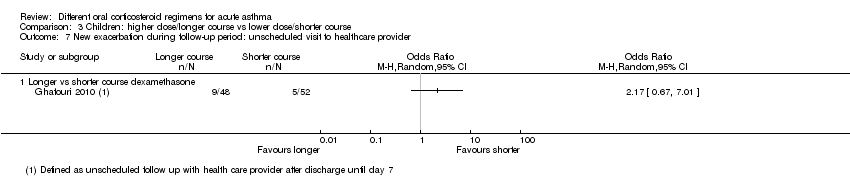
Comparison 3 Children: higher dose/longer course vs lower dose/shorter course, Outcome 7 New exacerbation during follow‐up period: unscheduled visit to healthcare provider.

Comparison 3 Children: higher dose/longer course vs lower dose/shorter course, Outcome 8 Lung function tests: FEV1% predicted at discharge.

Comparison 3 Children: higher dose/longer course vs lower dose/shorter course, Outcome 9 Lung function tests: PEFR% predicted at discharge.

Comparison 3 Children: higher dose/longer course vs lower dose/shorter course, Outcome 10 All adverse events: longer vs short course prednisolone.

Comparison 3 Children: higher dose/longer course vs lower dose/shorter course, Outcome 11 All adverse events: higher‐dose vs lower‐dose prednisolone.

Comparison 4 Children: prednisolone vs dexamethasone, Outcome 1 Admission at initial presentation.

Comparison 4 Children: prednisolone vs dexamethasone, Outcome 2 Re‐admission during follow‐up period.

Comparison 4 Children: prednisolone vs dexamethasone, Outcome 3 Asthma symptoms: PIS.

Comparison 4 Children: prednisolone vs dexamethasone, Outcome 4 Asthma symptoms: PSAS.

Comparison 4 Children: prednisolone vs dexamethasone, Outcome 5 Asthma symptoms: PRAM.
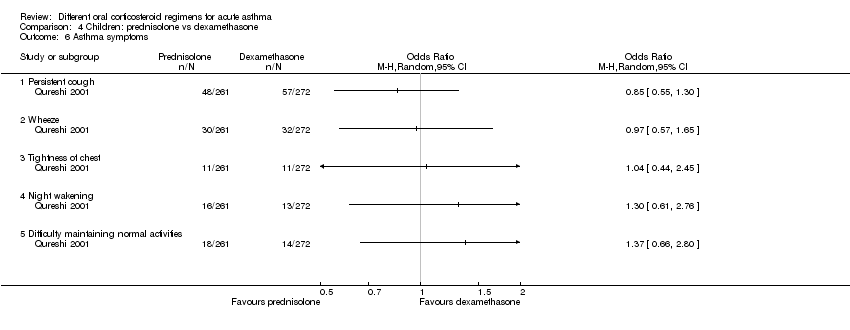
Comparison 4 Children: prednisolone vs dexamethasone, Outcome 6 Asthma symptoms.

Comparison 4 Children: prednisolone vs dexamethasone, Outcome 7 Serious adverse events.

Comparison 4 Children: prednisolone vs dexamethasone, Outcome 8 New exacerbation during follow‐up period: unscheduled visit to healthcare provider.

Comparison 4 Children: prednisolone vs dexamethasone, Outcome 9 New exacerbation during follow‐up period: oral corticosteroids prescribed.

Comparison 4 Children: prednisolone vs dexamethasone, Outcome 10 Adverse event: vomiting.
| Adults: higher dose/longer course compared with lower dose/shorter course for acute asthma | ||||||
| Patient or population: adults with an acute exacerbation of asthma Duration range: 3 to 26 weeks | ||||||
| Outcomes | Anticipated absolute effects* (95% CI) | Relative effect | Number of participants | Quality of the evidence | Comments | |
| Risk with lower dose/shorter course | Risk with higher dose/longer course | |||||
| Re‐admission in follow‐up period | Longer vs shorter course prednisolone | OR 1.35 | 142 | ⊕⊕⊝⊝ | ||
| 74 per 1000 | 97 per 1000 | |||||
| Asthma symptoms Asthma severity score | Longer vs shorter course prednisolone | ‐ | 44 | ⊕⊕⊝⊝ | Higher score = Worse symptoms | |
| Mean asthma severity score was 2.6 | Mean asthma severity score in the longer course group was 0.7 lower (1.28 lower to 0.12 lower) | |||||
| Asthma symptoms Complete resolution by day 28 | Longer vs shorter course prednisolone | OR 0.55 | 35 | ⊕⊕⊝⊝ | ||
| 412 per 1000 | 278 per 1000 | |||||
| New exacerbation in follow‐up period Requiring visit to healthcare provider | Longer vs shorter course prednisolone | OR 0.98 | 55 | ⊕⊝⊝⊝ | ||
| 111 per 1000 | 109 per 1000 | |||||
| Stable (same daily dose for 7 days) vs tapered (tapering daily dose over 7 days) prednisolone | OR 3.56 | 41 | ⊕⊝⊝⊝ | No events were reported in the tapered arm and only 2 events in the stable arm, so we were unable to calculate a baseline risk | ||
| No events | Risk difference in the stable (higher total dose) group was 9% (0 to 26%) | |||||
| New exacerbation in follow‐up period Oral corticosteroids prescribed | Longer vs shorter course prednisolone | OR 0.62 | 122 | ⊕⊕⊝⊝ | Lederle 1987 dominates this analysis, as the event rate was much higher than in the other 2 studies, possibly reflecting co‐morbid COPD in the study population. Result should be interpreted with caution | |
| 241 per 1000 | 165 per 1000 (68 to 348) | |||||
| Lung function tests FEV1% predicted | Stable (same daily dose for 7 days) vs tapered (tapering daily dose over 7 days) prednisolone | ‐ | 41 | ⊕⊝⊝⊝ | Higher percentage = Better lung function | |
| Mean FEV1% predicted was 70.6 | Mean FEV1% predicted in the stable dose (higher total dose) was 1.02 lower (4.62 lower to 2.58 higher) | |||||
| All adverse events | Longer vs shorter course prednisolone | OR 4.15 | 43 | ⊕⊝⊝⊝ | ||
| 143 per 1000 | 409 per 1000 | |||||
| *Risk in the intervention group (and its 95% confidence interval) is based on assumed risk in the comparison group and the relative effect of the intervention (and its 95% CI) | ||||||
| GRADE Working Group grades of evidence | ||||||
| aLederle 1987 carried a large proportion of the analysis weight for this outcome because event rates were higher in both groups. This may reflect co‐morbid COPD (participants were older and most had an extensive smoking history). Downgraded once for indirectness bConfidence intervals include no difference and an important benefit of a longer or shorter course. Downgraded once for imprecision cConfidence intervals excluded possible benefit of a shorter course, but the effect was based on only 1 study of 44 people. Downgraded once for imprecision dA 1‐7 scale of symptom severity averaged over days 6‐21 was used, making clinical benefit difficult to interpret. Downgraded once for indirectness eNeither treatment regimen used in the one study in this analysis is consistent with current international guidance. Downgraded once for indirectness fThe study contributing most of the analysis weight was unblinded and uncertainties surrounded the selection procedure. Downgraded once for risk of bias gBoth trials contributing to the analysis used a treatment regimen that was inconsistent with current international guidance. Downgraded once for indirectness hThe effect was derived from 2 very similar studies including 41 people in total. Studies had smaller standard deviations than would be expected given the sample sizes. Downgraded once for imprecision iThe result is based on 1 small study and has wide confidence intervals, which do not exclude the possibility of no difference or an important increase in adverse events in the longer course arm, Downgraded twice for imprecision | ||||||
| Adults: prednisolone compared with dexamethasone for acute asthma | ||||||
| Patient or population: adults with an acute exacerbation of asthma Duration: 2 weeks | ||||||
| Outcomes | Anticipated absolute effects* (95% CI) | Relative effect | Number of participants | Quality of the evidence | Comments | |
| Risk with dexamethasone | Risk with prednisolone | |||||
| Re‐admission during follow‐up period | 29 per 1000 | 10 per 1000 | OR 0.35 | 200 | ⊕⊝⊝⊝ | |
| Asthma symptoms Returned to normal activities within 3 days | 901 per 1000 | 800 per 1000 | OR 0.44 | 191 | ⊕⊕⊝⊝ | |
| New exacerbation during follow‐up period Any ED visit after discharge | 48 per 1000 | 63 per 1000 | OR 1.32 | 200 | ⊕⊝⊝⊝ | |
| New exacerbation during follow‐up period Unscheduled visit to primary healthcare provider | 29 per 1000 | 52 per 1000 | OR 1.85 | 200 | ⊕⊝⊝⊝ | |
| *Risk in the intervention group (and its 95% confidence interval) is based on assumed risk in the comparison group and the relative effect of the intervention (and its 95% CI) | ||||||
| GRADE Working Group grades of evidence | ||||||
| aOnly 1 study contributed to this outcome with very few events reported in total, resulting in an imprecise estimate with confidence intervals including both important harms and benefits of either regimen. Downgraded twice for imprecision bOnly contributing study judged to be at high risk of attrition bias because of post‐randomisation exclusions and large numbers lost to follow‐up. Downgraded once for risk of bias cOnly 1 study contributed to this outcome with imprecise estimate and confidence intervals not completely excluding the possibility of no differences. Downgraded once for imprecision | ||||||
| Children: higher dose/longer course compared with lower dose/shorter course for acute asthma | ||||||
| Patient or population: children with an acute exacerbation of asthma Duration range: 1 to 4 weeks | ||||||
| Outcomes | Anticipated absolute effects* (95% CI) | Relative effect | Number of participants | Quality of the evidence | Comments | |
| Risk with lower dose/shorter course | Risk with higher dose/longer course | |||||
| Re‐admission during follow‐up period | Higher‐ vs lower‐dose prednisolone | Not estimable | 98 | ⊕⊝⊝⊝ | Only one 3‐arm study (Langton Hewer 1998) contributed events to this analysis. Two lower‐dose arms pooled for this outcome. OR 1.55 (0.24 to 9.78) favouring lower dose | |
| Not pooled | Not pooled | |||||
| Longer vs shorter course prednisolone | OR 0.33 | 201 | ⊕⊕⊝⊝ | |||
| 10 per 1000 | 3 per 1000 | |||||
| Longer vs shorter course dexamethasone | OR 2.22 | 100 | ⊕⊝⊝⊝ | |||
| 19 per 1000 | 42 per 1000 | |||||
| Asthma symptoms Symptom free by 7 days | Longer vs shorter course prednisolone | OR 1.22 | 201 | ⊕⊕⊕⊝ | One other study (Langton Hewer 1998) randomising 98 children to high‐ vs medium‐ vs low‐dose prednisolone reported clinical asthma score at discharge. Small differences in scores were reported with uncertain clinical importance and no consistent dose‐response effect | |
| 307 per 1000 | 351 per 1000 | |||||
| Serious adverse events | Longer vs shorter course prednisolone | Not estimable | 201 | No events occurred in either trial arm | ||
| 0 per 1000 | 0 per 1000 | |||||
| New exacerbation during follow‐up period Oral corticosteroids prescribed | Higher‐ vs lower‐dose prednisolone | OR 1.38 | 231 | ⊕⊕⊝⊝ | ||
| 17 per 1000 | 24 per 1000 | |||||
| Longer vs shorter course prednisolone | OR 0.61 | 201 | ⊕⊕⊕⊝ | |||
| 79 per 1000 | 50 per 1000 | |||||
| Longer vs shorter course dexamethasone | OR 0.24 | 100 | ⊕⊕⊝⊝ | |||
| 154 per 1000 | 42 per 1000 | |||||
| New exacerbation during follow‐up period Unscheduled visit to healthcare provider | Longer vs shorter course dexamethasone | OR 2.17 | 100 | ⊕⊝⊝⊝ | ||
| 96 per 1000 | 188 per 1000 | |||||
| Lung function tests FEV1% predicted at discharge | High vs medium vs low dose | ‐ | 34 | This outcome includes only 1 small study (Langton Hewer 1998) in which a subset of participants were able to perform PFTs. Reported between‐group differences were small and of uncertain clinical importance with no consistent dose‐response effect. | ||
| ‐ | ‐ | |||||
| All adverse events | Longer vs short course prednisolone | OR 0.67 | 201 | ⊕⊕⊕⊝ | ||
| 30 per 1000 | 20 per 1000 | |||||
| *Risk in the intervention group (and its 95% confidence interval) is based on assumed risk in the comparison group and the relative effect of the intervention (and its 95% CI) | ||||||
| GRADE Working Group grades of evidence | ||||||
| aOnly 1 study contributed events to this outcome and was assessed to be at high risk of attrition bias because of unbalanced drop‐out from intervention arms. Downgraded once for risk of bias bThe study contributing events had 3 different dose arms, 1 of which is outside the current dosing guidelines. Two other studies reported no events, but intervention involved much higher doses of prednisolone. Downgraded once for indirectness cOnly 1 study contributed to this analysis. Imprecise estimate with confidence intervals including possibility of important harms or benefits. Downgraded twice for imprecision dOnly contributing study considered at high risk of bias in multiple domains. Downgraded once for risk of bias eOnly 1 study contributed to this outcome, resulting in imprecise estimate and confidence intervals including the possibility of important harms or benefits. Downgraded once for imprecision fOnly 2 studies contributed to this outcome with few events, resulting in imprecise estimate and wide confidence intervals including the possibility of important harms or benefits. Downgraded twice for imprecision gOnly 1 study contributed to this outcome, resulting in imprecise estimate, which does not exclude the possibility of no difference. Downgraded once for imprecision | ||||||
| Children: prednisolone compared with dexamethasone for acute asthma | ||||||
| Patient or population: children with acute exacerbation of asthma Duration range: 1.5 to 3 weeks | ||||||
| Outcomes | Anticipated absolute effects* (95% CI) | Relative effect | Number of participants | Quality of the evidence | Comments | |
| Risk with dexamethasone | Risk with prednisolone | |||||
| Admission at initial presentation | 116 per 1000 | 124 per 1000 | OR 1.08 (0.74 to 1.58) | 1007 | ⊕⊕⊝⊝ | |
| Re‐admission during follow‐up period | 22 per 1000 | 10 per 1000 | OR 0.44 (0.15 to 1.33) | 985 | ⊕⊕⊝⊝ | |
| Asthma symptoms scores Pulmonary Index Score (PIS); Patient Self Assessment Score (PSAS); Paediatric Respiratory Assessment Measure (PRAM) | Not pooled | Not pooled | ‐ | 328 (2 RCTs) | ⊕⊝⊝⊝ | Altamimi 2006 reported PIS and PSAS Cronin 2015 reported PRAM (we extracted the result, which excluded re‐enrolments) No between‐group differences were detected |
| Asthma symptoms Persistent cough, wheeze, chest tightness, night‐time wakening and difficulty maintaining normal activities | Not pooled | Not pooled | ‐ | 533 | The number of people experiencing these symptoms at day 10 was not found to be significantly different between the 2 intervention arms | |
| Serious adverse events | Not pooled | Not pooled | Not estimable | 255 | No events were reported in either study | |
| New exacerbation during follow‐up period Unscheduled visit to healthcare provider | 97 per 1000 | 83 per 1000 | OR 0.85 (0.54 to 1.34) | 981 | ⊕⊕⊝⊝ | |
| *Risk in the intervention group (and its 95% confidence interval) is based on assumed risk in the comparison group and the relative effect of the intervention (and its 95% CI) | ||||||
| GRADE Working Group grades of evidence | ||||||
| aThe 2 studies contributing most events to this outcome were considered to be at high or unclear risk of selection (Qureshi 2001) and performance and detection bias (Cronin 2015; Qureshi 2001). In addition, Cronin 2015 allowed 19 participants to enrol more than once in the study. Downgraded once for risk of bias bConfidence intervals include possible harms or benefits of either intervention. Downgraded once for imprecision cThe pulmonary index score may lack rigorous evaluation, so clinical interpretation of this score is limited. Downgraded once for indirectness dConfidence intervals for PIS and PSAS include no difference, but we are unsure whether either end of the confidence intervals includes a clinically important effect. Downgraded once for imprecision eThe PSAS score has been adapted from National Institute of Health guidelines and may lack rigorous evaluation, so clinical interpretation is limited. Downgraded once for indirectness fWe were unable to combine the results of these different scales. Downgraded once for inconsistency | ||||||
| Study ID | Total n | Country | Age range, years | Duration of follow‐up | Comparison | Total dose comparison (converted to prednisolone equivalent) |
| 58 | USA | Not reported | 4 weeks | Prednisone 40 mg once daily for 5 days vs dexamethasone 16 mg once daily for 2 days | 200 mg vs 213 mg | |
| 134 | Canada | 2 to16 | 3 weeks (maximum) | Predisolone 1 mg/kg twice daily for 5 days vs dexamethasone 0.6 mg/kg once daily for 1 day | 200 mg vs 80 mg (based on 20 kg child) | |
| 201 | Australia | 2 to15 | 4 weeks | Prednisolone 1 mg/kg daily for 5 days vs prednisolone 1 mg/kg daily for 3 days | 100 mg vs 60 mg (based on 20 kg child) | |
| 226 | Ireland | 2 to 16 | 2 weeks | Prednisolone 1 mg/kg daily for 3 days vs 0.3 mg/kg dexamethasone once daily for 1 day | 60 mg vs 40 mg (based on 20 kg child) | |
| 15 | USA | 19 to 50 | 3 weeks | Prednisolone 40 mg daily for 8 days vs prednisolone 40 mg daily tapering by 5 mg per day for 8 days | 320 mg vs 180 mg | |
| 125 | USA | 2 to 17 | 1 week | Dexamethasone 0.6 mg/kg once daily for 2 doses (days 1 and 3) versus dexamethasone 0.6 mg/kg once daily for 1 day | 160 mg vs 80 mg (based on 20 kg child) | |
| 167 | USA | 2 to 18 | 1.5 weeks | Prednisolone 1 mg/kg twice daily for 5 days vs dexamethasone 0.6 mg/kg once daily for 2 days | 200 mg vs 160 mg (based on 20 kg child) | |
| 20 | Japan | Not reported | 26 weeks | Prednisolone 0.5 mg/kg daily for 14 days vs prednisolone 0.5 mg/kg once daily for 7 days | 490 mg vs 245 mg (based on 70 kg adult) | |
| 47 | UK | 16 to 60 | 4‐6 weeks | Prednisolone 40 mg once daily for 10 days vs prednisolone 40 mg once daily for 5 days | 400 mg vs 200 mg | |
| 26 | India | 17 to 70 | 3 weeks | Prednisolone 40 mg daily for 8 days vs prednisolone 40 mg daily tapering by 5 mg per day for 8 days | 320 mg vs 180 mg | |
| 88 | USA | 2 to 18 | 4 weeks (maximum) | Prednisolone 2 mg/kg daily for 5 days vs prednisolone 1 mg/kg daily for 5 days | 200 mg vs 100 mg (based on 20 kg child) | |
| 285 | USA | 18 to 45 | 2 weeks | Prednisolone 50 mg once daily for 5 days vs dexamethasone 16 mg once daily for 2 days | 250 mg vs 213 mg | |
| 98 | UK | 1 to 15 | 2 weeks | Prednisolone 2 mg/kg once daily vs prednisolone 1 mg/kg once daily vs prednisolone 0.5 mg/kg once daily while inpatient and for up to 3 days post discharge | 200 mg vs 100 mg vs 50 mg (based on 20 kg child receiving a 5‐day course) | |
| 43 | USA | 30 to 78 | 12 weeks | Prednisolone 45 mg daily reducing to 0 mg daily over 7 weeks vs prednisolone 45 mg daily reducing to 0 mg daily over 7 days | 1575 mg vs 225 mg | |
| 152 | USA | 2 to 18 | 2 weeks | Prednisolone 4 mg/kg daily for 2 days, then 2 mg/kg daily for duration of admission vs prednisolone 2 mg/kg daily for duration of admission | 400 mg vs 200 mg (based on 20 kg child receiving a 5‐day course) | |
| 39 | UK | 16 to 55 | 4‐6 weeks | Prednisolone 40 mg daily for 10 days followed by 7‐day taper vs prednisolone 40 mg daily for 10 days | 540 mg vs 400 mg | |
| 628 | USA | 2 to 18 | 2 weeks | Prednisolone 2 mg/kg initial dose, then 1 mg/kg daily for 5 days vs dexamethasone 0.6 mg/kg once daily for 2 days | 120 mg vs 160 mg (based on 20 kg child) | |
| 86 | Indonesia | "Adults" | 6 weeks | Prednisolone 36 mg daily for 2 weeks vs prednisolone 12 mg daily for 2 weeks | 504 mg vs 168 mg |
| Outcome or subgroup title | No. of studies | No. of participants | Statistical method | Effect size |
| 1 Re‐admission during follow‐up period Show forest plot | 4 | Odds Ratio (M‐H, Random, 95% CI) | Subtotals only | |
| 1.1 Longer vs shorter course prednisolone | 4 | 142 | Odds Ratio (M‐H, Random, 95% CI) | 1.35 [0.38, 4.79] |
| 2 Asthma symptoms: asthma severity score Show forest plot | 1 | Mean Difference (IV, Random, 95% CI) | Totals not selected | |
| 2.1 Longer vs shorter course prednisolone | 1 | Mean Difference (IV, Random, 95% CI) | 0.0 [0.0, 0.0] | |
| 3 Asthma symptoms: complete resolution Show forest plot | 1 | Odds Ratio (M‐H, Random, 95% CI) | Totals not selected | |
| 3.1 Longer vs shorter course prednisolone | 1 | Odds Ratio (M‐H, Random, 95% CI) | 0.0 [0.0, 0.0] | |
| 4 New exacerbation during follow‐up period: requiring visit to healthcare provider Show forest plot | 4 | Risk Difference (M‐H, Random, 95% CI) | Subtotals only | |
| 4.1 Longer vs shorter course prednisolone | 2 | 55 | Risk Difference (M‐H, Random, 95% CI) | ‐0.00 [‐0.14, 0.14] |
| 4.2 Stable vs tapered prednisolone | 2 | 41 | Risk Difference (M‐H, Random, 95% CI) | 0.09 [‐0.07, 0.26] |
| 5 New exacerbation during follow‐up period: oral corticosteroids prescribed Show forest plot | 3 | 122 | Odds Ratio (M‐H, Random, 95% CI) | 0.62 [0.23, 1.68] |
| 5.1 Longer vs shorter course prednisolone | 3 | 122 | Odds Ratio (M‐H, Random, 95% CI) | 0.62 [0.23, 1.68] |
| 6 Lung function tests: trough PEFR Show forest plot | 2 | Mean Difference (IV, Random, 95% CI) | Subtotals only | |
| 6.1 Longer vs shorter prednisolone (trough PEFR) | 2 | 79 | Mean Difference (IV, Random, 95% CI) | ‐4.81 [‐45.82, 36.20] |
| 7 Lung function tests: FEV1% predicted Show forest plot | 2 | Mean Difference (IV, Random, 95% CI) | Subtotals only | |
| 7.1 Stable vs tapered prednisolone (FEV1% predicted) | 2 | 41 | Mean Difference (IV, Random, 95% CI) | ‐1.02 [‐4.62, 2.58] |
| 8 Lung function tests: number of participants achieving personal best at 4 weeks Show forest plot | 1 | Odds Ratio (M‐H, Random, 95% CI) | Totals not selected | |
| 8.1 Longer vs shorter course prednisolone | 1 | Odds Ratio (M‐H, Random, 95% CI) | 0.0 [0.0, 0.0] | |
| 9 All adverse events Show forest plot | 1 | Odds Ratio (M‐H, Random, 95% CI) | Totals not selected | |
| 9.1 Longer vs shorter course prednisolone | 1 | Odds Ratio (M‐H, Random, 95% CI) | 0.0 [0.0, 0.0] | |
| Outcome or subgroup title | No. of studies | No. of participants | Statistical method | Effect size |
| 1 Re‐admission during follow‐up period Show forest plot | 1 | Odds Ratio (M‐H, Random, 95% CI) | Totals not selected | |
| 2 Asthma symptoms: returned to normal activities within 3 days Show forest plot | 1 | 191 | Odds Ratio (M‐H, Random, 95% CI) | 0.44 [0.19, 1.01] |
| 3 New exacerbation during follow‐up period: any ED visit after discharge Show forest plot | 1 | Odds Ratio (M‐H, Random, 95% CI) | Totals not selected | |
| 4 New exacerbation during follow‐up period: unscheduled visit to primary healthcare provider Show forest plot | 1 | Odds Ratio (M‐H, Random, 95% CI) | Totals not selected | |
| Outcome or subgroup title | No. of studies | No. of participants | Statistical method | Effect size |
| 1 Admission at initial presentation Show forest plot | 1 | Odds Ratio (M‐H, Random, 95% CI) | Totals not selected | |
| 1.1 Longer vs shorter course dexamethasone | 1 | Odds Ratio (M‐H, Random, 95% CI) | 0.0 [0.0, 0.0] | |
| 2 Re‐admission during follow‐up period Show forest plot | 5 | Odds Ratio (M‐H, Random, 95% CI) | Totals not selected | |
| 2.1 Higher‐dose vs lower‐dose prednisolone | 3 | Odds Ratio (M‐H, Random, 95% CI) | 0.0 [0.0, 0.0] | |
| 2.2 Longer vs shorter course prednisolone | 1 | Odds Ratio (M‐H, Random, 95% CI) | 0.0 [0.0, 0.0] | |
| 2.3 Longer vs shorter course dexamethasone | 1 | Odds Ratio (M‐H, Random, 95% CI) | 0.0 [0.0, 0.0] | |
| 3 Asthma symptoms: clinical asthma score at discharge Show forest plot | 1 | Mean Difference (IV, Random, 95% CI) | Totals not selected | |
| 3.1 High vs medium dose | 1 | Mean Difference (IV, Random, 95% CI) | 0.0 [0.0, 0.0] | |
| 3.2 High vs low dose | 1 | Mean Difference (IV, Random, 95% CI) | 0.0 [0.0, 0.0] | |
| 3.3 Medium vs low dose | 1 | Mean Difference (IV, Random, 95% CI) | 0.0 [0.0, 0.0] | |
| 4 Asthma symptoms: symptom free by 7 days Show forest plot | 1 | 201 | Odds Ratio (M‐H, Random, 95% CI) | 1.22 [0.67, 2.19] |
| 4.1 Longer vs shorter course prednisolone | 1 | 201 | Odds Ratio (M‐H, Random, 95% CI) | 1.22 [0.67, 2.19] |
| 5 Serious adverse events Show forest plot | 1 | 201 | Odds Ratio (M‐H, Random, 95% CI) | 0.0 [0.0, 0.0] |
| 5.1 Longer vs shorter course prednisolone | 1 | 201 | Odds Ratio (M‐H, Random, 95% CI) | 0.0 [0.0, 0.0] |
| 6 New exacerbation during follow‐up period: oral corticosteroids prescribed Show forest plot | 4 | Odds Ratio (M‐H, Random, 95% CI) | Subtotals only | |
| 6.1 Higher‐dose vs lower‐dose prednisolone | 2 | 231 | Odds Ratio (M‐H, Random, 95% CI) | 1.38 [0.25, 7.47] |
| 6.2 Longer vs shorter course prednisolone | 1 | 201 | Odds Ratio (M‐H, Random, 95% CI) | 0.61 [0.19, 1.94] |
| 6.3 Longer vs shorter course dexamethasone | 1 | 100 | Odds Ratio (M‐H, Random, 95% CI) | 0.24 [0.05, 1.19] |
| 7 New exacerbation during follow‐up period: unscheduled visit to healthcare provider Show forest plot | 1 | Odds Ratio (M‐H, Random, 95% CI) | Totals not selected | |
| 7.1 Longer vs shorter course dexamethasone | 1 | Odds Ratio (M‐H, Random, 95% CI) | 0.0 [0.0, 0.0] | |
| 8 Lung function tests: FEV1% predicted at discharge Show forest plot | 1 | Mean Difference (IV, Random, 95% CI) | Totals not selected | |
| 8.1 High vs medium dose | 1 | Mean Difference (IV, Random, 95% CI) | 0.0 [0.0, 0.0] | |
| 8.2 High vs low dose | 1 | Mean Difference (IV, Random, 95% CI) | 0.0 [0.0, 0.0] | |
| 8.3 Medium vs low dose | 1 | Mean Difference (IV, Random, 95% CI) | 0.0 [0.0, 0.0] | |
| 9 Lung function tests: PEFR% predicted at discharge Show forest plot | 1 | Mean Difference (IV, Random, 95% CI) | Totals not selected | |
| 9.1 High vs medium dose | 1 | Mean Difference (IV, Random, 95% CI) | 0.0 [0.0, 0.0] | |
| 9.2 High vs low dose | 1 | Mean Difference (IV, Random, 95% CI) | 0.0 [0.0, 0.0] | |
| 9.3 Medium vs low dose | 1 | Mean Difference (IV, Random, 95% CI) | 0.0 [0.0, 0.0] | |
| 10 All adverse events: longer vs short course prednisolone Show forest plot | 1 | 201 | Odds Ratio (M‐H, Random, 95% CI) | 0.67 [0.11, 4.08] |
| 11 All adverse events: higher‐dose vs lower‐dose prednisolone Show forest plot | 3 | Odds Ratio (M‐H, Random, 95% CI) | Subtotals only | |
| 11.1 Facial fullness | 2 | 231 | Odds Ratio (M‐H, Random, 95% CI) | 1.28 [0.58, 2.80] |
| 11.2 Facial erythema | 2 | 231 | Odds Ratio (M‐H, Random, 95% CI) | 0.83 [0.33, 2.06] |
| 11.3 Change in appetite | 2 | 231 | Odds Ratio (M‐H, Random, 95% CI) | 0.92 [0.49, 1.72] |
| 11.4 Abdominal pain | 2 | 231 | Odds Ratio (M‐H, Random, 95% CI) | 1.36 [0.57, 3.25] |
| 11.5 Diarrhoea | 2 | 231 | Odds Ratio (M‐H, Random, 95% CI) | 2.43 [0.43, 13.84] |
| 11.6 Anxiety | 2 | 231 | Odds Ratio (M‐H, Random, 95% CI) | 1.75 [0.20, 15.49] |
| 11.7 Euphoria | 2 | 231 | Odds Ratio (M‐H, Random, 95% CI) | 0.79 [0.30, 2.10] |
| 11.8 Depression | 2 | 232 | Odds Ratio (M‐H, Random, 95% CI) | 0.54 [0.16, 1.79] |
| 11.9 Quiet and reserved | 2 | 231 | Odds Ratio (M‐H, Random, 95% CI) | 1.73 [0.69, 4.36] |
| 11.10 Hyperactive | 3 | 318 | Odds Ratio (M‐H, Random, 95% CI) | 0.89 [0.31, 2.52] |
| 11.11 Aggressive behaviour | 2 | 231 | Odds Ratio (M‐H, Random, 95% CI) | 2.06 [0.02, 267.49] |
| Outcome or subgroup title | No. of studies | No. of participants | Statistical method | Effect size |
| 1 Admission at initial presentation Show forest plot | 3 | 1007 | Odds Ratio (M‐H, Random, 95% CI) | 1.08 [0.74, 1.58] |
| 2 Re‐admission during follow‐up period Show forest plot | 3 | 985 | Odds Ratio (M‐H, Random, 95% CI) | 0.44 [0.15, 1.33] |
| 3 Asthma symptoms: PIS Show forest plot | 1 | 110 | Mean Difference (IV, Random, 95% CI) | ‐0.10 [‐0.45, 0.25] |
| 4 Asthma symptoms: PSAS Show forest plot | 1 | 110 | Mean Difference (IV, Random, 95% CI) | 0.01 [‐0.67, 0.69] |
| 5 Asthma symptoms: PRAM Show forest plot | 1 | 218 | Mean Difference (IV, Random, 95% CI) | 0.0 [‐0.36, 0.36] |
| 6 Asthma symptoms Show forest plot | 1 | Odds Ratio (M‐H, Random, 95% CI) | Totals not selected | |
| 6.1 Persistent cough | 1 | Odds Ratio (M‐H, Random, 95% CI) | 0.0 [0.0, 0.0] | |
| 6.2 Wheeze | 1 | Odds Ratio (M‐H, Random, 95% CI) | 0.0 [0.0, 0.0] | |
| 6.3 Tightness of chest | 1 | Odds Ratio (M‐H, Random, 95% CI) | 0.0 [0.0, 0.0] | |
| 6.4 Night wakening | 1 | Odds Ratio (M‐H, Random, 95% CI) | 0.0 [0.0, 0.0] | |
| 6.5 Difficulty maintaining normal activities | 1 | Odds Ratio (M‐H, Random, 95% CI) | 0.0 [0.0, 0.0] | |
| 7 Serious adverse events Show forest plot | 2 | 255 | Odds Ratio (M‐H, Random, 95% CI) | 0.0 [0.0, 0.0] |
| 8 New exacerbation during follow‐up period: unscheduled visit to healthcare provider Show forest plot | 4 | 981 | Odds Ratio (M‐H, Random, 95% CI) | 0.85 [0.54, 1.34] |
| 9 New exacerbation during follow‐up period: oral corticosteroids prescribed Show forest plot | 1 | 242 | Odds Ratio (M‐H, Random, 95% CI) | 0.29 [0.10, 0.81] |
| 10 Adverse event: vomiting Show forest plot | 3 | 867 | Odds Ratio (M‐H, Random, 95% CI) | 3.05 [0.88, 10.55] |