| Limited upper hemi‐sternotomy versus full median sternotomy for aortic valve replacement |
| Patient or population: participants requiring aortic valve replacement
Setting: cardiac surgical centres
Intervention: limited sternotomy
Comparison: full sternotomy |
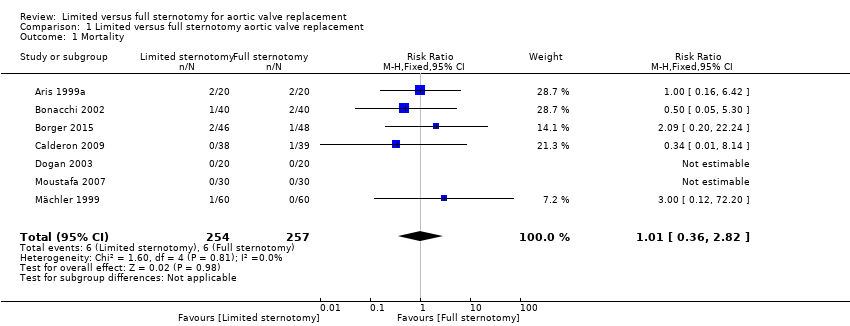
| Mortality Follow‐up: in‐patient stay | Study population | RR 1.01
(0.36 to 2.82) | 511
(7 RCTs) | ⊕⊕⊕⊝
Moderate1 | ‐ |
| 23 per 1000 | 24 per 1000
(8 to 66) |
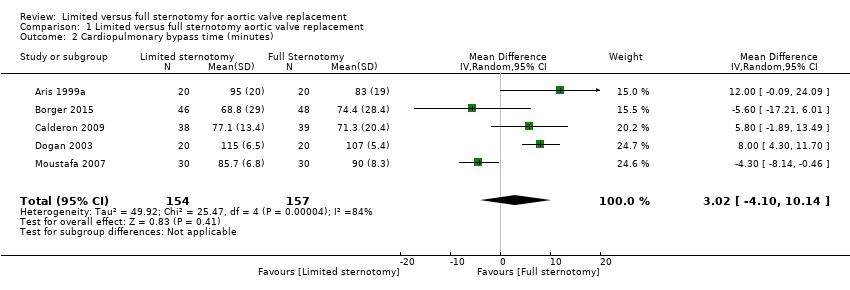
| Cardiopulmonary bypass time | The mean cardiopulmonary bypass time ranged from 71 to 107 minutes | The mean cardiopulmonary bypass time in the intervention group was 3.02 minutes more (4.1 fewer to 10.14 more) | ‐ | 311
(5 RCTs) | ⊕⊕⊝⊝
Low2,3 | Cardiopulmonary bypass times tend to have high variability between surgeons according to surgical technique. Differences of up to 15 minutes are unlikely to have clinical significance. |
| Aortic cross‐clamp time | The mean aortic cross‐clamp time ranged from 46 to 72 minutes | The mean aortic cross‐clamp time in the intervention group was 0.95 minutes more (3.45 fewer to 5.35 more) | ‐ | 391
(6 RCTs) | ⊕⊕⊝⊝
Low3,4 | Ischaemic times tend to have high variability between surgeons according to surgical technique. Differences of up to 10 minutes are unlikely to have clinical significance. |
| Length of hospital stay Follow‐up: in‐patient stay | The mean length of hospital stay ranged from 6.0 to 9.3 days | The mean length of hospital stay in the intervention group was 1.31 days lower (2.63 lower to 0.01 higher) | ‐ | 297
(5 RCTs) | ⊕⊝⊝⊝
Very low5,6,7 | Expediency of discharge is a quality marker in some healthcare systems, but not universally. |
| Postoperative blood loss Follow‐up: until removal of operative drains | The mean postoperative blood loss ranged from 280 mL to 590 mL | The mean postoperative blood loss in the intervention group was 158 mL lower (303 lower to 12 lower) | ‐ | 297
(5 RCTs) | ⊕⊕⊕⊝
Moderate8 | ‐ |
| Deep sternal wound infection Follow‐up: not specified | Study population | RR 0.71
(0.22 to 2.30) | 511
(7 RCTs) | ⊕⊕⊕⊝
Moderate1 | ‐ |
| 23 per 1000 | 17 per 1000
(5 to 54) |
| Pain scores Follow‐up: 12 hours | The mean pain scores ranged from 1.2 to 16 standard deviations | The mean pain scores in the intervention group was 0.3 standard deviations fewer (0.85 fewer to 0.2 more) | ‐ | 197
(3 RCTs) | ⊕⊝⊝⊝
Very low7,8,9 | The assessment of pain within and across studies was insufficiently standardised to make strong conclusions about effect on pain |
| Intensive care unit length of stay | The mean intensive care unit stay was 1.4 to 2.1 days | The mean intensive care unit stay in the intervention group was 0.57 days lower (0.93 lower to 0.2 lower) | ‐ | 297
(5 RCTs) | ⊕⊕⊝⊝
Low7,8 | ‐ |
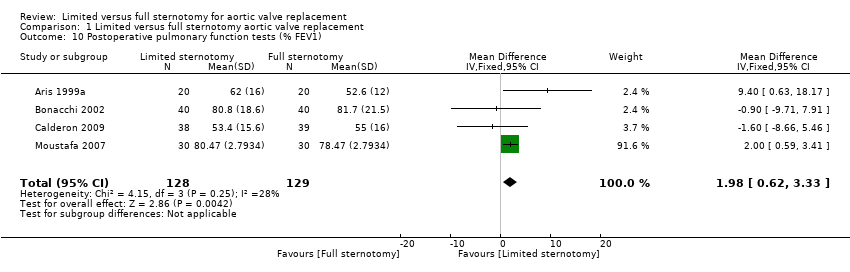
| Postoperative pulmonary function tests Follow‐up: 5 to 7 days | The mean pulmonary function tests ranged from 53% to 82% predicted FEV1 | The mean pulmonary function tests in the intervention group was 1.98% predicted FEV1 higher (0.62 higher to 3.33 higher) | ‐ | 257
(4 RCTs) | ⊕⊕⊝⊝
Low7,10 | ‐ |
| Re‐exploration Follow‐up: in‐patient stay | Study population | RR 1.01
(0.48 to 2.13) | 511
(7 RCTs) | ⊕⊕⊕⊝
Moderate1 | ‐ |
| 47 per 1000 | 47 per 1000
(22 to 99) |
| Postoperative atrial fibrillation Follow‐up: in‐patient stay | Study population | RR 0.60
(0.07 to 4.89) | 240
(3 RCTs) | ⊕⊕⊝⊝
Low8,11 | ‐ |
| 175 per 1000 | 105 per 1000
(12 to 856) |
| Postoperative ventilation time | The mean postoperative ventilation time ranged from 5.3 to 13.2 hours | The mean postoperative ventilation time in the intervention group was 1.12 hours lower (3.43 lower to 1.19 higher) | ‐ | 297
(6 RCTs) | ⊕⊝⊝⊝
Very low7,8,11 | ‐ |
| *The risk in the intervention group (and its 95% confidence interval) is based on the assumed risk in the comparison group and the relative effect of the intervention (and its 95% CI). CI: confidence interval; FEV1: forced expiratory volume in 1 second; RCT: randomised controlled trial; RR: risk ratio. |
| GRADE Working Group grades of evidence
High quality: We are very confident that the true effect lies close to that of the estimate of the effect.
Moderate quality: We are moderately confident in the effect estimate: The true effect is likely to be close to the estimate of the effect, but there is a possibility that it is substantially different.
Low quality: Our confidence in the effect estimate is limited: The true effect may be substantially different from the estimate of the effect.
Very low quality: We have very little confidence in the effect estimate: The true effect is likely to be substantially different from the estimate of effect. |