Esternotomía parcial versus total para el reemplazo de la válvula aórtica
Información
- DOI:
- https://doi.org/10.1002/14651858.CD011793.pub2Copiar DOI

- Base de datos:
-
- Cochrane Database of Systematic Reviews
- Versión publicada:
-
- 10 abril 2017see what's new
- Tipo:
-
- Intervention
- Etapa:
-
- Review
- Grupo Editorial Cochrane:
-
Grupo Cochrane de Corazón
- Copyright:
-
- Copyright © 2017 The Cochrane Collaboration. Published by John Wiley & Sons, Ltd.
Cifras del artículo
Altmetric:
Citado por:
Autores
Contributions of authors
BHK: guarantor of the review and conceived, designed, and co‐ordinated the review.
BHK, SGJ: data collection, including search strategy design, searching, screening, retrieval, appraisal, and data extraction.
BHK, SGJ: additional data from papers, unpublished data, and industry evidence.
DAC, RJNNW, SCM: review and arbitration of papers.
BHK: data entry.
All review authors: analysis and interpretation of data.
BHK, SGJ: writing the review.
DAC, RJNNW, SCM: expert advice on content of review.
Sources of support
Internal sources
-
Liverpool Heart and Chest Hospital, UK.
Financial support in retrieving relevant papers
External sources
-
No sources of support supplied
Declarations of interest
BHK: none known.
SGJ: none known.
SCM consults for Edwards Lifesciences, a manufacturer of equipment for minimal incision surgery. He is on the Advisory Board for Minimally Invasive Surgery, as well as being a member of the Speaker's Bureau. He is also an investigator on the PARTNER II trial, a prospective, multi‐centre, open‐label trial of people undergoing aortic valve surgery for severe aortic stenosis that includes transcatheter valve implantation strategies. As a result, he was not involved in screening of titles or abstracts, did not assess full‐texts or contribute to data‐abstraction (except for arbitration) and did not engage in assessing risk of bias or quality of evidence assessments.
DC: has a practice that includes minimally invasive aortic valve replacement.
RJNNW: has a practice that includes minimally invasive aortic valve replacement.
Acknowledgements
We are indebted to Nicole Martin and Cochrane Heart Group Information Specialist for her invaluable advice in formulating the search strategy and in providing timely and pragmatic advice on all aspects of the review process.
Version history
| Published | Title | Stage | Authors | Version |
| 2023 Dec 06 | Limited versus full sternotomy for aortic valve replacement | Review | Bilal H Kirmani, Sion G Jones, Andrew Muir, S. Chris Malaisrie, Darryl A Chung, Richard JNN Williams, Enoch Akowuah | |
| 2017 Apr 10 | Limited versus full sternotomy for aortic valve replacement | Review | Bilal H Kirmani, Sion G Jones, S C Malaisrie, Darryl A Chung, Richard JNN Williams | |
| 2015 Aug 04 | Limited versus full sternotomy for aortic valve replacement | Protocol | Bilal H Kirmani, Sion G Jones, Darryl A Chung, Richard JNN Williams, S Chris Malaisrie | |
Differences between protocol and review
'Summary of findings' table
We included all primary and secondary outcome measures in the 'Summary of findings' table, as these were all felt to be important patient‐related factors that should be included in the summary statement.
Additional unplanned outcome measures
We amended one of our secondary outcome measures from "Blood loss and transfusion requirements" to "Postoperative blood loss" as transfusion requirements were not stated. However, we identified three outcome measures of interest that were reported in several studies and which we proceeded to perform analysis on: intensive care unit stay, lung function tests, and re‐exploration for bleeding. Following review, we also added incidence of postoperative atrial fibrillation and ventilation time.
We renamed several outcome measures according to the wording most commonly used in the included studies, in order to bring our review in line with the accepted nomenclature. Although the clinical outcomes did not change, this allowed for a standardisation across our review. We changed all‐cause mortality to mortality; total hospital stay to length of hospital stay; sternal wound infection to deep sternal wound infection;intensive care unit length of stay to intensive care unit stay; and postoperative lung function tests to postoperative pulmonary function tests.
Sensitivity analyses
We had originally planned to include only studies with a low risk of bias as a sensitivity analysis, but no studies fulfilled this criterion. We therefore performed sensitivity analyses excluding studies at high risk of bias. We additionally identified a single study that employed rapid‐deployment aortic valves which could be a source of bias affecting intraoperative outcomes. Excluding this study was also performed as a separate sensitivity analysis for relevant outcomes.
Keywords
MeSH
Medical Subject Headings (MeSH) Keywords
- Aortic Valve [*surgery];
- Atrial Fibrillation [etiology];
- Blood Loss, Surgical [statistics & numerical data];
- Cardiopulmonary Bypass [statistics & numerical data];
- Heart Valve Diseases [*surgery];
- Heart Valve Prosthesis Implantation [adverse effects, *methods, mortality];
- Length of Stay;
- Operative Time;
- Pain Measurement;
- Postoperative Complications [epidemiology];
- Randomized Controlled Trials as Topic;
- Reoperation [statistics & numerical data];
- Sternotomy [adverse effects, *methods, mortality];
- Surgical Wound Infection [epidemiology];
Medical Subject Headings Check Words
Aged; Humans; Middle Aged;
PICO

Study flow diagram.
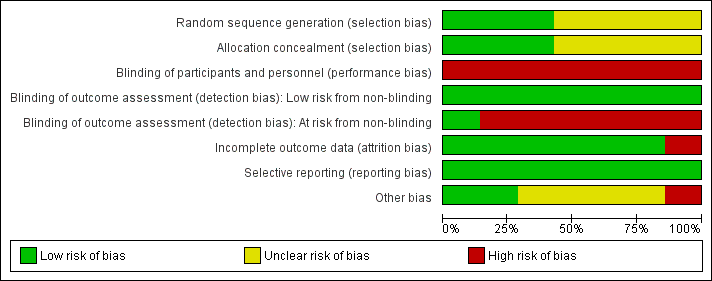
Risk of bias graph: review authors' judgements about each risk of bias item presented as percentages across all included studies.

Risk of bias summary: review authors' judgements about each risk of bias item for each included study.
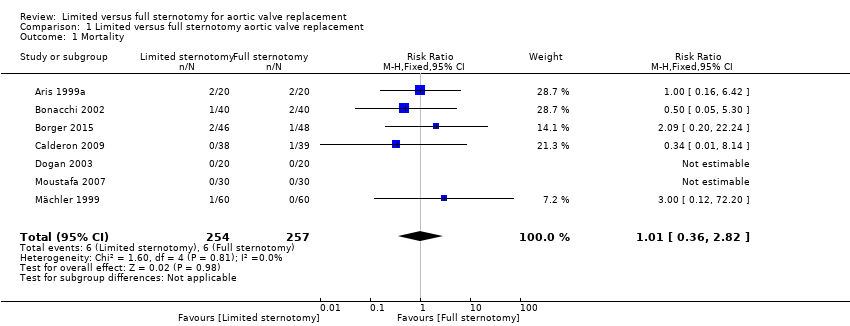
Comparison 1 Limited versus full sternotomy aortic valve replacement, Outcome 1 Mortality.
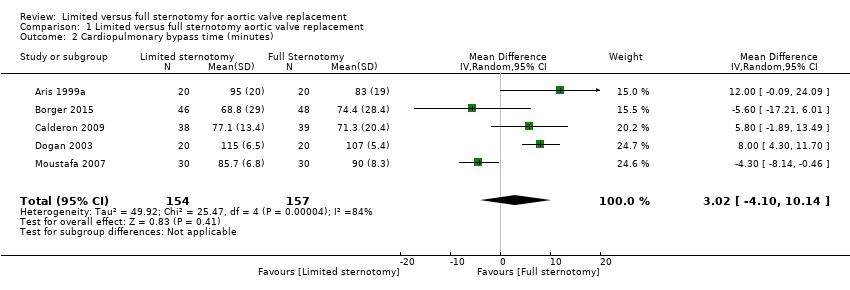
Comparison 1 Limited versus full sternotomy aortic valve replacement, Outcome 2 Cardiopulmonary bypass time (minutes).

Comparison 1 Limited versus full sternotomy aortic valve replacement, Outcome 3 Aortic cross‐clamp time (minutes).

Comparison 1 Limited versus full sternotomy aortic valve replacement, Outcome 4 Length of hospital stay (days).

Comparison 1 Limited versus full sternotomy aortic valve replacement, Outcome 5 Postoperative blood loss (mL).

Comparison 1 Limited versus full sternotomy aortic valve replacement, Outcome 6 Deep sternal wound infection.

Comparison 1 Limited versus full sternotomy aortic valve replacement, Outcome 7 Pain scores.

Comparison 1 Limited versus full sternotomy aortic valve replacement, Outcome 8 Quality of life.

Comparison 1 Limited versus full sternotomy aortic valve replacement, Outcome 9 Intensive care unit length of stay (days).
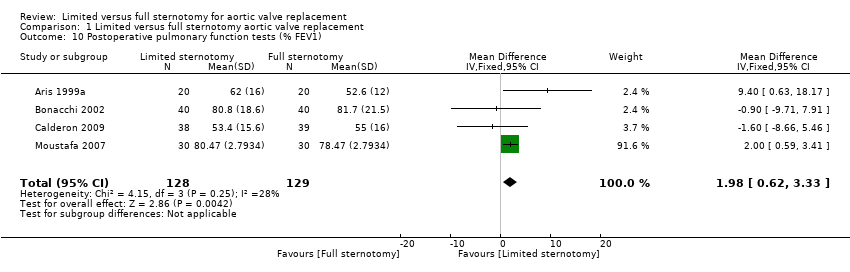
Comparison 1 Limited versus full sternotomy aortic valve replacement, Outcome 10 Postoperative pulmonary function tests (% FEV1).

Comparison 1 Limited versus full sternotomy aortic valve replacement, Outcome 11 Re‐exploration.

Comparison 1 Limited versus full sternotomy aortic valve replacement, Outcome 12 Postoperative atrial fibrillation.

Comparison 1 Limited versus full sternotomy aortic valve replacement, Outcome 13 Postoperative ventilation time (hours).
| Limited upper hemi‐sternotomy versus full median sternotomy for aortic valve replacement | ||||||
| Patient or population: participants requiring aortic valve replacement | ||||||
| Outcomes | Anticipated absolute effects* (95% CI) | Relative effect | No of participants | Quality of the evidence | Comments | |
| Risk with Full Sternotomy | Risk with Limited Sternotomy | |||||
| Mortality Follow‐up: in‐patient stay | Study population | RR 1.01 | 511 | ⊕⊕⊕⊝ | ‐ | |
| 23 per 1000 | 24 per 1000 | |||||
| Cardiopulmonary bypass time | The mean cardiopulmonary bypass time ranged from 71 to 107 minutes | The mean cardiopulmonary bypass time in the intervention group was 3.02 minutes more (4.1 fewer to 10.14 more) | ‐ | 311 | ⊕⊕⊝⊝ | Cardiopulmonary bypass times tend to have high variability between surgeons according to surgical technique. Differences of up to 15 minutes are unlikely to have clinical significance. |
| Aortic cross‐clamp time | The mean aortic cross‐clamp time ranged from 46 to 72 minutes | The mean aortic cross‐clamp time in the intervention group was 0.95 minutes more (3.45 fewer to 5.35 more) | ‐ | 391 | ⊕⊕⊝⊝ | Ischaemic times tend to have high variability between surgeons according to surgical technique. Differences of up to 10 minutes are unlikely to have clinical significance. |
| Length of hospital stay Follow‐up: in‐patient stay | The mean length of hospital stay ranged from 6.0 to 9.3 days | The mean length of hospital stay in the intervention group was 1.31 days lower (2.63 lower to 0.01 higher) | ‐ | 297 | ⊕⊝⊝⊝ | Expediency of discharge is a quality marker in some healthcare systems, but not universally. |
| Postoperative blood loss Follow‐up: until removal of operative drains | The mean postoperative blood loss ranged from 280 mL to 590 mL | The mean postoperative blood loss in the intervention group was 158 mL lower (303 lower to 12 lower) | ‐ | 297 | ⊕⊕⊕⊝ | ‐ |
| Deep sternal wound infection Follow‐up: not specified | Study population | RR 0.71 | 511 | ⊕⊕⊕⊝ | ‐ | |
| 23 per 1000 | 17 per 1000 | |||||
| Pain scores Follow‐up: 12 hours | The mean pain scores ranged from 1.2 to 16 standard deviations | The mean pain scores in the intervention group was 0.3 standard deviations fewer (0.85 fewer to 0.2 more) | ‐ | 197 | ⊕⊝⊝⊝ | The assessment of pain within and across studies was insufficiently standardised to make strong conclusions about effect on pain |
| Intensive care unit length of stay | The mean intensive care unit stay was 1.4 to 2.1 days | The mean intensive care unit stay in the intervention group was 0.57 days lower (0.93 lower to 0.2 lower) | ‐ | 297 | ⊕⊕⊝⊝ | ‐ |
| Postoperative pulmonary function tests Follow‐up: 5 to 7 days | The mean pulmonary function tests ranged from 53% to 82% predicted FEV1 | The mean pulmonary function tests in the intervention group was 1.98% predicted FEV1 higher (0.62 higher to 3.33 higher) | ‐ | 257 | ⊕⊕⊝⊝ | ‐ |
| Re‐exploration Follow‐up: in‐patient stay | Study population | RR 1.01 | 511 | ⊕⊕⊕⊝ | ‐ | |
| 47 per 1000 | 47 per 1000 | |||||
| Postoperative atrial fibrillation Follow‐up: in‐patient stay | Study population | RR 0.60 | 240 | ⊕⊕⊝⊝ | ‐ | |
| 175 per 1000 | 105 per 1000 | |||||
| Postoperative ventilation time | The mean postoperative ventilation time ranged from 5.3 to 13.2 hours | The mean postoperative ventilation time in the intervention group was 1.12 hours lower (3.43 lower to 1.19 higher) | ‐ | 297 | ⊕⊝⊝⊝ | ‐ |
| *The risk in the intervention group (and its 95% confidence interval) is based on the assumed risk in the comparison group and the relative effect of the intervention (and its 95% CI). CI: confidence interval; FEV1: forced expiratory volume in 1 second; RCT: randomised controlled trial; RR: risk ratio. | ||||||
| GRADE Working Group grades of evidence | ||||||
| 1 Downgraded for imprecision: sample size did not meet Optimal Information Size criteria and 95% confidence intervals overlapped no effect. Optimal Information Size estimated at 4600 (to determine 1% difference using α 0.05, β 0.20). Studies all had fewer than 100 participants. 2 Downgraded for imprecision: sample size did not meet Optimal Information Size criteria and 95% confidence intervals overlapped no effect. Optimal Information Size estimated at 120 (to determine 15‐minute difference using α 0.05, β 0.80). Studies all had fewer than 100 participants. 3 Downgraded for inconsistency: use of rapid deployment valves in one study and other variations in surgical technique lead to high heterogeneity. 4 Downgraded for imprecision: sample size did not meet Optimal Information Size criteria and 95% confidence intervals overlapped no effect. Optimal Information Size estimated at 100 (to determine 10‐minute difference in mortality using α 0.05, β 0.80). Studies all had fewer than 100 participants. 5 Downgraded for imprecision: sample size did not meet Optimal Information Size criteria and 95% confidence intervals overlapped no effect. Optimal Information Size estimated at 140 (to determine 1‐day difference using α 0.05, β 0.80). Studies all had fewer than 100 participants. 6 Downgraded for indirectness: length of stay is a surrogate marker of quality and national variations exist in discharge criteria. 7 Downgraded for high risk of bias: outcome measure sensitive to lack of blinding in study. 8 Downgraded for inconsistency: variations in surgical or anaesthetic technique lead to high heterogeneity. 9 Downgraded for indirectness: different measures of pain used across studies. 10 Downgraded for inconsistency: different timing of postsurgical lung function tests across studies lead to high heterogeneity. 11 Downgraded for imprecision: wide 95% confidence intervals overlapping no effect. | ||||||
| Outcome or subgroup title | No. of studies | No. of participants | Statistical method | Effect size |
| 1 Mortality Show forest plot | 7 | 511 | Risk Ratio (M‐H, Fixed, 95% CI) | 1.01 [0.36, 2.82] |
| 2 Cardiopulmonary bypass time (minutes) Show forest plot | 5 | 311 | Mean Difference (IV, Random, 95% CI) | 3.02 [‐4.10, 10.14] |
| 3 Aortic cross‐clamp time (minutes) Show forest plot | 6 | 391 | Mean Difference (IV, Random, 95% CI) | 0.95 [‐3.45, 5.35] |
| 4 Length of hospital stay (days) Show forest plot | 5 | 297 | Mean Difference (IV, Random, 95% CI) | ‐1.31 [‐2.63, 0.01] |
| 5 Postoperative blood loss (mL) Show forest plot | 5 | 297 | Mean Difference (IV, Random, 95% CI) | ‐158.00 [‐303.24, ‐12.76] |
| 6 Deep sternal wound infection Show forest plot | 7 | 511 | Risk Ratio (M‐H, Fixed, 95% CI) | 0.71 [0.22, 2.30] |
| 7 Pain scores Show forest plot | 3 | 197 | Std. Mean Difference (IV, Random, 95% CI) | ‐0.33 [‐0.85, 0.20] |
| 8 Quality of life Show forest plot | 1 | 100 | Mean Difference (IV, Fixed, 95% CI) | 0.0 [‐0.04, 0.04] |
| 9 Intensive care unit length of stay (days) Show forest plot | 5 | 297 | Mean Difference (IV, Random, 95% CI) | ‐0.57 [‐0.93, ‐0.20] |
| 10 Postoperative pulmonary function tests (% FEV1) Show forest plot | 4 | 257 | Mean Difference (IV, Fixed, 95% CI) | 1.98 [0.62, 3.33] |
| 11 Re‐exploration Show forest plot | 7 | 511 | Risk Ratio (M‐H, Fixed, 95% CI) | 1.01 [0.48, 2.13] |
| 12 Postoperative atrial fibrillation Show forest plot | 3 | 240 | Risk Ratio (M‐H, Random, 95% CI) | 0.60 [0.07, 4.89] |
| 13 Postoperative ventilation time (hours) Show forest plot | 5 | 297 | Mean Difference (IV, Random, 95% CI) | ‐1.12 [‐3.43, 1.19] |