Contenido relacionado
Revisiones y protocolos relacionados
Joanne Guay, Sandra Kopp | 25 noviembre 2020
Ki Jinn Chin, Javier E Cubillos, Husni Alakkad | 2 septiembre 2016
Erica J Weinstein, Jacob L Levene, Marc S Cohen, Doerthe A Andreae, Jerry Y Chao, Matthew Johnson, Charles B Hall, Michael H Andreae | 21 junio 2018
Thumwadee Tangsiriwatthana, Ussanee S Sangkomkamhang, Pisake Lumbiganon, Malinee Laopaiboon | 30 septiembre 2013
James K Jewer, Michael J Wong, Sally J Bird, Ashraf S Habib, Robin Parker, Ronald B George | 29 marzo 2019
Lars H Lundstrøm, Christophe HV Duez, Anders K Nørskov, Charlotte V Rosenstock, Jakob L Thomsen, Ann Merete Møller, Søren Strande, Jørn Wetterslev | 17 mayo 2017
Heinrich Rüschen, Kavitha Aravinth, Catey Bunce, Desta Bokre | 2 marzo 2018
Hameed Ullah, Khalid Samad, Fauzia A Khan | 4 febrero 2014
Thewarug Werawatganon, Somrat Charuluxananan | 28 marzo 2013
Stephanie Weibel, Yvonne Jelting, Nathan L Pace, Antonia Helf, Leopold HJ Eberhart, Klaus Hahnenkamp, Markus W Hollmann, Daniel M Poepping, Alexander Schnabel, Peter Kranke | 4 junio 2018
Respuestas clínicas Cochrane
Jane Burch, Sascha Köpke | 27 noviembre 2018
Jane Burch, Sascha Köpke | 4 junio 2018


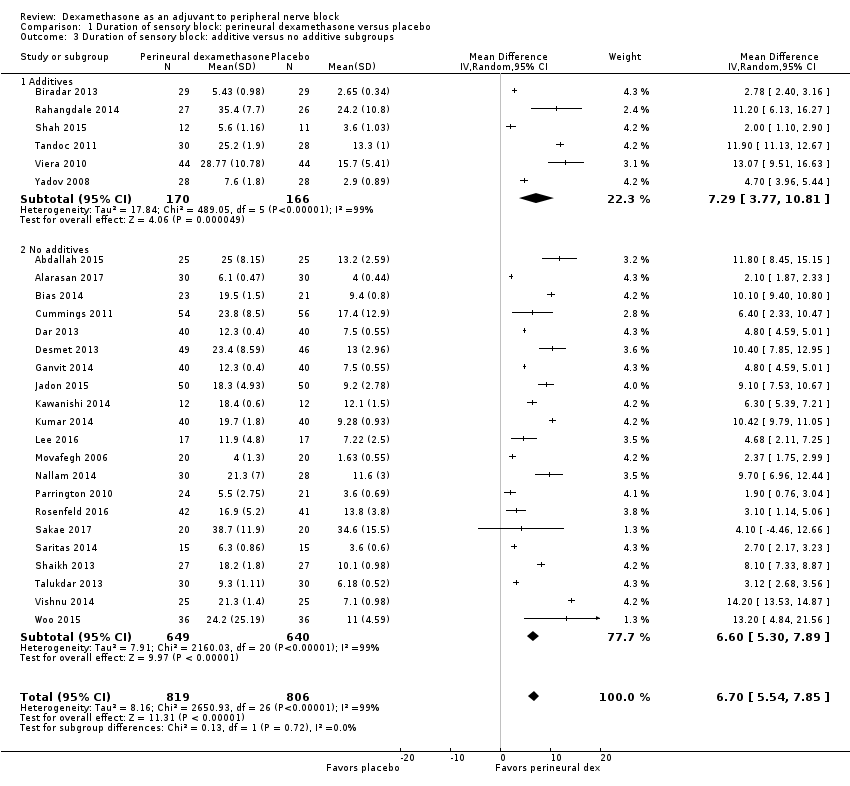
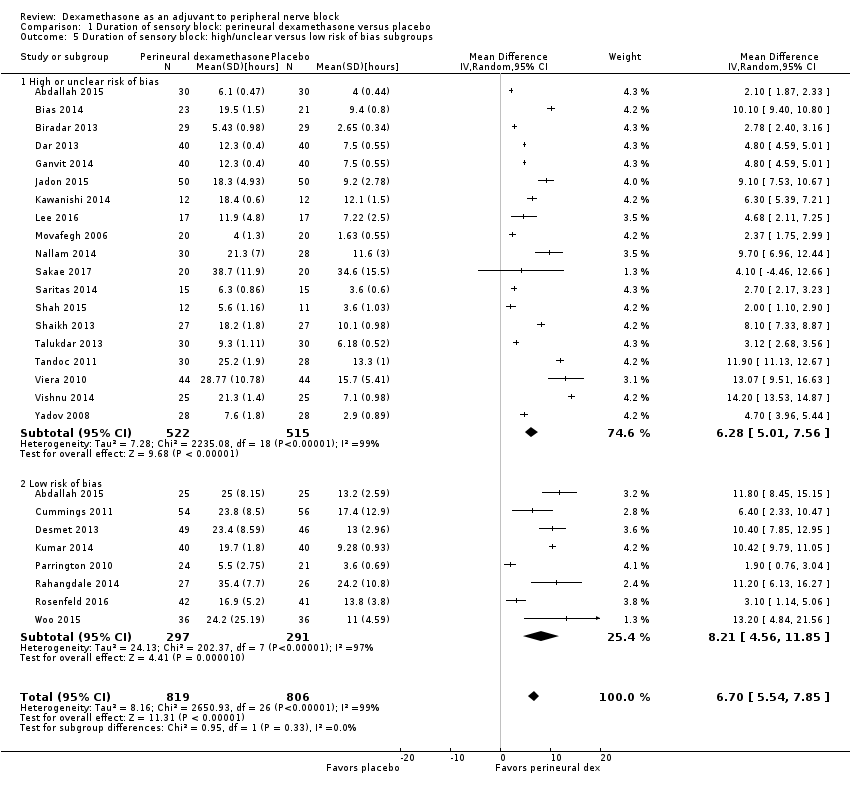
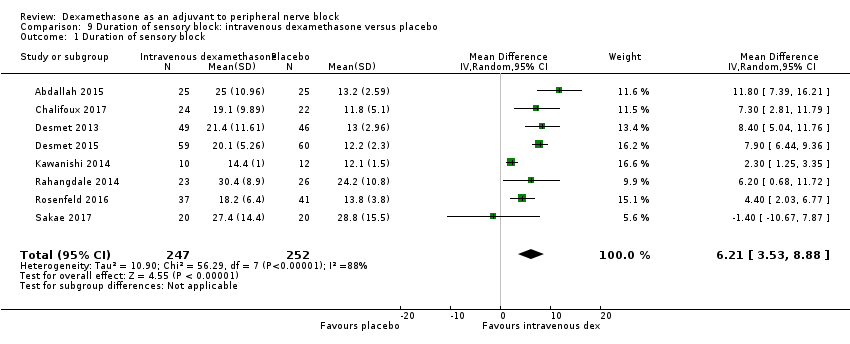
![Forest plot of comparison: 1 Duration of sensory block: perineural dexamethasone versus placebo, outcome: 1.1 Duration of sensory block [hours].](/es/cdsr/doi/10.1002/14651858.CD011770.pub2/media/CDSR/CD011770/image_n/nCD011770-AFig-FIG04.png)