Dexametasona como adyuvante del bloqueo nervioso periférico
Resumen
Antecedentes
El bloqueo nervioso periférico (infiltración de un anestésico local alrededor de un nervio) se utiliza para lograr la anestesia o la analgesia. Una limitación a su uso para la analgesia posoperatoria es que el efecto analgésico se prolonga sólo durante unas pocas horas, después de las cuales el dolor moderado a intenso en el sitio quirúrgico puede dar lugar a la necesidad de un tratamiento analgésico alternativo. Se han utilizado varios adyuvantes para prolongar la duración analgésica del bloqueo nervioso periférico, incluida la dexametasona perineural o intravenosa.
Objetivos
Evaluar la eficacia y la seguridad comparativas de la dexametasona perineural versus placebo, la dexametasona intravenosa versus placebo, y la dexametasona perineural versus dexametasona intravenosa cuando se la agrega al bloqueo nervioso periférico para el control del dolor posoperatorio en pacientes sometidos a cirugía.
Métodos de búsqueda
Se hicieron búsquedas en el Registro Cochrane Central de Ensayos Controlados (Cochrane Central Register of Controlled Trials), MEDLINE, Embase, DARE, Web of Science y Scopus, desde su inicio hasta el 25 abril 2017. También se hicieron búsquedas en bases de datos de registros de ensayos, en Google Scholar y en resúmenes de congresos de la American Society of Anesthesiologists, la Canadian Anesthesiologists' Society, la American Society of Regional Anesthesia y en la European Society of Regional Anaesthesia.
Criterios de selección
Se incluyeron todos los ensayos controlados aleatorios (ECA) que comparaban la dexametasona perineural con el placebo, la dexametasona intravenosa con placebo, o la dexametasona perineural con dexametasona intravenosa en participantes sometidos al bloqueo nervioso periférico para la cirugía del miembro superior o inferior.
Obtención y análisis de los datos
Se utilizaron los procedimientos metodológicos estándar previstos por la Colaboración Cochrane.
Resultados principales
Se incluyeron 35 ensayos con 2702 participantes de 15 a 78 años; 33 estudios incluyeron a participantes sometidos a la cirugía del miembro superior y dos a participantes sometidos a la cirugía del miembro inferior. El riesgo de sesgo fue bajo en 13 estudios y alto/poco claro en 22.
Dexametasona perineural versus placebo
La duración del bloqueo sensitivo fue significativamente más prolongada en el grupo de dexametasona perineural en comparación con placebo (diferencia de medias [DM] 6,70 horas, intervalo de confianza [IC] del 95%: 5,54 a 7,85; participantes 1625; estudios = 27). La intensidad del dolor posoperatorio a las 12 y 24 horas fue significativamente inferior en el grupo de dexametasona perineural en comparación con el control (DM ‐2,08; IC del 95%: ‐2,63 a ‐1,53; participantes 257; estudios = 5) y (DM ‐1,63; IC del 95%: ‐2,34 a ‐0,93; participantes 469; estudios = 9), respectivamente. No hubo ninguna diferencia significativa a las 48 horas (DM ‐0,61; IC del 95%: ‐1,24 a 0,03; participantes = 296; estudios = 4). La calidad de la evidencia es muy baja para la intensidad del dolor posoperatorio a las 12 horas y baja para los resultados restantes. El consumo posoperatorio acumulado de opiáceos a las 24 horas fue significativamente inferior en el grupo de dexametasona perineural en comparación con placebo (DM 19,25 mg, IC del 95%: 5,99 a 32,51; participantes = 380; estudios = 6).
Dexametasona intravenosa versus placebo
La duración del bloqueo sensitivo fue significativamente más prolongada en el grupo de dexametasona intravenosa en comparación con placebo (DM 6,21; IC del 95%: 3,53 a 8,88; participantes = 499; estudios = 8). La intensidad del dolor posoperatorio a las 12 y 24 horas fue significativamente inferior en el grupo de dexametasona intravenosa en comparación con el placebo (DM ‐1,24; IC del 95%: ‐2,44 a ‐0,04; participantes = 162; estudios = 3) y (DM ‐1,26; IC del 95%: ‐2,23 a ‐0,29; participantes = 257; estudios = 5), respectivamente. No hubo ninguna diferencia significativa a las 48 horas (DM ‐0,21; IC del 95%: ‐0,83 a 0,41; participantes = 172; estudios = 3). La calidad de la evidencia es moderada para la duración del bloqueo sensitivo y la intensidad del dolor posoperatorio a las 24 horas y baja para los resultados restantes. El consumo posoperatorio acumulado de opiáceos a las 24 horas fue significativamente inferior en el grupo de dexametasona intravenosa en comparación con placebo (DM ‐6,58 mg, IC del 95%: ‐10,56 a ‐2,60; participantes = 287; estudios = 5).
Dexametasona perineural versus intravenosa
La duración del bloqueo sensitivo fue significativamente más prolongada en el grupo de dexametasona perineural en comparación con la intravenosa a las tres horas (DM 3,14 horas; IC del 95%: 1,68 a 4,59; participantes = 720; estudios = 9). Se encontró que la intensidad del dolor posoperatorio a las 12 horas y 24 horas fue significativamente inferior en el grupo de dexametasona perineural en comparación con intravenosa, sin embargo, la DM no sobrepasó la diferencia mínimamente importante predeterminada de 1,2 en la Visual Analgue Scale/Numerical Rating Scale, por lo tanto los resultados no son clínicamente significativos (DM ‐1,01; IC del 95%: ‐1,51 a ‐0,50; participantes = 217; estudios = 3) y (DM ‐0,77; IC del 95%: ‐1,47 a ‐0,08; participantes = 309; estudios = 5), respectivamente. No hubo diferencias significativas en la gravedad del dolor posoperatorio a las 48 horas (DM 0,13; IC del 95%: ‐0,35 a 0,61; participantes = 227; estudios = 3). La calidad de la evidencia es moderada para la duración del bloqueo sensitivo y la intensidad del dolor posoperatorio a las 24 horas y baja para los resultados restantes. No hubo diferencias en el consumo acumulado posoperatorio de opiáceos a las 24 horas (DM ‐3,87 mg, IC del 95%: ‐9,93 a 2,19; participantes = 242; estudios = 4).
Incidencia de eventos adversos graves
Se informaron cinco eventos adversos graves. Ocurrió un evento relacionado con el bloqueo (neumotórax) en un participante de un ensayo que comparaba la dexametasona perineural con placebo; sin embargo no se informó la asignación grupal. Ocurrieron cuatro eventos no relacionados con el bloqueo en dos ensayos que comparaban la dexametasona perineural, la dexametasona intravenosa y el placebo. Dos participantes en el grupo de placebo requirieron hospitalización en el plazo de una semana luego de la cirugía; uno por una caída y uno por una infección intestinal. Un participante en el grupo de placebo desarrolló Síndrome de Dolor Regional Complejo Tipo I y uno en el grupo de dexametasona intravenosa contrajo neumonía. La calidad de la evidencia es muy baja debido al número escaso de eventos.
Conclusiones de los autores
La evidencia de calidad baja a moderada sugiere que cuando se utiliza como un adyuvante del bloqueo nervioso periférico en la cirugía del miembro superior, tanto la dexametasona perineural como intravenosa pueden prolongar la duración del bloqueo sensitivo y son efectivas para aliviar la intensidad del dolor posoperatorio y el consumo de opiáceos. No hay evidencia suficiente para determinar la efectividad de la dexametasona como un adyuvante del bloqueo nervioso periférico en las cirugías del miembro inferior y no hay evidencia en los niños. Los resultados de la revisión pueden no ser aplicables a los participantes en riesgo de eventos adversos relacionados con la dexametasona para los que los ensayos clínicos probablemente serían inseguros.
No hay evidencia suficiente para determinar la efectividad de la dexametasona como un adyuvante del bloqueo nervioso periférico en las cirugías del miembro inferior y no hay evidencia en los niños. Los resultados de la revisión pueden no ser aplicables a los participantes que están en riesgo de eventos adversos relacionados con la dexametasona para los que los ensayos clínicos probablemente serían inseguros. Los nueve ensayos en curso registrados en ClinicalTrials.gov pueden cambiar los resultados de esta revisión.
PICO
Resumen en términos sencillos
Dexametasona y bloqueo nervioso periférico
¿Qué es un bloqueo nervioso periférico?
Un bloqueo nervioso previene o alivia el dolor al interrumpir las señales de dolor que se desplazan a lo largo de un nervio hasta el cerebro. Incluye una inyección de anestésico local (un agente adormecedor) alrededor de un nervio durante o inmediatamente después de la cirugía. El alivio del dolor a partir del bloqueo nervioso puede prolongarse sólo durante unas pocas horas después de la cirugía, luego de la cual los pacientes pueden experimentar dolor moderado a intenso.
¿Qué es la dexametasona?
La dexametasona es un corticosteroide que puede aliviar el dolor y la respuesta inflamatoria al daño tisular después de la cirugía (calor, dolor, enrojecimiento y edema). En los pacientes sometidos al bloqueo nervioso, la dexametasona puede administrarse con el anestésico local alrededor del nervio (perineural) o en una vena (intravenoso) para prolongar el alivio del dolor a través del bloqueo nervioso periférico.
¿Qué examinaron los investigadores?
Se realizaron búsquedas de ensayos controlados aleatorios que investigaban si la dexametasona perineural o intravenosa prolonga el periodo durante el que los pacientes experimentan el alivio del dolor a través del bloqueo nervioso periférico al ser sometidos a una cirugía del miembro superior e inferior y si reduce la intensidad del dolor después de la cirugía. También se investigó si la dexametasona perineural o intravenosa causa algún efecto secundario o perjudicial. Se realizaron búsquedas en la bibliografía médica para obtener artículos que incluyeran a adultos o niños sometidos a cirugía del miembro superior o inferior con bloqueo nervioso periférico publicados hasta el 25 de abril 2017. También se evaluó la calidad de la evidencia para cada resultado.
¿Qué encontraron los investigadores?
Se incluyeron 35 estudios que incluían a 2702 participantes de 15 a 78 años de edad.
En comparación con placebo, la duración del bloqueo sensitivo fue prolongada en el grupo de dexametasona perineural durante seis horas y media (27 estudios, 1625 participantes, evidencia de baja calidad) y en el grupo de dexametasona intravenosa durante seis horas (ocho estudios, 499 participantes, evidencia de calidad moderada). Cuando se comparó dexametasona perineural e intravenosa, la duración del bloqueo sensitivo se prolongó durante tres horas más en el grupo de dexametasona perineural (nueve estudios, 720 participantes, evidencia de calidad moderada).
La intensidad del dolor posoperatorio a las 12 horas después de la cirugía fue inferior en el grupo de dexametasona perineural en comparación con placebo (5 estudios, 257 participantes, evidencia de muy baja calidad) y a las 24 horas después de la cirugía (nueve estudios, 469 participantes, evidencia de baja calidad). Cuando se comparó la dexametasona intravenosa con placebo, la intensidad del dolor posoperatorio también fue inferior en el grupo de dexametasona intravenosa que en el grupo de placebo a las 12 horas (3 estudios, 162 participantes, evidencia de baja calidad) y a las 24 horas (cinco estudios, 257 participantes, evidencia de baja calidad). La cantidad de medicación opiácea requerida para el dolor también fue inferior en los participantes que recibieron dexametasona perineural e intravenosa. No hubo diferencias en la intensidad del dolor posoperatorio ni en la cantidad de medicación opiácea requerida para el dolor al comparar dexametasona perineural e intravenosa. Se estableció la conclusión de que una forma de administrar la dexametasona no proporciona un mejor alivio del dolor que la otra.
Se informaron cinco eventos adversos graves en tres estudios. Ocurrió un evento adverso relacionado con el bloqueo (neumotórax o colapso pulmonar) en un participante de un ensayo que comparaba dexametasona perineural con placebo; sin embargo no se informó la asignación grupal. Los eventos restantes no estuvieron relacionados con el bloqueo y ocurrieron en dos ensayos que comparaban la dexametasona perineural, la dexametasona intravenosa y el placebo. Dos participantes del grupo de control requirieron hospitalización en el plazo de una semana luego de la cirugía; uno por una caída y uno por una infección intestinal. Un participante del grupo de placebo desarrolló un síndrome de dolor crónico llamado Síndrome de Dolor Regional Complejo, y un participante en el grupo de dexametasona intravenosa contrajo neumonía. La calidad de la evidencia en cuanto a los temas de seguridad fue muy baja.
Conclusiones de los autores
Summary of findings
| Patient or population: participants undergoing surgery with peripheral nerve block Intervention: perineural dexamethasone Comparison: placebo | ||||
| Outcomes | Anticipated absolute effects* (95% CI) | № of participants | Quality of the evidence | |
| Risk with placebo | Risk with perineural dexamethasone | |||
| Duration of sensory block (we included all studies describing duration of sensory block, regardless of how it was described) | The mean duration of sensory block was 10.2 hours | The mean duration of sensory block in the perineural dexamethasone group was 6.70 hours longer (5.54 longer to 7.85 longer) | 1625 | ⨁⨁◯◯ |
| Incidence of serious adverse events (we used the NIH definition of adverse events. A serious event includes death, a life‐threatening event that requires hospitalization or prolonged hospitalization, disability or congenital anomaly) | In seven studies, authors reported that they assessed for serious adverse events. Five serious adverse events were reported in three studies: one block‐related adverse event (pneumothorax) occurred in one participant in a trial comparing perineural dexamethasone and placebo; however, group allocation was not reported. The remaining non‐block‐related events occurred in two trials comparing perineural dexamethasone, intravenous dexamethasone and placebo. Two participants in the placebo group required hospitalization within one week of surgery; one for a fall, and one for a bowel infection. One participant in the placebo group developed Complex Regional Pain Syndrome Type I and one in the intravenous dexamethasone group developed pneumonia. | 620 (7 RCTs) | ⨁◯◯◯ LOWb | |
| Postoperative pain intensity at 12 hours (assessed by pain scores on an 11‐point VAS) | The mean postoperative pain intensity at 12 hours was 3.0 | The mean postoperative pain score at 12 hours in the perineural dexamethasone group was 2.08 points lower (1.52 lower to 2.63 lower) | 257 | ⨁◯◯◯ LOWc |
| Postoperative pain intensity at 24 hours. (assessed by pain scores on an 11‐point VAS) | The mean postoperative pain intensity at 24 hours was 3.9 | The mean postoperative pain score at 24 hours in the perineural dexamethasone group was 1.63 points lower (0.93 lower to 2.34 lower) | 469 | ⨁⨁◯◯ |
| Postoperative pain intensity at 48 hours (assessed by pain scores on an 11‐point VAS) | The mean postoperative pain intensity at 48 hours was 3.3 | The mean postoperative pain score at 48 hours in the perineural dexamethasone group was 0.61 points lower (1.24 lower to 0.03 higher) | 296 | ⨁⨁◯◯ |
| *The risk in the intervention group (and its 95% confidence interval) is based on the assumed risk in the comparison group and the relative effect of the intervention (and its 95% CI). | ||||
| GRADE Working Group grades of evidence | ||||
| aDowngraded by one level for risk of bias as 19 out of 27 studies are at unclear risk of bias. Reasons include lack of reporting on random sequence generation, concealment allocation, blinding, and attrition bias. Downgraded by one level for inconsistency (I2 = 99%, P value for heterogeneity is < 0.00001) and heterogeneity is not explained by subgroup analyses; point estimates vary widely among studies, confidence intervals show minimal overlap). bDowngraded by one level for risk of bias as four out of the seven studies are at unclear risk of bias. Reasons include lack of reporting on random sequence generation, concealment allocation, blinding, and evidence of selective reporting bias. Downgraded by two levels for imprecision due to very low number of events. c Downgraded by one level for risk of bias. Three out of five studies are at unclear risk of bias. Reasons include lack of reporting on random sequence generation and allocation concealment and evidence of attrition bias, selective reporting bias, and stopping early for benefit. Downgraded by one level for inconsistency (I2 = 61%, P value for heterogeneity is 0.03) and heterogeneity is not explained by subgroup analyses; point estimates vary widely among studies, confidence intervals show minimal overlap dDowngraded by one level for inconsistency (I2 = 80%, P value for heterogeneity is < 0.00001) and heterogeneity is not explained by subgroup analyses; point estimates vary widely across studies. Downgraded by one level for imprecision (95% confidence interval includes no clinical effect and a clinical effect). By no clinical effect we mean the lower bound of the CI did not surpass our chosen MID threshold of 1.2 on VAS. e Downgraded by two levels for imprecision because of a sparse number of participants (n=296) and a very wide confidence interval demonstrating that the treatment effect is not statistically significant and of questionable clinical significance. | ||||
| Patient or population: participants undergoing surgery with peripheral nerve block Intervention: intravenous dexamethasone Comparison: placebo | ||||
| Outcomes | Anticipated absolute effects* (95% CI) | № of participants | Quality of the evidence | |
| Risk with placebo | Risk with intravenous dexamethasone | |||
| Duration of sensory block (we included all studies describing duration of sensory block regardless of how it was described) | The mean duration of sensory block was 16.1 hours | The mean duration of sensory block in the intravenous dexamethasone group was 6.21 hours longer (3.53 longer to 8.88 longer) | 499 | ⨁⨁⨁◯ |
| Incidence of serious adverse events (we used the NIH definition of adverse events. A serious event includes death, a life‐threatening event that requires hospitalization or prolonged hospitalization, disability or congenital anomaly) | Please see incidence of serious adverse events in the perineural dexamethasone versus placebo 'Summary of findings' table. | |||
| Postoperative pain intensity at 12 hours (measured using pain scores on an 11‐point VAS) | The mean postoperative pain score at 12 hours was 2.6 | The mean postoperative pain score at 12 hours in the intravenous dexamethasone group was 1.24 points lower (2.44 lower to 0.04 lower) | 162 | ⨁⨁◯◯ |
| Postoperative pain intensity at 24 hours | The mean postoperative pain score at 24 hours was 4.4 | The mean postoperative pain score at 24 hours in the intravenous dexamethasone group was 1.26 points lower (2.23 lower to 0.29 lower) | 257 | ⨁⨁◯◯ |
| Postoperative pain intensity at 48 hours (measured using pain scores on an 11‐point VAS) | The mean postoperative pain score at 48 hours was 3.7 | The mean postoperative pain score at 48 hours in the intravenous dexamethasone group was 0.21 points lower (0.83 lower to 0.41 higher) | 172 | ⨁⨁◯◯ |
| *The risk in the intervention group (and its 95% confidence interval) is based on the assumed risk in the comparison group and the relative effect of the intervention (and its 95% CI). | ||||
| GRADE Working Group grades of evidence | ||||
| aDowngraded by one level for inconsistency (considerable heterogeneity (I2 = 88% and P value for heterogeneity <0.0001) and subgroup analyses did not explain observed heterogeneity. Downgraded by one level for imprecision because of a sparse number of participants (n=162). bDowngraded by one level for inconsistency (I2 = 61% and P value for heterogeneity 0.08) and subgroup analyses did not explain observed heterogeneity. Downgraded by one level for imprecision. Confidence interval includes both no clinical effect (minimally important difference 1.2 on VAS) and clinical effect (minimally important difference greater than 1.2 on VAS). cDowngraded by one level for inconsistency(I2 = 65% and P value for heterogeneity 0.02) and subgroup analyses did not explain observed heterogeneity. Point estimates vary widely across studies. Downgraded by one level for imprecision (95% confidence interval includes no clinical effect and a clinical effect). By no clinical effect we mean the lower bound of the CI did not surpass our chosen MID threshold of 1.2 on VAS. dDowngraded by two levels for precision (small sample size (n=172) and confidence interval crosses the line of null effect).. | ||||
| Patient or population: peripheral nerve block Setting: people undergoing upper or lower limb surgery with peripheral nerve block in hospitals in Australia, Belgium, Brazil, Canada and USA Intervention: perineural dexamethasone Comparison: intravenous dexamethasone | ||||
| Outcomes | Anticipated absolute effects* (95% CI) | № of participants | Quality of the evidence | |
| Risk with intravenous dexamethasone | Risk with perineural dexamethasone | |||
| Duration of sensory block (we included all studies describing duration of sensory block regardless of how it was described) | The mean duration of sensory block was 20.6 hours | The mean duration of sensory block in the perineural dexamethasone group was 3.13 hours longer (1.68 longer to 4.58 longer) | 720 | ⨁⨁⨁◯ |
| Incidence of serious adverse events (we used the NIH definition of adverse events. A serious event includes death, a life‐threatening event that requires hospitalization or prolonged hospitalization, disability or congenital anomaly) | Please see incidence of serious adverse events in the perineural dexamethasone versus placebo 'Summary of findings' table. | |||
| Postoperative pain intensity at 12 hours (measured using pain scores on an 11‐point VAS) | The mean postoperative pain score at 12 hours was 2.3 | The mean postoperative pain score at 12 hours in the perineural dexamethasone group was 1.01 points lower (0.50 lower to 1.51 lower) | 217 | ⨁⨁◯◯ |
| Postoperative pain intensity at 24 hours (measured using pain scores on an 11‐point VAS) | The mean postoperative pain score at 24 hours was 2.9 | The mean postoperative pain score at 24 hours in the perineural dexamethasone group was 0.77 points lower (0.08 lower to 1.47 lower) | 309 | ⨁⨁⨁◯ |
| Postoperative pain intensity at 48 hours (measured using pain scores on an 11‐point VAS) | The mean postoperative pain score at 48 hours was 2.8 | The mean postoperative pain score at 48 hours in the perineural dexamethasone group was 0.13 points higher (0.35 lower to 0.61 higher) | 227 | ⨁⨁◯◯ |
| *The risk in the intervention group (and its 95% confidence interval) is based on the assumed risk in the comparison group and the relative effect of the intervention (and its 95% CI). | ||||
| GRADE Working Group grades of evidence | ||||
| aDowngraded by one level for inconsistency (I2 = 67% and P value for heterogeneity is 0.001). bDowngraded by one level for risk of bias. Two out of the three studies are at unclear risk of bias. Reasons include unclear random sequence generation, unclear allocation concealment, and selective outcome reporting. Downgraded by one level for imprecision because of a sparse number of participants (n=217) and because the 95% confidence interval includes no clinical effect and a clinical effect. By no clinical effect we mean the lower bound of the CI did not surpass our chosen MID threshold of 1.2 on VAS. cDowngraded by one level for imprecision (95% confidence interval includes no clinical effect and a clinical effect). By no clinical effect we mean the lower bound of the CI did not surpass our chosen MID threshold of 1.2 on VAS. dDowngraded by one level for risk of bias. The one study that is at unclear risk of bias contributes half the data for this outcome. Downgraded by one level for imprecision because of a small sample size (n=227). | ||||
Antecedentes
Descripción de la afección
El bloqueo nervioso periférico es una técnica mediante la cual se infiltra solución anestésica local de forma perineural para proporcionar anestesia, o analgesia, o ambas. El bloqueo nervioso periférico para el tratamiento del dolor intraoperatorio y posoperatorio se asocia con una mejor analgesia, menos eventos adversos relacionados con los opiáceos, una ambulación anterior y una estancia hospitalaria más corta en comparación con la analgesia con opiáceos intravenosos solamente(Barreveld 2013; Charlton 2010; Lin 2013). Una limitación al uso del bloqueo nervioso periférico es que el efecto analgésico del bloqueo se prolonga sólo durante unas pocas horas, lo cual resulta en un dolor temprano moderado a intenso, y por lo tanto la necesidad de tratamientos adyuvantes (Choi 2014; Cummings 2011). Se han utilizado catéteres nerviosos periféricos que proporcionan una infusión continua del anestésico local para prolongar los efectos de la anestesia local; sin embargo, los catéteres continuos requieren un mayor tiempo y habilidad para la inserción que el bloqueo periférico de única infiltración, pueden desprenderse mientras se usan, pueden ser difíciles de extraer y pueden agregar costos adicionales a la asistencia sanitaria (Adhikary 2012; Bowens 2011; Choi 2014). Se han utilizado varios adyuvantes para intentar prolongar la analgesia proporcionada por el bloqueo nervioso periférico, incluida la dexametasona perineural e intravenosa(Brummett 2012; Choi 2014; Popping 2009).
Descripción de la intervención
La dexametasona es un fármaco corticosteroide que se ha utilizado como un adyuvante para aliviar el dolor posoperatorio. Dos revisiones sistemáticas han indicado que los participantes de los estudios que recibieron una dosis única de dexametasona intravenosa de forma perioperatoria presentaron puntuaciones inferiores de dolor y un consumo reducido de opiáceos después de la cirugía en comparación con los que recibieron placebo (De Oliveira 2011; Waldron 2013). De Olivera 2013 estudió tres dosis intravenosas diferentes: dosis baja (< 0,10 mg/kg), dosis intermedia (0,11 a 0,20 mg/kg) y dosis alta (≥ 0,21 mg/kg). La dexametasona en dosis baja no fue efectiva para reducir el dolor y el consumo de opiáceos; sin embargo, las dosis intermedias y altas fueron efectivas (De Olivera 2013). Waldron 2013 realizó un análisis de subgrupos de dos dosis de dexametasona: 4 mg a 5 mg; y 8 mg a 10 mg, y no encontró una relación de dosis‐respuesta.
Varios ensayos controlados aleatorios (ECA) han estudiado la administración de dexametasona perineural (es decir dexametasona agregada a la solución de anestesia local) como un adyuvante del bloqueo nervioso periférico para mejorar la analgesia proporcionada por el anestésico local solo (Bias 2014; Biradar 2013; Cummings 2011; Dar 2013; Golwala 2009; Movafegh 2006; Parrington 2010; Shaikh 2013; Tandoc 2011; Viera 2010; Yadov 2008). La dexametasona perineural, como un adyuvante del bloqueo nervioso periférico, se ha asociado con un inicio más rápido de la anestesia (Golwala 2009; Shrestha 2003; Talukdar 2013; Yadov 2008), una duración más larga de la anestesia/analgesia (Biradar 2013; Cummings 2011; Dar 2013; Golwala 2009Movafegh 2006; Parrington 2010; Shaikh 2013; Talukdar 2013; Tandoc 2011; Viera 2010; Vishnu 2014) una reducción en la intensidad del dolor posoperatorio (Cummings 2011; Dar 2013; Tandoc 2011; Yadov 2008), y una reducción en la necesidad de analgesia posoperatoria en comparación con el anestésico local solo(Shaikh 2013; Talukdar 2013; Tandoc 2011; Vishnu 2014; Yadov 2008).
Cinco revisiones sistemáticas han evaluado la eficacia de la dexametasona perineural versus placebo en participantes sometidos a cirugía con bloqueo nervioso periférico. El número de ensayos y participantes en cada ensayo es el siguiente: Albrecht 2015 ‐ 29 ensayos, 1695 participantes; Choi 2014 ‐ nueve ensayos, 809 participantes; De Oliveira 2014 ‐ nueve ensayos, 760 participantes; Huynh 2015 ‐ 12 ensayos, 512 participantes; y Knezivic 2015 ‐ 14 ensayos, 1022 participantes.
En las cinco revisiones, la administración de dexametasona perineural se asoció con una duración mayor del bloqueo sensitivo en comparación con placebo (Albrecht 2015; Choi 2014; De Oliveira 2014; Huynh 2015, Knezivic 2015). Ni la revisión de De Oliveira 2014 ni la revisión de Huynh 2015 encontraron una diferencia en la intensidad del dolor posoperatorio entre los participantes que recibieron dexametasona perineural en comparación con placebo. La revisión de Knezivic 2015 encontró que la intensidad del dolor a las 24 y 48 horas después de la cirugía fue inferior con dexametasona en comparación con el bloqueo solo. Las revisiones restantes no evaluaron la intensidad del dolor posoperatorio (Albrecht 2015; Choi 2014). El consumo de opiáceos se evaluó en tres de cinco revisiones. Las revisiones de De Oliveira 2014 y de Knezivic 2015 encontraron una reducción en el consumo de opiáceos entre los participantes que recibieron dexametasona perineural aunque la revisión Choi 2014 no. De igual manera, sólo dos revisiones evaluaron las náuseas y los vómitos posoperatorios, y ambas informaron una reducción de la incidencia de náuseas y vómitos posoperatorios entre los participantes que recibieron dexametasona perineural (Albrecht 2015; Huynh 2015). Ninguna de las revisiones comparó dexametasona perineural con dexametasona sistémica, ni dexametasona sistémica con placebo.
De qué manera podría funcionar la intervención
No se conoce el mecanismo exacto por el cual la dexametasona alivia el dolor. La disminución en la intensidad del dolor y la analgesia prolongada lograda con la administración de dexametasona perineural puede ser el resultado de una acción local, o sistémica, o ambas (Fredrickson 2013). La dexametasona puede actuar de forma local en los receptores de glucocorticosteroides para inducir la vasoconstricción, y de ese modo reducir la absorción sistémica de los anestésicos locales (Shishido 2002; Wang 2011). Otros posibles mecanismos de acción son la supresión de la transmisión de la fibra C de las señales de dolor y la acción directa en la célula nerviosa para reducir la descarga neural(Johansson 1990). La dexametasona puede actuar sistémicamente mediante la reducción de la respuesta inflamatoria causada por la lesión tisular quirúrgica(Christiansson 2009).
Por qué es importante realizar esta revisión
Es importante tratar el dolor posoperatorio de manera efectiva. Los pacientes que presentan dolor intenso a principios del período posoperatorio están en riesgo de desarrollar dolor crónico (Kehlet 2006; Vandenkerkoff 2012), el cual puede afectar notablemente la calidad de vida(Galvez 2007; Lame 2005; Smith 2007), y aumentar los costes de la asistencia sanitaria(Blyth 2003). En un intento por mejorar el tratamiento del dolor posoperatorio, los pacientes suelen ser tratados con opiáceos, que se asocian con eventos adversos como depresión respiratoria, náuseas, vómitos, estreñimiento y prurito. El tratamiento adecuado de los pacientes con dolor mediante el uso del bloqueo nervioso periférico puede dar lugar a una reducción en el uso de opiáceos y a menos efectos perjudiciales relacionados con los opiáceos (Avidan 2003; Hadzic 2005).
La administración de dexametasona perineural como un adyuvante del bloqueo nervioso periférico para el dolor posoperatorio es polémica. Los estudios en animales han indicado que la dexametasona perineural es neurotóxica para los nervios periféricos y puede causar daño nervioso periférico; sin embargo, los datos en humanos son limitados (Ma 2010). Aunque no se informó ningún síntoma de daño nervioso periférico en cuatro ECA que examinaron la dexametasona perineural versus intravenosa (Abdallah 2015; Desmet 2013; Kawanishi 2014; Rahangdale 2014), dichos estudios pueden haber tenido poco poder estadístico para detectar diferencias en los posibles eventos neurotóxicos (Williams 2014). Además, en la mayoría de los estudios, los participantes tuvieron un seguimiento durante períodos cortos (24 a 48 horas). Por lo tanto, pueden no haberse detectado eventos adversos como la parálisis nerviosa persistente causados por el daño nervioso periférico.
La dexametasona intravenosa puede usarse como una alternativa a la dexametasona perineural y como un adyuvante al bloqueo nervioso periférico. En cuatro ECA, se estudiaron los efectos de la dexametasona perineural e intravenosa en los participantes que recibieron el bloqueo nervioso periférico (Abdallah 2015; Desmet 2013; Kawanishi 2014; Rahangdale 2014). En tres de estos estudios, tanto la dexametasona perineural como intravenosa se asociaron con un bloqueo sensitivo prolongado en comparación con placebo (Abdallah 2015; Desmet 2013; Rahangdale 2014). En un estudio, la dexametasona perineural pero no la intravenosa se asoció con un bloqueo sensitivo prolongado en comparación con placebo(Kawanishi 2014). En los cuatro estudios, no se observó ninguna diferencia en la duración del bloqueo sensitivo cuando la dexametasona perineural e intravenosa se compararon entre sí.
La dexametasona intravenosa en dosis única se asocia con complicaciones como hiperglucemia, irritación perineal, infección posoperatoria y cicatrización retardada de la herida (Bartlett 2013; Crandell 2004; Pasternak 2004; Percival 2010; Perron 2003; Yared 2000). Los eventos adversos poco frecuentes incluyen síndrome de lisis tumoral y psicosis después de una dosis única y necrosis ósea avascular después del uso a corto plazo Fast 1984; (Lerza 2002; Mc Donnell 2008; McKee 2001)
Aunque cuatro revisiones sistemáticas han comparado la eficacia de la dexametasona perineural versus placebo(Albrecht 2015; Choi 2014; De Oliveira 2014; Huynh 2015), hasta la fecha, ninguna revisión integral ha comparado cada método de administración de dexametasona versus placebo, ni dexametasona perineural versus intravenosa.
Objetivos
Evaluar la eficacia y la seguridad comparativas de la dexametasona perineural versus placebo, la dexametasona intravenosa versus placebo, y la dexametasona perineural versus dexametasona intravenosa cuando se agrega al bloqueo nervioso periférico para el control del dolor posoperatorio en pacientes sometidos a cirugía.
Métodos
Criterios de inclusión de estudios para esta revisión
Tipos de estudios
Se incluyeron todos los ensayos controlados aleatorios (ECA) que evaluaban la efectividad de la dexametasona como un adyuvante del bloqueo nervioso periférico, de forma independiente del cegamiento y otras características de diseño (paralelo o factorial). No se excluyó ningún estudio en base al idioma o estado de publicación. Se excluyeron los estudios observacionales, los ensayos cuasialeatorios y los ensayos con asignados al azar por grupos.
Tipos de participantes
Se incluyó a niños (de un mes a 18 años de edad) y a adultos (a partir de los 19 años de edad) sometidos a cirugía del miembro superior e inferior que recibieron un bloqueo nervioso periférico o un bloqueo nervioso periférico con el agregado de dexametasona. Se excluyeron los neonatos.
Tipos de intervenciones
Los grupos de intervención incluyeron los siguientes:
-
Participantes que recibieron el bloqueo nervioso periférico y dexametasona perineural (dexametasona mezclada con la solución anestésica local) versus los que recibieron bloqueo nervioso periférico y un placebo perineural o un comparador no activo.
-
Participantes que recibieron el bloqueo nervioso periférico y dexametasona intravenosa versus los que recibieron bloqueo nervioso periférico y placebo intravenoso o un comparador no activo.
-
Participantes que recibieron el bloqueo nervioso periférico y dexametasona perineural versus los que recibieron bloqueo nervioso periférico y dexametasona intravenosa.
Se excluyó a los participantes que recibieron el anestésico local, o dexametasona, o ambos, a través de más de una vía (p.ej. de forma perineural y subcutánea).
Tipos de medida de resultado
Resultados primarios
-
Duración del bloqueo sensitivo. Se incluyeron todos los estudios que describían la duración de bloqueo sensitivo de forma independiente de cómo se describió.
-
Incidencia de eventos adversos graves. Se utilizó la definición de eventos adversos del National Institutes of Health (NIH). Un evento grave incluye la muerte, un evento potencialmente mortal que requiere hospitalización o la prolongación de la hospitalización, discapacidad o anomalías congénitas(NIH 2013).
Resultados secundarios
-
Duración del bloqueo motor. Se incluyeron todos los estudios que describían la duración del bloqueo motor, de forma independiente de cómo se describió.
-
Incidencia de eventos adversos leves a moderados como náuseas/vómitos, prurito, somnolencia, desaturación de oxígeno, retención urinaria, adormecimiento/cosquilleo.
-
Intensidad del dolor posoperatorio (puntuaciones del dolor) a las 12; 24 y 48 horas.
-
Consumo posoperatorio de opiáceos a las 12; 24 y 48 horas. Todos los opiáceos se convirtieron a equivalentes de morfina oral.
-
Satisfacción del participante con el control del dolor. La satisfacción del participante habitualmente se mide en una escala de calificación numérica (NRS).
Results
Description of studies
Results of the search
Please see the PRISMA flowchart for the selection process of the included studies (Figure 1):
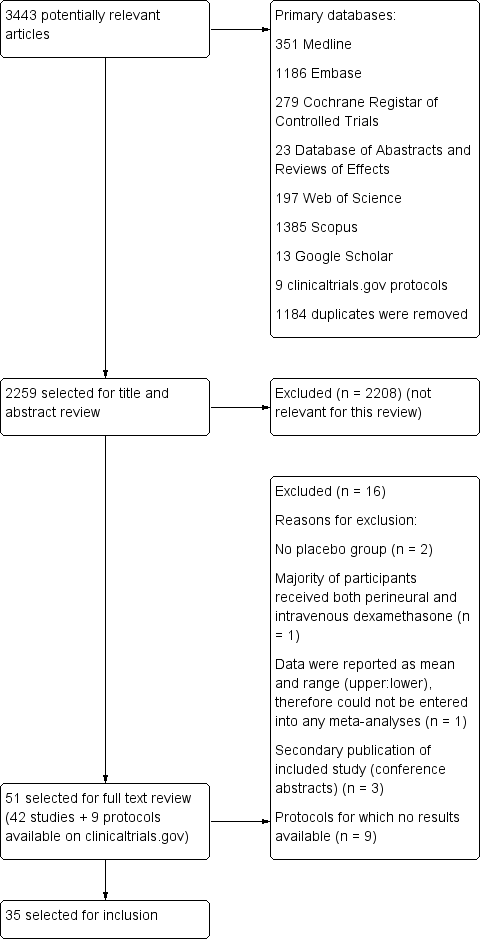
Flow diagram of included studies.
We identified 3443 unique records in our literature search. Of these, 51 were potentially eligible. Nine were protocols found on ClinicalTrials.gov for which no results were available (NCT01277159; NCT01495624; NCT01586806; NCT01971645; NCT02178449; NCT02322242; NCT02436694; NCT02462148; NCT02506660). We excluded seven studies: two because there was no placebo group (Fredrickson 2013; Shethra 2007); one because participants received both perineural and intravenous dexamethasone (Lui 2015): one because the authors reported only a means without any variances, therefore we could not enter the data into a meta‐analysis (Percec 2014); and three were secondary publications of included studies (Arora 2010; Desmet 2012; Kim 2010), leaving 35 for inclusion in the review.
Included studies
Participants
The 35 included trials involved 2702 participants. All studies were in Americal Anesthesiology Society (ASA) I to III adolescent and adult participants aged 15 to 78 years. We did not find any studies in children aged less than 15 years. Length of follow‐up ranged from one day to six months after surgery. Surgical procedures included the forearm and hand (not including the elbow) (Abdallah 2015; Aliste 2017; Alarasan 2017; Lee 2016; Leurcharusmee 2016; Movafegh 2006; Parrington 2010; Saritas 2014; Shah 2015; Yadov 2008), forearm and hand (including the elbow) (Biradar 2013; Shah 2015; Shaikh 2013), arthroscopic shoulder (Chalifoux 2017; Chun 2016; Desmet 2013; Jadon 2015; Kawanishi 2014; Kim 2012; Sakae 2017; Tandoc 2011; Viera 2010; Woo 2015), both arthroscopic and open shoulder (Cummings 2011; Nallam 2014; Rosenfeld 2016), upper limb (Bias 2014; Dar 2013; Ganvit 2014; Golwala 2009; Kumar 2014; Talukdar 2013; Vishnu 2014), rotator cuff repair or subacromial decompression (Desmet 2015), and foot and ankle (Dawson 2016; Rahangdale 2014).
Type of block included interscalene brachial plexus (Chun 2016; Chalifoux 2017; Cummings 2011; Desmet 2013; Desmet 2015; Ganvit 2014; Jadon 2015; Kawanishi 2014; Kim 2012; Nallam 2014; Tandoc 2011; Viera 2010; Woo 2015), supraclavicular brachial plexus (Abdallah 2015; Alarasan 2017; Bias 2014; Biradar 2013; Dar 2013; Golwala 2009; Kumar 2014; Parrington 2010; Shaikh 2013; Talukdar 2013; Vishnu 2014; Yadov 2008), axillary brachial plexus (Aliste 2017; Movafegh 2006; Rosenfeld 2016; Saritas 2014), infraclavicular brachial plexus (Leurcharusmee 2016; Sakae 2017; Shah 2015), sciatic nerve (Rahangdale 2014), and ankle block (Dawson 2016).
Exclusion criteria
Exclusion criteria were: pregnancy (Abdallah 2015; Biradar 2013; Chalifoux 2017; Cummings 2011; Desmet 2013; Desmet 2015; Ganvit 2014; Golwala 2009; Kawanishi 2014; Kim 2012; Kumar 2014; Movafegh 2006; Rahangdale 2014; Sakae 2017; Saritas 2014; Talukdar 2013; Viera 2010; Yadov 2008), neurological deficit or neuropathy (Aliste 2017; Biradar 2013; Chalifoux 2017; Chun 2016; Cummings 2011; Desmet 2013; Desmet 2015; Ganvit 2014; Kawanishi 2014; Kim 2012; Kumar 2014; Leurcharusmee 2016; Parrington 2010; Rahangdale 2014; Sakae 2017; Shah 2015; Talukdar 2013; Tandoc 2011; Vishnu 2014), peptic ulcer (Biradar 2013; Ganvit 2014; Golwala 2009; Kawanishi 2014; Kumar 2014; Movafegh 2006; Parrington 2010; Shah 2015; Shaikh 2013; Talukdar 2013; Woo 2015; Yadov 2008), diabetes mellitus (Abdallah 2015; Biradar 2013; Chun 2016; Desmet 2013; Desmet 2015; Ganvit 2014; Golwala 2009; Kawanishi 2014; Kim 2012; Lee 2016; Parrington 2010; Rahangdale 2014; Rosenfeld 2016; Shaikh 2013; Talukdar 2013; Vishnu 2014; Woo 2015), hypertension (Biradar 2013; Ganvit 2014; Tandoc 2011; Yadov 2008), endocrine disorder (Biradar 2013; Kumar 2014; Sakae 2017; Saritas 2014; Shah 2015), cardiac disease (Biradar 2013; Kumar 2014; Saritas 2014; Sakae 2017; Shah 2015; Yadov 2008), circulatory instability (Golwala 2009), hepatic or renal disease (Aliste 2017; Biradar 2013; Ganvit 2014; Golwala 2009; Kawanishi 2014; Kumar 2014; Lee 2016; Leurcharusmee 2016; Movafegh 2006; Sakae 2017; Saritas 2014: Shaikh 2013; Talukdar 2013), lung disease (Desmet 2013 , Desmet 2015; Kim 2012; Kumar 2014; Shah 2015; Tandoc 2011; Rosenfeld 2016; Woo 2015), respiratory disorder (Chun 2016; Yadov 2008), psychiatric history (Abdallah 2015, Kumar 2014; Shah 2015; Yadov 2008), clavicular fracture (Abdallah 2015), electrolyte imbalance, (Saritas 2014), head injury (Kumar 2014; Sakae 2017; Shah 2015), neuromuscular disease (Shaikh 2013; Yadov 2008), drug/alcohol dependency (Kawanishi 2014; Kim 2012; Kumar 2014; Talukdar 2013; Yadov 2008), pre‐existing chronic pain (Abdallah 2015; Chalifoux 2017; Kim 2012), preoperative opioid use (Biradar 2013; Chun 2016; Dawson 2016; Kawanishi 2014; Movafegh 2006; Sakae 2017; Rahangdale 2014; Rosenfeld 2016; Sakae 2017; Shah 2015; Woo 2015), preoperative corticosteroid use (Chalifoux 2017; Chun 2016; Cummings 2011; Dawson 2016; Desmet 2013; Desmet 2015; Golwala 2009; Kumar 2014; Rahangdale 2014; Sakae 2017; Talukdar 2013; Vishnu 2014; Woo 2015), contraindication to peripheral nerve block (skin infection, coagulopathy, bleeding diathesis, deformities in the operative site (Abdallah 2015; Aliste 2017; Bias 2014; Chalifoux 2017; Chun 2016; Cummings 2011; Dawson 2016; Jadon 2015; Kawanishi 2014; Kim 2012; Kumar 2014; Lee 2016; Leurcharusmee 2016; Sakae 2017; Shah 2015; Talukdar 2013; Tandoc 2011; Vishnu 2014; Woo 2015), allergy/hypersensitivity to any of the study drugs (Abdallah 2015; Bias 2014; Biradar 2013; Dawson 2016; Desmet 2013; Desmet 2015; Ganvit 2014; Golwala 2009; Jadon 2015; Kim 2012; Kumar 2014; Parrington 2010; Rahangdale 2014; Rosenfeld 2016; Shaikh 2013; Shah 2015; Shaikh 2013; Tandoc 2011; Viera 2010; Vishnu 2014; Woo 2015).
Settings
All trials took place between 2006 and 2017 in hospital settings in Australia (Dawson 2016), Bangledesh (Talukdar 2013), Belguim (Desmet 2013; Desmet 2015), Brazil (Sakae 2017), Canada (Abdallah 2015; Aliste 2017; Chalifoux 2017; Leurcharusmee 2016; Parrington 2010), India (Alarasan 2017; Bias 2014; Dar 2013; Ganvit 2014; Golwala 2009; Jadon 2015; Kumar 2014; Nallam 2014; Shah 2015; Shaikh 2013; Vishnu 2014), Iran (Movafegh 2006), Japan (Kawanishi 2014), Korea (Chun 2016; Kim 2012; Lee 2016; Woo 2015), Nepal (Yadov 2008), Thailand (Aliste 2017; Leurcharusmee 2016), Turkey (Saritas 2014), and USA (Cummings 2011; Rahangdale 2014; Rosenfeld 2016; Tandoc 2011; Viera 2010).
Interventions
Twenty‐three studies (1488 participants) compared perineural dexamethasone and placebo (Alarasan 2017; Bias 2014; Biradar 2013; Cummings 2011; Dar 2013; Ganvit 2014; Golwala 2009; Jadon 2015; Kim 2012; Kumar 2014; Lee 2016; Movafegh 2006; Nallam 2014; Parrington 2010; Saritas 2014; Shah 2015; Shaikh 2013; Talukdar 2013; Tandoc 2011; Viera 2010; Vishnu 2014; Woo 2015; Yadov 2008), two (n = 195) compared intravenous dexamethasone and control (Chalifoux 2017; Desmet 2015), four (n = 460) compared perineural and intravenous dexamethasone (Alarasan 2017; Chun 2016; Leurcharusmee 2016; Sakae 2017), and six (n = 564) compared perineural dexamethasone, intravenous dexamethasone and placebo (Abdallah 2015; Dawson 2016; Desmet 2013; Kawanishi 2014; Rahangdale 2014; Rosenfeld 2016).
Techniques used for block placement included nerve stimulation (Biradar 2013; Cummings 2011; Desmet 2013; Ganvit 2014; Jadon 2015; Kumar 2014; Movafegh 2006; Nallam 2014; Saritas 2014; Shah 2015; Shaikh 2013; Tandoc 2011; Viera 2010; Vishnu 2014; Yadov 2008), ultrasound guidance (Abdallah 2015; Alarasan 2017; Aliste 2017; Dawson 2016; Kawanishi 2014; Kim 2012; Leurcharusmee 2016; Parrington 2010; Rahangdale 2014; Rosenfeld 2016; Viera 2010; Woo 2015), both nerve stimulation and ultrasound guidance (Chalifoux 2017; Chun 2016; Desmet 2015; Lee 2016; Sakae 2017), landmark method (Bias 2014; Dar 2013; Golwala 2009), and paraesthesia technique (Talukdar 2013).
Local anaesthetics included ropivacaine 0.5% (Bias 2014; Chalifoux 2017; Chun 2016; Dar 2013; Dawson 2016; Desmet 2013; Desmet 2015; Jadon 2015; Kawanishi 2014; Kumar 2014; Lee 2016; Rosenfeld 2016; Sakae 2017; Woo 2015), bupivacaine 0.5% (Abdallah 2015; Alarasan 2017; Cummings 2011; Rahangdale 2014; Shaikh 2013; Talukdar 2013; Tandoc 2011; Viera 2010; Vishnu 2014), lidocaine 1.5% (Biradar 2013; Movafegh 2006; Shah 2015; Yadov 2008), levobupivacaine 0.5 % (Kim 2012; Nallam 2014), bupivacaine 0.5% and lidocaine 1.5% mixture (Aliste 2017; Ganvit 2014; Golwala 2009; Leurcharusmee 2016), mepivacaine (Parrington 2010), and prilocaine 2% (Saritas 2014).
Additives to local anaesthetic agent included epinephrine (Alarasan 2017; Biradar 2013; Ganvit 2014; Golwala 2009; Leurcharusmee 2016; Rahangdale 2014; Shaikh 2013; Tandoc 2011; Viera 2010; Yadov 2008), and clonidine (Viera 2010). No additives were used in the remaining studies.
Dexamethasone dose included 4 mg (Kawanishi 2014; Sakae 2017; Yadov 2008), 5 mg (Alarasan 2017; Chun 2016; Kim 2012), 7.5 mg (Woo 2015), 8 mg (Abdallah 2015; Aliste 2017; Bias 2014; Biradar 2013; Cummings 2011; Dar 2013; Dawson 2016; Ganvit 2014; Golwala 2009; Jadon 2015; Kumar 2014; Leurcharusmee 2016; Movafegh 2006; Nallam 2014; Parrington 2010; Rahangdale 2014; Rosenfeld 2016; Saritas 2014; Shah 2015; Shaikh 2013; Talukdar 2013; Tandoc 2011; Viera 2010; Vishnu 2014), and 10 mg (Chalifoux 2017; Desmet 2013; Desmet 2015; Lee 2016).
Comparators
In all included studies, participants received a peripheral nerve block with local anaesthesia. In studies comparing perineural dexamethasone and placebo, participants received either perineural dexamethasone or an equal volume of perineural saline. In studies comparing intravenous dexamethasone and placebo, participants received either intravenous dexamethasone or an equal volume of intravenous saline. In studies comparing perineural and intravenous dexamethasone, participants in the perineural dexamethasone group received dexamethasone perineurally and intravenous saline. Those in the intravenous dexamethasone group received dexamethasone intravenously and perineural saline.
Funding sources
Funding sources included: Merit Award form the Department of Anesthesia, Univerity of Toronto (Abdallah 2015), departmental sources (Alarasan 2017; Chalifoux 2017; Cummings 2011), Belgian Association for Regional Anesthesia (Desmet 2015), Department of Anesthesiology, Northwestern University (Rahangdale 2014), Buffalo Anesthesiology Associates (Tandoc 2011), and Department of Anesthesiology, Baystate Medical Center, Springfield, Massachutes (Viera 2010) (see Characteristics of included studies).
Contact with authors
We attempted to contact 15 authors for additional information (Abdallah 2015; Cummings 2011; Dar 2013; Desmet 2013; Desmet 2015; Jadon 2015; Kawanishi 2014; Kumar 2014; Parrington 2010; Rahangdale 2014; Rosenfeld 2016; Sakae 2017; Shah 2015; Viera 2010; Woo 2015), and were successful in obtaining data from seven (Abdallah 2015; Cummings 2011; Rahangdale 2014; Rosenfeld 2016; Sakae 2017; Shah 2015; Viera 2010).
Excluded studies
We excluded four studies from our review. Two lacked a placebo group (Fredrickson 2013; Shethra 2007), one reported data as median and range (minimum to maximum), therefore we could not enter the results in a meta‐analysis (Percec 2014), and in another, participants received both perineural and intravenous dexamethasone (Lui 2015) (see Characteristics of excluded studies).
Ongoing studies
We found nine ongoing trials at ClinicalTrials.gov (NCT01277159; NCT01495624; NCT01586806; NCT01971645; NCT02178449; NCT02322242; NCT02436694; NCT02462148; NCT02506660) (see Characteristics of ongoing studies).
Studies awaiting classification
There are no studies awaiting classification.
Risk of bias in included studies
The overall risk of bias was low in 13 studies (Abdallah 2015; Aliste 2017; Chalifoux 2017; Cummings 2011; Dawson 2016; Desmet 2013; Desmet 2015; Kumar 2014; Leurcharusmee 2016; Parrington 2010; Rahangdale 2014; Rosenfeld 2016; Woo 2015) and high/unclear in the remaining 22. Figure 2 shows authors' judgements about each risk of bias item presented as percentages across all included studies and Figure 3 shows review authors' judgements about each risk of bias item for each included study.
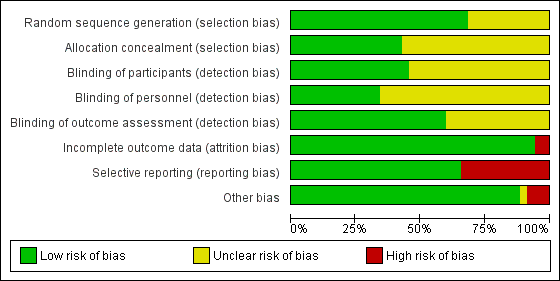
Risk of bias graph: review authors' judgements about each risk of bias item presented as percentages across all included studies.

Risk of bias summary: review authors' judgements about each risk of bias item for each included study.
Allocation
In 24 studies the method of random sequence generation was adequately described, and we judged the risk of bias to be low (Abdallah 2015; Aliste 2017; Biradar 2013; Chalifoux 2017; Chun 2016; Cummings 2011; Dawson 2016; Desmet 2013; Desmet 2015; Jadon 2015; Lee 2016; Leurcharusmee 2016; Movafegh 2006; Nallam 2014; Parrington 2010; Rahangdale 2014; Rosenfeld 2016; Saritas 2014; Shah 2015; Talukdar 2013; Tandoc 2011; Viera 2010; Vishnu 2014; Woo 2015). In the 11 remaining, we judged the risk of bias to be unclear because the random sequence was not described.
In 15 studies the method of allocation concealment was adequately described, and we judged the risk of bias to be low (Abdallah 2015; Aliste 2017; Chalifoux 2017; Cummings 2011; Dar 2013; Dawson 2016; Desmet 2013; Desmet 2015; Jadon 2015; Kawanishi 2014; Kumar 2014; Leurcharusmee 2016; Parrington 2010; Rahangdale 2014; Rosenfeld 2016). In the remaining 20 we judged the risk of bias to be unclear because the method of allocation concealment was not described.
Blinding
Blinding of participants was adequately described in 16 studies (Abdallah 2015; Aliste 2017; Biradar 2013; Chalifoux 2017; Chun 2016; Cummings 2011; Kumar 2014; Leurcharusmee 2016; Movafegh 2006; Parrington 2010; Rahangdale 2014; Rosenfeld 2016; Sakae 2017; Saritas 2014; Shaikh 2013; Vishnu 2014).
Blinding of personnel was adequately described in 12 studies (Abdallah 2015; Aliste 2017; Chalifoux 2017; Cummings 2011; Dawson 2016; Desmet 2015; Kumar 2014; Leurcharusmee 2016; Rahangdale 2014; Rosenfeld 2016; Sakae 2017; Woo 2015).
Bliding of outcome assessors was adequately described in 21 studies(Abdallah 2015; Aliste 2017; Biradar 2013; Chalifoux 2017; Chun 2016; Cummings 2011; Desmet 2013; Desmet 2015; Jadon 2015; Kim 2012; Kumar 2014; Leurcharusmee 2016; Movafegh 2006; Parrington 2010; Rahangdale 2014; Rosenfeld 2016; Sakae 2017; Saritas 2014; Shaikh 2013; Vishnu 2014; Woo 2015).
Incomplete outcome data
We judged the risk for attrition bias to be low in 33 studies. There were no missing outcome data in 16 (Abdallah 2015; Alarasan 2017; Bias 2014; Cummings 2011; Dar 2013; Dawson 2016; Kim 2012; Kumar 2014; Lee 2016; Sakae 2017; Saritas 2014; Talukdar 2013; Viera 2010; Vishnu 2014; Woo 2015; Yadov 2008), and in 17, the number of participants with missing outcome data was balanced between groups (Aliste 2017; Biradar 2013; Chalifoux 2017; Chun 2016; Desmet 2013; Desmet 2015; Ganvit 2014; Golwala 2009; Jadon 2015; Kawanishi 2014; Leurcharusmee 2016; Nallam 2014; Parrington 2010; Rahangdale 2014; Rosenfeld 2016; Shaikh 2013; Tandoc 2011). We judged two studies to be at high risk of attrition bias. In one, over 30% of participants in each group were excluded from the study (Movafegh 2006), and in the other, only 41 of 53 participants enrolled were included in the analysis (Shah 2015).
Selective reporting
We judged 23 studies to be at low risk of reporting bias. Protocols were available for eight and all prespecified outcomes were reported (Abdallah 2015; Aliste 2017; Cummings 2011; Leurcharusmee 2016; Parrington 2010; Rahangdale 2014; Rosenfeld 2016; Woo 2015). In the remaining 15, protocols were not available, but all outcomes prespecified in the methods section were reported (Alarasan 2017; Biradar 2013; Chalifoux 2017; Dar 2013; Dawson 2016; Desmet 2013; Desmet 2015; Ganvit 2014; Kumar 2014; Lee 2016; Movafegh 2006; Nallam 2014; Shah 2015; Tandoc 2011; Viera 2010). Twelve studies were at high risk of selective outcome bias. In two, protocols were available but not all outcomes were reported as per protocol (Chun 2016; Sakae 2017), and in 10, not all outcomes were reported as described in the methods section (Bias 2014; Golwala 2009; Jadon 2015; Kawanishi 2014; Kim 2012; Saritas 2014; Shaikh 2013; Talukdar 2013; Vishnu 2014; Yadov 2008).
Other potential sources of bias
There were other potential sources of bias in two studies. Both were stopped early for benefit (Cummings 2011; Shah 2015), which may be a source of bias.
Effects of interventions
See: Summary of findings for the main comparison Perineural dexamethasone versus placebo; Summary of findings 2 Intravenous dexamethasone versus placebo; Summary of findings 3 Perineural versus intravenous dexamethasone
See: summary of findings Table for the main comparison, summary of findings Table 2, summary of findings Table 3
Perineural dexamethasone verus placebo
Primary outcomes
1. Duration of sensory block
Duration of sensory block was defined inconsistently across studies. Definitions included the following.
The interval between administration of block and:
-
first report of pain (Abdallah 2015; Ganvit 2014; Movafegh 2006; Rahangdale 2014; Yadov 2008);
-
participant detected complete resolution of block (Dar 2013; Lee 2016; Sakae 2017; Saritas 2014; Viera 2010);
-
Visual Analogue Scale (VAS) greater than three (Alarasan 2017);
-
VAS greater than four (Vishnu 2014);
-
VAS three to six (Kumar 2014);
-
VAS eight to ten (Talukdar 2013);
-
first analgesia request or administration (Desmet 2013; Kawanishi 2014).
The interval between onset of sensory block and:
-
first administration of analgesia after discharge from the recovery room (Cummings 2011);
-
first report of pain (Bias 2014; Shah 2015; Shaikh 2013).
Duration of sensory block also included the interval between completion of surgery and numerical rating scale (NRS) greater than three (Nallam 2014), and the interval between hospital discharge until VAS greater than three (Tandoc 2011).
The duration of sensory block was significantly longer in the perineural dexamethasone group compared with placebo (MD 6.70 hours, 95% CI 5.54 to 7.85) (Abdallah 2015; Alarasan 2017; Bias 2014; Biradar 2013; Cummings 2011; Dar 2013; Desmet 2013; Ganvit 2014; Jadon 2015; Kawanishi 2014; Kumar 2014; Lee 2016; Movafegh 2006; Nallam 2014; Parrington 2010; Rahangdale 2014; Rosenfeld 2016; Sakae 2017; Saritas 2014; Shah 2015; Shaikh 2013; Talukdar 2013; Tandoc 2011; Viera 2010; Vishnu 2014; Woo 2015; Yadov 2008); (Figure 4), (Analysis 1.1).
![Forest plot of comparison: 1 Duration of sensory block: perineural dexamethasone versus placebo, outcome: 1.1 Duration of sensory block [hours].](/cdsr/doi/10.1002/14651858.CD011770.pub2/media/CDSR/CD011770/image_n/nCD011770-AFig-FIG04.png)
Forest plot of comparison: 1 Duration of sensory block: perineural dexamethasone versus placebo, outcome: 1.1 Duration of sensory block [hours].
Subgroup analysis
The duration of sensory block was significantly longer in the long‐ versus short‐acting local anaesthetic subgroup (P = 0.00) (Analysis 1.2), and in the high‐ versus low‐dose dexamethasone subgroup (P = 0.06) (Analysis 1.4). There was no significant difference between the remaining subgroups: additives versus no additives (P = 0.72) (Analysis 1.3); or high/unclear versus low risk of bias (P = 0.33) (Analysis 1.5).
Quality of evidence
We assessed the quality of evidence as low. We downgraded by one level for risk of bias because the majority of studies are at unclear risk of bias and by one level for inconsistency because of considerable heterogeneity (I2 = 99%, P < 0.00001); point estimates vary widely across studies and confidence intervals show minimal overlap. Our subgroup analyses did not explain the observed heterogeneity.
2. Incidence of serious adverse events
We used the National Institutes of Health (NIH) definition of adverse events. A serious event includes death, a life‐threatening event that requires hospitalization or prolonged hospitalization, or disability (NIH 2013). Seven studies reported that they assessed for serious adverse events (Desmet 2015; Jadon 2015; Kim 2012; Kumar 2014; Rosenfeld 2016; Shaikh 2013; Tandoc 2011). Five serious adverse events were reported among three trials (Desmet 2015; Rosenfeld 2016; Tandoc 2011). One block‐related event (pneumothorax) was reported in a study comparing perineural dexamethasone and placebo; however, the group allocation was not reported (Tandoc 2011). The four remaining events were non‐block‐related. In a study comparing intravenous dexamethasone and placebo, one participant in the placebo group developed Chronic Regional Pain syndrome Type I (Desmet 2015). In a study comparing perineural dexamethasone, intravenous dexamethasone and placebo, one participant in the placebo group developed pneumonia and two participants in the placebo group required hospitalization within one week of surgery; one for a bowel infection and one for a fall (Rosenfeld 2016).
Quality of evidence
We assessed the quality of evidence as very low. We downgraded by one level for risk of bias because over half the studies reporting serious adverse events are at unclear risk of bias, and by two levels for imprecision because of an extremely small number of events.
Secondary outcomes
1. Duration of motor block
Duration of motor block was defined inconsistently across studies. Definitions included the following.
The interval between completion of block and:
-
modified Brommage score of 0 (Vishnu 2014);
-
return to baseline motor strength in the operative limb (Abdallah 2015; Alarasan 2017; Viera 2010);
-
complete recovery of motor functions in all distributions (Biradar 2013; Dar 2013; Ganvit 2014; Movafegh 2006; Saritas 2014);
-
participant was able to lift operated limb (Kumar 2014; Nallam 2014; Tandoc 2011);
-
participant was able to move great toe (Rahangdale 2014).
The interval between onset of motor block and:
-
time finger movement was regained (Bias 2014);
-
complete recovery of motor functions in all distributions (Shah 2015; Shaikh 2013).
Duration of motor block also included the interval between successful block and recovery of all movements in the arm (Sakae 2017).
The duration of motor block was significantly longer in the perineural dexamethasone compared with control (MD 5.87 hours, 95% CI 4.44 to 7.30; participants = 912; studies = 16; I2 = 99) (Abdallah 2015; Bias 2014; Biradar 2013; Dar 2013; Ganvit 2014; Kumar 2014; Movafegh 2006; Nallam 2014; Rahangdale 2014; Sakae 2017; Saritas 2014; Shah 2015; Talukdar 2013; Tandoc 2011; Viera 2010; Vishnu 2014); (Analysis 2.1).
Subgroup analysis
The duration of motor block was significantly longer in the long‐acting local anaesthetic versus medium‐acting local anaesthesia subgroup (P = 0.00) (Analysis 2.2); however, there was no statistically significant difference between the remaining subgroups: additive versus no additive (P = 0.33) (Analysis 2.3), high‐ versus low‐dose dexamethasone and P = 0.22) (Analysis 2.4), and high/unclear versus low risk of bias (P = 0.41) (Analysis 2.5).
2. Incidence of mild to moderate adverse events such as nausea/vomiting, pruritus, somnolence, oxygen desaturation, urinary retention, numbness/tingling
Bock‐related adverse events
Ten studies reported that they assessed for block‐related adverse events (Abdallah 2015; Cummings 2011; Desmet 2013; Jadon 2015; Kawanishi 2014; Parrington 2010; Rahangdale 2014; Rosenfeld 2016; Shah 2015; Woo 2015). In one study, the authors reported that numbness/tingling had resolved in all participants at eight weeks after surgery (Rahangdale 2014). None of the other studies described whether block‐related complications had resolved. There was no significant difference between perineural dexamethasone and control in the incidence of overall adverse or each individual adverse event. Overall block‐related adverse events occurred in 97 out of 340 participants in the perineural dexamethasone group versus 81 out of 337 in the control group (risk ratio (RR) 1.17, 95% CI 0.99 to 1.39; participants = 677; studies = 10; I2 = 0%) (Analysis 3.1). The incidence of each event is as follows.
-
Numbness/tingling 14 days after surgery: 12 out of 160 in the perineural dexamethasone group versus seven out of 163 in the placebo group (RR 1.76, 95% CI 0.80 to 3.89; participants = 323; studies = 5; I2 = 0%); (Abdallah 2015; Cummings 2011; Parrington 2010; Rahangdale 2014; Woo 2015); (Analysis 3.2).
-
Residual motor block/muscle weakness 24 hours after surgery: five out of 130 in the perineural dexamethasone group versus one out of 129 in the placebo group (RR 4.69, 95% CI 0.57 to 38.68; participants = 259; studies = 3; I2 = 0%) (Cummings 2011; Desmet 2013; Rahangdale 2014); (Analysis 3.3).
-
Horner syndrome: 47 out of 162 in the perineural dexamethasone group versus 47 out of 159 in the placebo group (RR 0.99, 95% CI 0.73 to 1.36; participants = 321; studies = 4; I2 = 0%) (Desmet 2013; Jadon 2015; Shaikh 2013; Woo 2015); (Analysis 3.4).
-
Hoarseness: 16 out of 177 in the perineural dexamethasone versus 13 out of 176 in the placebo group (RR 1.23, 95% CI 0.65 to 2.34; participants = 353; studies = 4; I2 = 0%) (Desmet 2013; Jadon 2015; Shaikh 2013; Woo 2015); (Analysis 3.5).
-
Diaphragmatic paresis: 14 out of 86 in the perineural versus 9 out of 86 in the placebo group (RR 1.46, 95% CI 0.66 to 3.23; participants = 172; studies = 2; I2 = 1%) (Jadon 2015; Woo 2015); (Analysis 3.6).
-
Dyspnoea: zero out of 138 in the perineural dexamethasone group versus one out of 136 in the placebo group (RR 0.34, 95% CI 0.01 to 8.14; participants = 274; studies = 4; I2 = 100%) (Desmet 2013; Kawanishi 2014; Rosenfeld 2016; Woo 2015); (Analysis 3.7).
-
Vascular injury: two out of 50 in the perineural dexamethasone group versus one out of 50 in the placebo group (RR 2.00, 95% CI 0.19 to 21.36; participants = 100; studies = 1) (Jadon 2015); (Analysis 3.8).
-
Cranial nerve 12 palsy: zero out of 42 in the perineural dexamethasone group versus 1 out of 41 in the placebo group (RR 0.33, 95% CI 0.01 to 7.77; participants = 83; studies = 1) (Rosenfeld 2016); (Analysis 3.9)
-
Bruising at the injection site: one out of 18 in the perineural dexamethasone group versus one out of 19 in the placebo group (RR 1.06, 95% CI 0.07 to 15.64; participants = 37; studies = 1) (Parrington 2010); (Analysis 3.10).
Non‐block‐related adverse events
In 10 studies, non‐block‐related adverse events were assessed (Abdallah 2015; Dar 2013; Dawson 2016; Golwala 2009; Kawanishi 2014; Parrington 2010; Rosenfeld 2016; Talukdar 2013; Vishnu 2014; Woo 2015). There was no significant difference between perineural dexamethasone and placebo in the incidence overall or individual non‐block‐related events (Analysis 3.1). The overall incidence was 33 out of 313 in the perineural dexamethasone group versus 38 out of 312 in the placebo group (RR 0.76, 95% CI 0.35 to 1.68; participants = 625; studies = 10; I2 = 49%). The incidence of individual events is as follows:
-
Postoperative nausea and vomiting: 13 out of 293 in the perineural dexamethasone versus 26 out of 292 in the placebo group ((RR 0.55, 95% CI 0.26 to 1.14; participants = 585; studies = 10; I2 = 10%) (Abdallah 2015; Dar 2013; Dawson 2016; Golwala 2009; Kawanishi 2014; Kim 2012; Parrington 2010; Rosenfeld 2016; Vishnu 2014); (Analysis 3.12).
-
Deep sedation: three out of 30 in the perineural dexamethasone group versus zero out of 30 in the placebo group (RR 7.00, 95% CI 0.38 to 129.93; participants = 60; studies = 1) (Talukdar 2013); (Analysis 3.13).
-
Dermatological symptoms (pruritus/rash): three out of 42 in the perineural dexamethasone group versus one out of 41 in the placebo group (RR 2.93, 95% CI 0.32 to 27.02; participants = 83; studies = 1) (Rosenfeld 2016); (Analysis 3.14).
-
Syncope/fainting: two out of 42 in the perineural dexamethasone group versus one out of 41 in the placebo group (RR 1.95, 95% CI 0.18 to 20.71; participants = 83; studies = 1) (Rosenfeld 2016); (Analysis 3.15).
-
Bradycardia: two out of 30 in the perineural dexamethasone group versus three out of 30 in the placebo group; (RR 0.67, 95% CI 0.12 to 3.71; participants = 60; studies = 1; I2 = 0%); (Talukdar 2013); (Analysis 3.16).
-
Hypotension: four out of 70 in the perineural dexamethasone group versus six out of 70 in the control group; (RR 0.67, 95% CI 0.21 to 2.13; participants = 140; studies = 2; I2 = 0%); (Dar 2013; Talukdar 2013); Analysis 3.17
-
Each of the following outcomes occurred in one out of 42 in the perineural dexamethasone group versus zero out of 41 in the placebo group (RR 2.93, 95% CI 0.12 to 69.92; participants = 83; studies = 1): headache, 10‐pound fluid gain over 24 hours, diarrhoea, frequent urination, and muscle soreness (Rosenfeld 2016); (Analysis 3.18).
3a Postoperative pain intensity at 12 hours
Postoperative pain scores at 12 hours were significantly lower in the dexamethasone group compared with placebo (MD ‐2.08, 95% CI ‐2.63 to ‐1.52; participants = 257; studies = 5; I2 = 62%) (Kim 2012; Rosenfeld 2016; Sakae 2017; Shah 2015; Woo 2015); (Figure 5), (Analysis 4.1).

Forest plot of comparison: 4 Postoperative pain intensity at 12 hours: perineural dexamethasone versus placebo, outcome: 4.1 Postoperative pain intensity at12 hours.
Subgroup analysis
There was no significant difference in effect size between any of the subgroups: long‐ versus medium‐acting local anaesthetic (P = 0.13) (Analysis 4.2); additive versus no additive (P = 0.12) (Analysis 4.3); high‐ versus low‐dose dexamethasone (P = 0.79) (Analysis 4.4); or high/unclear versus low risk of bias (P = 0.28) (Analysis 4.5).
Quality of evidence
We assessed the quality of evidence as very low. We downgraded by one level for risk of bias because three out of five of the studies are at unclear risk of bias; we downgraded by one level for inconsistency because of substantial heterogeneity (I2 = 62%, P = 0.03). Our subgroup analyses did not explain observed heterogeneity. We also downgraded by one level for imprecision. For continuous outcomes, Cochrane guidelines suggest downgrading if fewer than 400 participants.
3b Postoperative pain intensity at 24 hours
Postoperative pain scores at 24 hours were significantly lower in the dexamethasone group compared with placebo (MD ‐1.63, 95% CI ‐2.34 to ‐0.93; participants = 469; studies = 9; I2 = 79%) (Abdallah 2015; Dawson 2016; Kim 2012; Parrington 2010; Rahangdale 2014; Rosenfeld 2016; Sakae 2017; Viera 2010; Woo 2015); (Figure 6), (Analysis 5.1).

Forest plot of comparison: 5 Postoperative pain intensity at 24 hours: perineural dexamethasone versus placebo, outcome: 5.1 Postoperative pain intensity at 24 hours.
Subgroup analysis
Three was no significant difference in effect size between any of the subgroups: long‐ versus medium‐acting local anaesthetic (P = 0.31) (Analysis 5.2); additive versus no additive (P = 0.37) (Analysis 5.3); high‐ versus low‐dose dexamethasone (P = 0.76) (Analysis 5.4); and high/unclear versus low risk of bias (P = 0.60) (Analysis 5.5).
Quality of evidence
We assessed the quality of evidence to be low. We downgraded by one level for inconsistency because of considerable heterogeneity (I2 = 80% and P < 0.00001) not explained by subgroup analyses and by one level for imprecision because the confidence interval includes both no clinical effect (minimally important difference (MID) less than 1.2) and clinical effect (MID greater than 1.2).
3c Postoperative pain intensity at 48 hours
There was no significant difference in postoperative pain scores at 48 hours between perineural dexamethasone and placebo (MD ‐0.61, 95% CI ‐1.24 to 0.03; participants = 296; studies = 4; I2 = 41%) (Rahangdale 2014; Rosenfeld 2016; Viera 2010; Woo 2015); (Analysis 6.1).
Subgroup analysis
There was no statistically significant difference in effect size between the additive and no additive subgroups (P = 0.45) (Analysis 6.2); and the high/unclear risk of bias subgroups (P = 0.47) (Analysis 6.3). In all four studies, long‐acting local anaesthetic and high‐dose dexamethasone were used.
Quality of evidence
We assessed the quality of evidence to be low. We downgraded by two levels for imprecision because the confidence interval includes both no clinical effect (MID less than 1.2 on VAS) and clinical effect (MID greater than 1.2 on VAS).
4a Postoperative opioid consumption at 12 hours
No studies evaluated postoperative opioid consumption at 12 hours.
4b Postoperative opioid consumption at 24 hour
Cummulative opioid administration at 24 hours was reported in six studies. Reasons for opioid administration varied across studies and included VAS greater than four (Abdallah 2015), and "as needed" (Dawson 2016; Rahangdale 2014; Rosenfeld 2016). No criteria for opioid administration was provided in the remaining two studies (Parrington 2010; Viera 2010). Postoperative opioid consumption (oral morphine equivalents) at 24 hours in the perineural dexamethasone group was significantly lower compared with placebo (MD 19.25 mg, 95% CI 5.99 to 32.51; participants = 380; studies = 6; I2 = 88%) (Analysis 7.1).
Subgroup analysis
There was no significant difference in effect size between the long‐ versus medium‐acting local anaesthetic subgroups (P = 0.22) or the additive versus no additive subgroups (P = 0.28). Opioid consumption was significantly higher in the high/unclear risk of bias subgroup (P = 0.00001) (Analysis 7.2; Analysis 7.3; Analysis 7.4). In all six studies, high‐dose dexamethasone was used.
4c Postoperative opioid consumption at 48 hours
No studies reported cumulative opioid consumption at 48 hours.
5 Participant satisfaction with pain control
There was no statistically significant difference in satisfaction scores on an 11‐point VAS between perineural dexamethasone and placebo (MD 0.83, 95% CI ‐0.05 to 1.71; participants = 224; studies = 4; I2 = 0%) (Analysis 8.1)
Intravenous dexamethasone versus placebo
Primary outcomes
1. Duration of sensory block
Duration of sensory block was defined inconsistently across six studies. Definitions included the following.
The interval between administration of block and:
-
first report of pain (Abdallah 2015; Rahangdale 2014);
-
participant detected complete resolution of block (Rosenfeld 2016);
-
first analgesia request or administration (Desmet 2013; Desmet 2015; Kawanishi 2014).
Duration of sensory block also included the interval between onset of sensory block and first analgesic request (Chalifoux 2017), and the time interval between successful block and complete recovery of all senses in the operative limb (Sakae 2017).
Duration of sensory block was significantly longer in the intravenous group compared with placebo (MD 6.21, 95% CI 3.53 to 8.88; participants = 499; studies = 8; I2 = 88%); (Figure 7), (Analysis 9.1).

Forest plot of comparison: 9 Duration of sensory block: intravenous dexamethasone versus placebo , outcome: 9.1 Duration of sensory block.
Subgroup analysis
The duration of sensory block was significantly longer in the high‐dose versus low‐dose dexamethasone subgroup (P = 0.00) Analysis 9.3), and the low risk of bias versus high risk of bias subgroup (P = 0.00); Analysis 9.4). There was no statistically significant difference in the duration of sensory block between the additive and no additive subgroups (P = 1.0) (Analysis 9.2). In all studies, long‐acting local anaesthetic was used.
Quality of evidence
We assessed the quality of evidence as moderate. We downgraded by one level for inconsistency because of considerable heterogeneity (I2 = 88%, P < 0.00001). Our subgroup analyses did not explain the observed heterogeneity.
2. Incidence of severe adverse events
See incidence of severe events in the perineural dexamethasone versus placebo section.
Secondary outcomes
1. Duration of motor block
Duration of motor block was defined as the interval between completion of block until return to baseline motor strength in the operative limb (Abdallah 2015), the time interval between successful block and complete recovery of all movements of the arm (Sakae 2017), or when the participant was able to move the great toe (Rosenfeld 2016). Duration of motor block was significantly longer in the intravenous dexamethasone group compared with placebo (MD 5.04 hours, 95% CI 3.07 to 7.00; participants = 139; studies = 3; I2 = 27%) (Analysis 10.1).
Subgroup analysis
There was no significant difference in the duration of motor block between the additive and no additive subgroup (P = 0.46) (Analysis 10.2); in the high‐ versus low‐dose subgroups (P = 0.11) (Analysis 10.3); or in the high versus low risk of bias subgroups (P = 0.11) (Analysis 10.4). In all three studies, long‐acting local anaesthetic was used.
2. Incidence of mild to moderate adverse events such as nausea/vomiting, pruritus, somnolence, oxygen desaturation, urinary retention, numbness/tingling
Block‐related adverse events
Five studies reported that they assessed for block‐related adverse events. There was no significant difference between intravenous dexamethasone and control in the overall incidence of events or each individual event. The incidence of overall block‐related events was 75 out of 195 in the intravenous dexamethasone group versus 70 out of 198 in the control group (RR 1.09, 95% CI 0.69 to 1.70; I2 = 59%).
The incidence of each adverse event is as follows.
-
Numbness/tingling 14 days after surgery: three out of 49 in the intravenous group versus two out of 52 in the placebo group (RR 1.69, 95% CI 0.31 to 9.26; participants = 101; studies = 2; I2 = 0%) (Abdallah 2015; Rahangdale 2014); (Analysis 11.2).
-
Residual motor block/muscle weakness 24 hours after surgery: nine out of 133 in the intravenous dexamethasone group versus three out of 132 in the placebo group (RR 2.68, 95% CI 0.80 to 8.90; studies = 3; I2 = 0%) (Desmet 2013; Desmet 2015; Rahangdale 2014); (Analysis 11.3).
-
Horner syndrome: 38 out of 109 in the intravenous dexamethasone group versus 41 out of 105 in the placebo group (RR 0.89, 95% CI 0.63 to 1.26; participants = 214; studies = 2) (Desmet 2013; Desmet 2015); (Analysis 11.4).
-
Hoarseness: 16 out of 109 in the intravenous versus 17 out of 106 in the placebo group (RR 0.88, 95% CI 0.45 to 1.71; participants = 215; studies = 2; I2 = 8%) (Desmet 2013; Desmet 2015); (Analysis 11.5).
-
Dyspnoea: one out of 107 in the intravenous dexamethasone group versus three out of 112 in the placebo group (RR 0.63, 95% CI 0.11 to 3.74; participants = 219; studies = 3; I2 = 0%) (Desmet 2015; Kawanishi 2014; Rosenfeld 2016); (Analysis 11.6).
-
Cranial nerve 12 palsy: zero out of 37 in the intravenous group versus one out of 41 in the placebo group (RR 0.37, 95% CI 0.02 to 8.77; participants = 78; studies = 1; I2 = 0%) (Rosenfeld 2016); (Analysis 11.7).
Non block‐related adverse events
Five studies reported that they assessed for non‐block‐related adverse events (Abdallah 2015; Chalifoux 2017; Dawson 2016; Kawanishi 2014; Rosenfeld 2016); (Analysis 11.8). There was no significant difference between intravenous dexamethasone and placebo (8 out of 128 in the intravenous group versus 5 out of 122 in the placebo group (RR 1.23, 95% CI 0.38 to 3.97; participants = 258; studies = 5; I2 = 0%).
-
Postoperative nausea and vomiting: two out of 67 in the intravenous group versus three out of 67 in the placebo group (RR 0.66, 95% CI 0.12 to 3.78; participants = 134; studies = 3; I2 = 0%) (Abdallah 2015; Dawson 2016; Kawanishi 2014); (Analysis 11.9).
-
Dermatological symptoms (pruritus/rash): four out of 61 in the intravenous dexamethasone group versus one out of 63 in the placebo group (RR 1.88, 95% CI 0.09 to 40.62; participants = 124; studies = 2; I2 = 52%) (Chalifoux 2017; Rosenfeld 2016); (Analysis 11.10).
-
Each of the following adverse events occurred in one out of 37 in the intravenous dexamethasone group versus zero out of 41 in the placebo group: dizziness, wrist, hand or finger pain, constipation (RR 0.37, 95% CI 0.02 to 8.77; participants = 78; studies = 1) (Rosenfeld 2016); (Analysis 11.11).
3a. Postoperative pain intensity at 12 hours
Pain scores were significantly lower in the intravenous dexamethasone group compared with placebo (MD ‐1.24, 95% CI ‐2.44 to ‐0.04; participants = 162; studies = 3; I2 = 61%) (Chalifoux 2017; Rosenfeld 2016; Sakae 2017); (Figure 8), (Analysis 12.1).

Forest plot of comparison: 12 Postoperative pain intensity at 12 hours: intravenous dexamethasone versus placebo, outcome: 12.1 Postoperative pain intensity at 12 hours.
Subgroup analysis
There was no difference in effect size between the low‐ and high‐dose dexamethasone subgroups (P = 0.12) (Analysis 21.2); or between the high/unclear versus low risk of bias subgroups (P = 0.12) (Analysis 22.3). In all three studies, long‐acting local anaesthetic was used, and none used additives.
Quality of evidence
We assessed the quality of evidence to be low. We downgraded by one level due to moderate heterogeneity (I2= 61%, P = 0.08) not explained by subgroup analyses, and by one level for imprecision because the CI includes both no clinical effect (MID less than 1.2 on VAS) and clinical effect (MID greater than 1.2 on VAS).
3b. Postoperative pain intensity at 24 hours
Pain scores were significantly lower in the intravenous dexamethasone group compared with placebo (MD ‐1.26, 95% CI ‐2.23 to ‐0.29; participants = 257; studies = 5; I2 = 65%) (Abdallah 2015; Chalifoux 2017; Rahangdale 2014; Rosenfeld 2016; Sakae 2017); (Figure 9), (Analysis 13.1).

Forest plot of comparison: 13 Postoperative pain intensity at 24 hours: intravenous dexamethasone versus placebo, outcome: 13.1 Postoperative pain intensity at 24 hours.
Subgroup analysis
There was no significant difference in effect size between the additive or no additive subgroups (P = 0.70) (Analysis 13.2); the high‐ versus low‐dose dexamethasone subgroups (P = 0.83) (Analysis 13.3); or the high/unclear versus low risk of bias subgroups (P = 0.83) (Analysis 13.4). In all studies, long‐acting local anaesthetic was used.
Quality of evidence
We assessed the quality of evidence to be low. We downgraded by one level for inconsistency because of considerable heterogeneity (I2 = 65 %, P = 0.02) not explained by subgroup analyses, and by one level for imprecision because the CI includes both no clinical effect (MID less than 1.2 on VAS) and clinical effect (MID greater than 1.2 on VAS).
3c. Postoperative pain intensity at 48 hours
There was no significant difference in postoperative pain intensity at 48 hours between intravenous dexamethasone and placebo (MD ‐0.18, 95% CI ‐0.80 to 0.44; participants = 172; studies = 3; I2 = 0%) (Chalifoux 2017; Rahangdale 2014; Rosenfeld 2016); (Analysis 14.1).
Subgroup analysis
There was no significant difference in effect size between the additive and no additive subgroups (P = 0.97) (Analysis 14.2). In all studies, long‐acting local anaesthetic and high‐dose dexamethasone were used, and all were at low risk of bias.
Quality of evidence
We assessed the quality of evidence to be low. We downgraded by two levels for imprecision because of small sample size and the CI crosses the line of null effect.
4a Postoperative opioid consumption at 12 hours
One study in 46 participants reported the cumulative opioid consumption at 12 hours. Median and interquartile range of opioid consumption was zero in both the intravenous dexamethasone and control groups (Chalifoux 2017).
4b Postoperative opioid consumption at 24 hours
Cummulative opioid consumption at 24 hours was reported in five studies. Postoperative opioids were administered for VAS greater than four (Abdallah 2015; Chalifoux 2017), or as needed (Dawson 2016; Rahangdale 2014; Rosenfeld 2016). Twenty‐four hour opioid consumption was significantly lower in the intravenous dexamethasone group compared with control (MD ‐6.58 mg, 95% CI ‐10.56 to ‐2.60; participants = 287; studies = 5; I2 = 60%) (Analysis 15.1).
Subgroup analysis
There was no significant difference in effect size between the additive and no additive subgroups (P = 0.58) (Analysis 15.2). In all three studies, long‐acting local anaesthesia and high‐dose dexamethasone were used, and all were at low risk of bias.
4c Postoperative opioid consumption at 48 hours
In one study (46 participants), postoperative opioid consumption was significantly lower in the intravenous dexamethasone group versus placebo (MD 22.50 mg, 95% CI 5.15 to 39.85) (Chalifoux 2017); (Analysis 16.1).
5 Participant satisfaction with pain control
There was no statistically significant difference between intravenous dexamethasone and placebo in participant satisfaction with pain control (MD 1.07, 95% CI ‐0.08 to 2.22; participants = 181; studies = 3; I2 = 27%) (Analysis 17.1).
Perineural versus intravenous dexamethasone
1. Duration of sensory block
We identified nine trials that compared perineural versus intravenous dexamethasone. The duration of sensory block was defined inconsistently across studies. Definitions included the following.
The interval between administration of block and:
-
first report of pain (Abdallah 2015; Aliste 2017; Leurcharusmee 2016; Rahangdale 2014);
-
participant detected complete resolution of block (Rosenfeld 2016);
-
first analgesia request or administration (Desmet 2013; Kawanishi 2014).
-
Time of completion of surgery to first analgesic request (Chun 2016)
-
Time of successful block to recovery of sensation (Sakae 2017).
The duration of sensory block was significantly longer in the perineural dexamethasone group compared with intravenous dexamethasone (MD 3.13 hours, 95% CI 1.68 to 4.58; participants = 720; studies = 9; I2 = 63%) (Analysis 18.1).
Subgroup analysis
There was no significant difference in the duration of sensory block between the additive and no additive subgroups (P = 0.40) (Analysis 18.2); between the high‐ versus low‐dose dexamethasone subgroups (P = 0.22) (Analysis 18.3); or between the high/unclear risk of bias subgroups (P = 0.14). In all studies, long‐acting local anaesthesia was used.
Quality of evidence
We assessed the quality of evidence as moderate. We downgraded by one level for inconsistency because of considerable heterogeneity (I2 = 63%, P = 0.006) and point estimates vary widely. Subgroup analyses did not explain observed heterogeneity.
2. Incidence of serious adverse events
See incidence of serious adverse events in perineural versus control section.
Secondary outcomes
1. Duration of motor block
Duration of motor block was defined as the interval between administration of block until return to baseline motor strength in the operative limb (Abdallah 2015), or the participant was able to move the great toe (Rahangdale 2014). The duration of motor block was significantly longer in the perineural dexamethasone group compared with the intravenous dexamethasone group (MD 3.13 hours, 95% CI 0.99 to 5.27; participants = 421; studies = 5; I2 = 71%) (Analysis 19.1).
Subgroup analysis
There was no significant difference in motor block between the additive versus no additive subgroups (P = 0.53) (Analysis 19.2); between the high‐ versus low‐dose dexamethasone subgroups (P = 0.18) (Analysis 19.3); or between the high/unclear versus low risk of bias subgroups (P = 0.18) (Analysis 19.4). In all studies, long‐acting local anaesthesia was used.
2. Incidence of mild to moderate adverse events such as nausea/vomiting, pruritus, somnolence, oxygen desaturation, urinary retention, numbness/tingling
Block‐related adverse events
Five studies reported that they assessed for block‐related adverse events (Abdallah 2015; Aliste 2017; Dawson 2016; Kawanishi 2014; Rosenfeld 2016). There was no statistically significant difference between perineural and intravenous dexamethasone in the overall or individual incidence of block‐related adverse events (42 out of 207 in the perineural dexamethasone group versus 36 out of 199 in the intravenous dexamethasone group (RR 1.20, 95% CI 0.93 to 1.55; participants = 406; studies = 5; I2 = 0%) (Analysis 20.1). Individual events are as follows.
-
Numbness/tingling 14 days after surgery: four out of 116 in the perineural group versus four out of 116 in the intravenous group (RR 0.97, 95% CI 0.27 to 3.49; participants = 232; studies = 3; I2 = 0%) (Abdallah 2015; Aliste 2017; Rahangdale 2014); (Analysis 20.2).
-
Residual motor block/muscle weakness at 24 hours: 16 out of 126 in the perineural dexamethasone group versus 13 out of 122 in the intravenous dexamethasone group (RR 1.22, 95% CI 0.62 to 2.37; participants = 248; studies = 3; I2 = 0%) (Chun 2016; Desmet 2013; Rahangdale 2014); (Analysis 20.3).
-
Horner syndrome: 24 out of 99 in the perineural versus 20 out of 98 in the intravenous dexamethasone group (RR 1.20, 95% CI 0.77 to 1.87; participants = 197; studies = 2; I2 = 0%) (Chun 2016; Desmet 2013); (Analysis 20.4).
-
Hoarseness: 11 out of 99 in the perineural versus 11 out of 98 in the intravenous dexamethasone group (RR 1.00, 95% CI 0.48 to 2.09; participants = 197; studies = 2; I2 = 0%)(RR 1.00, 95% CI 0.48 to 2.09; participants = 98; studies = 1; I2 = 0%) (Chun 2016; Desmet 2013); (Analysis 20.5).
-
Cranial nerve 12 palsy: zero out of 42 in the perineural dexamethasone group versus one out of 41 in the intravenous dexamethasone group (RR 0.31, 95% CI 0.01 to 7.39; participants = 81; studies = 1; I2 = 0%) (Rosenfeld 2016); (Analysis 20.6).
Non‐block‐related adverse events
Five studies reported that they assessed for non‐block‐related adverse events (Abdallah 2015; Chun 2016; Dawson 2016; Kawanishi 2014; Rosenfeld 2016). There was no statistically significant difference between perineural and intravenous dexamethasone (26 out of 159 in the perineural dexamethasone group versus 21 out of 157 in the intravenous dexamethasone group ((RR 1.34, 95% CI 0.37 to 4.78; participants = 316; studies = 5; I2 = 63%) (Analysis 20.7). The incidence for each event is as follows.
-
Postoperative nausea and vomiting: five out of 159 in the perineural dexamethasone group versus eight out of 153 in the intravenous dexamethasone group (RR 0.63, 95% CI 0.22 to 1.80; participants = 312; studies = 5; I2 = 0%) (Abdallah 2015; Chun 2016; Dawson 2016; Kawanishi 2014; Rosenfeld 2016); (Analysis 20.8).
-
Dermatological symptoms (pruritus/rash): two out of 42 in the perineural dexamethasone group versus zero out of 37 in the intravenous dexamethasone group (RR 4.42, 95% CI 0.22 to 89.18; participants = 79; studies = 1) (Rosenfeld 2016); (Analysis 20.9).
-
Syncope/fainting: two out of 42 in the perineural dexamethasone group versus zero out of 37 in the intravenous dexamethasone group (RR 4.42, 95% CI 0.22 to 89.18; participants = 79; studies = 1; I2 = 0%) (Rosenfeld 2016); (Analysis 20.10).
-
Dizziness: one out of 92 in the perineural dexamethasone group versus three out of 86 in the intravenous dexamethasone group (RR 0.41, 95% CI 0.06 to 2.72; participants = 178; studies = 2; I2 = 0%) (Rosenfeld 2016); (Analysis 20.11).
-
Wrist, hand or finger pain: zero out of 42 in the perineural dexamethasone group versus one out of 37 in the intravenous dexamethasone group (RR 0.29, 95% CI 0.01 to 7.02; participants = 79; studies = 1) (Rosenfeld 2016); (Analysis 20.12).
-
Each of the following outcomes occurred in one out of 42 in the perineural dexamethasone group versus zero out of 37 in the intravenous dexamethasone group: 10‐lb weight gain in 24 hours, headache, diarrhoea, frequent urination and muscle soreness (RR 2.65, 95% CI 0.11 to 63.16; participants = 79; studies = 1) (Rosenfeld 2016); (Analysis 20.13).
3a. Postoperative pain intensity at 12 hours
Pain scores were significantly lower in the perineural dexamethasone group compared with intravenous dexamethasone. The MD did not surpass the MID of 1.2, therefore the difference in effect size is not clinically significant (MD ‐1.01, 95% CI ‐1.51 to ‐0.50; participants = 217; studies = 3; I2 = 0%) (Chun 2016; Rosenfeld 2016; Sakae 2017); (Analysis 21.1).
Subgroup analysis
There was no significant difference in effect size between the high‐and low‐dose dexamethasone subgroups (P = 0.83) (Analysis 21.2 or between the high/unclear and low risk of bias subgroups (P = 0.83) Analysis 21.3. In all three studies, long‐acting local anaesthetic was used and no additives were used.
Quality of evidence
We assessed the quality of evidence to be low. We downgraded by one level for risk of bias because two of the three studies are at unclear risk of bias, and by one level for imprecision because the CI includes both no clinical effect (MID less than 1.2 on VAS) and clinical effect (MID greater than 1.2 on VAS).
3b. Postoperative pain intensity at 24 hours
Pain scores were significantly lower in the perineural dexamethasone group compared with intravenous dexamethasone. The MD did not surpass the MID of 1.2 on the VAS, therefore the difference in effect size is not clinically significant (MD ‐0.79, 95% CI ‐1.51 to ‐0.07; participants = 309; studies = 5; I2 = 46%) (Abdallah 2015; Chun 2016; Rahangdale 2014; Rosenfeld 2016; Sakae 2017); (Analysis 22.1).
Subgroup analysis
There was no significant difference in effect size between the additive and no additive subgroups (P = 0.24) (Analysis 22.2), the low‐versus high‐dose dexamethasone subgroups (P = 0.75) (Analysis 22.3) or the high/unclear versus low risk of bias subgroups (P = 0.75) (Analysis 22.4). In all five studies, long‐acting local anaesthetic was used.
Quality of evidence
We assessed the quality of evidence to be moderate. We downgraded by one level for imprecision because the CI includes both no clinical effect (MID less than 1.2 on VAS) and clinical effect (MID greater than 1.2 on VAS).
3c. Postoperative pain intensity at 48 hours
There was no significant difference in pain scores at 48 hours between perineural and intravenous dexamethasone (MD 0.13, 95% CI ‐0.35 to 0.61; participants = 227; studies = 3; I2 = 0%) (Chun 2016; Rahangdale 2014; Rosenfeld 2016); (Analysis 23.1).
Subgroup analysis
There was no significant difference in effect size between the additive and the no additive subgroups (P = 0.28) (Analysis 23.2), the low‐versus high‐dose dexamethasone subgroups (P = 0.46) (Analysis 23.3) and the high/unclear versus low risk of bias subgroups (P = 0.46) (Analysis 23.4). In all three studies, long‐acting local anaesthetic was used.
Quality of evidence
We assessed the quality of evidence to be low. We downgraded by one level for risk of bias because the one study that is at unclear risk of bias contributes half the data for this outcome, and by one level for imprecision because of small sample size.
4a. Postoperative opioid consumption at 12 hours
No studies evaluated postoperative opioid consumption at 12 hours.
4b. Postoperative opioid consumption at 24 hours
Cummulative postoperative consumption at 24 hours was reported in four studies. Postoperative opioids were administered for VAS greater than four (Abdallah 2015), or as needed (Dawson 2016; Rahangdale 2014; Rosenfeld 2016). There was no significant difference in the 24‐hour opioid consumption between perineural and intravenous dexamethasone (MD ‐3.87 mg, 95% CI ‐9.93 to 2.19; participants = 242; studies = 4; I2 = 44%) (Analysis 24.1).
Subgroup analysis
There was no significant difference in effect size between the additive or no additive subgroups (P = 0.11) (Analysis 24.2). In all four studies, long‐acting local anaesthetic and high‐dose dexamethasone were used, and all four studies were at low risk of bias.
4c. Postoperative opioid consumption at 48 hours
No studies reported the cumulative opioid consumption at 48 hours.
5. Participant satisfaction with pain control
There was no significant difference in participant satisfaction between perineural and intravenous dexamethasone (MD 0.19, 95% CI ‐0.33 to 0.70; participants = 181; studies = 3; I2 = 0%) (Analysis 25.1). The SD was zero in both the perineural and intravenous dexamethasone groups in one of the two studies, therefore the 95% CI was not estimable and the analysis was based on one study in 50 participants.
Discusión
Resumen de los principales resultados y calidad de la evidencia
El objetivo de esta revisión fue evaluar la eficacia y la seguridad comparativas de la dexametasona perineural y de la dexametasona intravenosa como adyuvantes del bloqueo nervioso periférico para el control del dolor posoperatorio en los pacientes sometidos a cirugía del miembro superior o inferior. Los resultados primarios fueron la duración del bloqueo sensitivo y la incidencia de eventos adversos graves. Se realizó una búsqueda exhaustiva de ensayos que evaluaban los objetivos del estudio. Se evaluó la calidad de la evidencia para los resultados importantes para la toma de decisiones clínicas, incluida la duración del bloqueo sensitivo, la intensidad del dolor posoperatorio a las 12; 24 y las 48 horas y la incidencia de eventos adversos graves. En total, se encontraron 35 ensayos elegibles con 2707 participantes. Se describieron los resultados y se proporcionó un resumen de la calidad de la evidencia para cada comparación a continuación.
Dexametasona perineural versus placebo
A través de 27 ensayos (1625 participantes) la duración del bloqueo sensitivo fue más larga en el grupo de dexametasona perineural en aproximadamente seis horas y media. La calidad de la evidencia es baja. La calidad se disminuyó en un nivel a causa del riesgo de sesgo debido a que la mayoría de los estudios está en riesgo poco claro de sesgo y en un nivel por la inconsistencia debido a la heterogeneidad considerable no explicada por los análisis de subgrupos; las estimaciones puntuales variaron mucho entre los estudios y los intervalos de confianza mostraron una superposición mínima. El bloqueo motor también fue más prolongado en el grupo de dexametasona perineural en comparación con el control en aproximadamente seis horas (16 estudios, 912 participantes).
A través de cinco estudios (257 participantes), la intensidad del dolor posoperatorio a las 12 horas en el grupo de dexametasona perineural fue de 2,1 puntos inferior en una escala de calificación numérica de 11 puntos. La calidad de la evidencia es muy baja; se disminuyó en un nivel por el riesgo de sesgo debido a que la mitad de los estudios estuvieron en riesgo alto/poco claro de sesgo, en un nivel por la inconsistencia debido a la heterogeneidad considerable no explicada por los análisis de subgrupos y en un nivel por la imprecisión debido al tamaño de la muestra pequeño. A las 24 horas, la dexametasona perineural redujo la intensidad del dolor posoperatorio en 1,6 puntos (nueve estudios, 469 participantes). La calidad de la evidencia es baja; se disminuyó en un nivel por la inconsistencia debido a la heterogeneidad considerable no explicada mediante el análisis de subgrupos, y en un nivel por la imprecisión debido a que el intervalo de confianza incluye tanto ningún efecto clínico como un efecto clínico. Para la intensidad del dolor posoperatorio a las 12 y 24 horas, se sobrepasó la diferencia mínimamente importante (DMI) de 1,2 puntos. No hubo diferencias en la intensidad del dolor posoperatorio entre la dexametasona perineural y el placebo a las 48 horas (tres estudios, 296 participantes). La calidad de la evidencia es baja; se disminuyó en un nivel por la inconsistencia debido a la heterogeneidad moderada no explicada por los análisis de subgrupos, y en un nivel por la imprecisión debido a que el intervalo de confianza incluye tanto ningún efecto clínico como un efecto clínico. El consumo acumulado posoperatorio de opiáceos a las 24 horas fue inferior en el grupo de dexametasona perineural en comparación con placebo por equivalentes de 19 mg de morfina oral.
Basado en las hipótesis a priori, la duración del bloqueo sensitivo fue significativamente mayor en el subgrupo del anestésico local de acción prolongada versus acción media y en el subgrupo de dexametasona de dosis alta versus baja. No hubo una diferencia significativa en el tamaño del efecto entre los subgrupos de dexametasona de dosis alta y baja en los resultados de la intensidad del dolor posoperatorio a las 12 y 24 horas; por lo tanto, la duración más prolongada del bloqueo sensitivo en los subgrupos de anestésico local de acción prolongada y de dexametasona de dosis alta probablemente no es clínicamente significativa.
Dexametasona intravenosa versus placebo
A través de ocho ensayos (499 participantes), la duración del bloqueo sensitivo fue mayor en el grupo de dexametasona intravenosa en aproximadamente seis horas. La calidad de la evidencia es moderada; se disminuyó en un nivel por la inconsistencia debido a la heterogeneidad considerable no explicada por los análisis de subgrupos. La duración del bloqueo motor también fue mayor en el grupo de dexametasona intravenosa en comparación con el control en aproximadamente cinco horas.
A través de tres estudios (162 participantes), la intensidad del dolor posoperatorio a las 12 horas fue inferior en el grupo de dexametasona intravenosa en comparación con placebo en 1,2 puntos en una escala de calificación numérica de 11 puntos. La calidad de la evidencia es baja; se disminuyó en un nivel por la inconsistencia debido a la heterogeneidad considerable no explicada por los análisis de subgrupos, y en un nivel por la imprecisión debido a que el intervalo de confianza incluyó tanto ningún efecto clínico como un efecto clínico. A las 24 horas (5 estudios, 257 participantes), la intensidad del dolor posoperatorio fue inferior en el grupo de dexametasona intravenosa en 1,3 puntos. La calidad de la evidencia es baja; se disminuyó en un nivel por la inconsistencia debido a la heterogeneidad considerable no explicada por los análisis de subgrupos, y en un nivel por la imprecisión debido a que el intervalo de confianza incluye tanto ningún beneficio clínico como un beneficio clínico. La DMI de 1,2 puntos fue sobrepasada en los resultados de la intensidad del dolor posoperatorio a las 12 y 24 horas. A través de tres ensayos (172 participantes) no hubo diferencias en la intensidad del dolor posoperatorio a las 48 horas. La calidad de la evidencia es baja; se disminuyó en dos niveles por la imprecisión debido a que el intervalo de confianza cruza la línea del efecto nulo y debido al tamaño de la muestra pequeño. El consumo de opiáceos a las 24 horas posoperatorio fue inferior en el grupo de dexametasona intravenosa.
Basado en las hipótesis a priori, la duración del bloqueo sensitivo fue significativamente mayor en el subgrupo de dexametasona de dosis alta versus baja. No hubo una diferencia significativa en el tamaño del efecto entre los subgrupos de dexametasona de dosis alta y de dosis baja en los resultados de la intensidad del dolor posoperatorio a las 12 y 24 horas, por lo tanto la duración más prolongada del bloqueo sensitivo con dexametasona de dosis alta probablemente no es clínicamente significativa.
Dexametasona perineural versus intravenosa
A través de nueve estudios (720 participantes) la duración del bloqueo sensitivo fue mayor en el grupo de dexametasona perineural en comparación con dexametasona intravenosa en aproximadamente tres horas. La calidad de la evidencia es moderada; se disminuyó en un nivel por la heterogeneidad considerable no explicada por el análisis de subgrupos. La duración del bloqueo motor también fue mayor en el grupo de dexametasona perineural en aproximadamente tres horas (tres estudios, 139 participantes).
La intensidad del dolor posoperatorio a las 12 horas fue inferior en el grupo de dexametasona perineural en comparación con la dexametasona intravenosa (tres estudios, 217 participantes). La DMI de 1,2 no fue sobrepasada; por lo tanto, la intensidad inferior del dolor no es clínicamente significativa. La calidad de la evidencia es muy baja; se disminuyó en un nivel por el riesgo de sesgo debido a que dos de los tres estudios incluidos están en riesgo poco claro de sesgo, y en un nivel por la imprecisión debido a que el intervalo de confianza incluye tanto ningún efecto clínico como un efecto clínico. A las 24 horas, aunque la intensidad del dolor posoperatorio fue significativamente mayor en el grupo de dexametasona perineural en comparación con la dexametasona intravenosa, la DMI de 1,2 no fue sobrepasada; por lo tanto, la intensidad inferior del dolor no es clínicamente significativa (cinco estudios, 309 participantes). La calidad de la evidencia es moderada; se disminuyó en un nivel por la imprecisión debido a que el intervalo de confianza incluye tanto un efecto clínico como ningún efecto clínico. A las 48 horas posoperatorio, no hubo diferencias en la intensidad del dolor posoperatorio entre la dexametasona perineural e intravenosa. La calidad de la evidencia es baja; se disminuyó en un nivel por el riesgo de sesgo debido a que la mitad de los datos provienen de un estudio en riesgo poco claro de sesgo y en un nivel por la imprecisión debido al tamaño de la muestra pequeño. No hubo diferencias entre la dexametasona perineural e intravenosa en el consumo posoperatorio de opiáceos a las 24 horas. No se encontró ninguna diferencia en el tamaño del efecto de los subgrupos.
Los autores informaron que evaluaron los eventos adversos graves en siete estudios. Se informaron cinco eventos adversos graves en tres estudios que incluyeron neumotórax, neumonía, desarrollo del Síndrome de Dolor Regional Crónico Tipo I y dos hospitalizaciones inesperadas en el plazo de una semana desde la cirugía; uno por una caída; el otro por una infección intestinal. La calidad de la evidencia es muy baja, y se disminuyó en un nivel por el riesgo de sesgo debido a que la mayoría de los estudios estuvo en riesgo alto/poco claro de sesgo, y en dos niveles por la imprecisión debido al tamaño de la muestra pequeño.
Los eventos adversos leves a moderados se categorizaron en eventos adversos relacionados con el bloqueo y no relacionados con el bloqueo. Los eventos adversos relacionados con el bloqueo incluyeron adormecimiento/cosquilleo, bloqueo motor residual y debilidad muscular, síndrome de Horner, ronquera, paresia diafragmática, disnea, parálisis motora del nervio craneal 12; lesión vascular y equimosis en el sitio de inyección. Los eventos adversos no relacionados con el bloqueo incluyeron bradicardia/hipotensión, náuseas posoperatorias y vómitos, prurito/erupción cutánea, síncope, mareos, cefalea, acumulación de líquido, diarrea, micción frecuente, dolor muscular, dolor en la muñeca, la mano o el dedo y estreñimiento.
No se encontró ninguna diferencia entre la incidencia de los eventos adversos relacionados y no relacionados con el bloqueo en ninguna de las tres comparaciones. Debido a que la incidencia de eventos adversos graves y relacionados con el bloqueo que se asocian con el uso del bloqueo nervioso periférico es poco frecuente, la revisión puede no haber incluido suficientes participantes para detectar una diferencia en alguna de las comparaciones, por lo tanto la confianza en el cálculo es baja (número escaso de participantes y eventos). En sólo dos estudios los autores informaron que los síntomas relacionados con el bloqueo se habían resuelto, por lo tanto no es posible determinar si los participantes que informaron eventos adversos relacionados con el bloqueo en otros estudios fueron diagnosticados posteriormente con lesión nerviosa.
Incidencia de eventos adversos severos
Eventos adversos de leves a moderados
Compleción y aplicabilidad general de las pruebas
La mayoría de los estudios incluidos en la revisión se realizó en la cirugía del miembro superior; debido a que sólo dos estudios se realizaron en la cirugía del miembro inferior, no es posible establecer conclusiones significativas acerca de la efectividad de la dexametasona como un adyuvante de los bloqueos del miembro inferior. Se necesitan más estudios de la cirugía del miembro inferior para determinar si los resultados son aplicables a dicha población. Los nueve ensayos en curso en ClinicalTrials.gov pueden cambiar los resultados de esta revisión.
Los resultados de la revisión pueden no ser aplicables a los participantes que están en riesgo de eventos adversos relacionados con la dexametasona en los que los ensayos clínicos podrían ser inseguros. Se excluyeron de muchos de los ensayos los pacientes con diabetes mellitus, úlcera péptica y trastornos psiquiátricos. Además, los resultados tampoco podrían ser aplicables a los pacientes en riesgo de infección posoperatoria y con una cicatrización retardada de la herida, incluidos los que presentan trastornos de inmunodeficiencia, los sometidos a radioterapia, los pacientes con trastorno circulatorio, obesidad, un estado nutricional deficiente, o las personas de edad más avanzada. Otras poblaciones excluidas de algunos de los ensayos incluyen los pacientes con enfermedades renales, hepáticas, cardíacas o pulmonares, lesiones craneoencefálicas, hipertensión, dependencia de drogas/alcohol, embarazadas y los que habían usado corticosteroides u opiáceos de forma preoperatoria. Finalmente, no hubo ningún estudio en neonatos ni en niños menores de 15 años de edad, por lo cual los resultados no son directamente aplicables a esta población.
Se encontró que la duración del bloqueo sensitivo fue mayor en los subgrupos de dosis alta versus baja de dexametasona en las comparaciones de la administración perineural versus control y de la administración intravenosa versus control, aunque la duración más prolongada en los subgrupos de dexametasona de dosis alta no se asoció con una intensidad inferior del dolor posoperatorio. Hubo menos estudios que utilizaron una dosis baja que una dosis alta de dexametasona. Es posible que el tamaño de la muestra fuera demasiado pequeño para detectar una diferencia entre la dexametasona de dosis alta y baja. Los estudios de búsqueda de dosis serían beneficiosos para determinar las dosis perineurales e intravenosas ideales.
En cuanto al resultado de la duración del bloqueo sensitivo, no se determinó a priori la diferencia mínimamente importante (DMI) que sería clínicamente significativa. En las comparaciones de dexametasona perineural versus control y de dexametasona intravenosa versus control, la duración más prolongada del bloqueo sensitivo en los grupos de dexametasona también se asoció con una intensidad inferior del dolor posoperatorio y una reducción del consumo de opiáceos. En la comparación de dexametasona perineural versus intravenosa, la duración más larga del bloqueo sensitivo en la dexametasona perineural no se asoció con una reducción de la intensidad del dolor posoperatorio ni del consumo de opiáceos, y se estableció la conclusión de que es poco probable que la duración más prolongada del bloqueo sensitivo fuese clínicamente significativa. En 10 de los estudios incluidos, la duración del bloqueo sensitivo se informó sin informar también los resultados del dolor; por lo tanto, no se conoce si la duración más prolongada del bloqueo sensitivo en los grupos de dexametasona fue efectiva para aliviar el dolor posoperatorio y el consumo de opiáceos. En todos los estudios futuros, la duración del bloqueo sensitivo debe informarse conjuntamente con otros resultados del dolor para determinar la eficacia de la dexametasona para aliviar el dolor posoperatorio.
Sesgos potenciales en el proceso de revisión
Con el fin de reducir el posible sesgo en el proceso de revisión, dos autores de la revisión evaluaron de forma independiente la elegibilidad de cada ensayo, extrajeron los datos, evaluaron el riesgo de sesgo y evaluaron la calidad de la evidencia. Además, no se impuso ninguna restricción de idioma. Con la ayuda de un bibliotecario experimentado, se hizo una extensa revisión bibliográfica en seis bases de datos, se buscó en Google Scholar y se encontraron estudios adicionales que no se habían encontrado a través de bases de datos científicas. No hubo ninguna decisión marginal acerca de la inclusión o exclusión de los estudios ni sobre el uso y el análisis de los datos. Se realizaron cambios menores en el protocolo, sin embargo, es poco probable que algún cambio haya sido una fuente de sesgo.
Se realizaron análisis de subgrupos para explorar la heterogeneidad para todos los resultados de forma independiente de la heterogeneidad observada (I2). ) En particular, se exploró el tipo de anestésico local (de acción prolongada versus de acción media), la dosis de dexametasona (dosis alta versus baja), si se utilizaron aditivos a los anestésicos locales y si el riesgo de sesgo (alto/poco claro versus bajo) podía explicar la heterogeneidad observada. Las hipótesis de subgrupos se determinaron como factores posibles que pueden influir en los resultados basado en la bibliografía. Puede haber otras razones para la heterogeneidad que no fueron exploradas.
De los 35 ensayos aptos, 14 tenían los informes incompletos (p.ej. datos faltantes de la varianza, presentación poco clara de los datos con cifras). Se intentaron obtener datos no publicados para los metanálisis, pero solo se pudieron obtener de seis de los 15 autores de los estudios con los que se contactó. La información faltante puede haber introducido una fuente de sesgo. En lo que se refiere al sesgo de publicación, sólo dos de los resultados de la comparación de la administración perineural versus placebo incluyeron 10 ensayos o más (duración del bloqueo sensitivo y duración del bloqueo motor). Debido a que los resultados restantes en las tres comparaciones incluyeron menos de 10 ensayos, no se pudo evaluar de forma adecuada el sesgo de publicación. Los protocolos publicados estuvieron disponibles para 10 de los estudios. Para los 25 restantes, basado en la información proporcionada en la sección de métodos para evaluar el riesgo de sesgo de selección, no fue posible evaluar si todos los resultados se informaron según lo previsto, de manera que la evaluación del sesgo de selección es limitada.
Acuerdos y desacuerdos con otros estudios o revisiones
Se hallaron cinco revisiones que evaluaban la efectividad de la dexametasona perineural en los resultados posoperatorios que están de acuerdo con estos hallazgos. Dos revisiones incluyeron a participantes sometidos a la cirugía del miembro superior con bloqueo del plexo braquial (Choi 2014; Knezivic 2015), y las tres restantes incluyeron a participantes sometidos a cirugía con diversos bloqueos nerviosos, incluido el peribulbar, abdominis transversus, axilar, supraclavicular, ciático e interescalénico (Albrecht 2015; De Oliveira 2014; Huynh 2015). En las cinco revisiones, la duración del bloqueo sensitivo y motor fue más prolongada después de la dexametasona perineural en comparación con placebo. Albrecht 2015 yDe Oliveira 2014 hallaron que el consumo posoperatorio de opiáceos a las 24 horas fue inferior después de la dexametasona perineural comparada con placebo.
Se encontraron dos revisiones sistemáticas que evaluaban la efectividad de la dexametasona intravenosa para el dolor posoperatorio (De Oliveira 2011; Waldron 2013). Ninguna de las dos revisiones incluyó estudios en pacientes sometidos al bloqueo nervioso periférico. La intensidad del dolor posoperatorio a las 24 horas, el consumo de opiáceos y la incidencia de náuseas y vómitos posoperatorios fue inferior en el grupo de dexametasona intravenosa en comparación con el placebo (De Oliveira 2011; Waldron 2013). No se encontró ninguna diferencia entre la dexametasona intravenosa y el placebo en la intensidad del dolor posoperatorio a las 24 horas ni en la incidencia de náuseas y vómitos posoperatorios. sin embargo, la revisión incorporó menos participantes que las revisiones anteriores.

Flow diagram of included studies.

Risk of bias graph: review authors' judgements about each risk of bias item presented as percentages across all included studies.
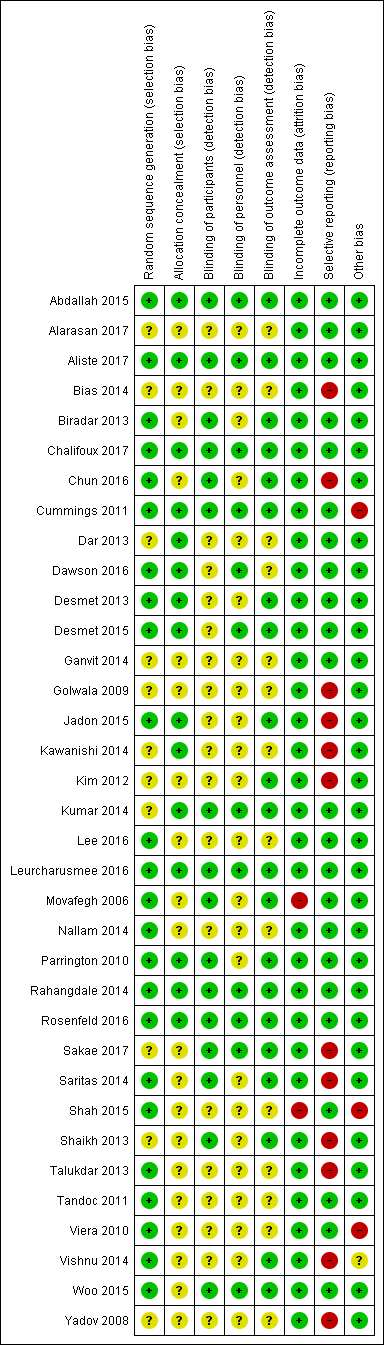
Risk of bias summary: review authors' judgements about each risk of bias item for each included study.
![Forest plot of comparison: 1 Duration of sensory block: perineural dexamethasone versus placebo, outcome: 1.1 Duration of sensory block [hours].](/es/cdsr/doi/10.1002/14651858.CD011770.pub2/media/CDSR/CD011770/image_n/nCD011770-AFig-FIG04.png)
Forest plot of comparison: 1 Duration of sensory block: perineural dexamethasone versus placebo, outcome: 1.1 Duration of sensory block [hours].

Forest plot of comparison: 4 Postoperative pain intensity at 12 hours: perineural dexamethasone versus placebo, outcome: 4.1 Postoperative pain intensity at12 hours.

Forest plot of comparison: 5 Postoperative pain intensity at 24 hours: perineural dexamethasone versus placebo, outcome: 5.1 Postoperative pain intensity at 24 hours.
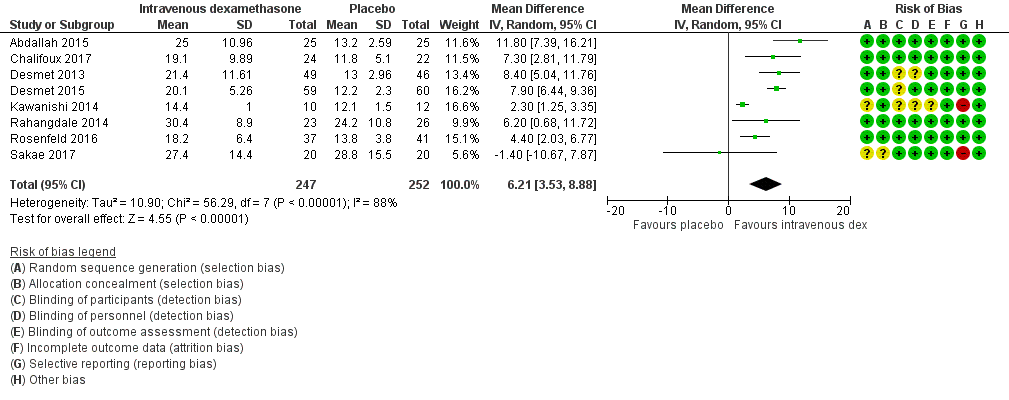
Forest plot of comparison: 9 Duration of sensory block: intravenous dexamethasone versus placebo , outcome: 9.1 Duration of sensory block.
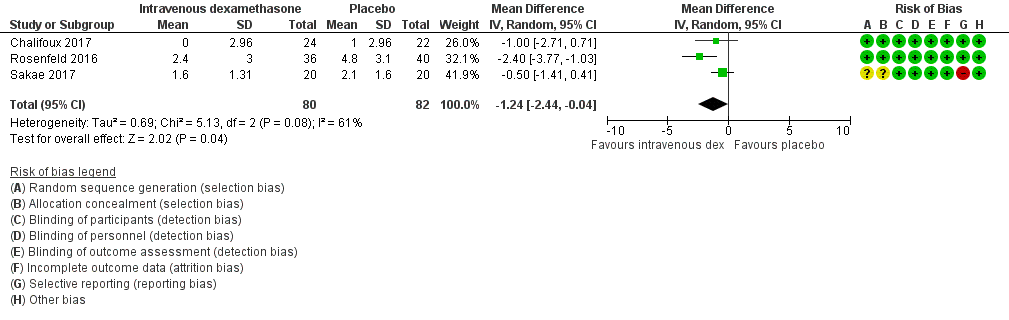
Forest plot of comparison: 12 Postoperative pain intensity at 12 hours: intravenous dexamethasone versus placebo, outcome: 12.1 Postoperative pain intensity at 12 hours.

Forest plot of comparison: 13 Postoperative pain intensity at 24 hours: intravenous dexamethasone versus placebo, outcome: 13.1 Postoperative pain intensity at 24 hours.

Comparison 1 Duration of sensory block: perineural dexamethasone versus placebo, Outcome 1 Duration of sensory block.

Comparison 1 Duration of sensory block: perineural dexamethasone versus placebo, Outcome 2 Duration of sensory block: long‐ versus medium‐acting local anaesthetic subgroups.
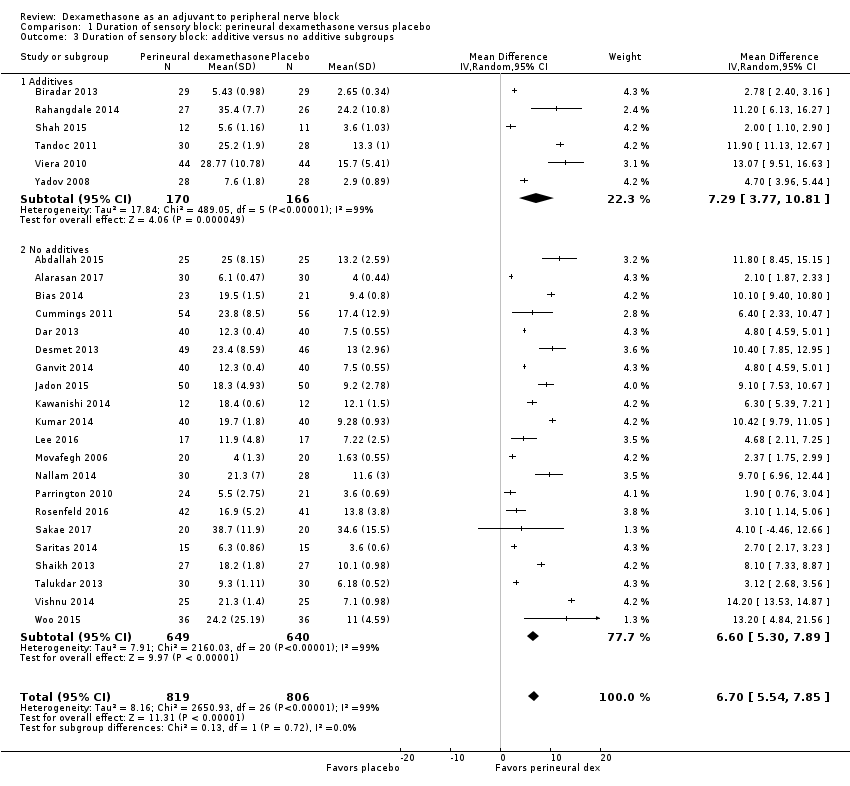
Comparison 1 Duration of sensory block: perineural dexamethasone versus placebo, Outcome 3 Duration of sensory block: additive versus no additive subgroups.
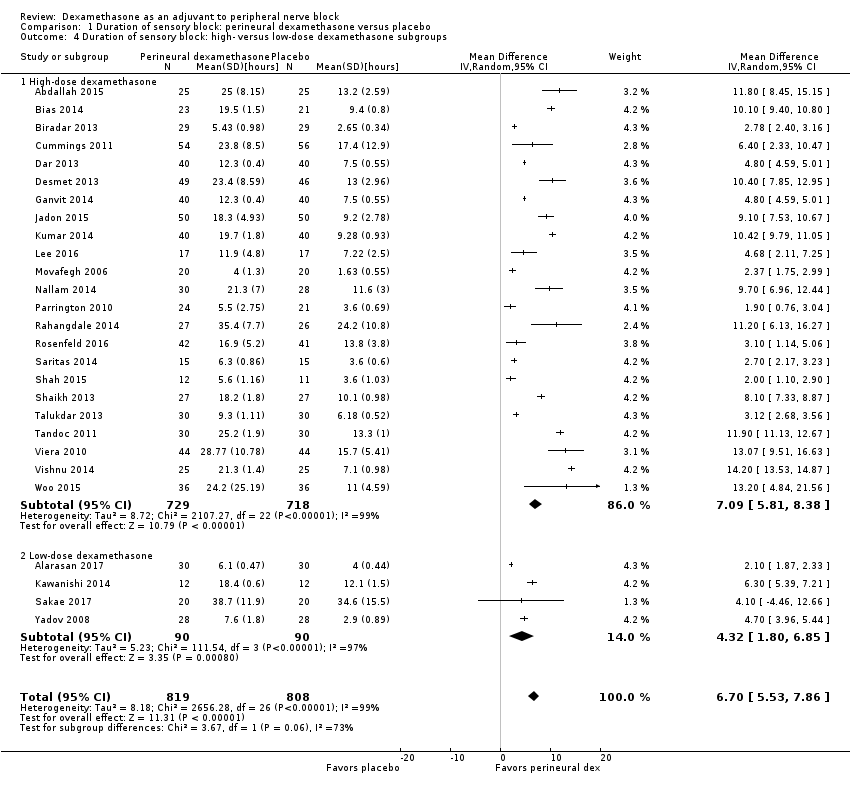
Comparison 1 Duration of sensory block: perineural dexamethasone versus placebo, Outcome 4 Duration of sensory block: high‐ versus low‐dose dexamethasone subgroups.
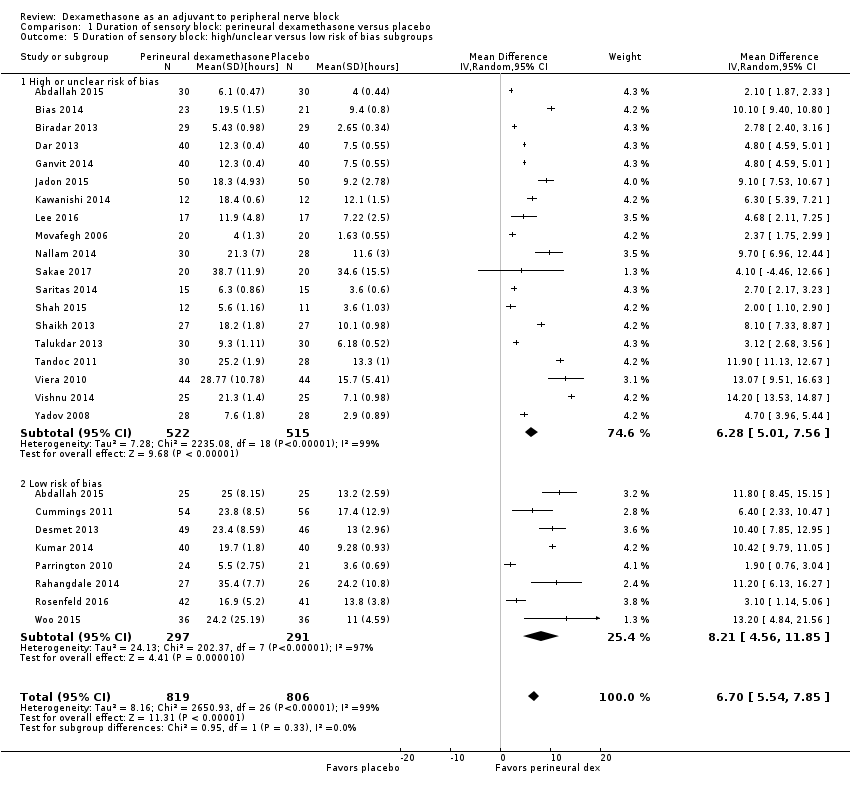
Comparison 1 Duration of sensory block: perineural dexamethasone versus placebo, Outcome 5 Duration of sensory block: high/unclear versus low risk of bias subgroups.
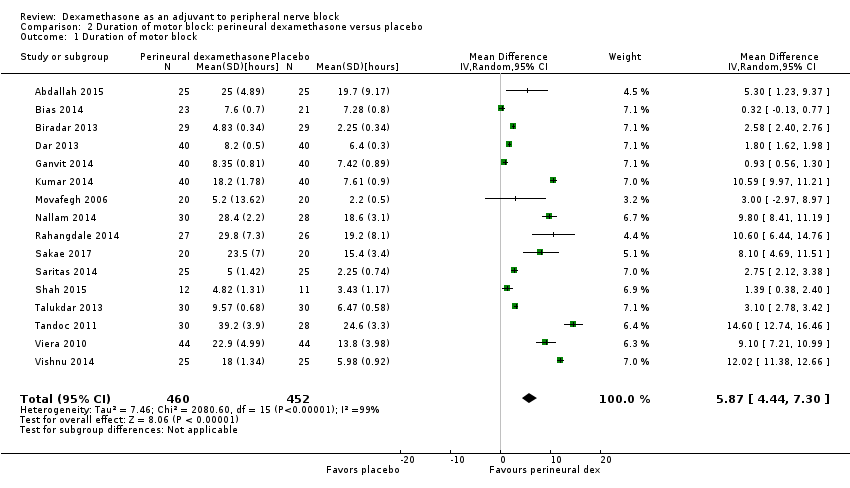
Comparison 2 Duration of motor block: perineural dexamethasone versus placebo, Outcome 1 Duration of motor block.
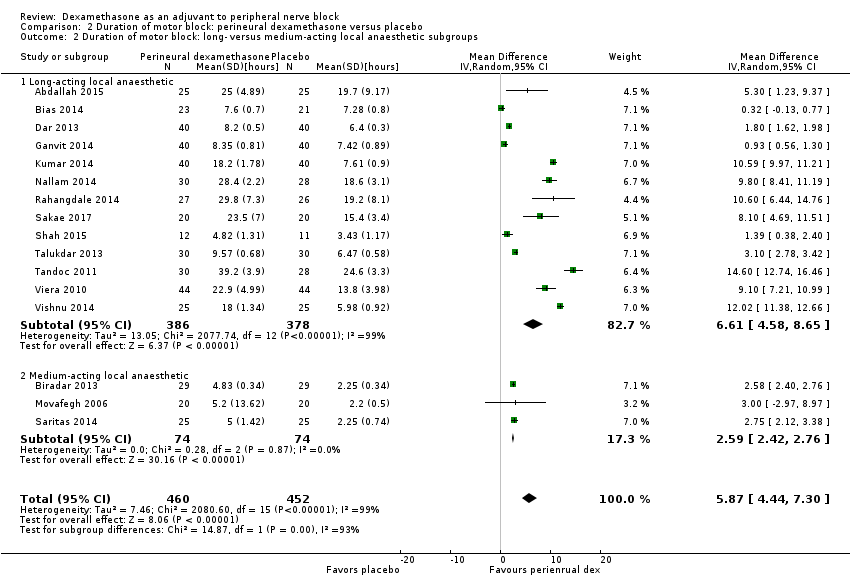
Comparison 2 Duration of motor block: perineural dexamethasone versus placebo, Outcome 2 Duration of motor block: long‐ versus medium‐acting local anaesthetic subgroups.

Comparison 2 Duration of motor block: perineural dexamethasone versus placebo, Outcome 3 Duration of motor block: additives verus no additives subgroups.

Comparison 2 Duration of motor block: perineural dexamethasone versus placebo, Outcome 4 Duration of motor block: high‐ versus low‐dose dexamethasone subgroups.
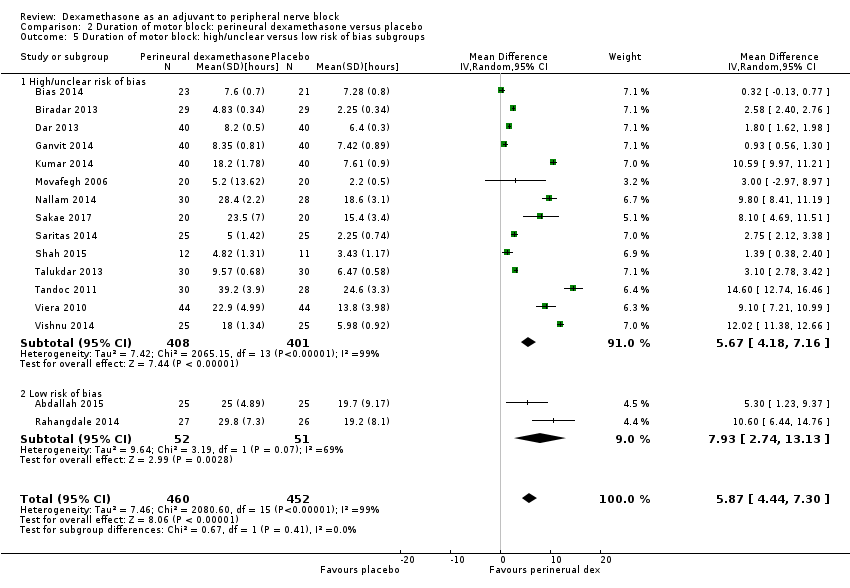
Comparison 2 Duration of motor block: perineural dexamethasone versus placebo, Outcome 5 Duration of motor block: high/unclear versus low risk of bias subgroups.
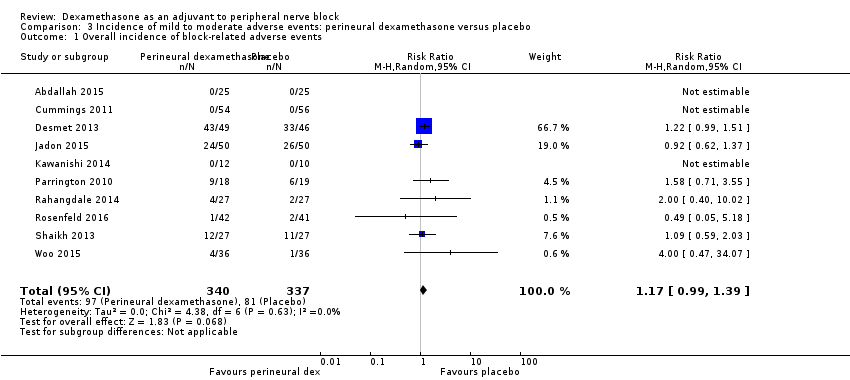
Comparison 3 Incidence of mild to moderate adverse events: perineural dexamethasone versus placebo, Outcome 1 Overall incidence of block‐related adverse events.

Comparison 3 Incidence of mild to moderate adverse events: perineural dexamethasone versus placebo, Outcome 2 Numbness/tingling 14 days after surgery.

Comparison 3 Incidence of mild to moderate adverse events: perineural dexamethasone versus placebo, Outcome 3 Residual motor block/weakness 24 hours after surgery.

Comparison 3 Incidence of mild to moderate adverse events: perineural dexamethasone versus placebo, Outcome 4 Horner Syndrome.

Comparison 3 Incidence of mild to moderate adverse events: perineural dexamethasone versus placebo, Outcome 5 Hoarseness.

Comparison 3 Incidence of mild to moderate adverse events: perineural dexamethasone versus placebo, Outcome 6 Diaphragmatic paresis.

Comparison 3 Incidence of mild to moderate adverse events: perineural dexamethasone versus placebo, Outcome 7 Dyspnoea.

Comparison 3 Incidence of mild to moderate adverse events: perineural dexamethasone versus placebo, Outcome 8 Vascular injury.

Comparison 3 Incidence of mild to moderate adverse events: perineural dexamethasone versus placebo, Outcome 9 Cranial nerve 12 palsy.

Comparison 3 Incidence of mild to moderate adverse events: perineural dexamethasone versus placebo, Outcome 10 Bruising.
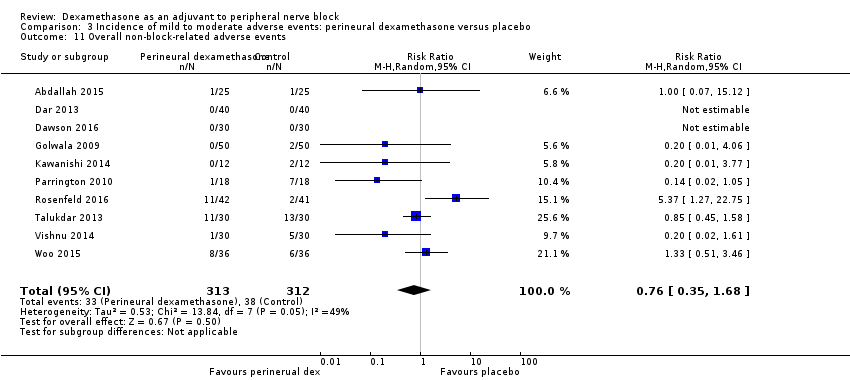
Comparison 3 Incidence of mild to moderate adverse events: perineural dexamethasone versus placebo, Outcome 11 Overall non‐block‐related adverse events.

Comparison 3 Incidence of mild to moderate adverse events: perineural dexamethasone versus placebo, Outcome 12 Postoperative nausea and vomiting.

Comparison 3 Incidence of mild to moderate adverse events: perineural dexamethasone versus placebo, Outcome 13 Deep sedation.

Comparison 3 Incidence of mild to moderate adverse events: perineural dexamethasone versus placebo, Outcome 14 Dermatological symptoms (pruritus/rash).
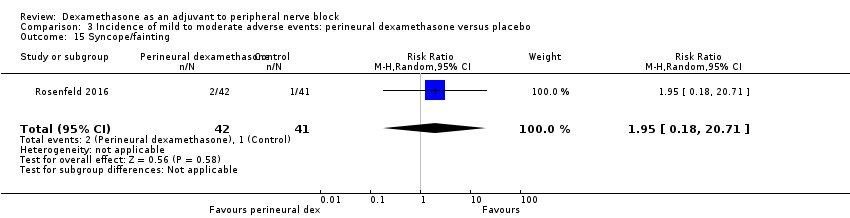
Comparison 3 Incidence of mild to moderate adverse events: perineural dexamethasone versus placebo, Outcome 15 Syncope/fainting.

Comparison 3 Incidence of mild to moderate adverse events: perineural dexamethasone versus placebo, Outcome 16 Bradycardia.

Comparison 3 Incidence of mild to moderate adverse events: perineural dexamethasone versus placebo, Outcome 17 Hypotension.

Comparison 3 Incidence of mild to moderate adverse events: perineural dexamethasone versus placebo, Outcome 18 Headache/10‐pound fluid gain/diarrhoea/frequent urination/muscle soreness.
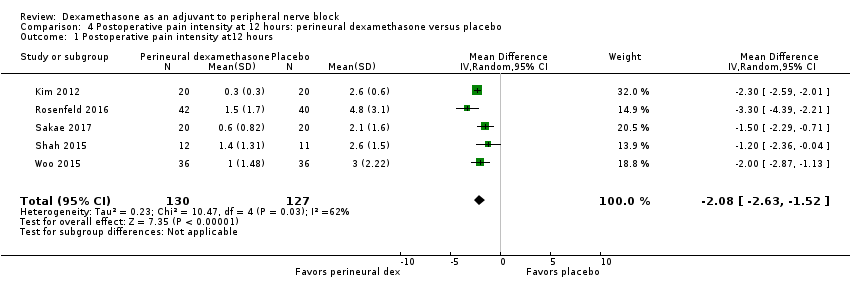
Comparison 4 Postoperative pain intensity at 12 hours: perineural dexamethasone versus placebo, Outcome 1 Postoperative pain intensity at12 hours.
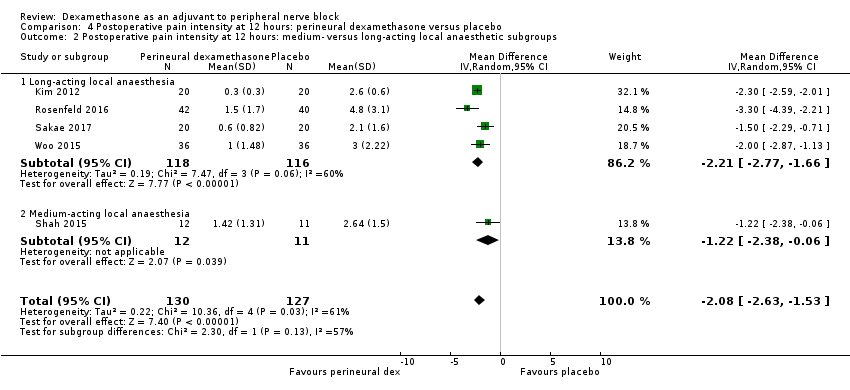
Comparison 4 Postoperative pain intensity at 12 hours: perineural dexamethasone versus placebo, Outcome 2 Postoperative pain intensity at 12 hours: medium‐ versus long‐acting local anaesthetic subgroups.
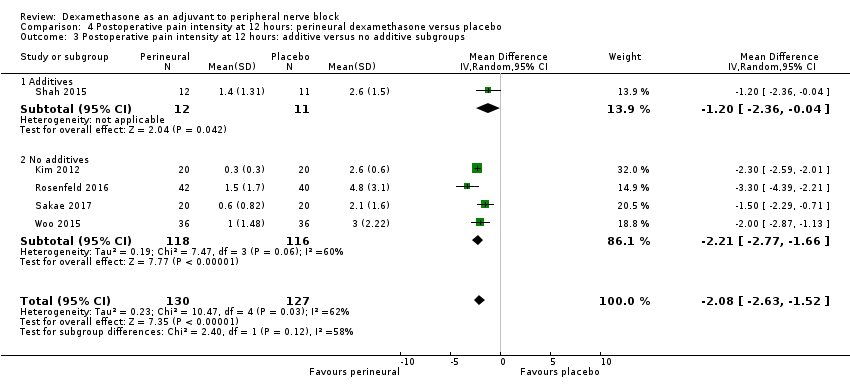
Comparison 4 Postoperative pain intensity at 12 hours: perineural dexamethasone versus placebo, Outcome 3 Postoperative pain intensity at 12 hours: additive versus no additive subgroups.

Comparison 4 Postoperative pain intensity at 12 hours: perineural dexamethasone versus placebo, Outcome 4 Postoperative pain intensity at 12 hours: high‐ versus low‐dose dexamethasone subgroups.
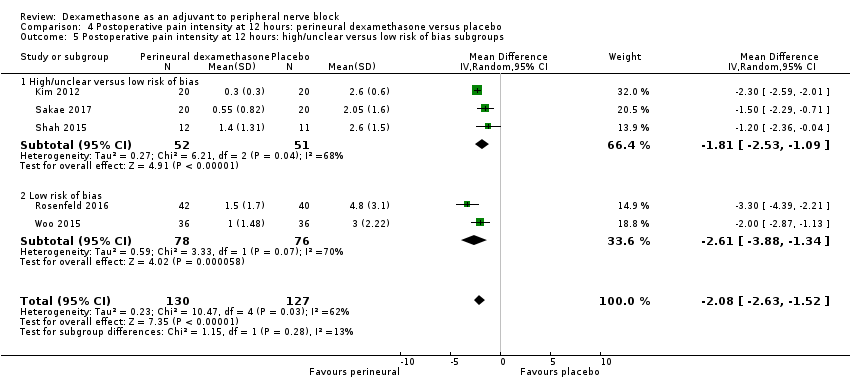
Comparison 4 Postoperative pain intensity at 12 hours: perineural dexamethasone versus placebo, Outcome 5 Postoperative pain intensity at 12 hours: high/unclear versus low risk of bias subgroups.

Comparison 5 Postoperative pain intensity at 24 hours: perineural dexamethasone versus placebo, Outcome 1 Postoperative pain intensity at 24 hours.

Comparison 5 Postoperative pain intensity at 24 hours: perineural dexamethasone versus placebo, Outcome 2 Postoperative pain intensity at 24 hours: long‐ versus medium‐acting local anaesthetic subgroups.
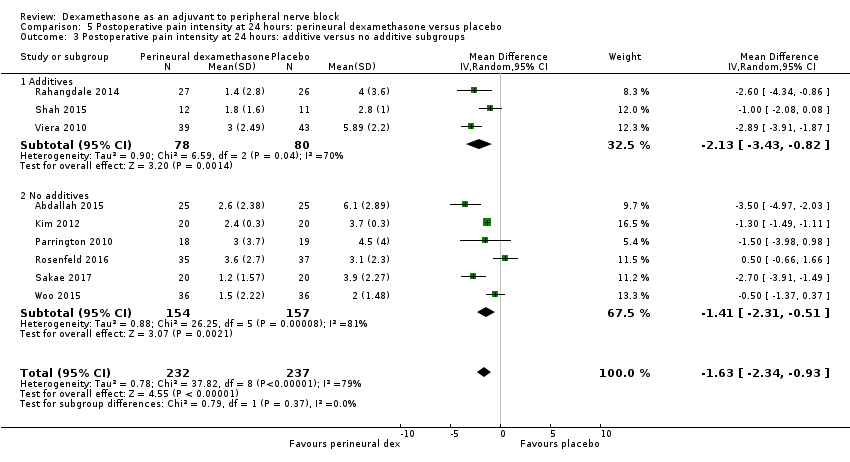
Comparison 5 Postoperative pain intensity at 24 hours: perineural dexamethasone versus placebo, Outcome 3 Postoperative pain intensity at 24 hours: additive versus no additive subgroups.
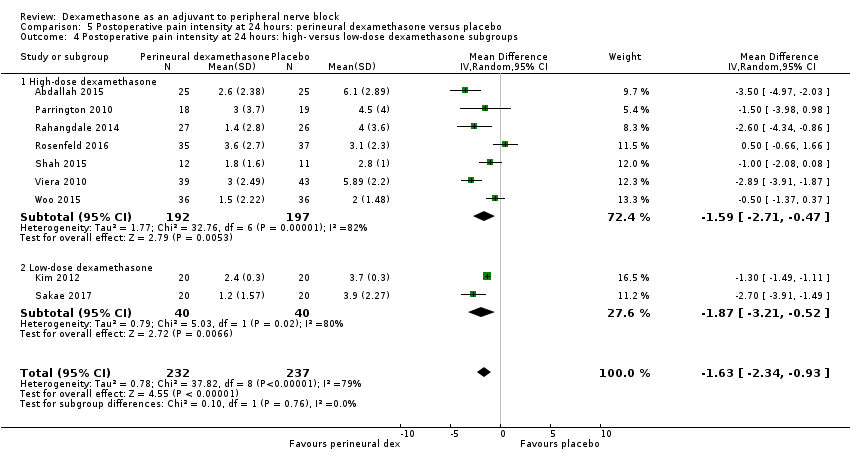
Comparison 5 Postoperative pain intensity at 24 hours: perineural dexamethasone versus placebo, Outcome 4 Postoperative pain intensity at 24 hours: high‐ versus low‐dose dexamethasone subgroups.
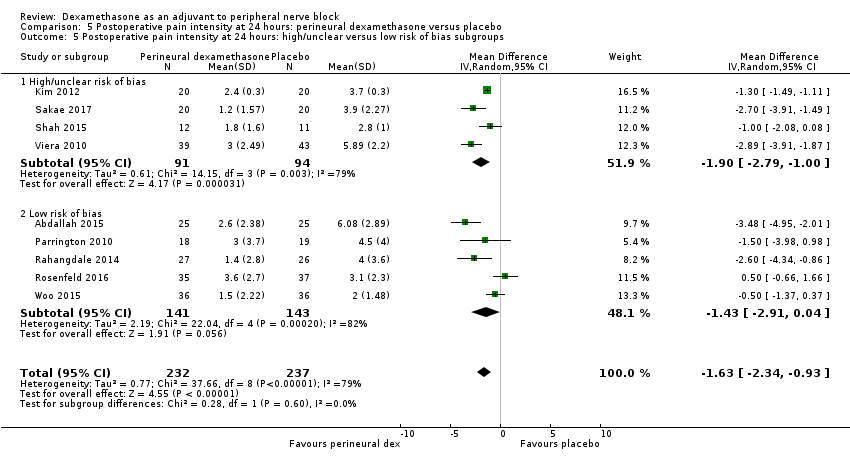
Comparison 5 Postoperative pain intensity at 24 hours: perineural dexamethasone versus placebo, Outcome 5 Postoperative pain intensity at 24 hours: high/unclear versus low risk of bias subgroups.

Comparison 6 Postoperative pain intensity at 48 hours: perineural dexamethasone versus placebo, Outcome 1 Postoperative pain intensity at 48 hours.

Comparison 6 Postoperative pain intensity at 48 hours: perineural dexamethasone versus placebo, Outcome 2 Postoperative pain intensity at 48 hours: additives versus no additives subgroups.
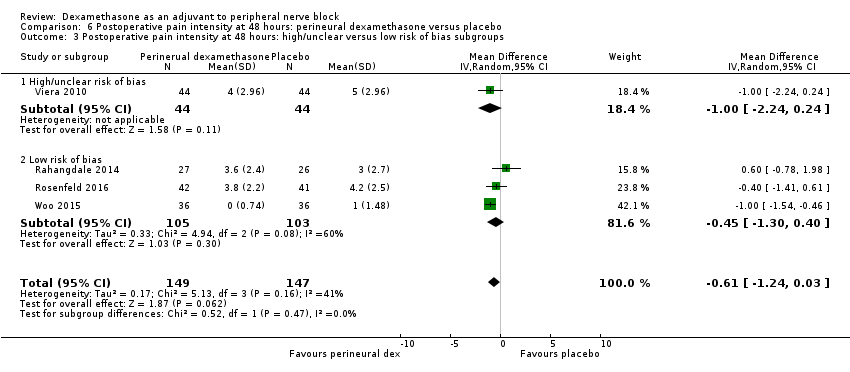
Comparison 6 Postoperative pain intensity at 48 hours: perineural dexamethasone versus placebo, Outcome 3 Postoperative pain intensity at 48 hours: high/unclear versus low risk of bias subgroups.
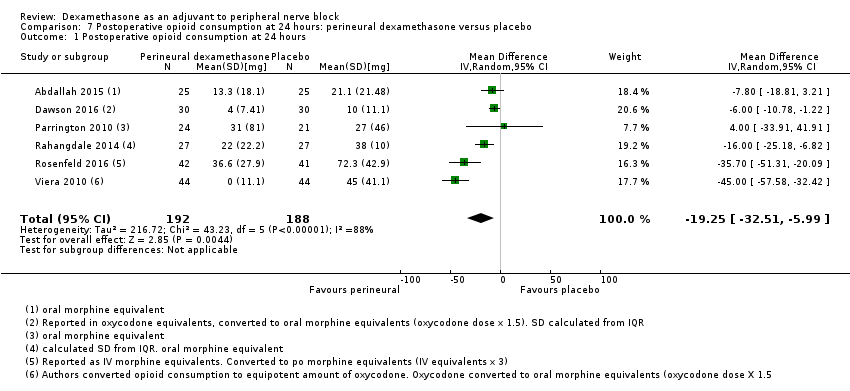
Comparison 7 Postoperative opioid consumption at 24 hours: perineural dexamethasone versus placebo, Outcome 1 Postoperative opioid consumption at 24 hours.

Comparison 7 Postoperative opioid consumption at 24 hours: perineural dexamethasone versus placebo, Outcome 2 Opioid consumption at 24 hours medium‐ versus long‐acting local anaesthetic subgroups.

Comparison 7 Postoperative opioid consumption at 24 hours: perineural dexamethasone versus placebo, Outcome 3 Opioid consumption at 24 hours: additive versus no additive subgroups.
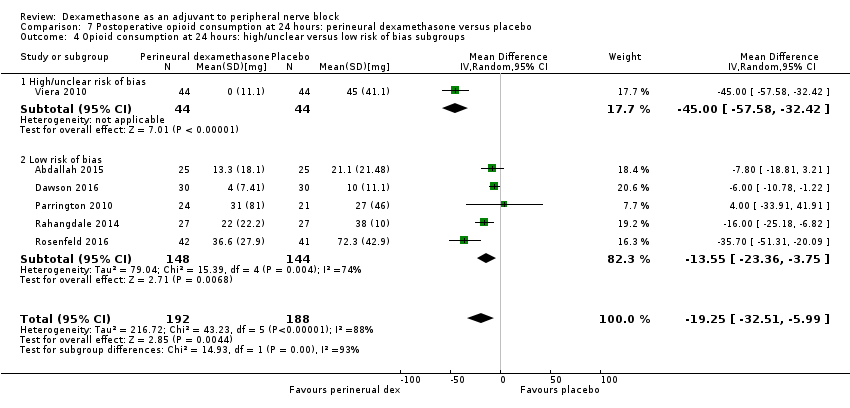
Comparison 7 Postoperative opioid consumption at 24 hours: perineural dexamethasone versus placebo, Outcome 4 Opioid consumption at 24 hours: high/unclear versus low risk of bias subgroups.
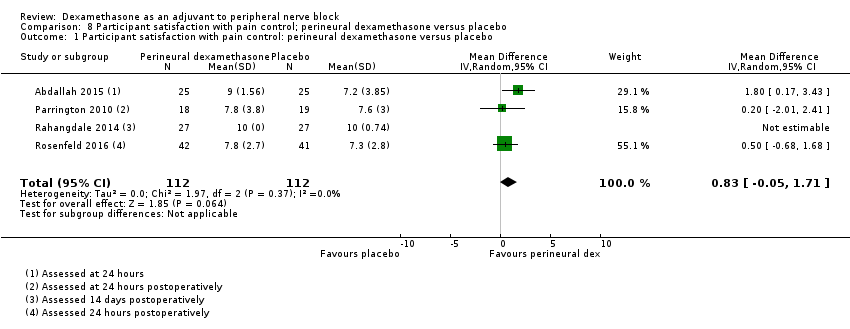
Comparison 8 Participant satisfaction with pain control; perineural dexamethasone versus placebo, Outcome 1 Participant satisfaction with pain control: perineural dexamethasone versus placebo.
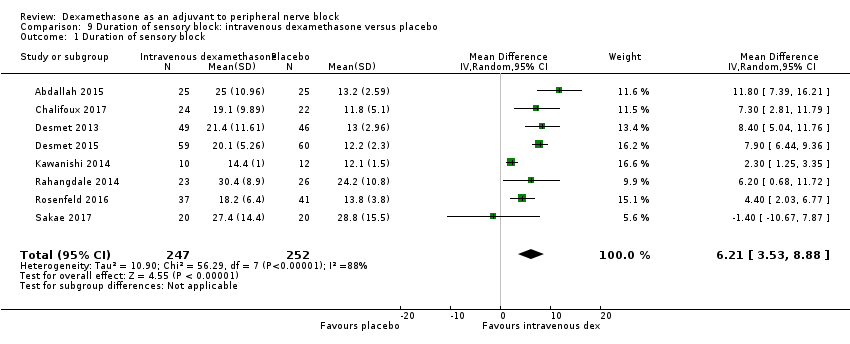
Comparison 9 Duration of sensory block: intravenous dexamethasone versus placebo, Outcome 1 Duration of sensory block.
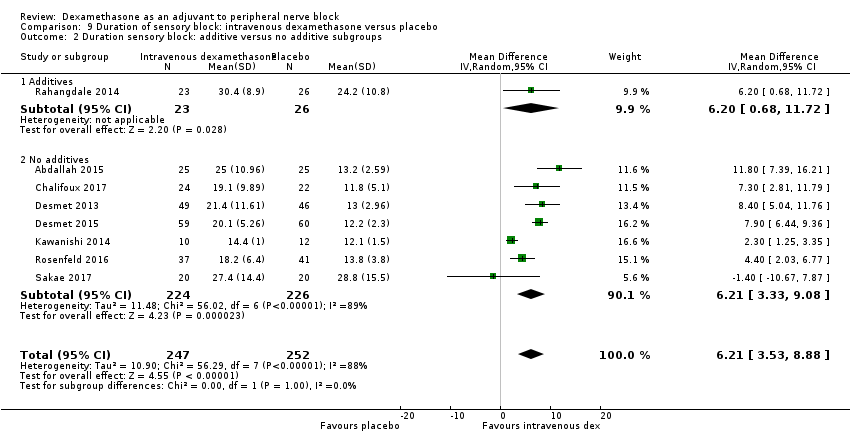
Comparison 9 Duration of sensory block: intravenous dexamethasone versus placebo, Outcome 2 Duration sensory block: additive versus no additive subgroups.

Comparison 9 Duration of sensory block: intravenous dexamethasone versus placebo, Outcome 3 Duration of sensory block: high‐ versus low‐dose dexamethasone subgroups.
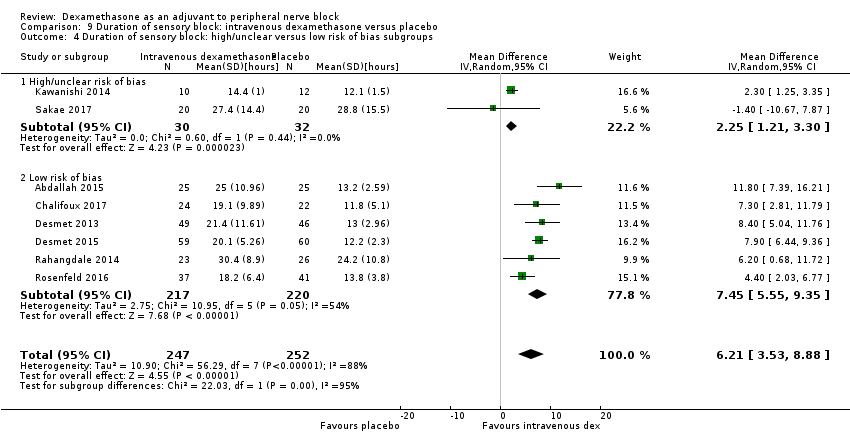
Comparison 9 Duration of sensory block: intravenous dexamethasone versus placebo, Outcome 4 Duration of sensory block: high/unclear versus low risk of bias subgroups.

Comparison 10 Duration of motor block: intravenous dexamethasone versus placebo, Outcome 1 Duration of motor block.

Comparison 10 Duration of motor block: intravenous dexamethasone versus placebo, Outcome 2 Duration of motor block: additive versus no additive subgroups.
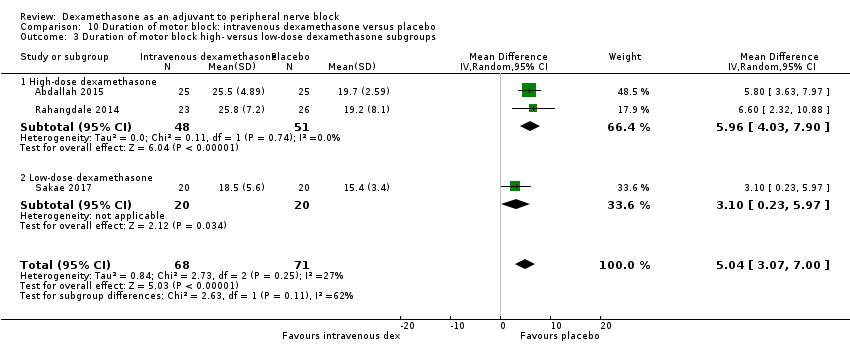
Comparison 10 Duration of motor block: intravenous dexamethasone versus placebo, Outcome 3 Duration of motor block high‐ versus low‐dose dexamethasone subgroups.
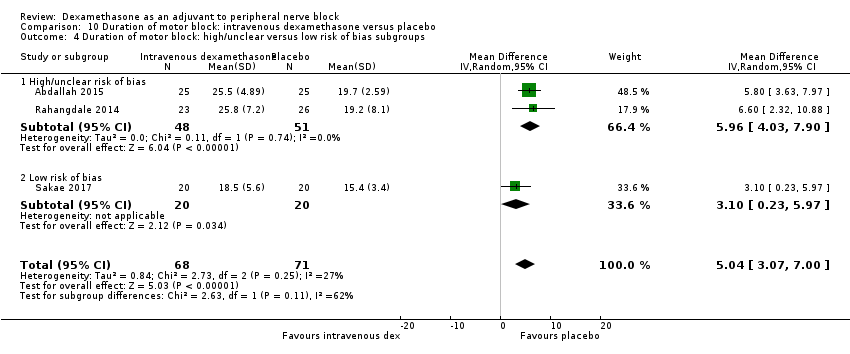
Comparison 10 Duration of motor block: intravenous dexamethasone versus placebo, Outcome 4 Duration of motor block: high/unclear versus low risk of bias subgroups.
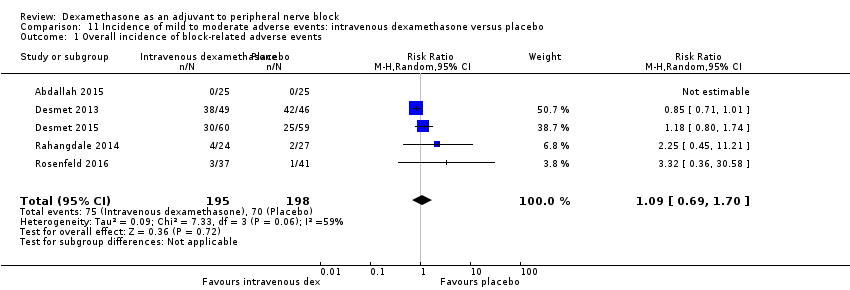
Comparison 11 Incidence of mild to moderate adverse events: intravenous dexamethasone versus placebo, Outcome 1 Overall incidence of block‐related adverse events.

Comparison 11 Incidence of mild to moderate adverse events: intravenous dexamethasone versus placebo, Outcome 2 Numbness/tingling 14 days after surgery.

Comparison 11 Incidence of mild to moderate adverse events: intravenous dexamethasone versus placebo, Outcome 3 Residual motor block/muscle weakness 24 hours after surgery.

Comparison 11 Incidence of mild to moderate adverse events: intravenous dexamethasone versus placebo, Outcome 4 Horner syndrome.
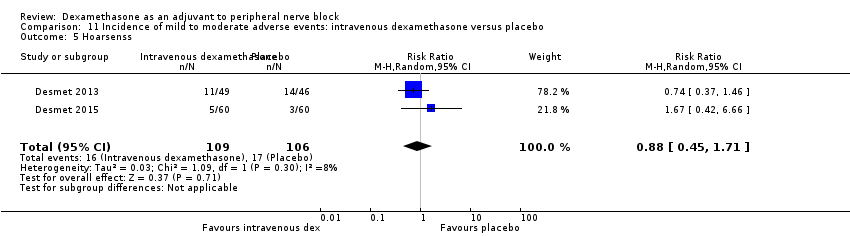
Comparison 11 Incidence of mild to moderate adverse events: intravenous dexamethasone versus placebo, Outcome 5 Hoarsenss.
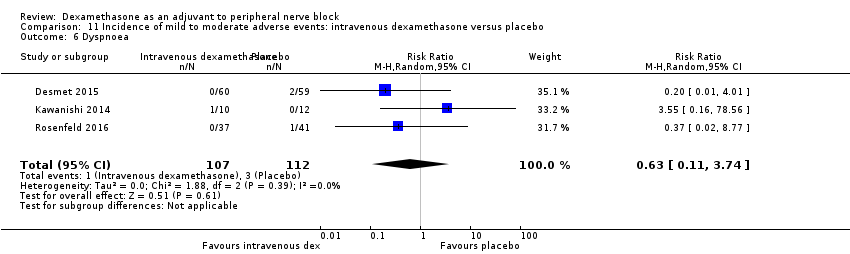
Comparison 11 Incidence of mild to moderate adverse events: intravenous dexamethasone versus placebo, Outcome 6 Dyspnoea.
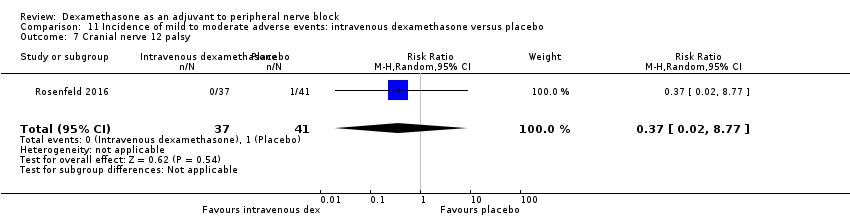
Comparison 11 Incidence of mild to moderate adverse events: intravenous dexamethasone versus placebo, Outcome 7 Cranial nerve 12 palsy.
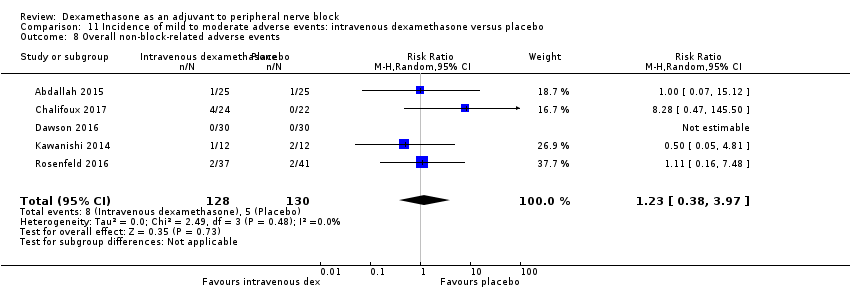
Comparison 11 Incidence of mild to moderate adverse events: intravenous dexamethasone versus placebo, Outcome 8 Overall non‐block‐related adverse events.
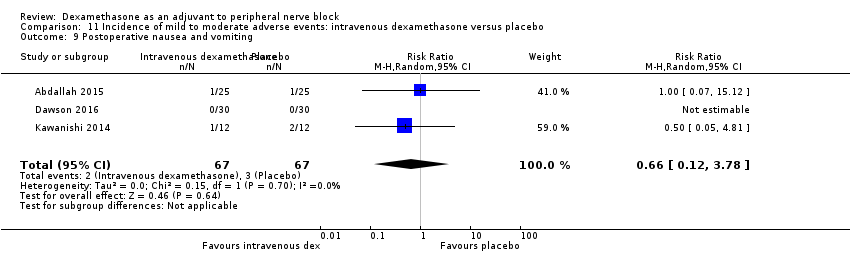
Comparison 11 Incidence of mild to moderate adverse events: intravenous dexamethasone versus placebo, Outcome 9 Postoperative nausea and vomiting.

Comparison 11 Incidence of mild to moderate adverse events: intravenous dexamethasone versus placebo, Outcome 10 Dermatological symptoms.

Comparison 11 Incidence of mild to moderate adverse events: intravenous dexamethasone versus placebo, Outcome 11 Dizziness/wrist, hand or finger pain, constipation.
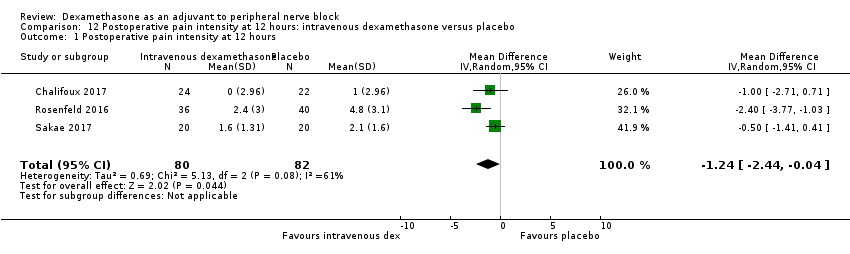
Comparison 12 Postoperative pain intensity at 12 hours: intravenous dexamethasone versus placebo, Outcome 1 Postoperative pain intensity at 12 hours.
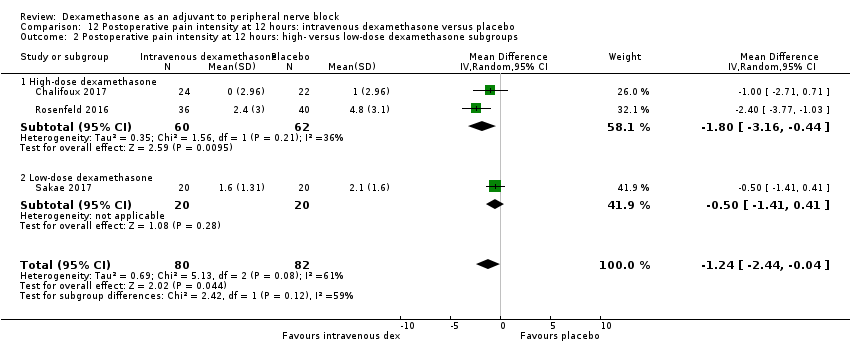
Comparison 12 Postoperative pain intensity at 12 hours: intravenous dexamethasone versus placebo, Outcome 2 Postoperative pain intensity at 12 hours: high‐ versus low‐dose dexamethasone subgroups.
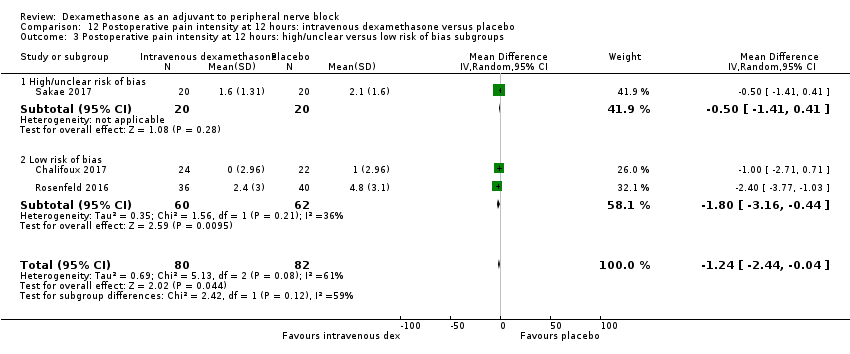
Comparison 12 Postoperative pain intensity at 12 hours: intravenous dexamethasone versus placebo, Outcome 3 Postoperative pain intensity at 12 hours: high/unclear versus low risk of bias subgroups.

Comparison 13 Postoperative pain intensity at 24 hours: intravenous dexamethasone versus placebo, Outcome 1 Postoperative pain intensity at 24 hours.

Comparison 13 Postoperative pain intensity at 24 hours: intravenous dexamethasone versus placebo, Outcome 2 Postoperative pain intensity at 24 hours: additive versus no additive subgroups.

Comparison 13 Postoperative pain intensity at 24 hours: intravenous dexamethasone versus placebo, Outcome 3 Postoperative pain intensity at 24 hours: high‐ versus low‐dose dexamethasone subgroups.
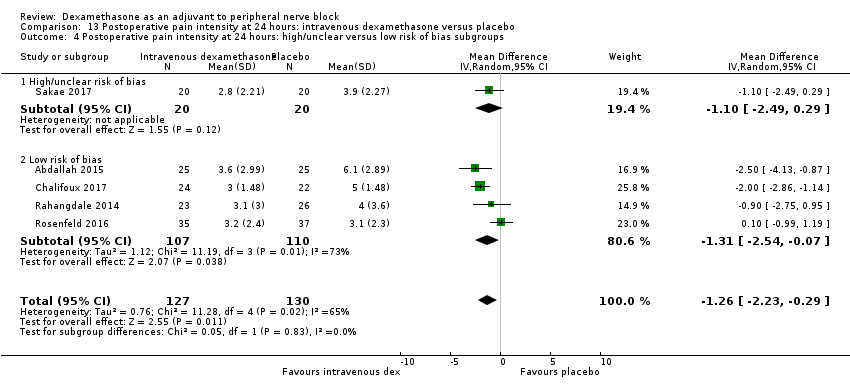
Comparison 13 Postoperative pain intensity at 24 hours: intravenous dexamethasone versus placebo, Outcome 4 Postoperative pain intensity at 24 hours: high/unclear versus low risk of bias subgroups.

Comparison 14 Postoperative pain intensity at 48 hours: intravenous dexamethasone versus placebo, Outcome 1 Postoperative pain intensity at 48 hours.

Comparison 14 Postoperative pain intensity at 48 hours: intravenous dexamethasone versus placebo, Outcome 2 Postoperative pain intensity at 48 hours: additive versus no additive subgroups.

Comparison 15 Postoperative opioid consumption at 24 hours: intravenous dexamethasone versus placebo, Outcome 1 24‐hour opioid consumption.
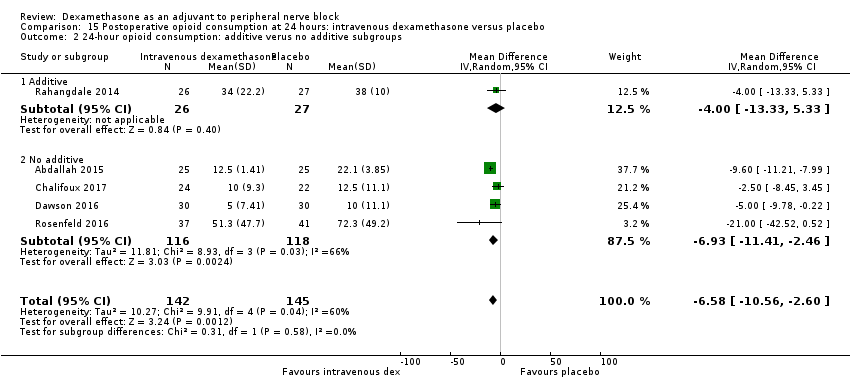
Comparison 15 Postoperative opioid consumption at 24 hours: intravenous dexamethasone versus placebo, Outcome 2 24‐hour opioid consumption: additive verus no additive subgroups.
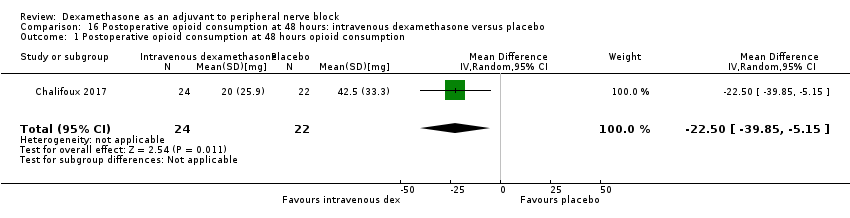
Comparison 16 Postoperative opioid consumption at 48 hours: intravenous dexamethasone versus placebo, Outcome 1 Postoperative opioid consumption at 48 hours opioid consumption.
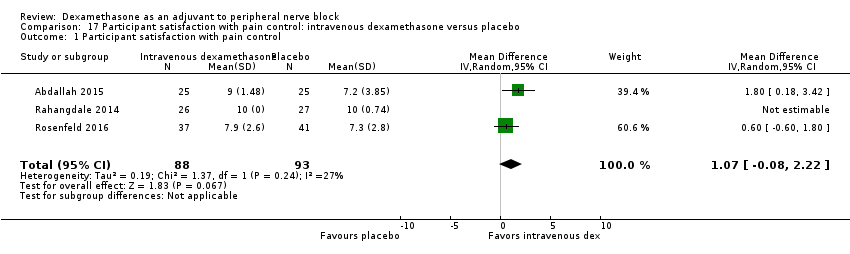
Comparison 17 Participant satisfaction with pain control: intravenous dexamethasone versus placebo, Outcome 1 Participant satisfaction with pain control.

Comparison 18 Duration of sensory block: perineural versus intravenous dexamethasone, Outcome 1 Duration of sensory block.
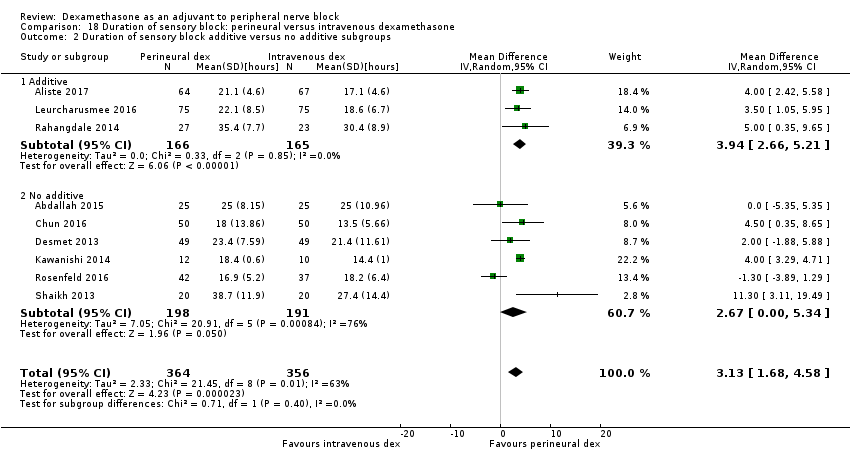
Comparison 18 Duration of sensory block: perineural versus intravenous dexamethasone, Outcome 2 Duration of sensory block additive versus no additive subgroups.

Comparison 18 Duration of sensory block: perineural versus intravenous dexamethasone, Outcome 3 Duration sensory block high‐dose versus low‐dose dexamethasone subgroups.

Comparison 18 Duration of sensory block: perineural versus intravenous dexamethasone, Outcome 4 Duration sensory block high/unclear versus low risk of bias subgroups.
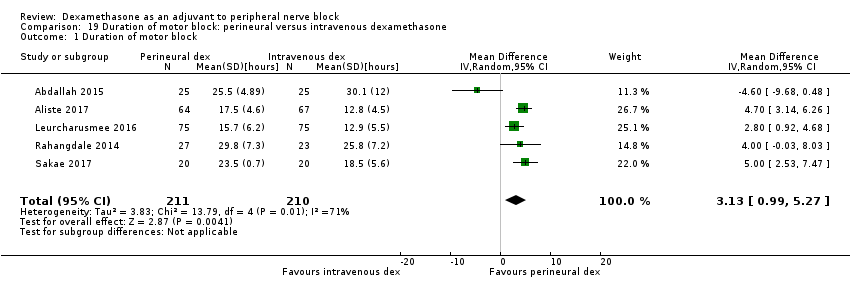
Comparison 19 Duration of motor block: perineural versus intravenous dexamethasone, Outcome 1 Duration of motor block.

Comparison 19 Duration of motor block: perineural versus intravenous dexamethasone, Outcome 2 Duration of motor block: additive versus no additive subgroups.

Comparison 19 Duration of motor block: perineural versus intravenous dexamethasone, Outcome 3 Duration of motor block: high‐ versus low‐dose dexamethasone subgroups.
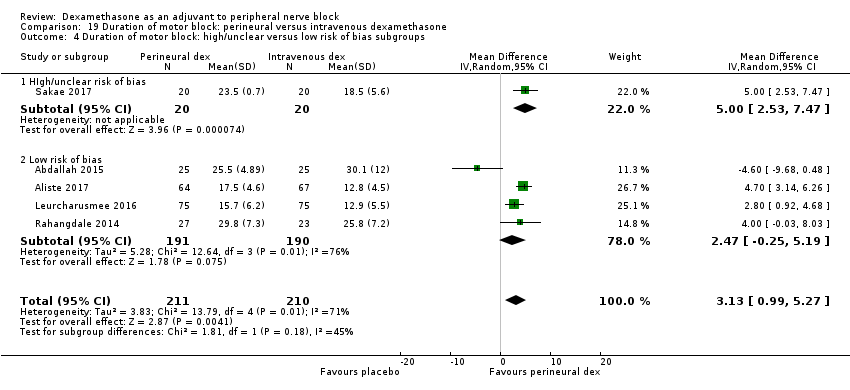
Comparison 19 Duration of motor block: perineural versus intravenous dexamethasone, Outcome 4 Duration of motor block: high/unclear versus low risk of bias subgroups.

Comparison 20 Incidence of mild to moderate adverse events: perineural versus intravenous dexamethasone, Outcome 1 Overall incidence of block‐related adverse events.
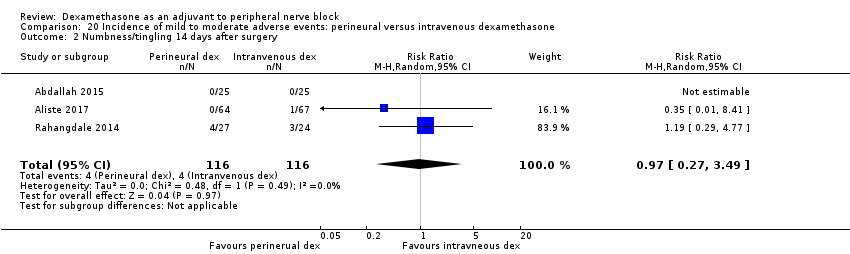
Comparison 20 Incidence of mild to moderate adverse events: perineural versus intravenous dexamethasone, Outcome 2 Numbness/tingling 14 days after surgery.

Comparison 20 Incidence of mild to moderate adverse events: perineural versus intravenous dexamethasone, Outcome 3 Residual motor block/weakness at 24 hours.
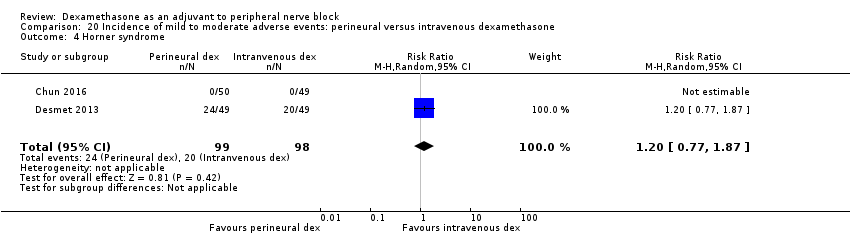
Comparison 20 Incidence of mild to moderate adverse events: perineural versus intravenous dexamethasone, Outcome 4 Horner syndrome.

Comparison 20 Incidence of mild to moderate adverse events: perineural versus intravenous dexamethasone, Outcome 5 Hoarsness.

Comparison 20 Incidence of mild to moderate adverse events: perineural versus intravenous dexamethasone, Outcome 6 Cranial nerve 12 motor palsy.
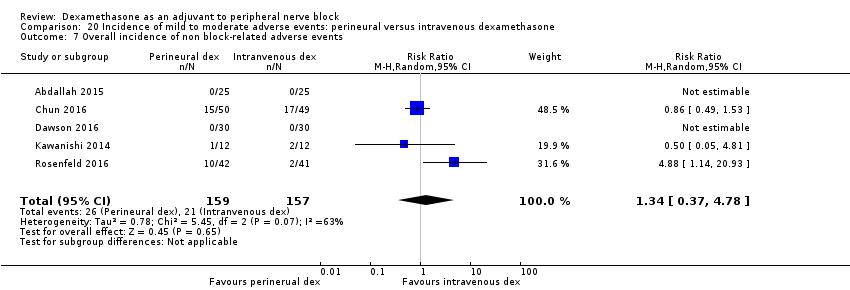
Comparison 20 Incidence of mild to moderate adverse events: perineural versus intravenous dexamethasone, Outcome 7 Overall incidence of non block‐related adverse events.
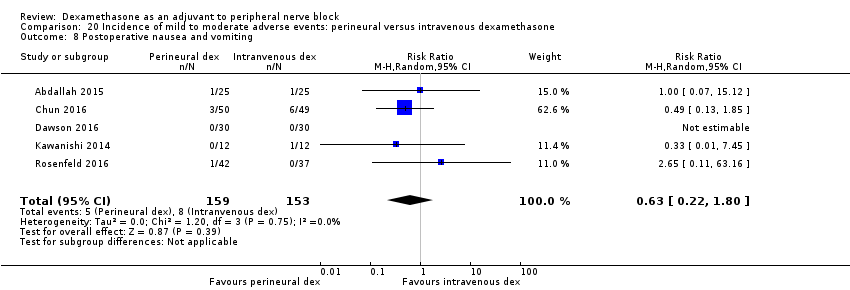
Comparison 20 Incidence of mild to moderate adverse events: perineural versus intravenous dexamethasone, Outcome 8 Postoperative nausea and vomiting.

Comparison 20 Incidence of mild to moderate adverse events: perineural versus intravenous dexamethasone, Outcome 9 Dermatologicial symptoms (pruritus/rash).

Comparison 20 Incidence of mild to moderate adverse events: perineural versus intravenous dexamethasone, Outcome 10 Syncope/fainting.

Comparison 20 Incidence of mild to moderate adverse events: perineural versus intravenous dexamethasone, Outcome 11 Dizziness.

Comparison 20 Incidence of mild to moderate adverse events: perineural versus intravenous dexamethasone, Outcome 12 Wrist, hand or finger pain.
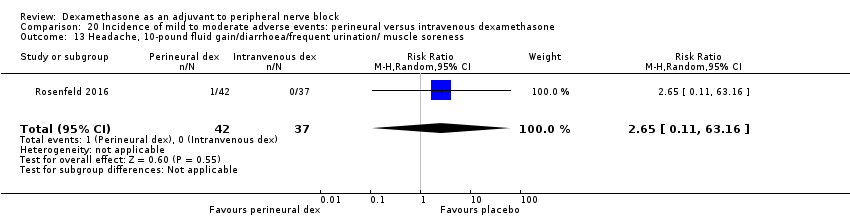
Comparison 20 Incidence of mild to moderate adverse events: perineural versus intravenous dexamethasone, Outcome 13 Headache, 10‐pound fluid gain/diarrhoea/frequent urination/ muscle soreness.
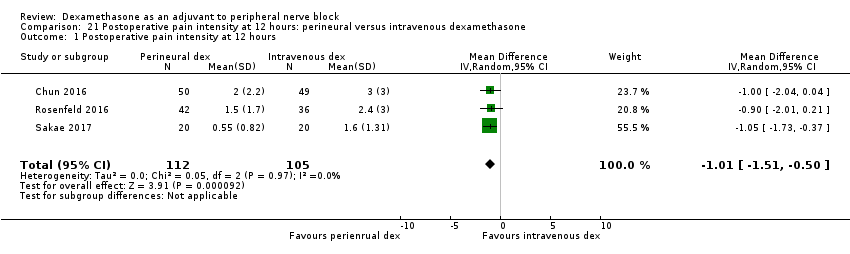
Comparison 21 Postoperative pain intensity at 12 hours: perineural versus intravenous dexamethasone, Outcome 1 Postoperative pain intensity at 12 hours.

Comparison 21 Postoperative pain intensity at 12 hours: perineural versus intravenous dexamethasone, Outcome 2 Postoperative pain intensity at 12 hours: low‐ versus high‐dose dexamethasone subgroups.
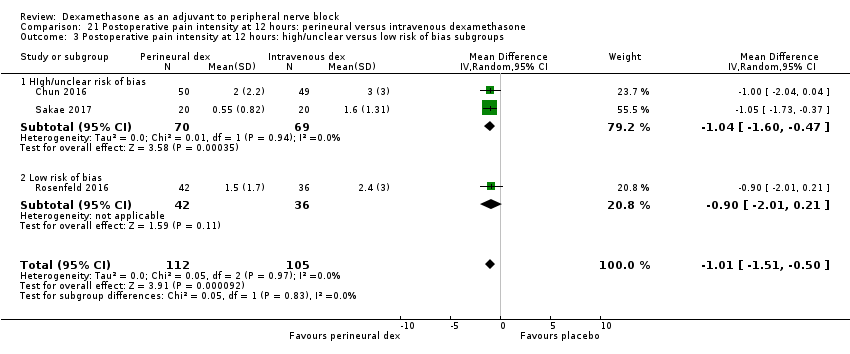
Comparison 21 Postoperative pain intensity at 12 hours: perineural versus intravenous dexamethasone, Outcome 3 Postoperative pain intensity at 12 hours: high/unclear versus low risk of bias subgroups.
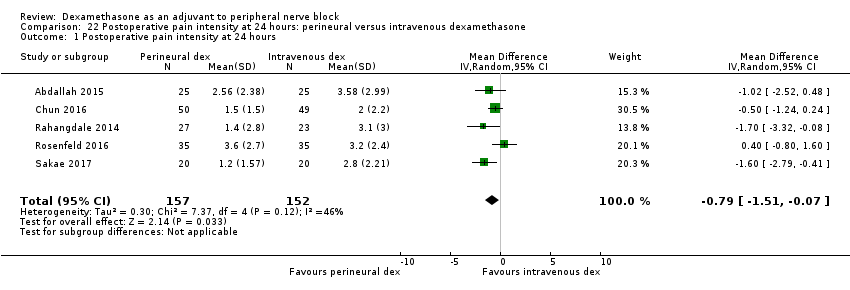
Comparison 22 Postoperative pain intensity at 24 hours: perineural versus intravenous dexamethasone, Outcome 1 Postoperative pain intensity at 24 hours.
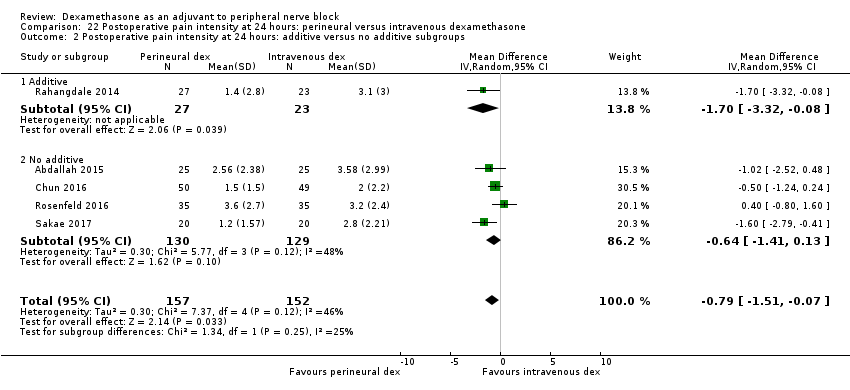
Comparison 22 Postoperative pain intensity at 24 hours: perineural versus intravenous dexamethasone, Outcome 2 Postoperative pain intensity at 24 hours: additive versus no additive subgroups.
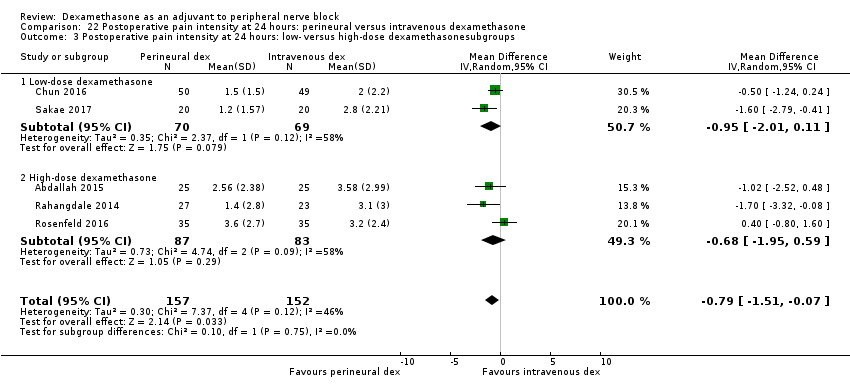
Comparison 22 Postoperative pain intensity at 24 hours: perineural versus intravenous dexamethasone, Outcome 3 Postoperative pain intensity at 24 hours: low‐ versus high‐dose dexamethasonesubgroups.

Comparison 22 Postoperative pain intensity at 24 hours: perineural versus intravenous dexamethasone, Outcome 4 Intensity of postoperative pain at 24 hours: high/unclear risk of bias versus low risk of bias subgroups.

Comparison 23 Postoperative pain intensity at 48 hours: perineural versus intravenous dexamethasone, Outcome 1 Postoperative pain intensity at 48 hours.
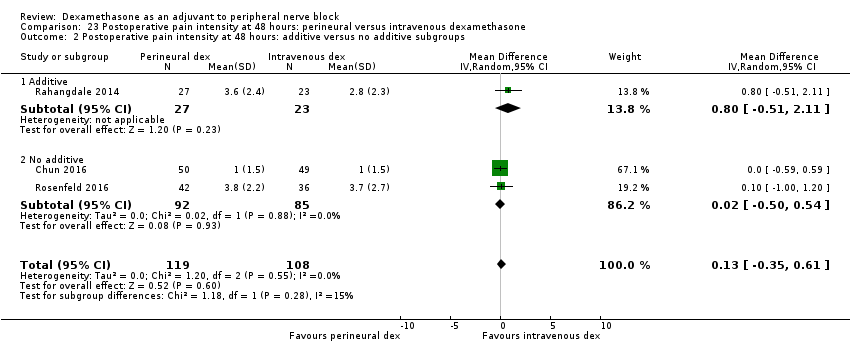
Comparison 23 Postoperative pain intensity at 48 hours: perineural versus intravenous dexamethasone, Outcome 2 Postoperative pain intensity at 48 hours: additive versus no additive subgroups.
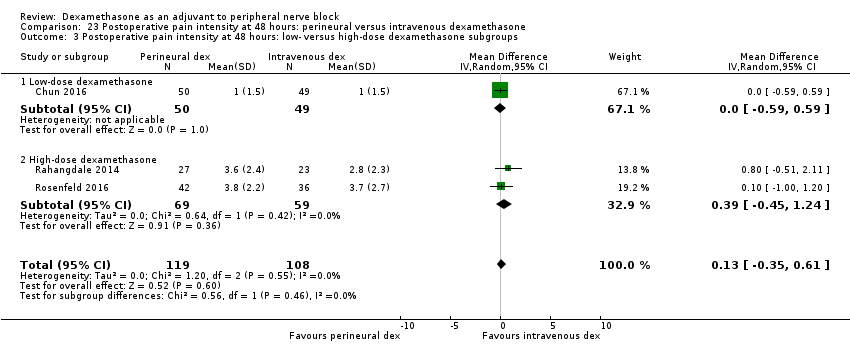
Comparison 23 Postoperative pain intensity at 48 hours: perineural versus intravenous dexamethasone, Outcome 3 Postoperative pain intensity at 48 hours: low‐ versus high‐dose dexamethasone subgroups.

Comparison 23 Postoperative pain intensity at 48 hours: perineural versus intravenous dexamethasone, Outcome 4 Postoperative pain intensity at 48 hours: high/unclear versus low risk of bias subgroups.
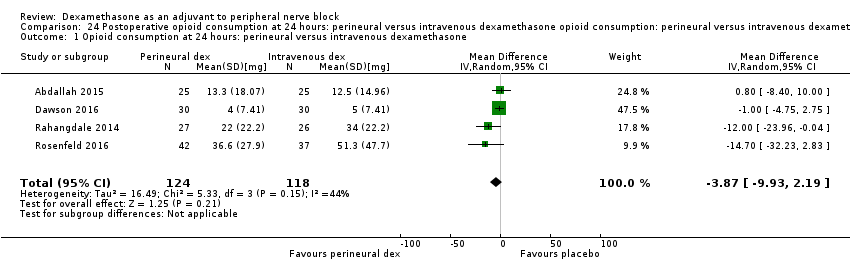
Comparison 24 Postoperative opioid consumption at 24 hours: perineural versus intravenous dexamethasone opioid consumption: perineural versus intravenous dexamethasone subgroups, Outcome 1 Opioid consumption at 24 hours: perineural versus intravenous dexamethasone.

Comparison 24 Postoperative opioid consumption at 24 hours: perineural versus intravenous dexamethasone opioid consumption: perineural versus intravenous dexamethasone subgroups, Outcome 2 24‐hour opioid consumption: additive versus no additive subgroups.

Comparison 25 Participant satisfaction with pain control: perineural versus intravenous dexamethasone, Outcome 1 Participant satisfaction with pain control.
| Patient or population: participants undergoing surgery with peripheral nerve block Intervention: perineural dexamethasone Comparison: placebo | ||||
| Outcomes | Anticipated absolute effects* (95% CI) | № of participants | Quality of the evidence | |
| Risk with placebo | Risk with perineural dexamethasone | |||
| Duration of sensory block (we included all studies describing duration of sensory block, regardless of how it was described) | The mean duration of sensory block was 10.2 hours | The mean duration of sensory block in the perineural dexamethasone group was 6.70 hours longer (5.54 longer to 7.85 longer) | 1625 | ⨁⨁◯◯ |
| Incidence of serious adverse events (we used the NIH definition of adverse events. A serious event includes death, a life‐threatening event that requires hospitalization or prolonged hospitalization, disability or congenital anomaly) | In seven studies, authors reported that they assessed for serious adverse events. Five serious adverse events were reported in three studies: one block‐related adverse event (pneumothorax) occurred in one participant in a trial comparing perineural dexamethasone and placebo; however, group allocation was not reported. The remaining non‐block‐related events occurred in two trials comparing perineural dexamethasone, intravenous dexamethasone and placebo. Two participants in the placebo group required hospitalization within one week of surgery; one for a fall, and one for a bowel infection. One participant in the placebo group developed Complex Regional Pain Syndrome Type I and one in the intravenous dexamethasone group developed pneumonia. | 620 (7 RCTs) | ⨁◯◯◯ LOWb | |
| Postoperative pain intensity at 12 hours (assessed by pain scores on an 11‐point VAS) | The mean postoperative pain intensity at 12 hours was 3.0 | The mean postoperative pain score at 12 hours in the perineural dexamethasone group was 2.08 points lower (1.52 lower to 2.63 lower) | 257 | ⨁◯◯◯ LOWc |
| Postoperative pain intensity at 24 hours. (assessed by pain scores on an 11‐point VAS) | The mean postoperative pain intensity at 24 hours was 3.9 | The mean postoperative pain score at 24 hours in the perineural dexamethasone group was 1.63 points lower (0.93 lower to 2.34 lower) | 469 | ⨁⨁◯◯ |
| Postoperative pain intensity at 48 hours (assessed by pain scores on an 11‐point VAS) | The mean postoperative pain intensity at 48 hours was 3.3 | The mean postoperative pain score at 48 hours in the perineural dexamethasone group was 0.61 points lower (1.24 lower to 0.03 higher) | 296 | ⨁⨁◯◯ |
| *The risk in the intervention group (and its 95% confidence interval) is based on the assumed risk in the comparison group and the relative effect of the intervention (and its 95% CI). | ||||
| GRADE Working Group grades of evidence | ||||
| aDowngraded by one level for risk of bias as 19 out of 27 studies are at unclear risk of bias. Reasons include lack of reporting on random sequence generation, concealment allocation, blinding, and attrition bias. Downgraded by one level for inconsistency (I2 = 99%, P value for heterogeneity is < 0.00001) and heterogeneity is not explained by subgroup analyses; point estimates vary widely among studies, confidence intervals show minimal overlap). bDowngraded by one level for risk of bias as four out of the seven studies are at unclear risk of bias. Reasons include lack of reporting on random sequence generation, concealment allocation, blinding, and evidence of selective reporting bias. Downgraded by two levels for imprecision due to very low number of events. c Downgraded by one level for risk of bias. Three out of five studies are at unclear risk of bias. Reasons include lack of reporting on random sequence generation and allocation concealment and evidence of attrition bias, selective reporting bias, and stopping early for benefit. Downgraded by one level for inconsistency (I2 = 61%, P value for heterogeneity is 0.03) and heterogeneity is not explained by subgroup analyses; point estimates vary widely among studies, confidence intervals show minimal overlap dDowngraded by one level for inconsistency (I2 = 80%, P value for heterogeneity is < 0.00001) and heterogeneity is not explained by subgroup analyses; point estimates vary widely across studies. Downgraded by one level for imprecision (95% confidence interval includes no clinical effect and a clinical effect). By no clinical effect we mean the lower bound of the CI did not surpass our chosen MID threshold of 1.2 on VAS. e Downgraded by two levels for imprecision because of a sparse number of participants (n=296) and a very wide confidence interval demonstrating that the treatment effect is not statistically significant and of questionable clinical significance. | ||||
| Patient or population: participants undergoing surgery with peripheral nerve block Intervention: intravenous dexamethasone Comparison: placebo | ||||
| Outcomes | Anticipated absolute effects* (95% CI) | № of participants | Quality of the evidence | |
| Risk with placebo | Risk with intravenous dexamethasone | |||
| Duration of sensory block (we included all studies describing duration of sensory block regardless of how it was described) | The mean duration of sensory block was 16.1 hours | The mean duration of sensory block in the intravenous dexamethasone group was 6.21 hours longer (3.53 longer to 8.88 longer) | 499 | ⨁⨁⨁◯ |
| Incidence of serious adverse events (we used the NIH definition of adverse events. A serious event includes death, a life‐threatening event that requires hospitalization or prolonged hospitalization, disability or congenital anomaly) | Please see incidence of serious adverse events in the perineural dexamethasone versus placebo 'Summary of findings' table. | |||
| Postoperative pain intensity at 12 hours (measured using pain scores on an 11‐point VAS) | The mean postoperative pain score at 12 hours was 2.6 | The mean postoperative pain score at 12 hours in the intravenous dexamethasone group was 1.24 points lower (2.44 lower to 0.04 lower) | 162 | ⨁⨁◯◯ |
| Postoperative pain intensity at 24 hours | The mean postoperative pain score at 24 hours was 4.4 | The mean postoperative pain score at 24 hours in the intravenous dexamethasone group was 1.26 points lower (2.23 lower to 0.29 lower) | 257 | ⨁⨁◯◯ |
| Postoperative pain intensity at 48 hours (measured using pain scores on an 11‐point VAS) | The mean postoperative pain score at 48 hours was 3.7 | The mean postoperative pain score at 48 hours in the intravenous dexamethasone group was 0.21 points lower (0.83 lower to 0.41 higher) | 172 | ⨁⨁◯◯ |
| *The risk in the intervention group (and its 95% confidence interval) is based on the assumed risk in the comparison group and the relative effect of the intervention (and its 95% CI). | ||||
| GRADE Working Group grades of evidence | ||||
| aDowngraded by one level for inconsistency (considerable heterogeneity (I2 = 88% and P value for heterogeneity <0.0001) and subgroup analyses did not explain observed heterogeneity. Downgraded by one level for imprecision because of a sparse number of participants (n=162). bDowngraded by one level for inconsistency (I2 = 61% and P value for heterogeneity 0.08) and subgroup analyses did not explain observed heterogeneity. Downgraded by one level for imprecision. Confidence interval includes both no clinical effect (minimally important difference 1.2 on VAS) and clinical effect (minimally important difference greater than 1.2 on VAS). cDowngraded by one level for inconsistency(I2 = 65% and P value for heterogeneity 0.02) and subgroup analyses did not explain observed heterogeneity. Point estimates vary widely across studies. Downgraded by one level for imprecision (95% confidence interval includes no clinical effect and a clinical effect). By no clinical effect we mean the lower bound of the CI did not surpass our chosen MID threshold of 1.2 on VAS. dDowngraded by two levels for precision (small sample size (n=172) and confidence interval crosses the line of null effect).. | ||||
| Patient or population: peripheral nerve block Setting: people undergoing upper or lower limb surgery with peripheral nerve block in hospitals in Australia, Belgium, Brazil, Canada and USA Intervention: perineural dexamethasone Comparison: intravenous dexamethasone | ||||
| Outcomes | Anticipated absolute effects* (95% CI) | № of participants | Quality of the evidence | |
| Risk with intravenous dexamethasone | Risk with perineural dexamethasone | |||
| Duration of sensory block (we included all studies describing duration of sensory block regardless of how it was described) | The mean duration of sensory block was 20.6 hours | The mean duration of sensory block in the perineural dexamethasone group was 3.13 hours longer (1.68 longer to 4.58 longer) | 720 | ⨁⨁⨁◯ |
| Incidence of serious adverse events (we used the NIH definition of adverse events. A serious event includes death, a life‐threatening event that requires hospitalization or prolonged hospitalization, disability or congenital anomaly) | Please see incidence of serious adverse events in the perineural dexamethasone versus placebo 'Summary of findings' table. | |||
| Postoperative pain intensity at 12 hours (measured using pain scores on an 11‐point VAS) | The mean postoperative pain score at 12 hours was 2.3 | The mean postoperative pain score at 12 hours in the perineural dexamethasone group was 1.01 points lower (0.50 lower to 1.51 lower) | 217 | ⨁⨁◯◯ |
| Postoperative pain intensity at 24 hours (measured using pain scores on an 11‐point VAS) | The mean postoperative pain score at 24 hours was 2.9 | The mean postoperative pain score at 24 hours in the perineural dexamethasone group was 0.77 points lower (0.08 lower to 1.47 lower) | 309 | ⨁⨁⨁◯ |
| Postoperative pain intensity at 48 hours (measured using pain scores on an 11‐point VAS) | The mean postoperative pain score at 48 hours was 2.8 | The mean postoperative pain score at 48 hours in the perineural dexamethasone group was 0.13 points higher (0.35 lower to 0.61 higher) | 227 | ⨁⨁◯◯ |
| *The risk in the intervention group (and its 95% confidence interval) is based on the assumed risk in the comparison group and the relative effect of the intervention (and its 95% CI). | ||||
| GRADE Working Group grades of evidence | ||||
| aDowngraded by one level for inconsistency (I2 = 67% and P value for heterogeneity is 0.001). bDowngraded by one level for risk of bias. Two out of the three studies are at unclear risk of bias. Reasons include unclear random sequence generation, unclear allocation concealment, and selective outcome reporting. Downgraded by one level for imprecision because of a sparse number of participants (n=217) and because the 95% confidence interval includes no clinical effect and a clinical effect. By no clinical effect we mean the lower bound of the CI did not surpass our chosen MID threshold of 1.2 on VAS. cDowngraded by one level for imprecision (95% confidence interval includes no clinical effect and a clinical effect). By no clinical effect we mean the lower bound of the CI did not surpass our chosen MID threshold of 1.2 on VAS. dDowngraded by one level for risk of bias. The one study that is at unclear risk of bias contributes half the data for this outcome. Downgraded by one level for imprecision because of a small sample size (n=227). | ||||
| Outcome or subgroup title | No. of studies | No. of participants | Statistical method | Effect size |
| 1 Duration of sensory block Show forest plot | 27 | 1625 | Mean Difference (IV, Random, 95% CI) | 6.70 [5.54, 7.85] |
| 2 Duration of sensory block: long‐ versus medium‐acting local anaesthetic subgroups Show forest plot | 26 | 1572 | Mean Difference (IV, Random, 95% CI) | 6.78 [5.62, 7.94] |
| 2.1 Long‐acting local anaesthetic | 20 | 1315 | Mean Difference (IV, Random, 95% CI) | 7.81 [6.40, 9.21] |
| 2.2 Medium‐acting local anaesthetic | 6 | 257 | Mean Difference (IV, Random, 95% CI) | 3.98 [1.76, 6.20] |
| 3 Duration of sensory block: additive versus no additive subgroups Show forest plot | 27 | 1625 | Mean Difference (IV, Random, 95% CI) | 6.70 [5.54, 7.85] |
| 3.1 Additives | 6 | 336 | Mean Difference (IV, Random, 95% CI) | 7.29 [3.77, 10.81] |
| 3.2 No additives | 21 | 1289 | Mean Difference (IV, Random, 95% CI) | 6.60 [5.30, 7.89] |
| 4 Duration of sensory block: high‐ versus low‐dose dexamethasone subgroups Show forest plot | 27 | 1627 | Mean Difference (IV, Random, 95% CI) | 6.70 [5.53, 7.86] |
| 4.1 High‐dose dexamethasone | 23 | 1447 | Mean Difference (IV, Random, 95% CI) | 7.09 [5.81, 8.38] |
| 4.2 Low‐dose dexamethasone | 4 | 180 | Mean Difference (IV, Random, 95% CI) | 4.32 [1.80, 6.85] |
| 5 Duration of sensory block: high/unclear versus low risk of bias subgroups Show forest plot | 26 | 1625 | Mean Difference (IV, Random, 95% CI) | 6.70 [5.54, 7.85] |
| 5.1 High or unclear risk of bias | 19 | 1037 | Mean Difference (IV, Random, 95% CI) | 6.28 [5.01, 7.56] |
| 5.2 Low risk of bias | 8 | 588 | Mean Difference (IV, Random, 95% CI) | 8.21 [4.56, 11.85] |
| Outcome or subgroup title | No. of studies | No. of participants | Statistical method | Effect size |
| 1 Duration of motor block Show forest plot | 16 | 912 | Mean Difference (IV, Random, 95% CI) | 5.87 [4.44, 7.30] |
| 2 Duration of motor block: long‐ versus medium‐acting local anaesthetic subgroups Show forest plot | 16 | 912 | Mean Difference (IV, Random, 95% CI) | 5.87 [4.44, 7.30] |
| 2.1 Long‐acting local anaesthetic | 13 | 764 | Mean Difference (IV, Random, 95% CI) | 6.61 [4.58, 8.65] |
| 2.2 Medium‐acting local anaesthetic | 3 | 148 | Mean Difference (IV, Random, 95% CI) | 2.59 [2.42, 2.76] |
| 3 Duration of motor block: additives verus no additives subgroups Show forest plot | 16 | 912 | Mean Difference (IV, Random, 95% CI) | 5.87 [4.44, 7.30] |
| 3.1 Additives | 5 | 280 | Mean Difference (IV, Random, 95% CI) | 7.47 [3.58, 11.36] |
| 3.2 No additives | 11 | 632 | Mean Difference (IV, Random, 95% CI) | 5.26 [3.17, 7.35] |
| 4 Duration of motor block: high‐ versus low‐dose dexamethasone subgroups Show forest plot | 16 | 912 | Mean Difference (IV, Random, 95% CI) | 5.87 [4.44, 7.30] |
| 4.1 High‐dose dexamethasone | 15 | 872 | Mean Difference (IV, Random, 95% CI) | 5.75 [4.29, 7.22] |
| 4.2 Low‐dose dexamethasone | 1 | 40 | Mean Difference (IV, Random, 95% CI) | 8.1 [4.69, 11.51] |
| 5 Duration of motor block: high/unclear versus low risk of bias subgroups Show forest plot | 16 | 912 | Mean Difference (IV, Random, 95% CI) | 5.87 [4.44, 7.30] |
| 5.1 High/unclear risk of bias | 14 | 809 | Mean Difference (IV, Random, 95% CI) | 5.67 [4.18, 7.16] |
| 5.2 Low risk of bias | 2 | 103 | Mean Difference (IV, Random, 95% CI) | 7.93 [2.74, 13.13] |
| Outcome or subgroup title | No. of studies | No. of participants | Statistical method | Effect size |
| 1 Overall incidence of block‐related adverse events Show forest plot | 10 | 677 | Risk Ratio (M‐H, Random, 95% CI) | 1.17 [0.99, 1.39] |
| 2 Numbness/tingling 14 days after surgery Show forest plot | 5 | 323 | Risk Ratio (M‐H, Random, 95% CI) | 1.76 [0.80, 3.89] |
| 3 Residual motor block/weakness 24 hours after surgery Show forest plot | 3 | 259 | Risk Ratio (M‐H, Random, 95% CI) | 4.69 [0.57, 38.68] |
| 4 Horner Syndrome Show forest plot | 4 | 321 | Risk Ratio (M‐H, Random, 95% CI) | 0.99 [0.73, 1.36] |
| 5 Hoarseness Show forest plot | 4 | 353 | Risk Ratio (M‐H, Random, 95% CI) | 1.23 [0.65, 2.34] |
| 6 Diaphragmatic paresis Show forest plot | 2 | 172 | Risk Ratio (M‐H, Random, 95% CI) | 1.46 [0.66, 3.23] |
| 7 Dyspnoea Show forest plot | 4 | 274 | Risk Ratio (M‐H, Random, 95% CI) | 0.34 [0.01, 8.14] |
| 8 Vascular injury Show forest plot | 1 | 100 | Risk Ratio (M‐H, Random, 95% CI) | 2.0 [0.19, 21.36] |
| 9 Cranial nerve 12 palsy Show forest plot | 1 | 83 | Risk Ratio (M‐H, Random, 95% CI) | 0.33 [0.01, 7.77] |
| 10 Bruising Show forest plot | 1 | 37 | Risk Ratio (M‐H, Random, 95% CI) | 1.06 [0.07, 15.64] |
| 11 Overall non‐block‐related adverse events Show forest plot | 10 | 625 | Risk Ratio (M‐H, Random, 95% CI) | 0.76 [0.35, 1.68] |
| 12 Postoperative nausea and vomiting Show forest plot | 10 | 585 | Risk Ratio (M‐H, Random, 95% CI) | 0.55 [0.26, 1.14] |
| 13 Deep sedation Show forest plot | 1 | 60 | Risk Ratio (M‐H, Random, 95% CI) | 7.0 [0.38, 129.93] |
| 14 Dermatological symptoms (pruritus/rash) Show forest plot | 1 | 83 | Risk Ratio (M‐H, Random, 95% CI) | 2.93 [0.32, 27.02] |
| 15 Syncope/fainting Show forest plot | 1 | 83 | Risk Ratio (M‐H, Random, 95% CI) | 1.95 [0.18, 20.71] |
| 16 Bradycardia Show forest plot | 1 | 60 | Risk Ratio (M‐H, Random, 95% CI) | 0.67 [0.12, 3.71] |
| 17 Hypotension Show forest plot | 2 | 140 | Risk Ratio (M‐H, Random, 95% CI) | 0.67 [0.21, 2.13] |
| 18 Headache/10‐pound fluid gain/diarrhoea/frequent urination/muscle soreness Show forest plot | 1 | 83 | Risk Ratio (M‐H, Random, 95% CI) | 2.93 [0.12, 69.92] |
| Outcome or subgroup title | No. of studies | No. of participants | Statistical method | Effect size |
| 1 Postoperative pain intensity at12 hours Show forest plot | 5 | 257 | Mean Difference (IV, Random, 95% CI) | ‐2.08 [‐2.63, ‐1.52] |
| 2 Postoperative pain intensity at 12 hours: medium‐ versus long‐acting local anaesthetic subgroups Show forest plot | 5 | 257 | Mean Difference (IV, Random, 95% CI) | ‐2.08 [‐2.63, ‐1.53] |
| 2.1 Long‐acting local anaesthesia | 4 | 234 | Mean Difference (IV, Random, 95% CI) | ‐2.21 [‐2.77, ‐1.66] |
| 2.2 Medium‐acting local anaesthesia | 1 | 23 | Mean Difference (IV, Random, 95% CI) | ‐1.22 [‐2.38, ‐0.06] |
| 3 Postoperative pain intensity at 12 hours: additive versus no additive subgroups Show forest plot | 5 | 257 | Mean Difference (IV, Random, 95% CI) | ‐2.08 [‐2.63, ‐1.52] |
| 3.1 Additives | 1 | 23 | Mean Difference (IV, Random, 95% CI) | ‐1.20 [‐2.36, ‐0.04] |
| 3.2 No additives | 4 | 234 | Mean Difference (IV, Random, 95% CI) | ‐2.21 [‐2.77, ‐1.66] |
| 4 Postoperative pain intensity at 12 hours: high‐ versus low‐dose dexamethasone subgroups Show forest plot | 5 | 257 | Mean Difference (IV, Random, 95% CI) | ‐2.08 [‐2.63, ‐1.52] |
| 4.1 High‐dose dexamethasone | 3 | 177 | Mean Difference (IV, Random, 95% CI) | ‐2.17 [‐3.29, ‐1.06] |
| 4.2 Low‐dose dexamethasone | 2 | 80 | Mean Difference (IV, Random, 95% CI) | ‐1.99 [‐2.75, ‐1.22] |
| 5 Postoperative pain intensity at 12 hours: high/unclear versus low risk of bias subgroups Show forest plot | 5 | 257 | Mean Difference (IV, Random, 95% CI) | ‐2.08 [‐2.63, ‐1.52] |
| 5.1 High/unclear versus low risk of bias | 3 | 103 | Mean Difference (IV, Random, 95% CI) | ‐1.81 [‐2.53, ‐1.09] |
| 5.2 Low risk of bias | 2 | 154 | Mean Difference (IV, Random, 95% CI) | ‐2.61 [‐3.88, ‐1.34] |
| Outcome or subgroup title | No. of studies | No. of participants | Statistical method | Effect size |
| 1 Postoperative pain intensity at 24 hours Show forest plot | 9 | 469 | Mean Difference (IV, Random, 95% CI) | ‐1.63 [‐2.34, ‐0.93] |
| 2 Postoperative pain intensity at 24 hours: long‐ versus medium‐acting local anaesthetic subgroups Show forest plot | 9 | 469 | Mean Difference (IV, Random, 95% CI) | ‐1.63 [‐2.34, ‐0.93] |
| 2.1 Long‐acting local anaesthesia | 7 | 409 | Mean Difference (IV, Random, 95% CI) | ‐1.75 [‐2.60, ‐0.90] |
| 2.2 Medium‐acting local anaesthesia | 2 | 60 | Mean Difference (IV, Random, 95% CI) | ‐1.08 [‐2.07, ‐0.09] |
| 3 Postoperative pain intensity at 24 hours: additive versus no additive subgroups Show forest plot | 9 | 469 | Mean Difference (IV, Random, 95% CI) | ‐1.63 [‐2.34, ‐0.93] |
| 3.1 Additives | 3 | 158 | Mean Difference (IV, Random, 95% CI) | ‐2.13 [‐3.43, ‐0.82] |
| 3.2 No additives | 6 | 311 | Mean Difference (IV, Random, 95% CI) | ‐1.41 [‐2.31, ‐0.51] |
| 4 Postoperative pain intensity at 24 hours: high‐ versus low‐dose dexamethasone subgroups Show forest plot | 9 | 469 | Mean Difference (IV, Random, 95% CI) | ‐1.63 [‐2.34, ‐0.93] |
| 4.1 High‐dose dexamethasone | 7 | 389 | Mean Difference (IV, Random, 95% CI) | ‐1.59 [‐2.71, ‐0.47] |
| 4.2 Low‐dose dexamethasone | 2 | 80 | Mean Difference (IV, Random, 95% CI) | ‐1.87 [‐3.21, ‐0.52] |
| 5 Postoperative pain intensity at 24 hours: high/unclear versus low risk of bias subgroups Show forest plot | 9 | 469 | Mean Difference (IV, Random, 95% CI) | ‐1.63 [‐2.34, ‐0.93] |
| 5.1 High/unclear risk of bias | 4 | 185 | Mean Difference (IV, Random, 95% CI) | ‐1.90 [‐2.79, ‐1.00] |
| 5.2 Low risk of bias | 5 | 284 | Mean Difference (IV, Random, 95% CI) | ‐1.43 [‐2.91, 0.04] |
| Outcome or subgroup title | No. of studies | No. of participants | Statistical method | Effect size |
| 1 Postoperative pain intensity at 48 hours Show forest plot | 4 | 296 | Mean Difference (IV, Random, 95% CI) | ‐0.61 [‐1.24, 0.03] |
| 2 Postoperative pain intensity at 48 hours: additives versus no additives subgroups Show forest plot | 4 | 296 | Mean Difference (IV, Random, 95% CI) | ‐0.61 [‐1.24, 0.03] |
| 2.1 No additives | 2 | 155 | Mean Difference (IV, Random, 95% CI) | ‐0.86 [‐1.36, ‐0.36] |
| 2.2 Additives | 2 | 141 | Mean Difference (IV, Random, 95% CI) | ‐0.23 [‐1.80, 1.34] |
| 3 Postoperative pain intensity at 48 hours: high/unclear versus low risk of bias subgroups Show forest plot | 4 | 296 | Mean Difference (IV, Random, 95% CI) | ‐0.61 [‐1.24, 0.03] |
| 3.1 High/unclear risk of bias | 1 | 88 | Mean Difference (IV, Random, 95% CI) | ‐1.0 [‐2.24, 0.24] |
| 3.2 Low risk of bias | 3 | 208 | Mean Difference (IV, Random, 95% CI) | ‐0.45 [‐1.30, 0.40] |
| Outcome or subgroup title | No. of studies | No. of participants | Statistical method | Effect size |
| 1 Postoperative opioid consumption at 24 hours Show forest plot | 6 | 380 | Mean Difference (IV, Random, 95% CI) | ‐19.25 [‐32.51, ‐5.99] |
| 2 Opioid consumption at 24 hours medium‐ versus long‐acting local anaesthetic subgroups Show forest plot | 6 | 380 | Mean Difference (IV, Random, 95% CI) | ‐19.25 [‐32.51, ‐5.99] |
| 2.1 Long‐acting local anaesthetic | 5 | 335 | Mean Difference (IV, Random, 95% CI) | ‐21.22 [‐35.20, ‐7.25] |
| 2.2 Medium‐acting local anaesthetic | 1 | 45 | Mean Difference (IV, Random, 95% CI) | 4.0 [‐33.91, 41.91] |
| 3 Opioid consumption at 24 hours: additive versus no additive subgroups Show forest plot | 6 | 380 | Mean Difference (IV, Random, 95% CI) | ‐19.25 [‐32.51, ‐5.99] |
| 3.1 Additives | 2 | 142 | Mean Difference (IV, Random, 95% CI) | ‐30.17 [‐58.58, ‐1.76] |
| 3.2 No additives | 4 | 238 | Mean Difference (IV, Random, 95% CI) | ‐12.98 [‐26.28, 0.32] |
| 4 Opioid consumption at 24 hours: high/unclear versus low risk of bias subgroups Show forest plot | 6 | 380 | Mean Difference (IV, Random, 95% CI) | ‐19.25 [‐32.51, ‐5.99] |
| 4.1 High/unclear risk of bias | 1 | 88 | Mean Difference (IV, Random, 95% CI) | ‐45.0 [‐57.58, ‐32.42] |
| 4.2 Low risk of bias | 5 | 292 | Mean Difference (IV, Random, 95% CI) | ‐13.55 [‐23.36, ‐3.75] |
| Outcome or subgroup title | No. of studies | No. of participants | Statistical method | Effect size |
| 1 Participant satisfaction with pain control: perineural dexamethasone versus placebo Show forest plot | 4 | 224 | Mean Difference (IV, Random, 95% CI) | 0.83 [‐0.05, 1.71] |
| Outcome or subgroup title | No. of studies | No. of participants | Statistical method | Effect size |
| 1 Duration of sensory block Show forest plot | 8 | 499 | Mean Difference (IV, Random, 95% CI) | 6.21 [3.53, 8.88] |
| 2 Duration sensory block: additive versus no additive subgroups Show forest plot | 8 | 499 | Mean Difference (IV, Random, 95% CI) | 6.21 [3.53, 8.88] |
| 2.1 Additives | 1 | 49 | Mean Difference (IV, Random, 95% CI) | 6.20 [0.68, 11.72] |
| 2.2 No additives | 7 | 450 | Mean Difference (IV, Random, 95% CI) | 6.21 [3.33, 9.08] |
| 3 Duration of sensory block: high‐ versus low‐dose dexamethasone subgroups Show forest plot | 8 | 499 | Mean Difference (IV, Random, 95% CI) | 6.21 [3.53, 8.88] |
| 3.1 High‐dose | 6 | 437 | Mean Difference (IV, Random, 95% CI) | 7.45 [5.55, 9.35] |
| 3.2 Low‐dose | 2 | 62 | Mean Difference (IV, Random, 95% CI) | 2.25 [1.21, 3.30] |
| 4 Duration of sensory block: high/unclear versus low risk of bias subgroups Show forest plot | 8 | 499 | Mean Difference (IV, Random, 95% CI) | 6.21 [3.53, 8.88] |
| 4.1 High/unclear risk of bias | 2 | 62 | Mean Difference (IV, Random, 95% CI) | 2.25 [1.21, 3.30] |
| 4.2 Low risk of bias | 6 | 437 | Mean Difference (IV, Random, 95% CI) | 7.45 [5.55, 9.35] |
| Outcome or subgroup title | No. of studies | No. of participants | Statistical method | Effect size |
| 1 Duration of motor block Show forest plot | 3 | 139 | Mean Difference (IV, Random, 95% CI) | 5.04 [3.07, 7.00] |
| 2 Duration of motor block: additive versus no additive subgroups Show forest plot | 3 | 139 | Mean Difference (IV, Random, 95% CI) | 5.54 [3.11, 7.97] |
| 2.1 Additives | 1 | 49 | Mean Difference (IV, Random, 95% CI) | 6.60 [2.32, 10.88] |
| 2.2 No additives | 2 | 90 | Mean Difference (IV, Random, 95% CI) | 3.67 [‐2.77, 10.11] |
| 3 Duration of motor block high‐ versus low‐dose dexamethasone subgroups Show forest plot | 3 | 139 | Mean Difference (IV, Random, 95% CI) | 5.04 [3.07, 7.00] |
| 3.1 High‐dose dexamethasone | 2 | 99 | Mean Difference (IV, Random, 95% CI) | 5.96 [4.03, 7.90] |
| 3.2 Low‐dose dexamethasone | 1 | 40 | Mean Difference (IV, Random, 95% CI) | 3.10 [0.23, 5.97] |
| 4 Duration of motor block: high/unclear versus low risk of bias subgroups Show forest plot | 3 | 139 | Mean Difference (IV, Random, 95% CI) | 5.04 [3.07, 7.00] |
| 4.1 High/unclear risk of bias | 2 | 99 | Mean Difference (IV, Random, 95% CI) | 5.96 [4.03, 7.90] |
| 4.2 Low risk of bias | 1 | 40 | Mean Difference (IV, Random, 95% CI) | 3.10 [0.23, 5.97] |
| Outcome or subgroup title | No. of studies | No. of participants | Statistical method | Effect size |
| 1 Overall incidence of block‐related adverse events Show forest plot | 5 | 393 | Risk Ratio (M‐H, Random, 95% CI) | 1.09 [0.69, 1.70] |
| 2 Numbness/tingling 14 days after surgery Show forest plot | 2 | 101 | Risk Ratio (M‐H, Random, 95% CI) | 1.69 [0.31, 9.26] |
| 3 Residual motor block/muscle weakness 24 hours after surgery Show forest plot | 3 | 265 | Risk Ratio (M‐H, Random, 95% CI) | 2.68 [0.80, 8.90] |
| 4 Horner syndrome Show forest plot | 2 | 214 | Risk Ratio (M‐H, Random, 95% CI) | 0.89 [0.63, 1.26] |
| 5 Hoarsenss Show forest plot | 2 | 215 | Risk Ratio (M‐H, Random, 95% CI) | 0.88 [0.45, 1.71] |
| 6 Dyspnoea Show forest plot | 3 | 219 | Risk Ratio (M‐H, Random, 95% CI) | 0.63 [0.11, 3.74] |
| 7 Cranial nerve 12 palsy Show forest plot | 1 | 78 | Risk Ratio (M‐H, Random, 95% CI) | 0.37 [0.02, 8.77] |
| 8 Overall non‐block‐related adverse events Show forest plot | 5 | 258 | Risk Ratio (M‐H, Random, 95% CI) | 1.23 [0.38, 3.97] |
| 9 Postoperative nausea and vomiting Show forest plot | 3 | 134 | Risk Ratio (M‐H, Random, 95% CI) | 0.66 [0.12, 3.78] |
| 10 Dermatological symptoms Show forest plot | 2 | 124 | Risk Ratio (M‐H, Random, 95% CI) | 1.88 [0.09, 40.62] |
| 11 Dizziness/wrist, hand or finger pain, constipation Show forest plot | 1 | 78 | Risk Ratio (M‐H, Random, 95% CI) | 0.37 [0.02, 8.77] |
| Outcome or subgroup title | No. of studies | No. of participants | Statistical method | Effect size |
| 1 Postoperative pain intensity at 12 hours Show forest plot | 3 | 162 | Mean Difference (IV, Random, 95% CI) | ‐1.24 [‐2.44, ‐0.04] |
| 2 Postoperative pain intensity at 12 hours: high‐ versus low‐dose dexamethasone subgroups Show forest plot | 3 | 162 | Mean Difference (IV, Random, 95% CI) | ‐1.24 [‐2.44, ‐0.04] |
| 2.1 High‐dose dexamethasone | 2 | 122 | Mean Difference (IV, Random, 95% CI) | ‐1.80 [‐3.16, ‐0.44] |
| 2.2 Low‐dose dexamethasone | 1 | 40 | Mean Difference (IV, Random, 95% CI) | ‐0.5 [‐1.41, 0.41] |
| 3 Postoperative pain intensity at 12 hours: high/unclear versus low risk of bias subgroups Show forest plot | 3 | 162 | Mean Difference (IV, Random, 95% CI) | ‐1.24 [‐2.44, ‐0.04] |
| 3.1 High/unclear risk of bias | 1 | 40 | Mean Difference (IV, Random, 95% CI) | ‐0.5 [‐1.41, 0.41] |
| 3.2 Low risk of bias | 2 | 122 | Mean Difference (IV, Random, 95% CI) | ‐1.80 [‐3.16, ‐0.44] |
| Outcome or subgroup title | No. of studies | No. of participants | Statistical method | Effect size |
| 1 Postoperative pain intensity at 24 hours Show forest plot | 5 | 257 | Mean Difference (IV, Random, 95% CI) | ‐1.26 [‐2.23, ‐0.29] |
| 2 Postoperative pain intensity at 24 hours: additive versus no additive subgroups Show forest plot | 5 | 257 | Mean Difference (IV, Random, 95% CI) | ‐1.26 [‐2.23, ‐0.29] |
| 2.1 Additive | 1 | 49 | Mean Difference (IV, Random, 95% CI) | ‐0.90 [‐2.75, 0.95] |
| 2.2 No additive | 4 | 208 | Mean Difference (IV, Random, 95% CI) | ‐1.33 [‐2.48, ‐0.18] |
| 3 Postoperative pain intensity at 24 hours: high‐ versus low‐dose dexamethasone subgroups Show forest plot | 5 | 257 | Mean Difference (IV, Random, 95% CI) | ‐1.26 [‐2.23, ‐0.29] |
| 3.1 High‐dose dexamethasone | 4 | 217 | Mean Difference (IV, Random, 95% CI) | ‐1.31 [‐2.54, ‐0.07] |
| 3.2 Low‐dose dexamethasone | 1 | 40 | Mean Difference (IV, Random, 95% CI) | ‐1.1 [‐2.49, 0.29] |
| 4 Postoperative pain intensity at 24 hours: high/unclear versus low risk of bias subgroups Show forest plot | 5 | 257 | Mean Difference (IV, Random, 95% CI) | ‐1.26 [‐2.23, ‐0.29] |
| 4.1 High/unclear risk of bias | 1 | 40 | Mean Difference (IV, Random, 95% CI) | ‐1.1 [‐2.49, 0.29] |
| 4.2 Low risk of bias | 4 | 217 | Mean Difference (IV, Random, 95% CI) | ‐1.31 [‐2.54, ‐0.07] |
| Outcome or subgroup title | No. of studies | No. of participants | Statistical method | Effect size |
| 1 Postoperative pain intensity at 48 hours Show forest plot | 3 | 172 | Mean Difference (IV, Random, 95% CI) | ‐0.18 [‐0.80, 0.44] |
| 2 Postoperative pain intensity at 48 hours: additive versus no additive subgroups Show forest plot | 3 | 172 | Mean Difference (IV, Random, 95% CI) | ‐0.18 [‐0.80, 0.44] |
| 2.1 Additive | 1 | 49 | Mean Difference (IV, Random, 95% CI) | ‐0.20 [‐1.60, 1.20] |
| 2.2 No additive | 2 | 123 | Mean Difference (IV, Random, 95% CI) | ‐0.17 [‐0.87, 0.52] |
| Outcome or subgroup title | No. of studies | No. of participants | Statistical method | Effect size |
| 1 24‐hour opioid consumption Show forest plot | 5 | 287 | Mean Difference (IV, Random, 95% CI) | ‐6.58 [‐10.56, ‐2.60] |
| 2 24‐hour opioid consumption: additive verus no additive subgroups Show forest plot | 5 | 287 | Mean Difference (IV, Random, 95% CI) | ‐6.58 [‐10.56, ‐2.60] |
| 2.1 Additive | 1 | 53 | Mean Difference (IV, Random, 95% CI) | ‐4.0 [‐13.33, 5.33] |
| 2.2 No additive | 4 | 234 | Mean Difference (IV, Random, 95% CI) | ‐6.93 [‐11.41, ‐2.46] |
| Outcome or subgroup title | No. of studies | No. of participants | Statistical method | Effect size |
| 1 Postoperative opioid consumption at 48 hours opioid consumption Show forest plot | 1 | 46 | Mean Difference (IV, Random, 95% CI) | ‐22.5 [‐39.85, ‐5.15] |
| Outcome or subgroup title | No. of studies | No. of participants | Statistical method | Effect size |
| 1 Participant satisfaction with pain control Show forest plot | 3 | 181 | Mean Difference (IV, Random, 95% CI) | 1.07 [‐0.08, 2.22] |
| Outcome or subgroup title | No. of studies | No. of participants | Statistical method | Effect size |
| 1 Duration of sensory block Show forest plot | 9 | 720 | Mean Difference (IV, Random, 95% CI) | 3.13 [1.68, 4.58] |
| 2 Duration of sensory block additive versus no additive subgroups Show forest plot | 9 | 720 | Mean Difference (IV, Random, 95% CI) | 3.13 [1.68, 4.58] |
| 2.1 Additive | 3 | 331 | Mean Difference (IV, Random, 95% CI) | 3.94 [2.66, 5.21] |
| 2.2 No additive | 6 | 389 | Mean Difference (IV, Random, 95% CI) | 2.67 [0.00, 5.34] |
| 3 Duration sensory block high‐dose versus low‐dose dexamethasone subgroups Show forest plot | 9 | 720 | Mean Difference (IV, Random, 95% CI) | 3.13 [1.68, 4.58] |
| 3.1 High‐dose dexamethasone | 6 | 508 | Mean Difference (IV, Random, 95% CI) | 2.35 [0.04, 4.66] |
| 3.2 Low‐dose dexamethasone | 3 | 212 | Mean Difference (IV, Random, 95% CI) | 4.14 [2.48, 5.81] |
| 4 Duration sensory block high/unclear versus low risk of bias subgroups Show forest plot | 9 | 720 | Mean Difference (IV, Random, 95% CI) | 3.13 [1.68, 4.58] |
| 4.1 High/unclear risk of bias | 3 | 162 | Mean Difference (IV, Random, 95% CI) | 4.67 [2.29, 7.04] |
| 4.2 Low risk of bias | 6 | 558 | Mean Difference (IV, Random, 95% CI) | 2.30 [0.23, 4.37] |
| Outcome or subgroup title | No. of studies | No. of participants | Statistical method | Effect size |
| 1 Duration of motor block Show forest plot | 5 | 421 | Mean Difference (IV, Random, 95% CI) | 3.13 [0.99, 5.27] |
| 2 Duration of motor block: additive versus no additive subgroups Show forest plot | 5 | 340 | Mean Difference (IV, Random, 95% CI) | 2.75 [0.32, 5.19] |
| 2.1 Additive | 1 | 50 | Mean Difference (IV, Random, 95% CI) | 4.0 [‐0.03, 8.03] |
| 2.2 No additive | 4 | 290 | Mean Difference (IV, Random, 95% CI) | 2.39 [‐0.58, 5.37] |
| 3 Duration of motor block: high‐ versus low‐dose dexamethasone subgroups Show forest plot | 5 | 421 | Mean Difference (IV, Random, 95% CI) | 3.13 [0.99, 5.27] |
| 3.1 High‐dose dexamethasone | 4 | 381 | Mean Difference (IV, Random, 95% CI) | 2.47 [‐0.25, 5.19] |
| 3.2 Low‐dose dexamethasone | 1 | 40 | Mean Difference (IV, Random, 95% CI) | 5.0 [2.53, 7.47] |
| 4 Duration of motor block: high/unclear versus low risk of bias subgroups Show forest plot | 5 | 421 | Mean Difference (IV, Random, 95% CI) | 3.13 [0.99, 5.27] |
| 4.1 HIgh/unclear risk of bias | 1 | 40 | Mean Difference (IV, Random, 95% CI) | 5.0 [2.53, 7.47] |
| 4.2 Low risk of bias | 4 | 381 | Mean Difference (IV, Random, 95% CI) | 2.47 [‐0.25, 5.19] |
| Outcome or subgroup title | No. of studies | No. of participants | Statistical method | Effect size |
| 1 Overall incidence of block‐related adverse events Show forest plot | 5 | 406 | Risk Ratio (M‐H, Random, 95% CI) | 1.20 [0.93, 1.55] |
| 2 Numbness/tingling 14 days after surgery Show forest plot | 3 | 232 | Risk Ratio (M‐H, Random, 95% CI) | 0.97 [0.27, 3.49] |
| 3 Residual motor block/weakness at 24 hours Show forest plot | 3 | 248 | Risk Ratio (M‐H, Random, 95% CI) | 1.22 [0.62, 2.37] |
| 4 Horner syndrome Show forest plot | 2 | 197 | Risk Ratio (M‐H, Random, 95% CI) | 1.2 [0.77, 1.87] |
| 5 Hoarsness Show forest plot | 2 | 197 | Risk Ratio (M‐H, Random, 95% CI) | 1.0 [0.48, 2.09] |
| 6 Cranial nerve 12 motor palsy Show forest plot | 1 | 81 | Risk Ratio (M‐H, Random, 95% CI) | 0.31 [0.01, 7.39] |
| 7 Overall incidence of non block‐related adverse events Show forest plot | 5 | 316 | Risk Ratio (M‐H, Random, 95% CI) | 1.34 [0.37, 4.78] |
| 8 Postoperative nausea and vomiting Show forest plot | 5 | 312 | Risk Ratio (M‐H, Random, 95% CI) | 0.63 [0.22, 1.80] |
| 9 Dermatologicial symptoms (pruritus/rash) Show forest plot | 1 | 79 | Risk Ratio (M‐H, Random, 95% CI) | 4.42 [0.22, 89.18] |
| 10 Syncope/fainting Show forest plot | 1 | 79 | Risk Ratio (M‐H, Fixed, 95% CI) | 4.42 [0.22, 89.18] |
| 11 Dizziness Show forest plot | 2 | 178 | Risk Ratio (M‐H, Random, 95% CI) | 0.41 [0.06, 2.72] |
| 12 Wrist, hand or finger pain Show forest plot | 1 | 79 | Risk Ratio (M‐H, Random, 95% CI) | 0.29 [0.01, 7.02] |
| 13 Headache, 10‐pound fluid gain/diarrhoea/frequent urination/ muscle soreness Show forest plot | 1 | 79 | Risk Ratio (M‐H, Random, 95% CI) | 2.65 [0.11, 63.16] |
| Outcome or subgroup title | No. of studies | No. of participants | Statistical method | Effect size |
| 1 Postoperative pain intensity at 12 hours Show forest plot | 3 | 217 | Mean Difference (IV, Random, 95% CI) | ‐1.01 [‐1.51, ‐0.50] |
| 2 Postoperative pain intensity at 12 hours: low‐ versus high‐dose dexamethasone subgroups Show forest plot | 3 | 217 | Mean Difference (IV, Random, 95% CI) | ‐1.01 [‐1.51, ‐0.50] |
| 2.1 Low‐dose dexamethasone | 2 | 139 | Mean Difference (IV, Random, 95% CI) | ‐1.04 [‐1.60, ‐0.47] |
| 2.2 High‐dose dexamethasone | 1 | 78 | Mean Difference (IV, Random, 95% CI) | ‐0.90 [‐2.01, 0.21] |
| 3 Postoperative pain intensity at 12 hours: high/unclear versus low risk of bias subgroups Show forest plot | 3 | 217 | Mean Difference (IV, Random, 95% CI) | ‐1.01 [‐1.51, ‐0.50] |
| 3.1 HIgh/unclear risk of bias | 2 | 139 | Mean Difference (IV, Random, 95% CI) | ‐1.04 [‐1.60, ‐0.47] |
| 3.2 Low risk of bias | 1 | 78 | Mean Difference (IV, Random, 95% CI) | ‐0.90 [‐2.01, 0.21] |
| Outcome or subgroup title | No. of studies | No. of participants | Statistical method | Effect size |
| 1 Postoperative pain intensity at 24 hours Show forest plot | 5 | 309 | Mean Difference (IV, Random, 95% CI) | ‐0.79 [‐1.51, ‐0.07] |
| 2 Postoperative pain intensity at 24 hours: additive versus no additive subgroups Show forest plot | 5 | 309 | Mean Difference (IV, Random, 95% CI) | ‐0.79 [‐1.51, ‐0.07] |
| 2.1 Additive | 1 | 50 | Mean Difference (IV, Random, 95% CI) | ‐1.70 [‐3.32, ‐0.08] |
| 2.2 No additive | 4 | 259 | Mean Difference (IV, Random, 95% CI) | ‐0.64 [‐1.41, 0.13] |
| 3 Postoperative pain intensity at 24 hours: low‐ versus high‐dose dexamethasonesubgroups Show forest plot | 5 | 309 | Mean Difference (IV, Random, 95% CI) | ‐0.79 [‐1.51, ‐0.07] |
| 3.1 Low‐dose dexamethasone | 2 | 139 | Mean Difference (IV, Random, 95% CI) | ‐0.95 [‐2.01, 0.11] |
| 3.2 High‐dose dexamethasone | 3 | 170 | Mean Difference (IV, Random, 95% CI) | ‐0.68 [‐1.95, 0.59] |
| 4 Intensity of postoperative pain at 24 hours: high/unclear risk of bias versus low risk of bias subgroups Show forest plot | 5 | 309 | Mean Difference (IV, Random, 95% CI) | ‐0.79 [‐1.51, ‐0.07] |
| 4.1 High/unclear risk of bias | 2 | 139 | Mean Difference (IV, Random, 95% CI) | ‐0.95 [‐2.01, 0.11] |
| 4.2 Low risk of bias | 3 | 170 | Mean Difference (IV, Random, 95% CI) | ‐0.68 [‐1.95, 0.59] |
| Outcome or subgroup title | No. of studies | No. of participants | Statistical method | Effect size |
| 1 Postoperative pain intensity at 48 hours Show forest plot | 3 | 227 | Mean Difference (IV, Random, 95% CI) | 0.13 [‐0.35, 0.61] |
| 2 Postoperative pain intensity at 48 hours: additive versus no additive subgroups Show forest plot | 3 | 227 | Mean Difference (IV, Random, 95% CI) | 0.13 [‐0.35, 0.61] |
| 2.1 Additive | 1 | 50 | Mean Difference (IV, Random, 95% CI) | 0.80 [‐0.51, 2.11] |
| 2.2 No additive | 2 | 177 | Mean Difference (IV, Random, 95% CI) | 0.02 [‐0.50, 0.54] |
| 3 Postoperative pain intensity at 48 hours: low‐ versus high‐dose dexamethasone subgroups Show forest plot | 3 | 227 | Mean Difference (IV, Random, 95% CI) | 0.13 [‐0.35, 0.61] |
| 3.1 Low‐dose dexamethasone | 1 | 99 | Mean Difference (IV, Random, 95% CI) | 0.0 [‐0.59, 0.59] |
| 3.2 High‐dose dexamethasone | 2 | 128 | Mean Difference (IV, Random, 95% CI) | 0.39 [‐0.45, 1.24] |
| 4 Postoperative pain intensity at 48 hours: high/unclear versus low risk of bias subgroups Show forest plot | 3 | 227 | Mean Difference (IV, Random, 95% CI) | 0.13 [‐0.35, 0.61] |
| 4.1 High/unclear risk of bias | 1 | 99 | Mean Difference (IV, Random, 95% CI) | 0.0 [‐0.59, 0.59] |
| 4.2 Low risk of bias | 2 | 128 | Mean Difference (IV, Random, 95% CI) | 0.39 [‐0.45, 1.24] |
| Outcome or subgroup title | No. of studies | No. of participants | Statistical method | Effect size |
| 1 Opioid consumption at 24 hours: perineural versus intravenous dexamethasone Show forest plot | 4 | 242 | Mean Difference (IV, Random, 95% CI) | ‐3.87 [‐9.93, 2.19] |
| 2 24‐hour opioid consumption: additive versus no additive subgroups Show forest plot | 4 | 242 | Mean Difference (IV, Random, 95% CI) | ‐3.87 [‐9.93, 2.19] |
| 2.1 Additive | 1 | 53 | Mean Difference (IV, Random, 95% CI) | ‐10.00 [‐23.96, ‐0.04] |
| 2.2 No additive | 3 | 189 | Mean Difference (IV, Random, 95% CI) | ‐1.56 [‐6.34, 3.22] |
| Outcome or subgroup title | No. of studies | No. of participants | Statistical method | Effect size |
| 1 Participant satisfaction with pain control Show forest plot | 3 | 181 | Mean Difference (IV, Random, 95% CI) | 0.19 [‐0.33, 0.70] |