การใช้ dexamethasone เพื่อเสริมการบล็อกเส้นประสาทส่วนปลาย
บทคัดย่อ
บทนำ
การบล็อกเส้นประสาทส่วนปลาย (การฉีดยาชาเฉพาะที่รอบเส้นประสาท) ที่ใช้สำหรับการระงับความรู้สึกหรือการระงับปวด ข้อจำกัดในการใช้ยาแก้ปวดหลังผ่าตัดคือผลของยาแก้ปวดมักอยู่ได้เพียงไม่กี่ชั่วโมง หลังจากนั้นจะเกิดอาการปวดปานกลางถึงรุนแรงที่บริเวณผ่าตัดและการปวดดังกล่าวอาจส่งผลให้จำเป็นต้องใช้ยาแก้ปวดอย่างอื่น ยาเสริมหลายตัวถูกใช้เพื่อยืดระยะเวลาของการบล็อกเส้นประสาทส่วนปลายรวมถึงการให้ dexamethasone ทาง perineural หรือทางหลอดเลือดดำ
วัตถุประสงค์
การทบทวนวรรณกรรมนี้เปรียบเทียบประสิทธิภาพและความปลอดภัยของ การให้ perineural dexamethasone เทียบกับยาหลอก, dexamethasone ทางหลอดเลือดดำเทียบกับยาหลอกและ perineural dexamethasoneเทียบกับ dexamethasone ทางหลอดเลือดดำ ในการเสริมฤทธิ์การระงับเส้นประสาทส่วนปลายเพื่อบรรเทาอาการปวดหลังผ่าตัด
วิธีการสืบค้น
เราสืบค้น Cochrane Central Register ของ Controlled Trials (CENTRAL); MEDLINE, Embase, DARE, Web of Science and Scopus จนถึง 25 เมษายน 2017 นอกจากนี้เรายังค้นหาฐานข้อมูลใน Google Scholar และการประชุมบทคัดย่อจาก American Society of Anesthesiologists, สมาคมวิสัญญีแพทย์ของแคนาดา, American Society of Regional Anesthesia และ European Society of Regional Anesthesia
เกณฑ์การคัดเลือก
เรารวบรวมการทดลองแบบสุ่มควบคุมทั้งหมด (RCTs) โดยเปรียบเทียบ dexamethasone ทาง perineural กับยาหลอก, dexamethasone ทางหลอดเลือดดำกับยาหลอกหรือ dexamethasone ทาง perineural กับ dexamethasone ทางหลอดเลือดดำในผู้เข้าร่วมวิจัยที่ได้รับการบล็อกเส้นประสาทส่วนปลายสำหรับการผ่าตัดแขนขาส่วนบนหรือส่วนล่าง
การรวบรวมและวิเคราะห์ข้อมูล
ผู้วิจัยใช้ระเบียบวิธีการวิจัยตามมาตรฐานของ Cochrane
ผลการวิจัย
เรารวมการทดลอง 35 ครั้งจากผู้เข้าร่วม 2702 คนที่มีอายุ 15 ถึง 78 ปี การศึกษา 33 รายที่ลงทะเบียนเข้าร่วมการผ่าตัดขาส่วนบนและอีกสองคนที่ได้รับการผ่าตัดแขนขาส่วนล่าง ความเสี่ยงของความลำเอียงอยู่ในระดับต่ำใน 13 การศึกษา และสูง / ไม่ชัดเจนใน 22
dexamethasone ทาง perineural เทียบกับยาหลอก
ระยะเวลาของการระงับความรู้สึกภายหลังการบล็อกประสาทสัมผัส ในกลุ่ม ที่ได้ dexamethasone ทาง perineural นานกว่าอย่างมีนัยสำคัญ เมื่อเทียบกับยาหลอก (ค่าเฉลี่ยความแตกต่าง (MD) 6.70 ชั่วโมง ช่วงความเชื่อมั่น 95% (CI) 5.54 ถึง 7.85 ผู้เข้าร่วม 1625 คน; 27 การศึกษา ) ความรุนแรงของอาการปวดภายหลังการผ่าตัดที่ 12 และ 24 ชั่วโมงต่ำกว่าอย่างมีนัยสำคัญในกลุ่ม dexamethasone ทาง perineural เมื่อเทียบกับกลุ่มควบคุม (MD ‐2.08, 95% CI ‐2.63 ถึง ‐1.53; ผู้เข้าร่วม 257; 5 การศึกษา) และ (MD ‐1.63, 95% CI ‐2.34 ถึง ‐0.93; ผู้เข้าร่วม 469; 9 การศึกษา ) ตามลำดับ ไม่มีความแตกต่างอย่างมีนัยสำคัญที่ 48 ชั่วโมง (MD ‐0.61, 95% CI ‐1.24 ถึง 0.03; ผู้เข้าร่วม 296 คน; 4 การศึกษา ) โดยพบว่า คุณภาพของหลักฐานต่ำมากสำหรับความรุนแรงของอาการปวดหลังการผ่าตัดที่ 12 ชั่วโมงและต่ำมากสำหรับผลลัพธ์ที่เหลือ การใช้ opioid สะสม ภายหลังผ่าตัด 24 ชั่วโมงในกลุ่ม dexamethasone ทาง perineural ลดลงอย่างมีนัยสำคัญเมื่อเทียบกับยาหลอก (MD 19.25 mg, 95% CI 5.99 ถึง 32.51; ผู้เข้าร่วม 380 คน; 6 การศึกษา )
dexamethasone ทางหลอดเลือดดำเทียบกับยาหลอก
ระยะเวลาของระงับคามรู้สึกภายหลังการบล็อกประสาทสัมผัสนานกว่าอย่างมีนัยสำคัญในกลุ่มที่ได้ dexamethasone ทางหลอดเลือดดำเมื่อเทียบกับยาหลอก (MD 6.21, 95% CI 3.53 ถึง 8.88; ผู้เข้าร่วม 499 คน; 8 การศึกษา ) ความรุนแรงของอาการปวดภายหลังการผ่าตัดที่ 12 และ 24 ชั่วโมงต่ำกว่าอย่างมีนัยสำคัญในกลุ่ม dexamethasone ทางเส้นเลือดดำ เมื่อเทียบกับกลุ่มควบคุม (MD ‐1.24, 95% CI ‐2.44 ถึง ‐0.04; ผู้เข้าร่วม 162 คน; 3 การศึกษา ) และ (MD ‐1.26, 95% CI ‐2.23 ถึง ‐0.29; ผู้เข้าร่วม 257 คน; 5 การศึกษา) ตามลำดับ ไม่มีความแตกต่างอย่างมีนัยสำคัญที่ 48 ชั่วโมง (MD ‐0.21, 95% CI ‐0.83 ถึง 0.41; ผู้เข้าร่วม 172 คน; 3 การศึกษา) คุณภาพของหลักฐานอยู่ในระดับปานกลางสำหรับระยะเวลาของการบล็อกประสาทสัมผัสและความรุนแรงของความเจ็บปวดหลังการผ่าตัดที่ 24 ชั่วโมงและต่ำสำหรับผลลัพธ์ที่เหลือ การใช้ opioid สะสม ภายหลังผ่าตัด 24 ชั่วโมงในกลุ่ม dexamethasone ทาง หลอดเลือดดำลดลงอย่างมีนัยสำคัญเมื่อเทียบกับยาหลอก (MD ‐6.58 mg, 95% CI ‐10.56 ถึง ‐2.60; ผู้เข้าร่วม 287 คน; 5 การศึกษา)
การให้ Dexamethasone ทาง perinerual เทียบกับทางหลอดเลือดดำ
ระยะเวลาของการระงับความรู้สึกภายหลังการบล็อกประสาทสัมผัสนานกว่าอย่างมีนัยสำคัญในกลุ่ม dexamethasone ทาง perineural เมื่อเทียบกับทางหลอดเลือดดำ ในระยเวลาสามชั่วโมง (MD 3.14 ชั่วโมง 95% CI 1.68 ถึง 4.59 ผู้เข้าร่วม 720 คน; 9 การศึกษา ) เราพบว่าความรุนแรงของอาการปวดหลังการผ่าตัดที่ 12 ชั่วโมงและ 24 ชั่วโมงนั้นต่ำกว่าอย่างมีนัยสำคัญในกลุ่ม dexamethasone ทาง perineural เมื่อเทียบกับการให้ทางหลอดเลือดดำอย่างไรก็ตาม MD ไม่ได้เกินความแตกต่างที่สำคัญขั้นต่ำที่กำหนดไว้ล่วงหน้าของเราที่กำหนด Visual Analgue Scale / Numerical Rating Scale = 1.2 ดังนั้นผลลัพธ์จึงไม่มีนัยสำคัญทางคลินิก (MD ‐1.01, 95% CI ‐1.51 ถึง ‐0.50; ผู้เข้าร่วม 217 คน; 3 การศึกษา ) และ (MD ‐0.77, 95% CI ‐1.47 ถึง ‐0.08; ผู้เข้าร่วม 309 คน; 5 การศึกษา) ตามลำดับ. ไม่มีความแตกต่างอย่างมีนัยสำคัญของความรุนแรงของการปวดหลังผ่าตัดที่ 48 ชั่วโมง (MD 0.13, 95% CI ‐0.35 ถึง 0.61; ผู้เข้าร่วม 227 คน; 3 การศึกษา) คุณภาพของหลักฐานอยู่ในระดับปานกลางสำหรับระยะเวลาของการบล็อกประสาทสัมผัสและความรุนแรงของความเจ็บปวดหลังการผ่าตัดที่ 24 ชั่วโมงและต่ำสำหรับผลลัพธ์ที่เหลือ ไม่มีความแตกต่างในการใช้ opioid สะสมภายหลังการผ่าตัดตลอด 24 ชั่วโมงสะสม (MD ‐3.87 mg, 95% CI ‐9.93 ถึง 2.19; ผู้เข้าร่วม 242 คน; 4 การศึกษา)
อุบัติการณ์ของเหตุการณ์ไม่พึงประสงค์ที่รุนแรง
ไม่มีรายงานเหตุการณ์ไม่พึงประสงค์ เหตุการณ์ที่เกี่ยวข้องกับการบล็อก (pneumothorax) เกิดขึ้นกับผู้เข้าร่วมวิจัยรายหนึ่งในการทดลองเปรียบเทียบ dexamethasone ทาง perineural และยาหลอก อย่างไรก็ตามไม่มีการรายงานการจัดสรรกลุ่ม สี่เหตุการณ์ที่ไม่เกี่ยวข้องกับการบล็อกเกิดขึ้นในสองการวิจัย ในการเปรียบเทียบ dexamethasone ทาง perineural, dexamethasone ทางหลอดเลือดดำและยาหลอก ผู้เข้าร่วมสองคนในกลุ่มยาหลอกต้องเข้ารับการรักษาในโรงพยาบาลภายในหนึ่งสัปดาห์หลังการผ่าตัด หนึ่งรายเกิดจากการล้มและอีก 1 รายเกิดจากการติดเชื้อที่ลำไส้ ผู้เข้าร่วมวิจัย 1 รายในกลุ่มยาหลอกเกิดภาวะ Complex Regional Pain Syndrome Type I และ1 รายในกลุ่มที่ได้รับ dexamethasone ทางหลอดเลือดดำเกิดภาวะปอดอักเสบ คุณภาพของหลักฐานต่ำมากเนื่องจากจำนวนเหตุการณ์ที่เกิดน้อยมาก
ข้อสรุปของผู้วิจัย
หลักฐานที่มีคุณภาพต่ำถึงปานกลางแสดงให้เห็นว่าเมื่อใช้เป็นสารเสริมฤทธิ์ในการระงับความรู้สึกที่เส้นประสาทส่วนปลายในการผ่าตัดแขน ในการให้ dexamethasone ทั้งทาง perineural และทางหลอดเลือดดำ อาจช่วยยืดระยะเวลาของการระงับปวดภายหลังการบล็อกประสาทสัมผัสและมีประสิทธิภาพในการลดความรุนแรงของอาการปวดหลังการผ่าตัดและการใช้ opioid ไม่มีหลักฐานเพียงพอที่จะตรวจสอบประสิทธิภาพของ dexamethasone ในการเสริมฤทธิ์ระงับความรู้สึกในการบล็อกเส้นประสาทส่วนปลายในการผ่าตัดขาส่วนล่างและไม่มีหลักฐานในเด็ก ผลการวิจัยของเราอาจไม่สามารถนำไปใช้กับผู้เข้าร่วมวิจัยที่มีความเสี่ยงต่อเหตุการณ์ไม่พึงประสงค์ที่เกี่ยวข้องกับ dexamethasone
ไม่มีหลักฐานเพียงพอที่จะตรวจสอบประสิทธิภาพของ dexamethasone ในการเสริมฤทธิ์ระงับความรู้สึกในการบล็อกเส้นประสาทส่วนปลายในการผ่าตัดขาส่วนล่างและไม่มีหลักฐานในเด็ก ผลการวิจัยของเราอาจไม่สามารถนำไปใช้ได้กับผู้เข้าร่วมวิจัยที่มีความเสี่ยงต่อเหตุการณ์ไม่พึงประสงค์ที่เกี่ยวข้องกับ dexamethasone 9 การวิจัยที่ยังคงดำเนินการวิจัยอยู๋และได้ลงทะเบียนที่ ClinicalTrials.gov อาจเปลี่ยนแปลงผลลัพธ์ของการวิจัยนี้
PICO
ข้้อสรุปภาษาธรรมดา
Dexamethasone และการระงับอาการปวดที่เส้นประสาทส่วนปลาย
การบล็อกเส้นประสาทส่วนปลายคืออะไร?
การระงับความรู้สึกทางเส้นประสาทเป็นการป้องกันหรือบรรเทาความเจ็บปวดโดยการขัดขวางการส่งสัญญาณความเจ็บปวดที่เดินทางไปตามเส้นประสาทไปยังสมอง โดยการฉีดยาชาเฉพาะที่ (สารที่ทำให้เกิดการชา) รอบ ๆ เส้นประสาทระหว่างหรือทันทีหลังการผ่าตัด การบรรเทาอาการปวดจากการบล็อกเส้นประสาทอาจมีฤทธิ์เพียงไม่กี่ชั่วโมงภายหลังการผ่าตัด หลังจากนั้นคนไข้อาจมีอาการปวดในระดับปานกลางถึงรุนแรง
dexamethasone คืออะไร?
Dexamethasone เป็นสเตียรอยด์ที่อาจลดอาการปวดและการตอบสนองต่อการอักเสบที่เกิดจากความเสียหายของเนื้อเยื่อภายหลังหลังการผ่าตัด (ความร้อน ความเจ็บปวด ความแดงและอาการบวม) ในผู้ที่ได้รับการบล็อกเส้นประสาทการให้ dexamethasone ร่วมกับยาชาเฉพาะที่บริเวณเส้นประสาทส่วนปลาย (perineural) หรือเข้าทางหลอดเลือดดำ (ทางหลอดเลือดดำ) เพื่อช่วยเพิ่มเวลาการบรรเทาอาการปวดจากเส้นประสาทส่วนปลาย
นักวิจัยตรวจสอบอะไร
เรามองหาการทดลองที่มีการควบคุมแบบสุ่มซึ่งตรวจสอบว่า dexamethasone ที่ให้ทาง perineural หรือทางหลอดเลือดดำจะช่วยเพิ่มระยะเวลาการบรรเทาอาการปวดจากเส้นประสาทส่วนปลายที่มารับการผ่าตัดแขนหรือขา และการลดความรุนแรงของอาการปวดภายหลังการผ่าตัด นอกจากนี้เรายังตรวจสอบว่า dexamethasone ที่ให้ทาง perineural หรือทางหลอดเลือดดำทำให้เกิดผลข้างเคียงหรือเป็นอันตรายหรือไม่ เราค้นหาวรรณกรรมทางการแพทย์สำหรับบทความที่มีทั้งผู้ใหญ่หรือเด็กที่เข้ารับการผ่าตัดแขนหรือขา และได้รับการระงับความรู้สึกที่เส้นประสาทส่วนปลายที่มีเผยแพร่จนถึงวันที่ 25 เมษายน 2017 เรายังประเมินคุณภาพของหลักฐานสำหรับแต่ละผลลัพธ์
นักวิจัยตรวจสอบอะไร?
เรานำเข้า 35 การศึกษา ผู้เข้าร่วมโครงการ 2702 คน อายุ 15 ถึง 78 ปี
เมื่อเปรียบเทียบกับยาหลอก การให้ยาในกลุ่ม dexamethasone ทาง perineural ช่วยเพิ่มระยะเวลาของการระงับความรู้สึกจากการบล็อกประสาทสัมผัสได้นานถึง 6 ชั่วโมงครึ่ง (27 การศึกษา ผู้เข้าร่วม 1625 คนมีหลักฐานคุณภาพต่ำ) และในกลุ่มที่ให้ dexamethasone ทางหลอดเลือดดำช่วยเพิ่มระยะเวลาของการระงับความรู้สึกจากการบล็อกประสาทสัมผัสได้นานถึง 6 ชั่วโมง (8 การศึกษาผู้เข้าร่วม 499 คน, หลักฐานคุณภาพปานกลาง). เมื่อเปรียบเทียบกับ dexamethasone ทาง perineural และทางหลอดเลือดดำพบว่า ระยะเวลาของการบล็อกประสาทสัมผัสจะนานขึ้นในกลุ่ม dexamethasone ทาง perineural ถึงสามชั่วโมง (9 การศึกษาผู้เข้าร่วม 720 คนหลักฐานคุณภาพปานกลาง)
ในกลุ่ม dexamethasone ทาง perineural พบว่า ความรุนแรงของอาการปวดภายหลังการผ่าตัดที่ 12 ชั่วโมงต่ำกว่าเมื่อเทียบกับกลุ่มที่ได้รับยาหลอก (จาก 5 การศึกษาผู้เข้าร่วม 257 คนมีหลักฐานคุณภาพต่ำมาก) และความรุนแรงของอาการปวดภายหลังการผ่าตัดที่ 24 ชั่วโมง (9 การศึกษาผู้เข้าร่วม 469 รายหลักฐานคุณภาพต่ำ) เมื่อเราเปรียบเทียบ dexamethasone ทางหลอดเลือดดำกับยาหลอกความรุนแรงของอาการปวดหลังการผ่าตัดยังต่ำกว่าในกลุ่ม dexamethasone ทางหลอดเลือดดำมากกว่ากลุ่มที่ได้รับยาหลอกที่ 12 ชั่วโมง (3 การศึกษาผู้เข้าร่วม 162 คน หลักฐานคุณภาพต่ำ) และที่ 24 ชั่วโมง (5 การศึกษาผู้เข้าร่วม 257 คนต่ำ หลักฐานคุณภาพ). ปริมาณยาแก้ปวด opioid ที่ต้องการก็ลดลงเช่นกันในผู้เข้าร่วมวิจัยที่ได้รับ dexamethasone ทาง perineural และทางหลอดเลือดดำ ไม่มีความแตกต่างของความรุนแรงของอาการปวดภายหลังการผ่าตัดหรือปริมาณของยาแก้ปวด opioid ที่ต้องใช้เมื่อเปรียบเทียบกับ dexamethasone ทางperineural และทางหลอดเลือดดำ เราสรุปได้ว่าวิธีหนึ่งในการบริหาร dexamethasone ไม่ได้ช่วยบรรเทาอาการปวดได้ดีกว่าวิธีอื่น
มีรายงานเหตุการณ์ไม่พึงประสงค์ที่ร้ายแรง 5 เหตุการณ์ใน 3 การศึกษา เหตุการณ์ไม่พึงประสงค์ที่เกี่ยวข้องกับการบล็อก (pneumothorax หรือการยุบของปอด) เกิดขึ้นกับผู้เข้าร่วมวิจัยรายหนึ่งในการทดลองเปรียบเทียบ dexamethasone ทาง perineural และยาหลอก อย่างไรก็ตามไม่มีการรายงานว่าเกิดขึ้นในกลุ่มใด 4 ่เหตุการณ์ที่ไม่เกี่ยวข้องกับการบล็อกเกิดขึ้นใน 2 การวิจัย ในการเปรียบเทียบ dexamethasone ทาง perineural, dexamethasone ทางหลอดเลือดดำและยาหลอก ผู้เข้าร่วมวิจัย 2 คนในกลุ่มยาหลอกต้องเข้ารับการรักษาในโรงพยาบาลภายในหนึ่งสัปดาห์หลังการผ่าตัด 1 รายเกิดจากการล้มและอีก 1 รายเกิดจากการติดเชื้อที่ลำไส้ ผู้เข้าร่วมคนหนึ่งในกลุ่มยาหลอกได้เกิดอาการปวดเรื้อรังที่เรียกว่า Complex Regional Pain Sydrome และผู้เข้าร่วมวิจัย 1 คนในกลุ่ม dexamethasone ทางหลอดเลือดเกิดภาวะปอดอักเสบ คุณภาพของหลักฐานสำหรับปัญหาด้านความปลอดภัยต่ำมาก
Authors' conclusions
Summary of findings
| Patient or population: participants undergoing surgery with peripheral nerve block Intervention: perineural dexamethasone Comparison: placebo | ||||
| Outcomes | Anticipated absolute effects* (95% CI) | № of participants | Quality of the evidence | |
| Risk with placebo | Risk with perineural dexamethasone | |||
| Duration of sensory block (we included all studies describing duration of sensory block, regardless of how it was described) | The mean duration of sensory block was 10.2 hours | The mean duration of sensory block in the perineural dexamethasone group was 6.70 hours longer (5.54 longer to 7.85 longer) | 1625 | ⨁⨁◯◯ |
| Incidence of serious adverse events (we used the NIH definition of adverse events. A serious event includes death, a life‐threatening event that requires hospitalization or prolonged hospitalization, disability or congenital anomaly) | In seven studies, authors reported that they assessed for serious adverse events. Five serious adverse events were reported in three studies: one block‐related adverse event (pneumothorax) occurred in one participant in a trial comparing perineural dexamethasone and placebo; however, group allocation was not reported. The remaining non‐block‐related events occurred in two trials comparing perineural dexamethasone, intravenous dexamethasone and placebo. Two participants in the placebo group required hospitalization within one week of surgery; one for a fall, and one for a bowel infection. One participant in the placebo group developed Complex Regional Pain Syndrome Type I and one in the intravenous dexamethasone group developed pneumonia. | 620 (7 RCTs) | ⨁◯◯◯ LOWb | |
| Postoperative pain intensity at 12 hours (assessed by pain scores on an 11‐point VAS) | The mean postoperative pain intensity at 12 hours was 3.0 | The mean postoperative pain score at 12 hours in the perineural dexamethasone group was 2.08 points lower (1.52 lower to 2.63 lower) | 257 | ⨁◯◯◯ LOWc |
| Postoperative pain intensity at 24 hours. (assessed by pain scores on an 11‐point VAS) | The mean postoperative pain intensity at 24 hours was 3.9 | The mean postoperative pain score at 24 hours in the perineural dexamethasone group was 1.63 points lower (0.93 lower to 2.34 lower) | 469 | ⨁⨁◯◯ |
| Postoperative pain intensity at 48 hours (assessed by pain scores on an 11‐point VAS) | The mean postoperative pain intensity at 48 hours was 3.3 | The mean postoperative pain score at 48 hours in the perineural dexamethasone group was 0.61 points lower (1.24 lower to 0.03 higher) | 296 | ⨁⨁◯◯ |
| *The risk in the intervention group (and its 95% confidence interval) is based on the assumed risk in the comparison group and the relative effect of the intervention (and its 95% CI). | ||||
| GRADE Working Group grades of evidence | ||||
| aDowngraded by one level for risk of bias as 19 out of 27 studies are at unclear risk of bias. Reasons include lack of reporting on random sequence generation, concealment allocation, blinding, and attrition bias. Downgraded by one level for inconsistency (I2 = 99%, P value for heterogeneity is < 0.00001) and heterogeneity is not explained by subgroup analyses; point estimates vary widely among studies, confidence intervals show minimal overlap). bDowngraded by one level for risk of bias as four out of the seven studies are at unclear risk of bias. Reasons include lack of reporting on random sequence generation, concealment allocation, blinding, and evidence of selective reporting bias. Downgraded by two levels for imprecision due to very low number of events. c Downgraded by one level for risk of bias. Three out of five studies are at unclear risk of bias. Reasons include lack of reporting on random sequence generation and allocation concealment and evidence of attrition bias, selective reporting bias, and stopping early for benefit. Downgraded by one level for inconsistency (I2 = 61%, P value for heterogeneity is 0.03) and heterogeneity is not explained by subgroup analyses; point estimates vary widely among studies, confidence intervals show minimal overlap dDowngraded by one level for inconsistency (I2 = 80%, P value for heterogeneity is < 0.00001) and heterogeneity is not explained by subgroup analyses; point estimates vary widely across studies. Downgraded by one level for imprecision (95% confidence interval includes no clinical effect and a clinical effect). By no clinical effect we mean the lower bound of the CI did not surpass our chosen MID threshold of 1.2 on VAS. e Downgraded by two levels for imprecision because of a sparse number of participants (n=296) and a very wide confidence interval demonstrating that the treatment effect is not statistically significant and of questionable clinical significance. | ||||
| Patient or population: participants undergoing surgery with peripheral nerve block Intervention: intravenous dexamethasone Comparison: placebo | ||||
| Outcomes | Anticipated absolute effects* (95% CI) | № of participants | Quality of the evidence | |
| Risk with placebo | Risk with intravenous dexamethasone | |||
| Duration of sensory block (we included all studies describing duration of sensory block regardless of how it was described) | The mean duration of sensory block was 16.1 hours | The mean duration of sensory block in the intravenous dexamethasone group was 6.21 hours longer (3.53 longer to 8.88 longer) | 499 | ⨁⨁⨁◯ |
| Incidence of serious adverse events (we used the NIH definition of adverse events. A serious event includes death, a life‐threatening event that requires hospitalization or prolonged hospitalization, disability or congenital anomaly) | Please see incidence of serious adverse events in the perineural dexamethasone versus placebo 'Summary of findings' table. | |||
| Postoperative pain intensity at 12 hours (measured using pain scores on an 11‐point VAS) | The mean postoperative pain score at 12 hours was 2.6 | The mean postoperative pain score at 12 hours in the intravenous dexamethasone group was 1.24 points lower (2.44 lower to 0.04 lower) | 162 | ⨁⨁◯◯ |
| Postoperative pain intensity at 24 hours | The mean postoperative pain score at 24 hours was 4.4 | The mean postoperative pain score at 24 hours in the intravenous dexamethasone group was 1.26 points lower (2.23 lower to 0.29 lower) | 257 | ⨁⨁◯◯ |
| Postoperative pain intensity at 48 hours (measured using pain scores on an 11‐point VAS) | The mean postoperative pain score at 48 hours was 3.7 | The mean postoperative pain score at 48 hours in the intravenous dexamethasone group was 0.21 points lower (0.83 lower to 0.41 higher) | 172 | ⨁⨁◯◯ |
| *The risk in the intervention group (and its 95% confidence interval) is based on the assumed risk in the comparison group and the relative effect of the intervention (and its 95% CI). | ||||
| GRADE Working Group grades of evidence | ||||
| aDowngraded by one level for inconsistency (considerable heterogeneity (I2 = 88% and P value for heterogeneity <0.0001) and subgroup analyses did not explain observed heterogeneity. Downgraded by one level for imprecision because of a sparse number of participants (n=162). bDowngraded by one level for inconsistency (I2 = 61% and P value for heterogeneity 0.08) and subgroup analyses did not explain observed heterogeneity. Downgraded by one level for imprecision. Confidence interval includes both no clinical effect (minimally important difference 1.2 on VAS) and clinical effect (minimally important difference greater than 1.2 on VAS). cDowngraded by one level for inconsistency(I2 = 65% and P value for heterogeneity 0.02) and subgroup analyses did not explain observed heterogeneity. Point estimates vary widely across studies. Downgraded by one level for imprecision (95% confidence interval includes no clinical effect and a clinical effect). By no clinical effect we mean the lower bound of the CI did not surpass our chosen MID threshold of 1.2 on VAS. dDowngraded by two levels for precision (small sample size (n=172) and confidence interval crosses the line of null effect).. | ||||
| Patient or population: peripheral nerve block Setting: people undergoing upper or lower limb surgery with peripheral nerve block in hospitals in Australia, Belgium, Brazil, Canada and USA Intervention: perineural dexamethasone Comparison: intravenous dexamethasone | ||||
| Outcomes | Anticipated absolute effects* (95% CI) | № of participants | Quality of the evidence | |
| Risk with intravenous dexamethasone | Risk with perineural dexamethasone | |||
| Duration of sensory block (we included all studies describing duration of sensory block regardless of how it was described) | The mean duration of sensory block was 20.6 hours | The mean duration of sensory block in the perineural dexamethasone group was 3.13 hours longer (1.68 longer to 4.58 longer) | 720 | ⨁⨁⨁◯ |
| Incidence of serious adverse events (we used the NIH definition of adverse events. A serious event includes death, a life‐threatening event that requires hospitalization or prolonged hospitalization, disability or congenital anomaly) | Please see incidence of serious adverse events in the perineural dexamethasone versus placebo 'Summary of findings' table. | |||
| Postoperative pain intensity at 12 hours (measured using pain scores on an 11‐point VAS) | The mean postoperative pain score at 12 hours was 2.3 | The mean postoperative pain score at 12 hours in the perineural dexamethasone group was 1.01 points lower (0.50 lower to 1.51 lower) | 217 | ⨁⨁◯◯ |
| Postoperative pain intensity at 24 hours (measured using pain scores on an 11‐point VAS) | The mean postoperative pain score at 24 hours was 2.9 | The mean postoperative pain score at 24 hours in the perineural dexamethasone group was 0.77 points lower (0.08 lower to 1.47 lower) | 309 | ⨁⨁⨁◯ |
| Postoperative pain intensity at 48 hours (measured using pain scores on an 11‐point VAS) | The mean postoperative pain score at 48 hours was 2.8 | The mean postoperative pain score at 48 hours in the perineural dexamethasone group was 0.13 points higher (0.35 lower to 0.61 higher) | 227 | ⨁⨁◯◯ |
| *The risk in the intervention group (and its 95% confidence interval) is based on the assumed risk in the comparison group and the relative effect of the intervention (and its 95% CI). | ||||
| GRADE Working Group grades of evidence | ||||
| aDowngraded by one level for inconsistency (I2 = 67% and P value for heterogeneity is 0.001). bDowngraded by one level for risk of bias. Two out of the three studies are at unclear risk of bias. Reasons include unclear random sequence generation, unclear allocation concealment, and selective outcome reporting. Downgraded by one level for imprecision because of a sparse number of participants (n=217) and because the 95% confidence interval includes no clinical effect and a clinical effect. By no clinical effect we mean the lower bound of the CI did not surpass our chosen MID threshold of 1.2 on VAS. cDowngraded by one level for imprecision (95% confidence interval includes no clinical effect and a clinical effect). By no clinical effect we mean the lower bound of the CI did not surpass our chosen MID threshold of 1.2 on VAS. dDowngraded by one level for risk of bias. The one study that is at unclear risk of bias contributes half the data for this outcome. Downgraded by one level for imprecision because of a small sample size (n=227). | ||||
Background
Description of the condition
Peripheral nerve block is a technique whereby local anaesthetic solution is infiltrated perineurally to provide anaesthesia, or analgesia, or both. Peripheral nerve block for intraoperative and postoperative pain management is associated with improved analgesia, fewer opioid‐related adverse events, earlier ambulation, and shorter hospital stay when compared with intravenous opioid analgesia alone (Barreveld 2013; Charlton 2010; Lin 2013). A limitation to the use of peripheral nerve blocks is that the analgesic effect of the block lasts only a few hours, resulting in early, moderate to severe pain, and thus the need for adjuvant therapies (Choi 2014; Cummings 2011). Peripheral nerve catheters that provide continuous infusion of local anaesthetic have been used to prolong the effects of local anaesthesia; however, continuous catheters require greater time and skill to insert than single‐shot peripheral block, may dislodge while in use, may be difficult to remove, and may add additional costs to health care (Adhikary 2012; Bowens 2011; Choi 2014). Several adjuvants have been used to attempt to prolong the analgesia provided by peripheral nerve block, including perineural and intravenous dexamethasone (Brummett 2012; Choi 2014; Popping 2009).
Description of the intervention
Dexamethasone is a corticosteroid drug that has been used as an adjuvant to reduce postoperative pain. Two systematic reviews have shown that study participants who received a single dose of intravenous dexamethasone perioperatively had lower pain scores and decreased opioid consumption after surgery compared with those given placebo (De Oliveira 2011; Waldron 2013). De Olivera 2013 studied three different intravenous doses: low‐dose (< 0.10 mg/kg), intermediate‐dose (0.11 to 0.20 mg/kg) and high‐dose (≥ 0.21 mg/kg). Low‐dose dexamethasone was not effective in reducing pain and opioid consumption; however, intermediate and high doses were effective (De Olivera 2013). Waldron 2013 performed a subgroup analysis of two doses of dexamethasone: 4 mg to 5 mg; and 8 mg to 10 mg, and did not find a dose‐response relationship.
Several randomized control trials (RCTs) have studied the use of perineural dexamethasone (i.e. dexamethasone added to the local anaesthesia solution) as an adjuvant to peripheral nerve block to improve analgesia provided by local anaesthetic alone (Bias 2014; Biradar 2013; Cummings 2011; Dar 2013; Golwala 2009; Movafegh 2006; Parrington 2010; Shaikh 2013; Tandoc 2011; Viera 2010; Yadov 2008). Perineural dexamethasone, as an adjuvant to peripheral nerve block, has been associated with faster onset of anaesthesia (Golwala 2009; Shrestha 2003; Talukdar 2013; Yadov 2008), longer duration of anaesthesia/analgesia (Biradar 2013; Cummings 2011; Dar 2013; Golwala 2009Movafegh 2006; Parrington 2010; Shaikh 2013; Talukdar 2013; Tandoc 2011; Viera 2010; Vishnu 2014), decreased postoperative pain intensity (Cummings 2011; Dar 2013; Tandoc 2011; Yadov 2008), and decreased postoperative analgesia requirements compared with local anaesthetic alone (Shaikh 2013; Talukdar 2013; Tandoc 2011; Vishnu 2014; Yadov 2008).
Five systematic reviews have evaluated the efficacy of perineural dexamethasone versus placebo in participants undergoing surgery with peripheral nerve block. The number of trials and participants in each trial are as follows: Albrecht 2015 ‐ 29 trials, 1695 participants; Choi 2014 ‐ nine trials, 809 participants; De Oliveira 2014 ‐ nine trials, 760 participants; Huynh 2015 ‐ 12 trials, 512 participants; and Knezivic 2015 ‐ 14 trials, 1022 participants.
In all five reviews, the use of perineural dexamethasone was associated with longer duration of sensory block compared with placebo (Albrecht 2015; Choi 2014; De Oliveira 2014; Huynh 2015, Knezivic 2015). Neither the De Oliveira 2014 review nor the Huynh 2015 review found a difference in intensity of postoperative pain among participants who received perineural dexamethasone compared with placebo. The Knezivic 2015 review found intensity of pain at 24 and 48 hours after surgery was lower with dexamethasone compared with block alone. The remaining reviews did not evaluate intensity of postoperative pain (Albrecht 2015; Choi 2014). Opioid consumption was evaluated in three of five reviews. The De Oliveira 2014 and Knezivic 2015 reviews found a reduction in opioid consumption among participants who received perineural dexamethasone but the Choi 2014 review did not. Similarly, only two reviews evaluated postoperative nausea and vomiting, both reporting a reduction in the incidence of postoperative nausea and vomiting among participants who received perineural dexamethasone (Albrecht 2015; Huynh 2015). None of the reviews compared perineural dexamethasone with systemic dexamethasone, or systemic dexamethasone with placebo.
How the intervention might work
The exact mechanism by which dexamethasone reduces pain is not known. The decrease in pain intensity and the prolonged analgesia attained with the use of perineural dexamethasone may be the result of a local, or systemic action, or both (Fredrickson 2013). Dexamethasone may act locally on glucocorticosteroid receptors to induce vasoconstriction, thereby decreasing systemic absorption of local anaesthetics (Shishido 2002; Wang 2011). Other potential mechanisms of action include suppression of C‐fibre transmission of pain signals and direct action on the nerve cell to reduce neural discharge (Johansson 1990). Dexamethasone may act systemically by reducing the inflammatory response caused by surgical tissue injury (Christiansson 2009).
Why it is important to do this review
It is important to treat postoperative pain effectively. People who experience severe pain in the early postoperative period are at risk for development of chronic pain (Kehlet 2006; Vandenkerkoff 2012), which can dramatically affect their quality of life (Galvez 2007; Lame 2005; Smith 2007), and increase healthcare costs (Blyth 2003). In an attempt to augment postoperative pain management, people are often treated with opioids, which are associated with adverse events such as respiratory depression, nausea, vomiting, constipation and pruritus. Adequate treatment of people with pain through the use of peripheral nerve block may result in reduced opioid use and fewer opioid‐related harms (Avidan 2003; Hadzic 2005).
Use of perineural dexamethasone as an adjuvant to peripheral nerve block for postoperative pain is controversial. Animal studies have suggested that perineural dexamethasone is neurotoxic to peripheral nerves and has the potential to cause peripheral nerve damage; however, data in humans are limited (Ma 2010). Although no symptoms of peripheral nerve damage were reported in four RCTs examining perineural versus intravenous dexamethasone (Abdallah 2015; Desmet 2013; Kawanishi 2014; Rahangdale 2014), these studies may have been underpowered to detect differences in potential neurotoxic events (Williams 2014). Furthermore, in most studies, participants were followed for short periods (24 to 48 hours). Thus, adverse events such as persistent nerve palsy caused by peripheral nerve damage may not have been detected.
Intravenous dexamethasone may be used as an alternative to perineural dexamethasone and as an adjuvant to peripheral nerve block. In four RCTs, the effects of perineural and intravenous dexamethasone in participants receiving peripheral nerve block were studied (Abdallah 2015; Desmet 2013; Kawanishi 2014; Rahangdale 2014). In three of these studies, both perineural and intravenous dexamethasone were associated with prolonged sensory block when compared with placebo (Abdallah 2015; Desmet 2013; Rahangdale 2014). In one study, perineural but not intravenous dexamethasone was associated with prolonged sensory block when compared with placebo (Kawanishi 2014). In all four studies, no difference was observed in the duration of sensory block when perineural and intravenous dexamethasone were compared with each other.
Single‐dose intravenous dexamethasone is associated with complications such as hyperglycaemia, perineal irritation, postoperative infection, and delayed wound healing (Bartlett 2013; Crandell 2004; Pasternak 2004; Percival 2010; Perron 2003; Yared 2000). Rare adverse events include tumour lysis syndrome and psychosis after a single dose and avascular necrosis of bone after short‐term use (Fast 1984; Lerza 2002; Mc Donnell 2008; McKee 2001).
Although four systematic reviews have compared the efficacy of perineural dexamethasone versus placebo (Albrecht 2015; Choi 2014; De Oliveira 2014; Huynh 2015), to date, no comprehensive review has compared each method of dexamethasone delivery versus placebo, or perineural versus intravenous dexamethasone.
Objectives
To evaluate the comparative efficacy and safety of perineural dexamethasone versus placebo, intravenous dexamethasone versus placebo, and perineural dexamethasone versus intravenous dexamethasone when added to peripheral nerve block for postoperative pain control in people undergoing surgery.
Methods
Criteria for considering studies for this review
Types of studies
We included all randomized controlled trials (RCTs) that evaluated the effectiveness of dexamethasone as an adjuvant to peripheral nerve block, irrespective of blinding and other design features (parallel or factorial). We did not exclude any study on the basis of language of publication or publication status. We excluded observational studies, quasi‐randomized trials and cluster‐randomized trials.
Types of participants
We included children (aged 1 month to 18 years) and adults (aged 19 years and older) undergoing upper and lower limb surgery who received a peripheral nerve block or a peripheral nerve block with the addition of dexamethasone. We excluded neonates.
Types of interventions
Our intervention groups included the following.
-
Participants who received peripheral nerve block and perineural dexamethasone (dexamethasone mixed with the local anaesthetic solution) versus those receiving peripheral nerve block and a perineural placebo or a non‐active comparator.
-
Participants who received peripheral nerve block and intravenous dexamethasone versus those receiving peripheral nerve block and intravenous placebo or a non‐active comparator.
-
Participants who received peripheral nerve block and perineural dexamethasone versus those receiving peripheral nerve block and intravenous dexamethasone.
We excluded participants who received local anaesthetic, or dexamethasone, or both, via more than one route (e.g. perineurally and subcutaneously).
Types of outcome measures
Primary outcomes
-
Duration of sensory block. We included all studies describing duration of sensory block regardless of how it was described.
-
Incidence of serious adverse events. We used the National Institutes of Health (NIH) definition of adverse events. A serious event includes death, a life‐threatening event that requires hospitalization or prolonged hospitalization, disability or congenital anomaly (NIH 2013).
Secondary outcomes
-
Duration of motor block. We included all studies describing duration of motor block, regardless of how it was described.
-
Incidence of mild to moderate adverse events such as nausea/vomiting, pruritus, somnolence, oxygen desaturation, urinary retention, numbness/tingling.
-
Postoperative pain intensity (pain scores) at 12, 24 and 48 hours.
-
Postoperative opioid consumption at 12, 24 and 48 hours. We converted all opioids to oral morphine equivalents.
-
Participant satisfaction with pain control. Participant satisfaction is typically measured on a numerical rating scale (NRS).
Search methods for identification of studies
Electronic searches
We searched the Cochrane Central Register of Controlled Trials (CENTRAL) (inception to 25 April 2017), (Appendix 1) MEDLINE via Ovid (1966 to 25 April 2017) (Appendix 2), Embase via Ovid (1947 to 25 April 2017) (,Appendix 3) the Database of Abstracts of Reviews of Effectiveness (DARE) (inception to 25 April 2017), and Web of Science (Appendix 4) and Scopus (inception to 25 April 2017) . An experienced librarian assisted with the search strategy. The MEDLINE search strategy presented in Appendix 2 was adopted for searching the DARE and Scopus databases. We did not impose any language restrictions.
Searching other resources
We reviewed the reference lists of all included trials for additional studies that met our criteria, as well as trial registry databases (ClinicalTrials.gov (clinicaltrials.gov), EU Cinical Trials Register (clinicaltrialsregister.eu), and Current Controlled Trials (isrctn.com), Google Scholar and meeting abstracts from the American Society of Anesthesiologists, the Canadian Anesthesiologists' Society, the American Society of Regional Anesthesia, and the European Society of Regional Anaesthesia (2010 to April 2017).
Data collection and analysis
Selection of studies
Using the results of all searches, two review authors (AK and CP) independently screened titles and abstracts for eligibility according to the following criteria:.
-
The study described was an RCT.
-
Participants received a peripheral nerve block.
-
Dexamethasone was given perineurally (mixed with the local anaesthetic) or intravenously.
In cases of disagreement on eligibility, we consulted a third review author (BJ) to determine eligibility. If additional information was required, we contacted the first author of the trial.
Data extraction and management
Two review authors (AP and CP) independently extracted data and assessed the quality of each trial using a standardized, pre‐piloted form (Appendix 5). We resolved disagreements through discussion with a senior review author (BJ).
Assessment of risk of bias in included studies
Using the Cochrane 'Risk of bias' instrument, we assessed the risk of bias of each study using the following domains (Higgins 2011).
-
Random sequence generation.
-
Allocation concealment.
-
Blinding of participants and personnel.
-
Blinding of outcome assessment.
-
Selective reporting.
-
Missing participant data.
For each study, we classified risk of bias of each domain as low, high or unclear. If risk of bias was low for all domains or was low for five out of the six domains then we classified the risk of bias as low for that study. If two or more domains were classified as high or unclear risk of bias, we determined the study to be at high or unclear risk of bias, respectively.
Measures of treatment effect
We analysed continuous outcomes including pain scores, analgesic consumption, duration of sensory and motor block. and participant satisfaction by calculating the mean difference (MD) with corresponding 95% confidence interval (CI). We pooled dichotomous outcomes to calculate the risk ratio (RR) and the risk difference (RD) with corresponding 95% CI. We assumed a normal distribution of pain scores on the Visual Analogue Scale (VAS) or the numerical rating scale (NRS) among intervention and placebo groups, and we considered a 1.2 cm change/1.2 point change on the VAS/NRS as representative of a minimally important difference (MID) in acute pain (Johnston 2013; Kelly 2001).
Unit of analysis issues
We avoided unit of analysis errors as follows: if included studies had more than two study arms, we combined relevant groups to create a single pair‐wise comparison, or, if not possible, we selected one pair of interventions and excluded the others.
Dealing with missing data
We assessed the completeness of outcome data and determined whether missing outcome data may put continuous and dichotomous outcomes at risk of bias. If primary analyses for our critical outcome of interest suggested significant benefit (or harm), we conducted a sensitivity meta‐analysis to address missing participant data (Akl 2012; Ebrahim 2013).
To determine whether missing participant data represented risk of bias for continuous outcomes (pain at 12, 24 and 48 hours), we used the method described by Ebrahim 2013. For each outcome with missing data, we used four progressively stringent data input strategies based on observed outcomes for those individuals in the intervention and placebo arms for whom data were not missing.
If we found a significant difference in serious adverse events, to determine whether missing participant data represented risk of bias for dichotomous outcomes (serious adverse events), we conducted a sensitivity meta‐analysis using the worst‐case scenario assumption described by Akl 2013. If results were robust to the worst‐case scenario (all missing participants in the treatment experienced the outcome of interest, and none of the participants in the placebo group did), we concluded that the missing data did not represent a source of bias. If results of the sensitivity meta‐analysis were not robust to the worst‐case scenario, we tested more plausible assumptions. For participants missing from the intervention group, we assumed a range of ratios of event rates for those with missing data compared with those successfully followed of 2:1, 3:1 and 5:1 (Akl 2012).
Assessment of heterogeneity
We used the Cochran Q and I2 tests to assess the potential for statistical heterogeneity between trials. For the Cochran Q, the null hypothesis is that the underlying effect is the same in each of the included studies. A P value less than 0.10 means that random error provides an unlikely explanation for observed differences in study results between trials. The I2 statistic shows the percentage of variability due to differences between studies such that I2 > 75% indicates considerable heterogeneity (Higgins 2011; Riley 2011).
Assessment of reporting biases
For outcomes reported in 10 or more trials, we assessed publication biases using a funnel plot (Higgins 2011).
Data synthesis
We entered data into Review Manager statistical software and analysed data using the DerSimonian‐Laird random‐effects model (Review Manager 2014).
If data for some outcomes were not amenable to meta‐analysis, we planned to use tables to describe the characteristics of each trial that contributed to our a priori outcomes. We planned to describe all trial populations, interventions, comparator(s), outcome(s) and follow‐up time points for outcomes not amenable to meta‐analysis.
Subgroup analysis and investigation of heterogeneity
We analysed the following subgroups.
-
Long‐acting local anaesthetics (e.g. ropivacaine, bupivacaine, levobupivacaine) versus medium‐acting local anaesthetics (e.g. lidocaine, mepivacaine).
-
Additives to local anaesthetics (e.g. clonidine, epinephrine) versus no additives to local anaesthetics.
-
Low‐dose dexamethasone (4 mg to 5 mg) versus high‐dose dexamethasone (8 mg to 10 mg).
-
Adult versus paediatric participants. (See Differences between protocol and review)
-
Studies at high/unclear risk of bias versus studies at low risk of bias.
Following are our a priori hypotheses for explaining heterogeneity between trials.
-
For the outcome, duration of sensory block, we anticipated that participants receiving dexamethasone along with long‐acting local anaesthetics (e.g. ropivacaine, bupivacaine, levobupivacaine) would show larger effects than those receiving dexamethasone with medium‐acting local anaesthetics (e.g. lidocaine, mepivacaine).
-
Choi et al in a systematic review and meta‐analysis compared the effects of short‐acting local anaesthetics and medium‐acting anaesthetics and found that the duration of analgesia in participants receiving long‐acting anaesthetics was longer than those receiving medium‐acting local anaesthetics (Choi 2014).
-
-
For the outcome, duration of sensory block, we anticipated that participants who receive additives to local anaesthesia (e.g. clonidine, epinephrine) would show a larger effect than those who do not.
-
In a systematic review of 20 RCTs of 573 participants, Popping and colleagues found that the duration of intermediate and long‐acting local anaesthetics was longer in participants who received clonidine (Popping 2009).
-
-
Although we conducted a subgroup analysis on dose of dexamethasone for the outcomes: pain intensity, duration of analgesia, and serious adverse events, we did not expect that participants who receive high‐dose dexamethasone would show any difference in effect when compared with those receiving low‐dose dexamethasone.
-
Albrecht and colleagues, in a systematic review of 29 RCTs of 1695 participants did not find a difference in duration of analgesia in participants who received 4 mg of dexamethasone compared with those who received 8 mg (Albrecht 2015). Differences in other outcomes, including intensity of pain and adverse events were not reported.
-
-
For the outcome of adult versus paediatric participants, we did not anticipate a difference in duration of analgesia or intensity of pain.
-
Currently, no evidence supports that the pharmacokinetics of dexamethasone is different in children when compared with adults.
-
-
For the outcomes of intensity of pain and duration of sensory block, we expected that trials with high risk of bias would show a larger effect than those with low risk of bias.
-
Our subgroup on risk of bias is based on previous literature suggesting that studies at high risk of bias are more likely to overestimate treatment effects (Nuesch 2009; Wood 2008).
-
Sensitivity analysis
We conducted a sensitivity analysis to assess the completeness of outcome data and to determine whether missing outcome data put continuous and dichotomous outcomes at risk of bias, using the methods described in Dealing with missing data.
'Summary of findings' table and GRADE
Two review authors (AP and CP) independently prepared a 'Summary of findings' table using GRADEprofiler software to assess the confidence of estimates of effect (GRADEpro GDT 2015), for the following outcomes of interest.
-
Duration of sensory block.
-
Incidence of serious adverse events
-
Postoperative pain intensity at 12 hours.
-
Postoperative pain intensity at 24 hours.
-
Postoperative pain intensity at 48 hours.
We used GRADE principles as described by Guyatt 2008, to independently assess the confidence in our pooled estimates of effect (i.e. overall quality of evidence) using the following criteria.
-
Risk of bias.
-
Consistency.
-
Directness.
-
Precision.
-
Reporting bias.
For RCTs, we initially assigned high confidence ratings, but rated confidence as moderate, low or very low if we detected issues with risk of bias, consistency or other GRADE criteria. In particular, we categorized the quality of each pooled estimate as high (we are very confident that the true effect lies close to that of the estimate of the effect), moderate (we are moderately confident in the effect estimate ‐ the true effect is likely to be close to the estimate of the effect, but may be substantially different), low (our confidence in the effect estimate is limited ‐ the true effect may be substantially different from the estimate of the effect) or very low (we have very little confidence in the effect estimate ‐ the true effect is likely to be substantially different from the estimate of effect) (Guyatt 2008).
We referred discrepancies in assessment of the quality of evidence to a third review author (BJ) for a final decision.
Results
Description of studies
Results of the search
Please see the PRISMA flowchart for the selection process of the included studies (Figure 1):
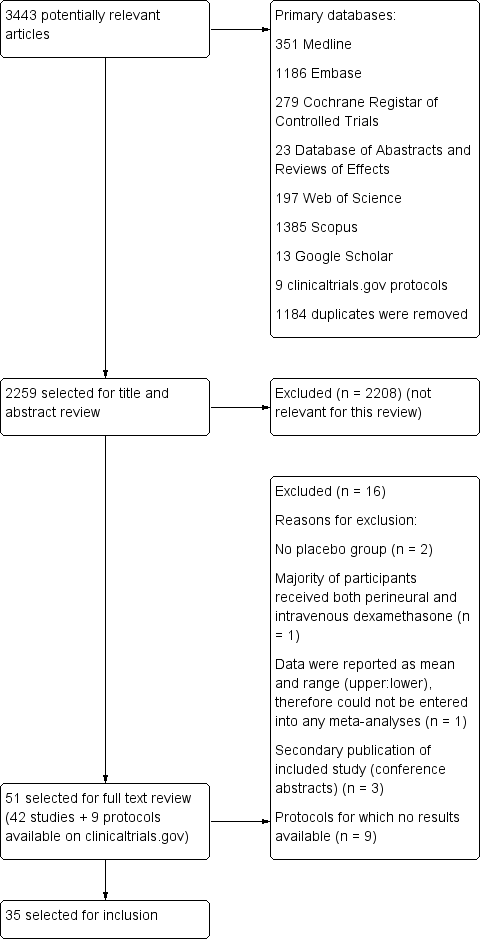
Flow diagram of included studies.
We identified 3443 unique records in our literature search. Of these, 51 were potentially eligible. Nine were protocols found on ClinicalTrials.gov for which no results were available (NCT01277159; NCT01495624; NCT01586806; NCT01971645; NCT02178449; NCT02322242; NCT02436694; NCT02462148; NCT02506660). We excluded seven studies: two because there was no placebo group (Fredrickson 2013; Shethra 2007); one because participants received both perineural and intravenous dexamethasone (Lui 2015): one because the authors reported only a means without any variances, therefore we could not enter the data into a meta‐analysis (Percec 2014); and three were secondary publications of included studies (Arora 2010; Desmet 2012; Kim 2010), leaving 35 for inclusion in the review.
Included studies
Participants
The 35 included trials involved 2702 participants. All studies were in Americal Anesthesiology Society (ASA) I to III adolescent and adult participants aged 15 to 78 years. We did not find any studies in children aged less than 15 years. Length of follow‐up ranged from one day to six months after surgery. Surgical procedures included the forearm and hand (not including the elbow) (Abdallah 2015; Aliste 2017; Alarasan 2017; Lee 2016; Leurcharusmee 2016; Movafegh 2006; Parrington 2010; Saritas 2014; Shah 2015; Yadov 2008), forearm and hand (including the elbow) (Biradar 2013; Shah 2015; Shaikh 2013), arthroscopic shoulder (Chalifoux 2017; Chun 2016; Desmet 2013; Jadon 2015; Kawanishi 2014; Kim 2012; Sakae 2017; Tandoc 2011; Viera 2010; Woo 2015), both arthroscopic and open shoulder (Cummings 2011; Nallam 2014; Rosenfeld 2016), upper limb (Bias 2014; Dar 2013; Ganvit 2014; Golwala 2009; Kumar 2014; Talukdar 2013; Vishnu 2014), rotator cuff repair or subacromial decompression (Desmet 2015), and foot and ankle (Dawson 2016; Rahangdale 2014).
Type of block included interscalene brachial plexus (Chun 2016; Chalifoux 2017; Cummings 2011; Desmet 2013; Desmet 2015; Ganvit 2014; Jadon 2015; Kawanishi 2014; Kim 2012; Nallam 2014; Tandoc 2011; Viera 2010; Woo 2015), supraclavicular brachial plexus (Abdallah 2015; Alarasan 2017; Bias 2014; Biradar 2013; Dar 2013; Golwala 2009; Kumar 2014; Parrington 2010; Shaikh 2013; Talukdar 2013; Vishnu 2014; Yadov 2008), axillary brachial plexus (Aliste 2017; Movafegh 2006; Rosenfeld 2016; Saritas 2014), infraclavicular brachial plexus (Leurcharusmee 2016; Sakae 2017; Shah 2015), sciatic nerve (Rahangdale 2014), and ankle block (Dawson 2016).
Exclusion criteria
Exclusion criteria were: pregnancy (Abdallah 2015; Biradar 2013; Chalifoux 2017; Cummings 2011; Desmet 2013; Desmet 2015; Ganvit 2014; Golwala 2009; Kawanishi 2014; Kim 2012; Kumar 2014; Movafegh 2006; Rahangdale 2014; Sakae 2017; Saritas 2014; Talukdar 2013; Viera 2010; Yadov 2008), neurological deficit or neuropathy (Aliste 2017; Biradar 2013; Chalifoux 2017; Chun 2016; Cummings 2011; Desmet 2013; Desmet 2015; Ganvit 2014; Kawanishi 2014; Kim 2012; Kumar 2014; Leurcharusmee 2016; Parrington 2010; Rahangdale 2014; Sakae 2017; Shah 2015; Talukdar 2013; Tandoc 2011; Vishnu 2014), peptic ulcer (Biradar 2013; Ganvit 2014; Golwala 2009; Kawanishi 2014; Kumar 2014; Movafegh 2006; Parrington 2010; Shah 2015; Shaikh 2013; Talukdar 2013; Woo 2015; Yadov 2008), diabetes mellitus (Abdallah 2015; Biradar 2013; Chun 2016; Desmet 2013; Desmet 2015; Ganvit 2014; Golwala 2009; Kawanishi 2014; Kim 2012; Lee 2016; Parrington 2010; Rahangdale 2014; Rosenfeld 2016; Shaikh 2013; Talukdar 2013; Vishnu 2014; Woo 2015), hypertension (Biradar 2013; Ganvit 2014; Tandoc 2011; Yadov 2008), endocrine disorder (Biradar 2013; Kumar 2014; Sakae 2017; Saritas 2014; Shah 2015), cardiac disease (Biradar 2013; Kumar 2014; Saritas 2014; Sakae 2017; Shah 2015; Yadov 2008), circulatory instability (Golwala 2009), hepatic or renal disease (Aliste 2017; Biradar 2013; Ganvit 2014; Golwala 2009; Kawanishi 2014; Kumar 2014; Lee 2016; Leurcharusmee 2016; Movafegh 2006; Sakae 2017; Saritas 2014: Shaikh 2013; Talukdar 2013), lung disease (Desmet 2013 , Desmet 2015; Kim 2012; Kumar 2014; Shah 2015; Tandoc 2011; Rosenfeld 2016; Woo 2015), respiratory disorder (Chun 2016; Yadov 2008), psychiatric history (Abdallah 2015, Kumar 2014; Shah 2015; Yadov 2008), clavicular fracture (Abdallah 2015), electrolyte imbalance, (Saritas 2014), head injury (Kumar 2014; Sakae 2017; Shah 2015), neuromuscular disease (Shaikh 2013; Yadov 2008), drug/alcohol dependency (Kawanishi 2014; Kim 2012; Kumar 2014; Talukdar 2013; Yadov 2008), pre‐existing chronic pain (Abdallah 2015; Chalifoux 2017; Kim 2012), preoperative opioid use (Biradar 2013; Chun 2016; Dawson 2016; Kawanishi 2014; Movafegh 2006; Sakae 2017; Rahangdale 2014; Rosenfeld 2016; Sakae 2017; Shah 2015; Woo 2015), preoperative corticosteroid use (Chalifoux 2017; Chun 2016; Cummings 2011; Dawson 2016; Desmet 2013; Desmet 2015; Golwala 2009; Kumar 2014; Rahangdale 2014; Sakae 2017; Talukdar 2013; Vishnu 2014; Woo 2015), contraindication to peripheral nerve block (skin infection, coagulopathy, bleeding diathesis, deformities in the operative site (Abdallah 2015; Aliste 2017; Bias 2014; Chalifoux 2017; Chun 2016; Cummings 2011; Dawson 2016; Jadon 2015; Kawanishi 2014; Kim 2012; Kumar 2014; Lee 2016; Leurcharusmee 2016; Sakae 2017; Shah 2015; Talukdar 2013; Tandoc 2011; Vishnu 2014; Woo 2015), allergy/hypersensitivity to any of the study drugs (Abdallah 2015; Bias 2014; Biradar 2013; Dawson 2016; Desmet 2013; Desmet 2015; Ganvit 2014; Golwala 2009; Jadon 2015; Kim 2012; Kumar 2014; Parrington 2010; Rahangdale 2014; Rosenfeld 2016; Shaikh 2013; Shah 2015; Shaikh 2013; Tandoc 2011; Viera 2010; Vishnu 2014; Woo 2015).
Settings
All trials took place between 2006 and 2017 in hospital settings in Australia (Dawson 2016), Bangledesh (Talukdar 2013), Belguim (Desmet 2013; Desmet 2015), Brazil (Sakae 2017), Canada (Abdallah 2015; Aliste 2017; Chalifoux 2017; Leurcharusmee 2016; Parrington 2010), India (Alarasan 2017; Bias 2014; Dar 2013; Ganvit 2014; Golwala 2009; Jadon 2015; Kumar 2014; Nallam 2014; Shah 2015; Shaikh 2013; Vishnu 2014), Iran (Movafegh 2006), Japan (Kawanishi 2014), Korea (Chun 2016; Kim 2012; Lee 2016; Woo 2015), Nepal (Yadov 2008), Thailand (Aliste 2017; Leurcharusmee 2016), Turkey (Saritas 2014), and USA (Cummings 2011; Rahangdale 2014; Rosenfeld 2016; Tandoc 2011; Viera 2010).
Interventions
Twenty‐three studies (1488 participants) compared perineural dexamethasone and placebo (Alarasan 2017; Bias 2014; Biradar 2013; Cummings 2011; Dar 2013; Ganvit 2014; Golwala 2009; Jadon 2015; Kim 2012; Kumar 2014; Lee 2016; Movafegh 2006; Nallam 2014; Parrington 2010; Saritas 2014; Shah 2015; Shaikh 2013; Talukdar 2013; Tandoc 2011; Viera 2010; Vishnu 2014; Woo 2015; Yadov 2008), two (n = 195) compared intravenous dexamethasone and control (Chalifoux 2017; Desmet 2015), four (n = 460) compared perineural and intravenous dexamethasone (Alarasan 2017; Chun 2016; Leurcharusmee 2016; Sakae 2017), and six (n = 564) compared perineural dexamethasone, intravenous dexamethasone and placebo (Abdallah 2015; Dawson 2016; Desmet 2013; Kawanishi 2014; Rahangdale 2014; Rosenfeld 2016).
Techniques used for block placement included nerve stimulation (Biradar 2013; Cummings 2011; Desmet 2013; Ganvit 2014; Jadon 2015; Kumar 2014; Movafegh 2006; Nallam 2014; Saritas 2014; Shah 2015; Shaikh 2013; Tandoc 2011; Viera 2010; Vishnu 2014; Yadov 2008), ultrasound guidance (Abdallah 2015; Alarasan 2017; Aliste 2017; Dawson 2016; Kawanishi 2014; Kim 2012; Leurcharusmee 2016; Parrington 2010; Rahangdale 2014; Rosenfeld 2016; Viera 2010; Woo 2015), both nerve stimulation and ultrasound guidance (Chalifoux 2017; Chun 2016; Desmet 2015; Lee 2016; Sakae 2017), landmark method (Bias 2014; Dar 2013; Golwala 2009), and paraesthesia technique (Talukdar 2013).
Local anaesthetics included ropivacaine 0.5% (Bias 2014; Chalifoux 2017; Chun 2016; Dar 2013; Dawson 2016; Desmet 2013; Desmet 2015; Jadon 2015; Kawanishi 2014; Kumar 2014; Lee 2016; Rosenfeld 2016; Sakae 2017; Woo 2015), bupivacaine 0.5% (Abdallah 2015; Alarasan 2017; Cummings 2011; Rahangdale 2014; Shaikh 2013; Talukdar 2013; Tandoc 2011; Viera 2010; Vishnu 2014), lidocaine 1.5% (Biradar 2013; Movafegh 2006; Shah 2015; Yadov 2008), levobupivacaine 0.5 % (Kim 2012; Nallam 2014), bupivacaine 0.5% and lidocaine 1.5% mixture (Aliste 2017; Ganvit 2014; Golwala 2009; Leurcharusmee 2016), mepivacaine (Parrington 2010), and prilocaine 2% (Saritas 2014).
Additives to local anaesthetic agent included epinephrine (Alarasan 2017; Biradar 2013; Ganvit 2014; Golwala 2009; Leurcharusmee 2016; Rahangdale 2014; Shaikh 2013; Tandoc 2011; Viera 2010; Yadov 2008), and clonidine (Viera 2010). No additives were used in the remaining studies.
Dexamethasone dose included 4 mg (Kawanishi 2014; Sakae 2017; Yadov 2008), 5 mg (Alarasan 2017; Chun 2016; Kim 2012), 7.5 mg (Woo 2015), 8 mg (Abdallah 2015; Aliste 2017; Bias 2014; Biradar 2013; Cummings 2011; Dar 2013; Dawson 2016; Ganvit 2014; Golwala 2009; Jadon 2015; Kumar 2014; Leurcharusmee 2016; Movafegh 2006; Nallam 2014; Parrington 2010; Rahangdale 2014; Rosenfeld 2016; Saritas 2014; Shah 2015; Shaikh 2013; Talukdar 2013; Tandoc 2011; Viera 2010; Vishnu 2014), and 10 mg (Chalifoux 2017; Desmet 2013; Desmet 2015; Lee 2016).
Comparators
In all included studies, participants received a peripheral nerve block with local anaesthesia. In studies comparing perineural dexamethasone and placebo, participants received either perineural dexamethasone or an equal volume of perineural saline. In studies comparing intravenous dexamethasone and placebo, participants received either intravenous dexamethasone or an equal volume of intravenous saline. In studies comparing perineural and intravenous dexamethasone, participants in the perineural dexamethasone group received dexamethasone perineurally and intravenous saline. Those in the intravenous dexamethasone group received dexamethasone intravenously and perineural saline.
Funding sources
Funding sources included: Merit Award form the Department of Anesthesia, Univerity of Toronto (Abdallah 2015), departmental sources (Alarasan 2017; Chalifoux 2017; Cummings 2011), Belgian Association for Regional Anesthesia (Desmet 2015), Department of Anesthesiology, Northwestern University (Rahangdale 2014), Buffalo Anesthesiology Associates (Tandoc 2011), and Department of Anesthesiology, Baystate Medical Center, Springfield, Massachutes (Viera 2010) (see Characteristics of included studies).
Contact with authors
We attempted to contact 15 authors for additional information (Abdallah 2015; Cummings 2011; Dar 2013; Desmet 2013; Desmet 2015; Jadon 2015; Kawanishi 2014; Kumar 2014; Parrington 2010; Rahangdale 2014; Rosenfeld 2016; Sakae 2017; Shah 2015; Viera 2010; Woo 2015), and were successful in obtaining data from seven (Abdallah 2015; Cummings 2011; Rahangdale 2014; Rosenfeld 2016; Sakae 2017; Shah 2015; Viera 2010).
Excluded studies
We excluded four studies from our review. Two lacked a placebo group (Fredrickson 2013; Shethra 2007), one reported data as median and range (minimum to maximum), therefore we could not enter the results in a meta‐analysis (Percec 2014), and in another, participants received both perineural and intravenous dexamethasone (Lui 2015) (see Characteristics of excluded studies).
Ongoing studies
We found nine ongoing trials at ClinicalTrials.gov (NCT01277159; NCT01495624; NCT01586806; NCT01971645; NCT02178449; NCT02322242; NCT02436694; NCT02462148; NCT02506660) (see Characteristics of ongoing studies).
Studies awaiting classification
There are no studies awaiting classification.
Risk of bias in included studies
The overall risk of bias was low in 13 studies (Abdallah 2015; Aliste 2017; Chalifoux 2017; Cummings 2011; Dawson 2016; Desmet 2013; Desmet 2015; Kumar 2014; Leurcharusmee 2016; Parrington 2010; Rahangdale 2014; Rosenfeld 2016; Woo 2015) and high/unclear in the remaining 22. Figure 2 shows authors' judgements about each risk of bias item presented as percentages across all included studies and Figure 3 shows review authors' judgements about each risk of bias item for each included study.
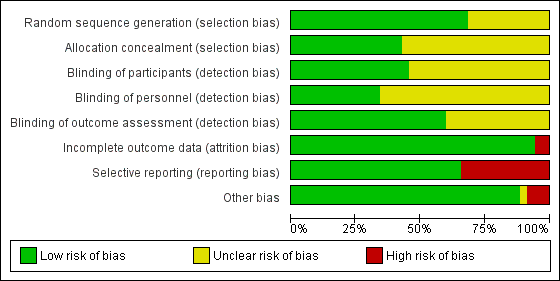
Risk of bias graph: review authors' judgements about each risk of bias item presented as percentages across all included studies.

Risk of bias summary: review authors' judgements about each risk of bias item for each included study.
Allocation
In 24 studies the method of random sequence generation was adequately described, and we judged the risk of bias to be low (Abdallah 2015; Aliste 2017; Biradar 2013; Chalifoux 2017; Chun 2016; Cummings 2011; Dawson 2016; Desmet 2013; Desmet 2015; Jadon 2015; Lee 2016; Leurcharusmee 2016; Movafegh 2006; Nallam 2014; Parrington 2010; Rahangdale 2014; Rosenfeld 2016; Saritas 2014; Shah 2015; Talukdar 2013; Tandoc 2011; Viera 2010; Vishnu 2014; Woo 2015). In the 11 remaining, we judged the risk of bias to be unclear because the random sequence was not described.
In 15 studies the method of allocation concealment was adequately described, and we judged the risk of bias to be low (Abdallah 2015; Aliste 2017; Chalifoux 2017; Cummings 2011; Dar 2013; Dawson 2016; Desmet 2013; Desmet 2015; Jadon 2015; Kawanishi 2014; Kumar 2014; Leurcharusmee 2016; Parrington 2010; Rahangdale 2014; Rosenfeld 2016). In the remaining 20 we judged the risk of bias to be unclear because the method of allocation concealment was not described.
Blinding
Blinding of participants was adequately described in 16 studies (Abdallah 2015; Aliste 2017; Biradar 2013; Chalifoux 2017; Chun 2016; Cummings 2011; Kumar 2014; Leurcharusmee 2016; Movafegh 2006; Parrington 2010; Rahangdale 2014; Rosenfeld 2016; Sakae 2017; Saritas 2014; Shaikh 2013; Vishnu 2014).
Blinding of personnel was adequately described in 12 studies (Abdallah 2015; Aliste 2017; Chalifoux 2017; Cummings 2011; Dawson 2016; Desmet 2015; Kumar 2014; Leurcharusmee 2016; Rahangdale 2014; Rosenfeld 2016; Sakae 2017; Woo 2015).
Bliding of outcome assessors was adequately described in 21 studies(Abdallah 2015; Aliste 2017; Biradar 2013; Chalifoux 2017; Chun 2016; Cummings 2011; Desmet 2013; Desmet 2015; Jadon 2015; Kim 2012; Kumar 2014; Leurcharusmee 2016; Movafegh 2006; Parrington 2010; Rahangdale 2014; Rosenfeld 2016; Sakae 2017; Saritas 2014; Shaikh 2013; Vishnu 2014; Woo 2015).
Incomplete outcome data
We judged the risk for attrition bias to be low in 33 studies. There were no missing outcome data in 16 (Abdallah 2015; Alarasan 2017; Bias 2014; Cummings 2011; Dar 2013; Dawson 2016; Kim 2012; Kumar 2014; Lee 2016; Sakae 2017; Saritas 2014; Talukdar 2013; Viera 2010; Vishnu 2014; Woo 2015; Yadov 2008), and in 17, the number of participants with missing outcome data was balanced between groups (Aliste 2017; Biradar 2013; Chalifoux 2017; Chun 2016; Desmet 2013; Desmet 2015; Ganvit 2014; Golwala 2009; Jadon 2015; Kawanishi 2014; Leurcharusmee 2016; Nallam 2014; Parrington 2010; Rahangdale 2014; Rosenfeld 2016; Shaikh 2013; Tandoc 2011). We judged two studies to be at high risk of attrition bias. In one, over 30% of participants in each group were excluded from the study (Movafegh 2006), and in the other, only 41 of 53 participants enrolled were included in the analysis (Shah 2015).
Selective reporting
We judged 23 studies to be at low risk of reporting bias. Protocols were available for eight and all prespecified outcomes were reported (Abdallah 2015; Aliste 2017; Cummings 2011; Leurcharusmee 2016; Parrington 2010; Rahangdale 2014; Rosenfeld 2016; Woo 2015). In the remaining 15, protocols were not available, but all outcomes prespecified in the methods section were reported (Alarasan 2017; Biradar 2013; Chalifoux 2017; Dar 2013; Dawson 2016; Desmet 2013; Desmet 2015; Ganvit 2014; Kumar 2014; Lee 2016; Movafegh 2006; Nallam 2014; Shah 2015; Tandoc 2011; Viera 2010). Twelve studies were at high risk of selective outcome bias. In two, protocols were available but not all outcomes were reported as per protocol (Chun 2016; Sakae 2017), and in 10, not all outcomes were reported as described in the methods section (Bias 2014; Golwala 2009; Jadon 2015; Kawanishi 2014; Kim 2012; Saritas 2014; Shaikh 2013; Talukdar 2013; Vishnu 2014; Yadov 2008).
Other potential sources of bias
There were other potential sources of bias in two studies. Both were stopped early for benefit (Cummings 2011; Shah 2015), which may be a source of bias.
Effects of interventions
See: Summary of findings for the main comparison Perineural dexamethasone versus placebo; Summary of findings 2 Intravenous dexamethasone versus placebo; Summary of findings 3 Perineural versus intravenous dexamethasone
See: summary of findings Table for the main comparison, summary of findings Table 2, summary of findings Table 3
Perineural dexamethasone verus placebo
Primary outcomes
1. Duration of sensory block
Duration of sensory block was defined inconsistently across studies. Definitions included the following.
The interval between administration of block and:
-
first report of pain (Abdallah 2015; Ganvit 2014; Movafegh 2006; Rahangdale 2014; Yadov 2008);
-
participant detected complete resolution of block (Dar 2013; Lee 2016; Sakae 2017; Saritas 2014; Viera 2010);
-
Visual Analogue Scale (VAS) greater than three (Alarasan 2017);
-
VAS greater than four (Vishnu 2014);
-
VAS three to six (Kumar 2014);
-
VAS eight to ten (Talukdar 2013);
-
first analgesia request or administration (Desmet 2013; Kawanishi 2014).
The interval between onset of sensory block and:
-
first administration of analgesia after discharge from the recovery room (Cummings 2011);
-
first report of pain (Bias 2014; Shah 2015; Shaikh 2013).
Duration of sensory block also included the interval between completion of surgery and numerical rating scale (NRS) greater than three (Nallam 2014), and the interval between hospital discharge until VAS greater than three (Tandoc 2011).
The duration of sensory block was significantly longer in the perineural dexamethasone group compared with placebo (MD 6.70 hours, 95% CI 5.54 to 7.85) (Abdallah 2015; Alarasan 2017; Bias 2014; Biradar 2013; Cummings 2011; Dar 2013; Desmet 2013; Ganvit 2014; Jadon 2015; Kawanishi 2014; Kumar 2014; Lee 2016; Movafegh 2006; Nallam 2014; Parrington 2010; Rahangdale 2014; Rosenfeld 2016; Sakae 2017; Saritas 2014; Shah 2015; Shaikh 2013; Talukdar 2013; Tandoc 2011; Viera 2010; Vishnu 2014; Woo 2015; Yadov 2008); (Figure 4), (Analysis 1.1).
![Forest plot of comparison: 1 Duration of sensory block: perineural dexamethasone versus placebo, outcome: 1.1 Duration of sensory block [hours].](/cdsr/doi/10.1002/14651858.CD011770.pub2/media/CDSR/CD011770/image_n/nCD011770-AFig-FIG04.png)
Forest plot of comparison: 1 Duration of sensory block: perineural dexamethasone versus placebo, outcome: 1.1 Duration of sensory block [hours].
Subgroup analysis
The duration of sensory block was significantly longer in the long‐ versus short‐acting local anaesthetic subgroup (P = 0.00) (Analysis 1.2), and in the high‐ versus low‐dose dexamethasone subgroup (P = 0.06) (Analysis 1.4). There was no significant difference between the remaining subgroups: additives versus no additives (P = 0.72) (Analysis 1.3); or high/unclear versus low risk of bias (P = 0.33) (Analysis 1.5).
Quality of evidence
We assessed the quality of evidence as low. We downgraded by one level for risk of bias because the majority of studies are at unclear risk of bias and by one level for inconsistency because of considerable heterogeneity (I2 = 99%, P < 0.00001); point estimates vary widely across studies and confidence intervals show minimal overlap. Our subgroup analyses did not explain the observed heterogeneity.
2. Incidence of serious adverse events
We used the National Institutes of Health (NIH) definition of adverse events. A serious event includes death, a life‐threatening event that requires hospitalization or prolonged hospitalization, or disability (NIH 2013). Seven studies reported that they assessed for serious adverse events (Desmet 2015; Jadon 2015; Kim 2012; Kumar 2014; Rosenfeld 2016; Shaikh 2013; Tandoc 2011). Five serious adverse events were reported among three trials (Desmet 2015; Rosenfeld 2016; Tandoc 2011). One block‐related event (pneumothorax) was reported in a study comparing perineural dexamethasone and placebo; however, the group allocation was not reported (Tandoc 2011). The four remaining events were non‐block‐related. In a study comparing intravenous dexamethasone and placebo, one participant in the placebo group developed Chronic Regional Pain syndrome Type I (Desmet 2015). In a study comparing perineural dexamethasone, intravenous dexamethasone and placebo, one participant in the placebo group developed pneumonia and two participants in the placebo group required hospitalization within one week of surgery; one for a bowel infection and one for a fall (Rosenfeld 2016).
Quality of evidence
We assessed the quality of evidence as very low. We downgraded by one level for risk of bias because over half the studies reporting serious adverse events are at unclear risk of bias, and by two levels for imprecision because of an extremely small number of events.
Secondary outcomes
1. Duration of motor block
Duration of motor block was defined inconsistently across studies. Definitions included the following.
The interval between completion of block and:
-
modified Brommage score of 0 (Vishnu 2014);
-
return to baseline motor strength in the operative limb (Abdallah 2015; Alarasan 2017; Viera 2010);
-
complete recovery of motor functions in all distributions (Biradar 2013; Dar 2013; Ganvit 2014; Movafegh 2006; Saritas 2014);
-
participant was able to lift operated limb (Kumar 2014; Nallam 2014; Tandoc 2011);
-
participant was able to move great toe (Rahangdale 2014).
The interval between onset of motor block and:
-
time finger movement was regained (Bias 2014);
-
complete recovery of motor functions in all distributions (Shah 2015; Shaikh 2013).
Duration of motor block also included the interval between successful block and recovery of all movements in the arm (Sakae 2017).
The duration of motor block was significantly longer in the perineural dexamethasone compared with control (MD 5.87 hours, 95% CI 4.44 to 7.30; participants = 912; studies = 16; I2 = 99) (Abdallah 2015; Bias 2014; Biradar 2013; Dar 2013; Ganvit 2014; Kumar 2014; Movafegh 2006; Nallam 2014; Rahangdale 2014; Sakae 2017; Saritas 2014; Shah 2015; Talukdar 2013; Tandoc 2011; Viera 2010; Vishnu 2014); (Analysis 2.1).
Subgroup analysis
The duration of motor block was significantly longer in the long‐acting local anaesthetic versus medium‐acting local anaesthesia subgroup (P = 0.00) (Analysis 2.2); however, there was no statistically significant difference between the remaining subgroups: additive versus no additive (P = 0.33) (Analysis 2.3), high‐ versus low‐dose dexamethasone and P = 0.22) (Analysis 2.4), and high/unclear versus low risk of bias (P = 0.41) (Analysis 2.5).
2. Incidence of mild to moderate adverse events such as nausea/vomiting, pruritus, somnolence, oxygen desaturation, urinary retention, numbness/tingling
Bock‐related adverse events
Ten studies reported that they assessed for block‐related adverse events (Abdallah 2015; Cummings 2011; Desmet 2013; Jadon 2015; Kawanishi 2014; Parrington 2010; Rahangdale 2014; Rosenfeld 2016; Shah 2015; Woo 2015). In one study, the authors reported that numbness/tingling had resolved in all participants at eight weeks after surgery (Rahangdale 2014). None of the other studies described whether block‐related complications had resolved. There was no significant difference between perineural dexamethasone and control in the incidence of overall adverse or each individual adverse event. Overall block‐related adverse events occurred in 97 out of 340 participants in the perineural dexamethasone group versus 81 out of 337 in the control group (risk ratio (RR) 1.17, 95% CI 0.99 to 1.39; participants = 677; studies = 10; I2 = 0%) (Analysis 3.1). The incidence of each event is as follows.
-
Numbness/tingling 14 days after surgery: 12 out of 160 in the perineural dexamethasone group versus seven out of 163 in the placebo group (RR 1.76, 95% CI 0.80 to 3.89; participants = 323; studies = 5; I2 = 0%); (Abdallah 2015; Cummings 2011; Parrington 2010; Rahangdale 2014; Woo 2015); (Analysis 3.2).
-
Residual motor block/muscle weakness 24 hours after surgery: five out of 130 in the perineural dexamethasone group versus one out of 129 in the placebo group (RR 4.69, 95% CI 0.57 to 38.68; participants = 259; studies = 3; I2 = 0%) (Cummings 2011; Desmet 2013; Rahangdale 2014); (Analysis 3.3).
-
Horner syndrome: 47 out of 162 in the perineural dexamethasone group versus 47 out of 159 in the placebo group (RR 0.99, 95% CI 0.73 to 1.36; participants = 321; studies = 4; I2 = 0%) (Desmet 2013; Jadon 2015; Shaikh 2013; Woo 2015); (Analysis 3.4).
-
Hoarseness: 16 out of 177 in the perineural dexamethasone versus 13 out of 176 in the placebo group (RR 1.23, 95% CI 0.65 to 2.34; participants = 353; studies = 4; I2 = 0%) (Desmet 2013; Jadon 2015; Shaikh 2013; Woo 2015); (Analysis 3.5).
-
Diaphragmatic paresis: 14 out of 86 in the perineural versus 9 out of 86 in the placebo group (RR 1.46, 95% CI 0.66 to 3.23; participants = 172; studies = 2; I2 = 1%) (Jadon 2015; Woo 2015); (Analysis 3.6).
-
Dyspnoea: zero out of 138 in the perineural dexamethasone group versus one out of 136 in the placebo group (RR 0.34, 95% CI 0.01 to 8.14; participants = 274; studies = 4; I2 = 100%) (Desmet 2013; Kawanishi 2014; Rosenfeld 2016; Woo 2015); (Analysis 3.7).
-
Vascular injury: two out of 50 in the perineural dexamethasone group versus one out of 50 in the placebo group (RR 2.00, 95% CI 0.19 to 21.36; participants = 100; studies = 1) (Jadon 2015); (Analysis 3.8).
-
Cranial nerve 12 palsy: zero out of 42 in the perineural dexamethasone group versus 1 out of 41 in the placebo group (RR 0.33, 95% CI 0.01 to 7.77; participants = 83; studies = 1) (Rosenfeld 2016); (Analysis 3.9)
-
Bruising at the injection site: one out of 18 in the perineural dexamethasone group versus one out of 19 in the placebo group (RR 1.06, 95% CI 0.07 to 15.64; participants = 37; studies = 1) (Parrington 2010); (Analysis 3.10).
Non‐block‐related adverse events
In 10 studies, non‐block‐related adverse events were assessed (Abdallah 2015; Dar 2013; Dawson 2016; Golwala 2009; Kawanishi 2014; Parrington 2010; Rosenfeld 2016; Talukdar 2013; Vishnu 2014; Woo 2015). There was no significant difference between perineural dexamethasone and placebo in the incidence overall or individual non‐block‐related events (Analysis 3.1). The overall incidence was 33 out of 313 in the perineural dexamethasone group versus 38 out of 312 in the placebo group (RR 0.76, 95% CI 0.35 to 1.68; participants = 625; studies = 10; I2 = 49%). The incidence of individual events is as follows:
-
Postoperative nausea and vomiting: 13 out of 293 in the perineural dexamethasone versus 26 out of 292 in the placebo group ((RR 0.55, 95% CI 0.26 to 1.14; participants = 585; studies = 10; I2 = 10%) (Abdallah 2015; Dar 2013; Dawson 2016; Golwala 2009; Kawanishi 2014; Kim 2012; Parrington 2010; Rosenfeld 2016; Vishnu 2014); (Analysis 3.12).
-
Deep sedation: three out of 30 in the perineural dexamethasone group versus zero out of 30 in the placebo group (RR 7.00, 95% CI 0.38 to 129.93; participants = 60; studies = 1) (Talukdar 2013); (Analysis 3.13).
-
Dermatological symptoms (pruritus/rash): three out of 42 in the perineural dexamethasone group versus one out of 41 in the placebo group (RR 2.93, 95% CI 0.32 to 27.02; participants = 83; studies = 1) (Rosenfeld 2016); (Analysis 3.14).
-
Syncope/fainting: two out of 42 in the perineural dexamethasone group versus one out of 41 in the placebo group (RR 1.95, 95% CI 0.18 to 20.71; participants = 83; studies = 1) (Rosenfeld 2016); (Analysis 3.15).
-
Bradycardia: two out of 30 in the perineural dexamethasone group versus three out of 30 in the placebo group; (RR 0.67, 95% CI 0.12 to 3.71; participants = 60; studies = 1; I2 = 0%); (Talukdar 2013); (Analysis 3.16).
-
Hypotension: four out of 70 in the perineural dexamethasone group versus six out of 70 in the control group; (RR 0.67, 95% CI 0.21 to 2.13; participants = 140; studies = 2; I2 = 0%); (Dar 2013; Talukdar 2013); Analysis 3.17
-
Each of the following outcomes occurred in one out of 42 in the perineural dexamethasone group versus zero out of 41 in the placebo group (RR 2.93, 95% CI 0.12 to 69.92; participants = 83; studies = 1): headache, 10‐pound fluid gain over 24 hours, diarrhoea, frequent urination, and muscle soreness (Rosenfeld 2016); (Analysis 3.18).
3a Postoperative pain intensity at 12 hours
Postoperative pain scores at 12 hours were significantly lower in the dexamethasone group compared with placebo (MD ‐2.08, 95% CI ‐2.63 to ‐1.52; participants = 257; studies = 5; I2 = 62%) (Kim 2012; Rosenfeld 2016; Sakae 2017; Shah 2015; Woo 2015); (Figure 5), (Analysis 4.1).

Forest plot of comparison: 4 Postoperative pain intensity at 12 hours: perineural dexamethasone versus placebo, outcome: 4.1 Postoperative pain intensity at12 hours.
Subgroup analysis
There was no significant difference in effect size between any of the subgroups: long‐ versus medium‐acting local anaesthetic (P = 0.13) (Analysis 4.2); additive versus no additive (P = 0.12) (Analysis 4.3); high‐ versus low‐dose dexamethasone (P = 0.79) (Analysis 4.4); or high/unclear versus low risk of bias (P = 0.28) (Analysis 4.5).
Quality of evidence
We assessed the quality of evidence as very low. We downgraded by one level for risk of bias because three out of five of the studies are at unclear risk of bias; we downgraded by one level for inconsistency because of substantial heterogeneity (I2 = 62%, P = 0.03). Our subgroup analyses did not explain observed heterogeneity. We also downgraded by one level for imprecision. For continuous outcomes, Cochrane guidelines suggest downgrading if fewer than 400 participants.
3b Postoperative pain intensity at 24 hours
Postoperative pain scores at 24 hours were significantly lower in the dexamethasone group compared with placebo (MD ‐1.63, 95% CI ‐2.34 to ‐0.93; participants = 469; studies = 9; I2 = 79%) (Abdallah 2015; Dawson 2016; Kim 2012; Parrington 2010; Rahangdale 2014; Rosenfeld 2016; Sakae 2017; Viera 2010; Woo 2015); (Figure 6), (Analysis 5.1).

Forest plot of comparison: 5 Postoperative pain intensity at 24 hours: perineural dexamethasone versus placebo, outcome: 5.1 Postoperative pain intensity at 24 hours.
Subgroup analysis
Three was no significant difference in effect size between any of the subgroups: long‐ versus medium‐acting local anaesthetic (P = 0.31) (Analysis 5.2); additive versus no additive (P = 0.37) (Analysis 5.3); high‐ versus low‐dose dexamethasone (P = 0.76) (Analysis 5.4); and high/unclear versus low risk of bias (P = 0.60) (Analysis 5.5).
Quality of evidence
We assessed the quality of evidence to be low. We downgraded by one level for inconsistency because of considerable heterogeneity (I2 = 80% and P < 0.00001) not explained by subgroup analyses and by one level for imprecision because the confidence interval includes both no clinical effect (minimally important difference (MID) less than 1.2) and clinical effect (MID greater than 1.2).
3c Postoperative pain intensity at 48 hours
There was no significant difference in postoperative pain scores at 48 hours between perineural dexamethasone and placebo (MD ‐0.61, 95% CI ‐1.24 to 0.03; participants = 296; studies = 4; I2 = 41%) (Rahangdale 2014; Rosenfeld 2016; Viera 2010; Woo 2015); (Analysis 6.1).
Subgroup analysis
There was no statistically significant difference in effect size between the additive and no additive subgroups (P = 0.45) (Analysis 6.2); and the high/unclear risk of bias subgroups (P = 0.47) (Analysis 6.3). In all four studies, long‐acting local anaesthetic and high‐dose dexamethasone were used.
Quality of evidence
We assessed the quality of evidence to be low. We downgraded by two levels for imprecision because the confidence interval includes both no clinical effect (MID less than 1.2 on VAS) and clinical effect (MID greater than 1.2 on VAS).
4a Postoperative opioid consumption at 12 hours
No studies evaluated postoperative opioid consumption at 12 hours.
4b Postoperative opioid consumption at 24 hour
Cummulative opioid administration at 24 hours was reported in six studies. Reasons for opioid administration varied across studies and included VAS greater than four (Abdallah 2015), and "as needed" (Dawson 2016; Rahangdale 2014; Rosenfeld 2016). No criteria for opioid administration was provided in the remaining two studies (Parrington 2010; Viera 2010). Postoperative opioid consumption (oral morphine equivalents) at 24 hours in the perineural dexamethasone group was significantly lower compared with placebo (MD 19.25 mg, 95% CI 5.99 to 32.51; participants = 380; studies = 6; I2 = 88%) (Analysis 7.1).
Subgroup analysis
There was no significant difference in effect size between the long‐ versus medium‐acting local anaesthetic subgroups (P = 0.22) or the additive versus no additive subgroups (P = 0.28). Opioid consumption was significantly higher in the high/unclear risk of bias subgroup (P = 0.00001) (Analysis 7.2; Analysis 7.3; Analysis 7.4). In all six studies, high‐dose dexamethasone was used.
4c Postoperative opioid consumption at 48 hours
No studies reported cumulative opioid consumption at 48 hours.
5 Participant satisfaction with pain control
There was no statistically significant difference in satisfaction scores on an 11‐point VAS between perineural dexamethasone and placebo (MD 0.83, 95% CI ‐0.05 to 1.71; participants = 224; studies = 4; I2 = 0%) (Analysis 8.1)
Intravenous dexamethasone versus placebo
Primary outcomes
1. Duration of sensory block
Duration of sensory block was defined inconsistently across six studies. Definitions included the following.
The interval between administration of block and:
-
first report of pain (Abdallah 2015; Rahangdale 2014);
-
participant detected complete resolution of block (Rosenfeld 2016);
-
first analgesia request or administration (Desmet 2013; Desmet 2015; Kawanishi 2014).
Duration of sensory block also included the interval between onset of sensory block and first analgesic request (Chalifoux 2017), and the time interval between successful block and complete recovery of all senses in the operative limb (Sakae 2017).
Duration of sensory block was significantly longer in the intravenous group compared with placebo (MD 6.21, 95% CI 3.53 to 8.88; participants = 499; studies = 8; I2 = 88%); (Figure 7), (Analysis 9.1).

Forest plot of comparison: 9 Duration of sensory block: intravenous dexamethasone versus placebo , outcome: 9.1 Duration of sensory block.
Subgroup analysis
The duration of sensory block was significantly longer in the high‐dose versus low‐dose dexamethasone subgroup (P = 0.00) Analysis 9.3), and the low risk of bias versus high risk of bias subgroup (P = 0.00); Analysis 9.4). There was no statistically significant difference in the duration of sensory block between the additive and no additive subgroups (P = 1.0) (Analysis 9.2). In all studies, long‐acting local anaesthetic was used.
Quality of evidence
We assessed the quality of evidence as moderate. We downgraded by one level for inconsistency because of considerable heterogeneity (I2 = 88%, P < 0.00001). Our subgroup analyses did not explain the observed heterogeneity.
2. Incidence of severe adverse events
See incidence of severe events in the perineural dexamethasone versus placebo section.
Secondary outcomes
1. Duration of motor block
Duration of motor block was defined as the interval between completion of block until return to baseline motor strength in the operative limb (Abdallah 2015), the time interval between successful block and complete recovery of all movements of the arm (Sakae 2017), or when the participant was able to move the great toe (Rosenfeld 2016). Duration of motor block was significantly longer in the intravenous dexamethasone group compared with placebo (MD 5.04 hours, 95% CI 3.07 to 7.00; participants = 139; studies = 3; I2 = 27%) (Analysis 10.1).
Subgroup analysis
There was no significant difference in the duration of motor block between the additive and no additive subgroup (P = 0.46) (Analysis 10.2); in the high‐ versus low‐dose subgroups (P = 0.11) (Analysis 10.3); or in the high versus low risk of bias subgroups (P = 0.11) (Analysis 10.4). In all three studies, long‐acting local anaesthetic was used.
2. Incidence of mild to moderate adverse events such as nausea/vomiting, pruritus, somnolence, oxygen desaturation, urinary retention, numbness/tingling
Block‐related adverse events
Five studies reported that they assessed for block‐related adverse events. There was no significant difference between intravenous dexamethasone and control in the overall incidence of events or each individual event. The incidence of overall block‐related events was 75 out of 195 in the intravenous dexamethasone group versus 70 out of 198 in the control group (RR 1.09, 95% CI 0.69 to 1.70; I2 = 59%).
The incidence of each adverse event is as follows.
-
Numbness/tingling 14 days after surgery: three out of 49 in the intravenous group versus two out of 52 in the placebo group (RR 1.69, 95% CI 0.31 to 9.26; participants = 101; studies = 2; I2 = 0%) (Abdallah 2015; Rahangdale 2014); (Analysis 11.2).
-
Residual motor block/muscle weakness 24 hours after surgery: nine out of 133 in the intravenous dexamethasone group versus three out of 132 in the placebo group (RR 2.68, 95% CI 0.80 to 8.90; studies = 3; I2 = 0%) (Desmet 2013; Desmet 2015; Rahangdale 2014); (Analysis 11.3).
-
Horner syndrome: 38 out of 109 in the intravenous dexamethasone group versus 41 out of 105 in the placebo group (RR 0.89, 95% CI 0.63 to 1.26; participants = 214; studies = 2) (Desmet 2013; Desmet 2015); (Analysis 11.4).
-
Hoarseness: 16 out of 109 in the intravenous versus 17 out of 106 in the placebo group (RR 0.88, 95% CI 0.45 to 1.71; participants = 215; studies = 2; I2 = 8%) (Desmet 2013; Desmet 2015); (Analysis 11.5).
-
Dyspnoea: one out of 107 in the intravenous dexamethasone group versus three out of 112 in the placebo group (RR 0.63, 95% CI 0.11 to 3.74; participants = 219; studies = 3; I2 = 0%) (Desmet 2015; Kawanishi 2014; Rosenfeld 2016); (Analysis 11.6).
-
Cranial nerve 12 palsy: zero out of 37 in the intravenous group versus one out of 41 in the placebo group (RR 0.37, 95% CI 0.02 to 8.77; participants = 78; studies = 1; I2 = 0%) (Rosenfeld 2016); (Analysis 11.7).
Non block‐related adverse events
Five studies reported that they assessed for non‐block‐related adverse events (Abdallah 2015; Chalifoux 2017; Dawson 2016; Kawanishi 2014; Rosenfeld 2016); (Analysis 11.8). There was no significant difference between intravenous dexamethasone and placebo (8 out of 128 in the intravenous group versus 5 out of 122 in the placebo group (RR 1.23, 95% CI 0.38 to 3.97; participants = 258; studies = 5; I2 = 0%).
-
Postoperative nausea and vomiting: two out of 67 in the intravenous group versus three out of 67 in the placebo group (RR 0.66, 95% CI 0.12 to 3.78; participants = 134; studies = 3; I2 = 0%) (Abdallah 2015; Dawson 2016; Kawanishi 2014); (Analysis 11.9).
-
Dermatological symptoms (pruritus/rash): four out of 61 in the intravenous dexamethasone group versus one out of 63 in the placebo group (RR 1.88, 95% CI 0.09 to 40.62; participants = 124; studies = 2; I2 = 52%) (Chalifoux 2017; Rosenfeld 2016); (Analysis 11.10).
-
Each of the following adverse events occurred in one out of 37 in the intravenous dexamethasone group versus zero out of 41 in the placebo group: dizziness, wrist, hand or finger pain, constipation (RR 0.37, 95% CI 0.02 to 8.77; participants = 78; studies = 1) (Rosenfeld 2016); (Analysis 11.11).
3a. Postoperative pain intensity at 12 hours
Pain scores were significantly lower in the intravenous dexamethasone group compared with placebo (MD ‐1.24, 95% CI ‐2.44 to ‐0.04; participants = 162; studies = 3; I2 = 61%) (Chalifoux 2017; Rosenfeld 2016; Sakae 2017); (Figure 8), (Analysis 12.1).

Forest plot of comparison: 12 Postoperative pain intensity at 12 hours: intravenous dexamethasone versus placebo, outcome: 12.1 Postoperative pain intensity at 12 hours.
Subgroup analysis
There was no difference in effect size between the low‐ and high‐dose dexamethasone subgroups (P = 0.12) (Analysis 21.2); or between the high/unclear versus low risk of bias subgroups (P = 0.12) (Analysis 22.3). In all three studies, long‐acting local anaesthetic was used, and none used additives.
Quality of evidence
We assessed the quality of evidence to be low. We downgraded by one level due to moderate heterogeneity (I2= 61%, P = 0.08) not explained by subgroup analyses, and by one level for imprecision because the CI includes both no clinical effect (MID less than 1.2 on VAS) and clinical effect (MID greater than 1.2 on VAS).
3b. Postoperative pain intensity at 24 hours
Pain scores were significantly lower in the intravenous dexamethasone group compared with placebo (MD ‐1.26, 95% CI ‐2.23 to ‐0.29; participants = 257; studies = 5; I2 = 65%) (Abdallah 2015; Chalifoux 2017; Rahangdale 2014; Rosenfeld 2016; Sakae 2017); (Figure 9), (Analysis 13.1).

Forest plot of comparison: 13 Postoperative pain intensity at 24 hours: intravenous dexamethasone versus placebo, outcome: 13.1 Postoperative pain intensity at 24 hours.
Subgroup analysis
There was no significant difference in effect size between the additive or no additive subgroups (P = 0.70) (Analysis 13.2); the high‐ versus low‐dose dexamethasone subgroups (P = 0.83) (Analysis 13.3); or the high/unclear versus low risk of bias subgroups (P = 0.83) (Analysis 13.4). In all studies, long‐acting local anaesthetic was used.
Quality of evidence
We assessed the quality of evidence to be low. We downgraded by one level for inconsistency because of considerable heterogeneity (I2 = 65 %, P = 0.02) not explained by subgroup analyses, and by one level for imprecision because the CI includes both no clinical effect (MID less than 1.2 on VAS) and clinical effect (MID greater than 1.2 on VAS).
3c. Postoperative pain intensity at 48 hours
There was no significant difference in postoperative pain intensity at 48 hours between intravenous dexamethasone and placebo (MD ‐0.18, 95% CI ‐0.80 to 0.44; participants = 172; studies = 3; I2 = 0%) (Chalifoux 2017; Rahangdale 2014; Rosenfeld 2016); (Analysis 14.1).
Subgroup analysis
There was no significant difference in effect size between the additive and no additive subgroups (P = 0.97) (Analysis 14.2). In all studies, long‐acting local anaesthetic and high‐dose dexamethasone were used, and all were at low risk of bias.
Quality of evidence
We assessed the quality of evidence to be low. We downgraded by two levels for imprecision because of small sample size and the CI crosses the line of null effect.
4a Postoperative opioid consumption at 12 hours
One study in 46 participants reported the cumulative opioid consumption at 12 hours. Median and interquartile range of opioid consumption was zero in both the intravenous dexamethasone and control groups (Chalifoux 2017).
4b Postoperative opioid consumption at 24 hours
Cummulative opioid consumption at 24 hours was reported in five studies. Postoperative opioids were administered for VAS greater than four (Abdallah 2015; Chalifoux 2017), or as needed (Dawson 2016; Rahangdale 2014; Rosenfeld 2016). Twenty‐four hour opioid consumption was significantly lower in the intravenous dexamethasone group compared with control (MD ‐6.58 mg, 95% CI ‐10.56 to ‐2.60; participants = 287; studies = 5; I2 = 60%) (Analysis 15.1).
Subgroup analysis
There was no significant difference in effect size between the additive and no additive subgroups (P = 0.58) (Analysis 15.2). In all three studies, long‐acting local anaesthesia and high‐dose dexamethasone were used, and all were at low risk of bias.
4c Postoperative opioid consumption at 48 hours
In one study (46 participants), postoperative opioid consumption was significantly lower in the intravenous dexamethasone group versus placebo (MD 22.50 mg, 95% CI 5.15 to 39.85) (Chalifoux 2017); (Analysis 16.1).
5 Participant satisfaction with pain control
There was no statistically significant difference between intravenous dexamethasone and placebo in participant satisfaction with pain control (MD 1.07, 95% CI ‐0.08 to 2.22; participants = 181; studies = 3; I2 = 27%) (Analysis 17.1).
Perineural versus intravenous dexamethasone
1. Duration of sensory block
We identified nine trials that compared perineural versus intravenous dexamethasone. The duration of sensory block was defined inconsistently across studies. Definitions included the following.
The interval between administration of block and:
-
first report of pain (Abdallah 2015; Aliste 2017; Leurcharusmee 2016; Rahangdale 2014);
-
participant detected complete resolution of block (Rosenfeld 2016);
-
first analgesia request or administration (Desmet 2013; Kawanishi 2014).
-
Time of completion of surgery to first analgesic request (Chun 2016)
-
Time of successful block to recovery of sensation (Sakae 2017).
The duration of sensory block was significantly longer in the perineural dexamethasone group compared with intravenous dexamethasone (MD 3.13 hours, 95% CI 1.68 to 4.58; participants = 720; studies = 9; I2 = 63%) (Analysis 18.1).
Subgroup analysis
There was no significant difference in the duration of sensory block between the additive and no additive subgroups (P = 0.40) (Analysis 18.2); between the high‐ versus low‐dose dexamethasone subgroups (P = 0.22) (Analysis 18.3); or between the high/unclear risk of bias subgroups (P = 0.14). In all studies, long‐acting local anaesthesia was used.
Quality of evidence
We assessed the quality of evidence as moderate. We downgraded by one level for inconsistency because of considerable heterogeneity (I2 = 63%, P = 0.006) and point estimates vary widely. Subgroup analyses did not explain observed heterogeneity.
2. Incidence of serious adverse events
See incidence of serious adverse events in perineural versus control section.
Secondary outcomes
1. Duration of motor block
Duration of motor block was defined as the interval between administration of block until return to baseline motor strength in the operative limb (Abdallah 2015), or the participant was able to move the great toe (Rahangdale 2014). The duration of motor block was significantly longer in the perineural dexamethasone group compared with the intravenous dexamethasone group (MD 3.13 hours, 95% CI 0.99 to 5.27; participants = 421; studies = 5; I2 = 71%) (Analysis 19.1).
Subgroup analysis
There was no significant difference in motor block between the additive versus no additive subgroups (P = 0.53) (Analysis 19.2); between the high‐ versus low‐dose dexamethasone subgroups (P = 0.18) (Analysis 19.3); or between the high/unclear versus low risk of bias subgroups (P = 0.18) (Analysis 19.4). In all studies, long‐acting local anaesthesia was used.
2. Incidence of mild to moderate adverse events such as nausea/vomiting, pruritus, somnolence, oxygen desaturation, urinary retention, numbness/tingling
Block‐related adverse events
Five studies reported that they assessed for block‐related adverse events (Abdallah 2015; Aliste 2017; Dawson 2016; Kawanishi 2014; Rosenfeld 2016). There was no statistically significant difference between perineural and intravenous dexamethasone in the overall or individual incidence of block‐related adverse events (42 out of 207 in the perineural dexamethasone group versus 36 out of 199 in the intravenous dexamethasone group (RR 1.20, 95% CI 0.93 to 1.55; participants = 406; studies = 5; I2 = 0%) (Analysis 20.1). Individual events are as follows.
-
Numbness/tingling 14 days after surgery: four out of 116 in the perineural group versus four out of 116 in the intravenous group (RR 0.97, 95% CI 0.27 to 3.49; participants = 232; studies = 3; I2 = 0%) (Abdallah 2015; Aliste 2017; Rahangdale 2014); (Analysis 20.2).
-
Residual motor block/muscle weakness at 24 hours: 16 out of 126 in the perineural dexamethasone group versus 13 out of 122 in the intravenous dexamethasone group (RR 1.22, 95% CI 0.62 to 2.37; participants = 248; studies = 3; I2 = 0%) (Chun 2016; Desmet 2013; Rahangdale 2014); (Analysis 20.3).
-
Horner syndrome: 24 out of 99 in the perineural versus 20 out of 98 in the intravenous dexamethasone group (RR 1.20, 95% CI 0.77 to 1.87; participants = 197; studies = 2; I2 = 0%) (Chun 2016; Desmet 2013); (Analysis 20.4).
-
Hoarseness: 11 out of 99 in the perineural versus 11 out of 98 in the intravenous dexamethasone group (RR 1.00, 95% CI 0.48 to 2.09; participants = 197; studies = 2; I2 = 0%)(RR 1.00, 95% CI 0.48 to 2.09; participants = 98; studies = 1; I2 = 0%) (Chun 2016; Desmet 2013); (Analysis 20.5).
-
Cranial nerve 12 palsy: zero out of 42 in the perineural dexamethasone group versus one out of 41 in the intravenous dexamethasone group (RR 0.31, 95% CI 0.01 to 7.39; participants = 81; studies = 1; I2 = 0%) (Rosenfeld 2016); (Analysis 20.6).
Non‐block‐related adverse events
Five studies reported that they assessed for non‐block‐related adverse events (Abdallah 2015; Chun 2016; Dawson 2016; Kawanishi 2014; Rosenfeld 2016). There was no statistically significant difference between perineural and intravenous dexamethasone (26 out of 159 in the perineural dexamethasone group versus 21 out of 157 in the intravenous dexamethasone group ((RR 1.34, 95% CI 0.37 to 4.78; participants = 316; studies = 5; I2 = 63%) (Analysis 20.7). The incidence for each event is as follows.
-
Postoperative nausea and vomiting: five out of 159 in the perineural dexamethasone group versus eight out of 153 in the intravenous dexamethasone group (RR 0.63, 95% CI 0.22 to 1.80; participants = 312; studies = 5; I2 = 0%) (Abdallah 2015; Chun 2016; Dawson 2016; Kawanishi 2014; Rosenfeld 2016); (Analysis 20.8).
-
Dermatological symptoms (pruritus/rash): two out of 42 in the perineural dexamethasone group versus zero out of 37 in the intravenous dexamethasone group (RR 4.42, 95% CI 0.22 to 89.18; participants = 79; studies = 1) (Rosenfeld 2016); (Analysis 20.9).
-
Syncope/fainting: two out of 42 in the perineural dexamethasone group versus zero out of 37 in the intravenous dexamethasone group (RR 4.42, 95% CI 0.22 to 89.18; participants = 79; studies = 1; I2 = 0%) (Rosenfeld 2016); (Analysis 20.10).
-
Dizziness: one out of 92 in the perineural dexamethasone group versus three out of 86 in the intravenous dexamethasone group (RR 0.41, 95% CI 0.06 to 2.72; participants = 178; studies = 2; I2 = 0%) (Rosenfeld 2016); (Analysis 20.11).
-
Wrist, hand or finger pain: zero out of 42 in the perineural dexamethasone group versus one out of 37 in the intravenous dexamethasone group (RR 0.29, 95% CI 0.01 to 7.02; participants = 79; studies = 1) (Rosenfeld 2016); (Analysis 20.12).
-
Each of the following outcomes occurred in one out of 42 in the perineural dexamethasone group versus zero out of 37 in the intravenous dexamethasone group: 10‐lb weight gain in 24 hours, headache, diarrhoea, frequent urination and muscle soreness (RR 2.65, 95% CI 0.11 to 63.16; participants = 79; studies = 1) (Rosenfeld 2016); (Analysis 20.13).
3a. Postoperative pain intensity at 12 hours
Pain scores were significantly lower in the perineural dexamethasone group compared with intravenous dexamethasone. The MD did not surpass the MID of 1.2, therefore the difference in effect size is not clinically significant (MD ‐1.01, 95% CI ‐1.51 to ‐0.50; participants = 217; studies = 3; I2 = 0%) (Chun 2016; Rosenfeld 2016; Sakae 2017); (Analysis 21.1).
Subgroup analysis
There was no significant difference in effect size between the high‐and low‐dose dexamethasone subgroups (P = 0.83) (Analysis 21.2 or between the high/unclear and low risk of bias subgroups (P = 0.83) Analysis 21.3. In all three studies, long‐acting local anaesthetic was used and no additives were used.
Quality of evidence
We assessed the quality of evidence to be low. We downgraded by one level for risk of bias because two of the three studies are at unclear risk of bias, and by one level for imprecision because the CI includes both no clinical effect (MID less than 1.2 on VAS) and clinical effect (MID greater than 1.2 on VAS).
3b. Postoperative pain intensity at 24 hours
Pain scores were significantly lower in the perineural dexamethasone group compared with intravenous dexamethasone. The MD did not surpass the MID of 1.2 on the VAS, therefore the difference in effect size is not clinically significant (MD ‐0.79, 95% CI ‐1.51 to ‐0.07; participants = 309; studies = 5; I2 = 46%) (Abdallah 2015; Chun 2016; Rahangdale 2014; Rosenfeld 2016; Sakae 2017); (Analysis 22.1).
Subgroup analysis
There was no significant difference in effect size between the additive and no additive subgroups (P = 0.24) (Analysis 22.2), the low‐versus high‐dose dexamethasone subgroups (P = 0.75) (Analysis 22.3) or the high/unclear versus low risk of bias subgroups (P = 0.75) (Analysis 22.4). In all five studies, long‐acting local anaesthetic was used.
Quality of evidence
We assessed the quality of evidence to be moderate. We downgraded by one level for imprecision because the CI includes both no clinical effect (MID less than 1.2 on VAS) and clinical effect (MID greater than 1.2 on VAS).
3c. Postoperative pain intensity at 48 hours
There was no significant difference in pain scores at 48 hours between perineural and intravenous dexamethasone (MD 0.13, 95% CI ‐0.35 to 0.61; participants = 227; studies = 3; I2 = 0%) (Chun 2016; Rahangdale 2014; Rosenfeld 2016); (Analysis 23.1).
Subgroup analysis
There was no significant difference in effect size between the additive and the no additive subgroups (P = 0.28) (Analysis 23.2), the low‐versus high‐dose dexamethasone subgroups (P = 0.46) (Analysis 23.3) and the high/unclear versus low risk of bias subgroups (P = 0.46) (Analysis 23.4). In all three studies, long‐acting local anaesthetic was used.
Quality of evidence
We assessed the quality of evidence to be low. We downgraded by one level for risk of bias because the one study that is at unclear risk of bias contributes half the data for this outcome, and by one level for imprecision because of small sample size.
4a. Postoperative opioid consumption at 12 hours
No studies evaluated postoperative opioid consumption at 12 hours.
4b. Postoperative opioid consumption at 24 hours
Cummulative postoperative consumption at 24 hours was reported in four studies. Postoperative opioids were administered for VAS greater than four (Abdallah 2015), or as needed (Dawson 2016; Rahangdale 2014; Rosenfeld 2016). There was no significant difference in the 24‐hour opioid consumption between perineural and intravenous dexamethasone (MD ‐3.87 mg, 95% CI ‐9.93 to 2.19; participants = 242; studies = 4; I2 = 44%) (Analysis 24.1).
Subgroup analysis
There was no significant difference in effect size between the additive or no additive subgroups (P = 0.11) (Analysis 24.2). In all four studies, long‐acting local anaesthetic and high‐dose dexamethasone were used, and all four studies were at low risk of bias.
4c. Postoperative opioid consumption at 48 hours
No studies reported the cumulative opioid consumption at 48 hours.
5. Participant satisfaction with pain control
There was no significant difference in participant satisfaction between perineural and intravenous dexamethasone (MD 0.19, 95% CI ‐0.33 to 0.70; participants = 181; studies = 3; I2 = 0%) (Analysis 25.1). The SD was zero in both the perineural and intravenous dexamethasone groups in one of the two studies, therefore the 95% CI was not estimable and the analysis was based on one study in 50 participants.
Discussion
Summary of main results and quality of evidence
The objective of this review was to evaluate the comparative efficacy and safety of perineural dexamethasone and intravenous dexamethasone as adjuvants to peripheral nerve block for postoperative pain control in people undergoing upper or lower limb surgery. Our primary outcomes were duration of sensory block and incidence of severe adverse events. We conducted a comprehensive search for trials evaluating our study objectives. We assessed the quality of evidence for outcomes important for clinical decision‐making, including duration of sensory block, intensity of postoperative pain at 12, 24 and 48 hours, and incidence of severe adverse events. In total, we found 35 eligible trials involving 2707 participants. We describe our findings and provide a summary of the quality of evidence for each comparison below.
Perineural dexamethasone verus placebo
Among 27 trials (1625 participants) the duration of sensory block was longer in the perineural dexamethasone group by approximately six and a half hours. The quality of evidence is low. We downgraded by one level for risk of bias because the majority of studies are at unclear risk of bias and by one level for inconsistency because of considerable heterogeneity not explained by subgroup analyses; point estimates varied widely among studies and confidence intervals showed minimal overlap. Motor block was also longer in the perineural dexamethasone group compared with control by approximately six hours (16 studies, 912 participants).
Among five studies (257 participants), postoperative pain intensity at 12 hours in the perineural dexamethasone group was 2.1 points lower on an 11‐point numeric rating scale. The quality of evidence is very low; we downgraded by one level for risk of bias because half of the studies were at high/unclear risk of bias, by one level for inconsistency due to considerable heterogeneity not explained by subgroup analyses, and by one level for imprecision due to small sample size. At 24 hours, perineural dexamethasone reduced postoperative pain intensity by 1.6 points (9 studies, 469 participants). The quality of evidence is low; we downgraded by one level for inconsistency because of considerable heterogeneity not explained by subgroup analysis, and by one level for imprecision because the confidence interval includes both no clinical effect and clinical effect. For postoperative pain intensity at 12 and 24 hours, the minimally important difference (MID) of 1.2 points was surpassed. There was no difference in postoperative pain intensity between perineural dexamethasone and placebo at 48 hours (3 studies, 296 participants). The quality of evidence is low; we downgraded by one level for inconsistency due to moderate heterogeneity not explained by subgroup analyses, and by one level for imprecision because the confidence interval includes both no clinical effect and clinical effect. Cumulative opioid consumption 24 hours postoperatively was lower in the perineural dexamethasone group compared with placebo by 19 mg oral morphine equivalents.
Based on our a priori hypotheses, the duration of sensory block was significantly longer in long‐ versus medium‐acting local anaesthetic subgroup and the high‐ versus low‐dose dexamethasone subgroup. There was no significant difference in effect size between the high‐ and low‐dose dexamethasone subgroups in postoperative pain intensity at 12‐ and 24‐hour outcomes; therefore, the longer duration of sensory block in the long‐acting local anaesthetic and high‐dose dexamethasone subgroups are likely not clinically significant.
Intravenous dexamethasone versus placebo
Among eight trials (499 participants), the duration of sensory block was longer in the intravenous dexamethasone group by approximately six hours. The quality of evidence is moderate; we downgraded by one level for inconsistency because of considerable heterogeneity not explained by subgroup analyses. The duration of motor block was also longer in the intravenous dexamethasone group compared with control by approximately five hours.
Among three studies (162 participants), postoperative pain intensity at 12 hours was lower in the intravenous dexamethasone group compared with placebo by 1.2 points on an 11‐point numeric rating scale. The quality of evidence is low; we downgraded by one level for inconsistency because of considerable heterogeneity not explained by subgroup analyses, and by one level for imprecision because the confidence interval included both no clinical effect and clinical effect. At 24 hours (5 studies, 257 participants), postoperative pain intensity was lower in the intravenous dexamethasone group by 1.3 points. The quality of evidence is low; we downgraded by one level for inconsistency for considerable heterogeneity not explained by subgroup analyses, and by one level for imprecision because the confidence interval includes both no clinical benefit and clinical benefit. The MID of 1.2 points was surpassed in postoperative pain intensity at 12‐ and 24‐hour outcomes. Among three trials (172 participants) there was no difference in postoperative pain intensity at 48 hours. The quality of evidence is low; we downgraded by two levels for imprecision because the confidence interval crosses the line of null effect, and because of the small sample size. Opioid consumption 24 hours postoperatively was lower in the intravenous dexamethasone group.
Based on our a priori hypotheses, the duration of sensory block was significantly longer in the high‐ versus low‐dose dexamethasone subgroup. There was no significant difference in effect size between the high‐ and low‐dose dexamethasone subgroups in the intensity of postoperative pain at 12‐ and 24‐hour outcomes, therefore the longer duration of sensory block in the high‐dose dexamethasone is likely not clinically significant.
Perineural versus intravenous dexamethasone
Among nine studies (720 participants) the duration of sensory block was longer in the perineural dexamethasone group compared with intravenous dexamethasone by approximately three hours. The quality of evidence is moderate; we downgraded by one level for considerable heterogeneity not explained by subgroup analysis. Duration of motor block was also longer in the perineural dexamethasone group by approximately three hours (3 studies, 139 participants).
Postoperative pain intensity at 12 hours was lower in the perineural dexamethasone group compared with intravenous dexamethasone (3 studies, 217 participants). The MID of 1.2 was not surpassed; therefore the lower intensity of pain is not clinically significant. The quality of evidence is very low; we downgraded by one level for risk of bias because two out of the three included studies are at unclear risk of bias, and by one level for imprecision because the confidence interval includes both no clinical effect and clinical effect. At 24 hours, although the postoperative pain intensity was significantly higher in the perineural dexamethasone group compared with intravenous dexamethasone, the MID of 1.2 was not surpassed; therefore the lower intensity of pain is not clinically significant (5 studies, 309 participants). The quality of evidence is moderate; we downgraded by one level for imprecision because the confidence interval includes both clinical effect and no clinical effect. At 48 hours postoperatively, there was no difference in postoperative pain intensity between perineural and intravenous dexamethasone. The quality of evidence is low; we downgraded by one level for risk of bias because half the data comes from one study at unclear risk of bias and by one level for imprecision because of the small sample size. There was no difference between perineural and intravenous dexamethasone in 24‐hour postoperative opioid consumption. We did not find any difference in effect size between any of our subgroups.
Incidence of severe adverse events
Authors reported that they assessed for serious adverse events in seven studies. Five serious adverse events were reported in three studies including pneumothorax, pneumonia, development of Chronic Regional Pain Syndrome Type I, and two unexpected hospitalizations within one week of surgery; one for a fall, the other for a bowel infection. The quality of evidence is very low, downgraded by one level for risk of bias because the majority of studies were at high/unclear risk of bias, and by two levels for imprecision due to the small sample size.
Mild to moderate adverse events
We categorized mild to moderate adverse events into block‐related and non‐block‐related adverse events. Block‐related adverse events included numbness/tingling, residual motor block and muscle weakness, Horner's syndrome, hoarseness, diaphragmatic paresis, dyspnoea, cranial nerve 12 motor palsy, vascular injury, and bruising at the injection site. Non‐block‐related adverse events included bradycardia/hypotension, postoperative nausea and vomiting, pruritus/rash, syncope, dizziness, headache, fluid gain, diarrhoea, frequent urination, muscle soreness, wrist, hand or finger pain, and constipation.
We found no difference between the incidence of block‐related or non‐block‐related adverse events in any of the three comparisons. Because the incidence of severe and block‐related adverse events associated with the use of peripheral nerve block is rare, our review may not have included enough participants to detect a difference in any of the comparisons, therefore our confidence in the estimate is low (sparse number of participants and events). In only two studies did the authors report that block‐related symptoms had resolved, therefore it is not possible to determine whether participants reporting block‐related adverse events in other studies were later diagnosed with nerve injury.
Overall completeness and applicability of evidence
The majority of studies included in our review were conducted in upper limb surgery; as only two studies were conducted in lower limb surgery, we cannot draw any meaningful conclusions about the effectiveness of dexamethasone as an adjuvant to lower limb blocks. More studies for lower limb surgery are needed in order to determine whether our results are applicable in this population. The nine ongoing trials on ClinicalTrials.gov may change the results of this review.
The results of our review may not be applicable to participants who are at risk for dexamethasone‐related adverse events in whom clinical trials would likely to be unsafe. People with diabetes mellitus, peptic ulcer and psychiatric disorders were excluded from many of the trials. Additionally, our results may also not be applicable to those at risk for postoperative infection and delayed wound healing, including people with immunodeficiency disorders, those undergoing radiation therapy, people with circulatory disorder, obesity, poor nutritional status, or the elderly. Other populations excluded from some of the trials include those with renal, liver, cardiac or lung disease, head injury, hypertension, drug/alcohol dependence, pregnant women, and those who had used steroids or opioids preoperatively. Finally, there were no studies in infants and children under the age of 15 years, and so our results are not directly applicable to this population.
We found that the duration of sensory block was longer in the high‐ versus low‐dose dexamethasone subgroups in the perineural versus control and in the intravenous versus control comparisons, but the longer duration in the high‐dose dexamethasone subgroups was not associated with lower postoperative pain intensity. There were fewer studies using low‐dose than high‐dose dexamethasone. It is possible that the sample size was too small to detect a difference between high‐ and low‐dose dexamethasone. Dose‐finding studies would be beneficial to determine the ideal perineural and intravenous doses.
For the duration of sensory block outcome, we did not determine a priori the minimally important difference (MID) that would be clinically significant. In the perineural dexamethasone versus control and the intravenous dexamethasone versus control comparisons, the longer duration of sensory block in the dexamethasone groups was also associated with lower postoperative pain intensity and opioid consumption. In the perineural versus intravenous dexamethasone comparison, the longer duration of sensory block in the perineural dexamethasone was not associated with a reduction in postoperative pain intensity or opioid consumption, and we concluded that the longer duration of sensory block was unlikely to be clinically significant. In 10 of the included studies, duration of sensory block was reported without also reporting pain outcomes; therefore it is not known whether the longer duration of sensory block in the dexamethasone groups was effective in reducing postoperative pain and opioid consumption. In all future studies, duration of sensory block should be reported in conjunction with other pain outcomes to determine the efficacy of dexamethasone in reducing postoperative pain.
Potential biases in the review process
In order to reduce potential bias in the review process, two review authors independently assessed each trial for eligibility, extracted the data, assessed risk of bias, and assessed the quality of evidence. Furthermore, we did not impose any language restrictions. With the assistance of an experienced librarian, we did an extensive literature review of six databases and we searched Google Scholar and found additional studies we had not found through scientific databases. There were no marginal decisions around the inclusion or exclusion of studies or use and analysis of data. We made minor changes to the protocol, however, it is unlikely that any changes would have been a source of bias.
We conducted subgroup analyses to explore heterogeneity for all outcomes regardless of the observed heterogeneity (I2). In particular, we explored whether the type of local anaesthetic (long‐acting versus medium‐acting), the dose of dexamethasone (high‐ versus low‐dose), whether additives to local anaesthetics were used, and whether risk of bias (high/unclear versus low) could explain the observed heterogeneity. Our subgroup hypotheses were determined as possible factors that may influence the results based on the literature. There may be other reasons for heterogeneity that we did not explore.
Among our 35 eligible trials, 14 had incomplete reports (e.g. missing variance data, unclear presentation of data on figures). We attempted to obtain unpublished data for our meta‐analyses, but we were only able to obtain data from six of the 15 study authors we contacted. The missing information may have introduced a source of bias. With respect to publication bias, only two of the outcomes in the perineural versus placebo comparison included 10 or more trials (duration of sensory block and duration of motor block). Because our remaining outcomes in all three comparisons included fewer than 10 trials we were not able to adequately assess publication bias. Published protocols were available for 10 of the studies. For the remaining 25, because we relied on the information provided in the methods section to assess risk of selection bias, we could not ascertain whether all outcomes were reported as planned, so our assessment of selection bias is limited.
Agreements and disagreements with other studies or reviews
We found five reviews evaluating the effectiveness of perineural dexamethasone on postoperative outcomes that are in agreement with our findings. Two reviews were in participants undergoing upper limb surgery with brachial plexus block (Choi 2014; Knezivic 2015), and the remaining three were in participants undergoing surgery with a variety of nerve blocks, including peribulbar, transversus abdominis, axillary, supraclavicular, sciatic, and interscalene (Albrecht 2015; De Oliveira 2014; Huynh 2015). In all five reviews, the duration of sensory and motor block was longer after perineural dexamethasone compared with placebo. Albrecht 2015 and De Oliveira 2014 found that 24‐hour postoperative opioid consumption was lower after perineural dexamethasone compared with placebo.
We found two systematic reviews that evaluated the effectiveness of intravenous dexamethasone for postoperative pain (De Oliveira 2011; Waldron 2013). Neither of these reviews included studies in participants undergoing peripheral nerve block. Postoperative pain intensity at 24 hours, opioid consumption, and the incidence of postoperative nausea and vomiting was lower in the intravenous dexamethasone group compared with placebo (De Oliveira 2011; Waldron 2013). We did not find any difference between intravenous dexamethasone and placebo in postoperative pain intensity at 24 hours or the incidence of postoperative nausea and vomiting; however, our review included fewer participants than the previous reviews.

Flow diagram of included studies.

Risk of bias graph: review authors' judgements about each risk of bias item presented as percentages across all included studies.
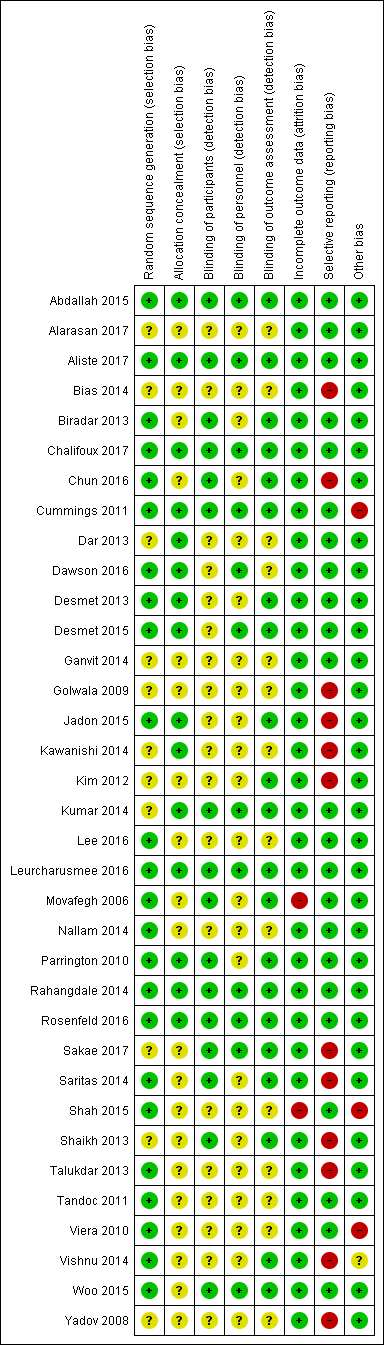
Risk of bias summary: review authors' judgements about each risk of bias item for each included study.
![Forest plot of comparison: 1 Duration of sensory block: perineural dexamethasone versus placebo, outcome: 1.1 Duration of sensory block [hours].](/es/cdsr/doi/10.1002/14651858.CD011770.pub2/media/CDSR/CD011770/image_n/nCD011770-AFig-FIG04.png)
Forest plot of comparison: 1 Duration of sensory block: perineural dexamethasone versus placebo, outcome: 1.1 Duration of sensory block [hours].

Forest plot of comparison: 4 Postoperative pain intensity at 12 hours: perineural dexamethasone versus placebo, outcome: 4.1 Postoperative pain intensity at12 hours.

Forest plot of comparison: 5 Postoperative pain intensity at 24 hours: perineural dexamethasone versus placebo, outcome: 5.1 Postoperative pain intensity at 24 hours.
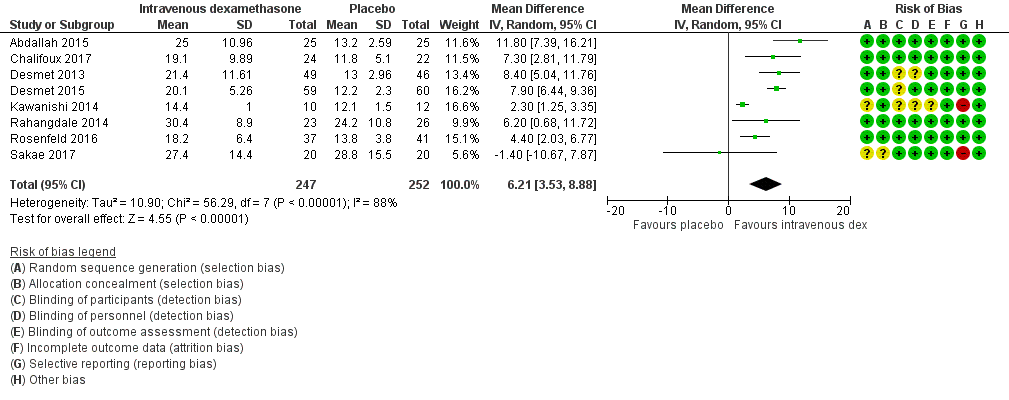
Forest plot of comparison: 9 Duration of sensory block: intravenous dexamethasone versus placebo , outcome: 9.1 Duration of sensory block.
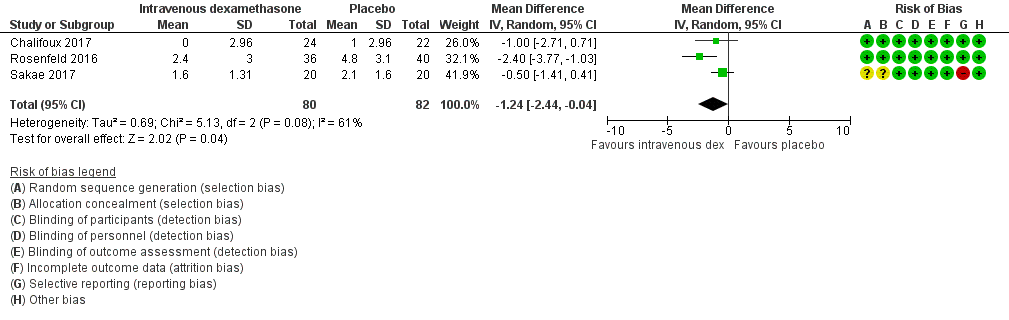
Forest plot of comparison: 12 Postoperative pain intensity at 12 hours: intravenous dexamethasone versus placebo, outcome: 12.1 Postoperative pain intensity at 12 hours.

Forest plot of comparison: 13 Postoperative pain intensity at 24 hours: intravenous dexamethasone versus placebo, outcome: 13.1 Postoperative pain intensity at 24 hours.

Comparison 1 Duration of sensory block: perineural dexamethasone versus placebo, Outcome 1 Duration of sensory block.

Comparison 1 Duration of sensory block: perineural dexamethasone versus placebo, Outcome 2 Duration of sensory block: long‐ versus medium‐acting local anaesthetic subgroups.
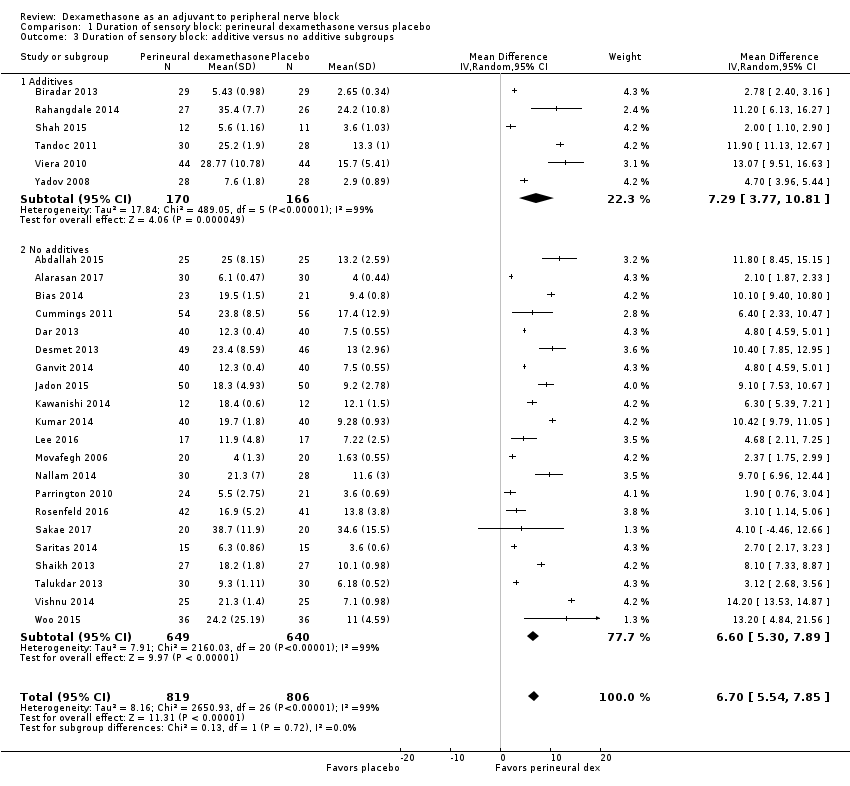
Comparison 1 Duration of sensory block: perineural dexamethasone versus placebo, Outcome 3 Duration of sensory block: additive versus no additive subgroups.
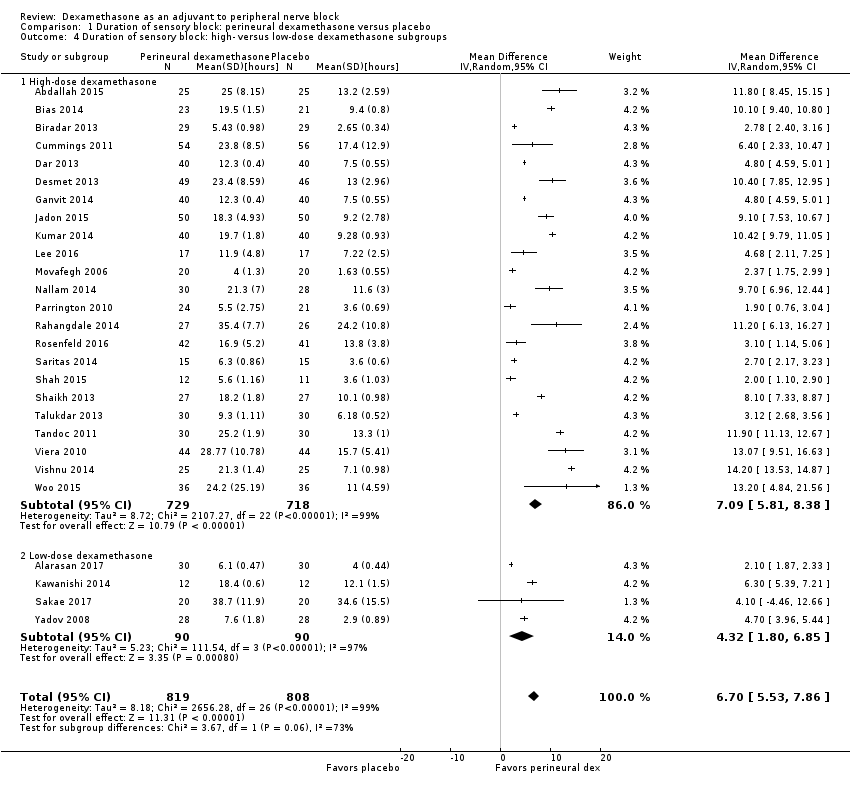
Comparison 1 Duration of sensory block: perineural dexamethasone versus placebo, Outcome 4 Duration of sensory block: high‐ versus low‐dose dexamethasone subgroups.
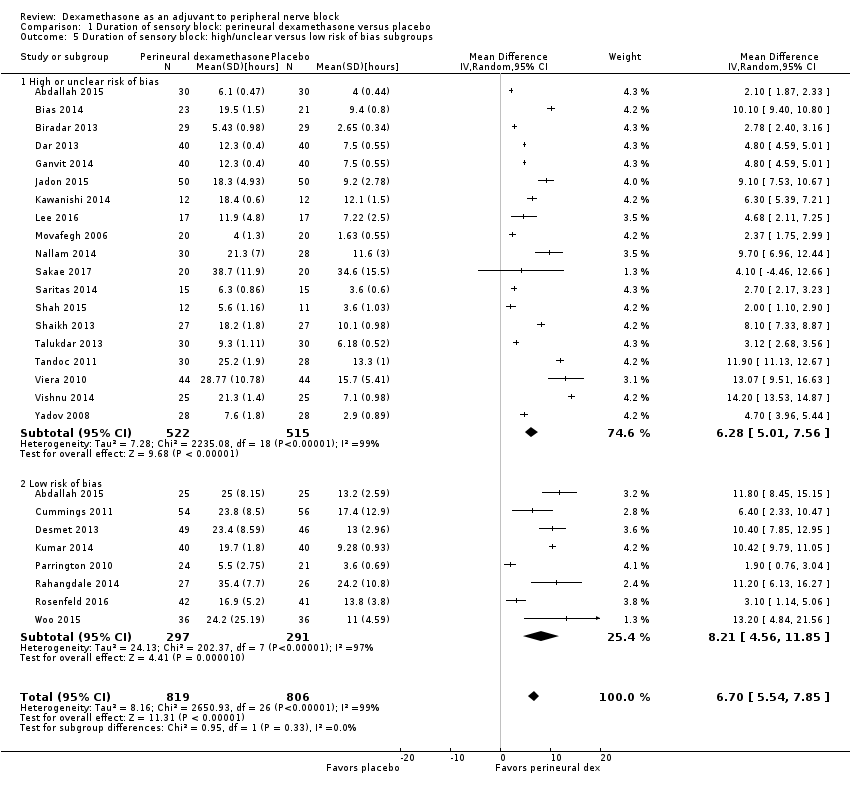
Comparison 1 Duration of sensory block: perineural dexamethasone versus placebo, Outcome 5 Duration of sensory block: high/unclear versus low risk of bias subgroups.
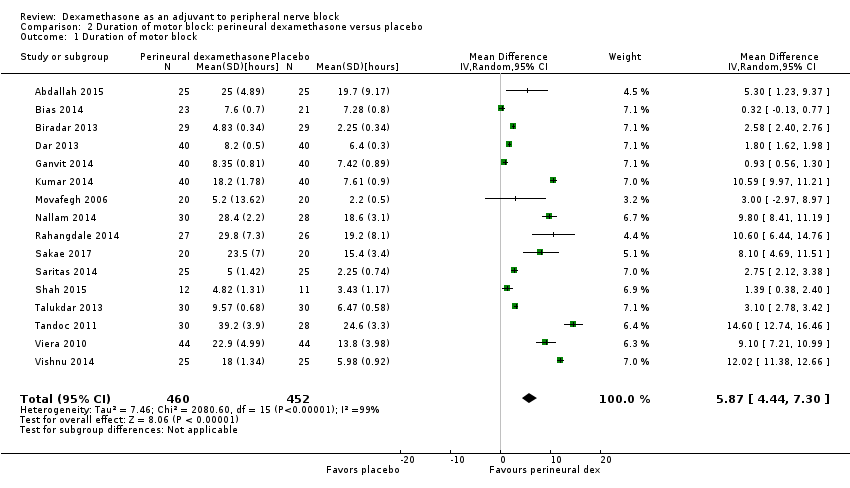
Comparison 2 Duration of motor block: perineural dexamethasone versus placebo, Outcome 1 Duration of motor block.
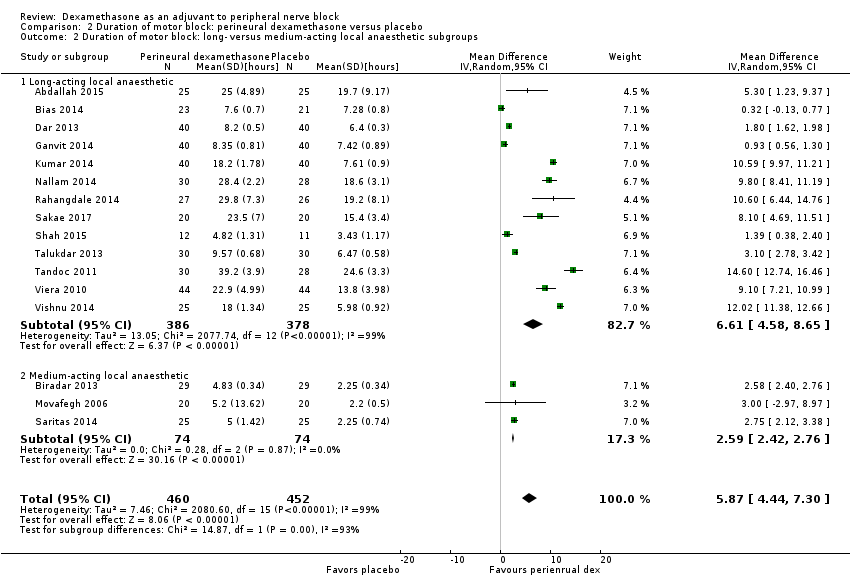
Comparison 2 Duration of motor block: perineural dexamethasone versus placebo, Outcome 2 Duration of motor block: long‐ versus medium‐acting local anaesthetic subgroups.

Comparison 2 Duration of motor block: perineural dexamethasone versus placebo, Outcome 3 Duration of motor block: additives verus no additives subgroups.

Comparison 2 Duration of motor block: perineural dexamethasone versus placebo, Outcome 4 Duration of motor block: high‐ versus low‐dose dexamethasone subgroups.
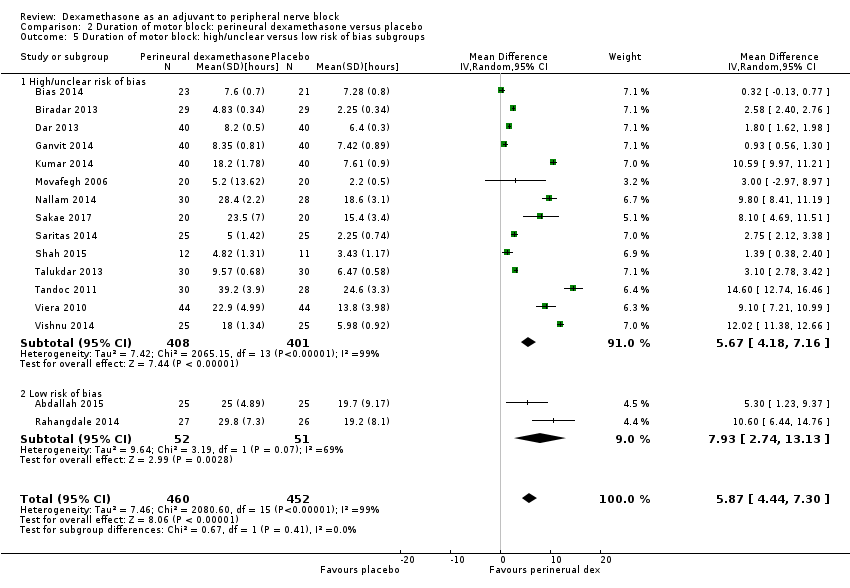
Comparison 2 Duration of motor block: perineural dexamethasone versus placebo, Outcome 5 Duration of motor block: high/unclear versus low risk of bias subgroups.
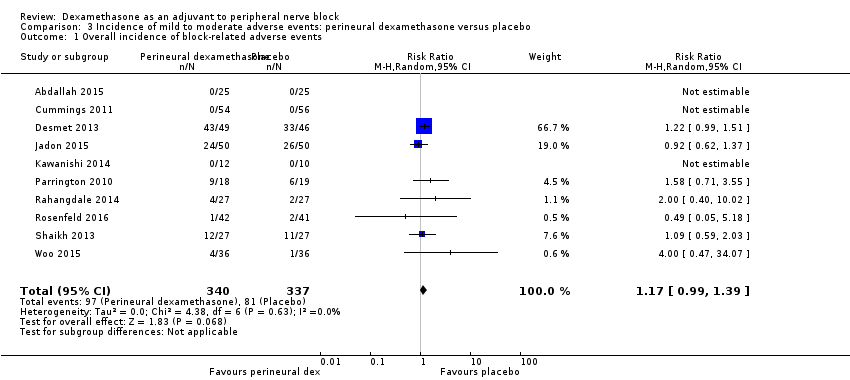
Comparison 3 Incidence of mild to moderate adverse events: perineural dexamethasone versus placebo, Outcome 1 Overall incidence of block‐related adverse events.

Comparison 3 Incidence of mild to moderate adverse events: perineural dexamethasone versus placebo, Outcome 2 Numbness/tingling 14 days after surgery.

Comparison 3 Incidence of mild to moderate adverse events: perineural dexamethasone versus placebo, Outcome 3 Residual motor block/weakness 24 hours after surgery.

Comparison 3 Incidence of mild to moderate adverse events: perineural dexamethasone versus placebo, Outcome 4 Horner Syndrome.

Comparison 3 Incidence of mild to moderate adverse events: perineural dexamethasone versus placebo, Outcome 5 Hoarseness.

Comparison 3 Incidence of mild to moderate adverse events: perineural dexamethasone versus placebo, Outcome 6 Diaphragmatic paresis.

Comparison 3 Incidence of mild to moderate adverse events: perineural dexamethasone versus placebo, Outcome 7 Dyspnoea.

Comparison 3 Incidence of mild to moderate adverse events: perineural dexamethasone versus placebo, Outcome 8 Vascular injury.

Comparison 3 Incidence of mild to moderate adverse events: perineural dexamethasone versus placebo, Outcome 9 Cranial nerve 12 palsy.

Comparison 3 Incidence of mild to moderate adverse events: perineural dexamethasone versus placebo, Outcome 10 Bruising.
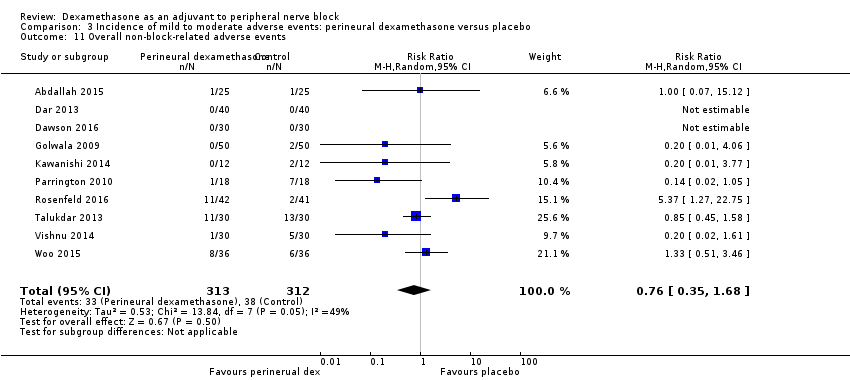
Comparison 3 Incidence of mild to moderate adverse events: perineural dexamethasone versus placebo, Outcome 11 Overall non‐block‐related adverse events.

Comparison 3 Incidence of mild to moderate adverse events: perineural dexamethasone versus placebo, Outcome 12 Postoperative nausea and vomiting.

Comparison 3 Incidence of mild to moderate adverse events: perineural dexamethasone versus placebo, Outcome 13 Deep sedation.

Comparison 3 Incidence of mild to moderate adverse events: perineural dexamethasone versus placebo, Outcome 14 Dermatological symptoms (pruritus/rash).
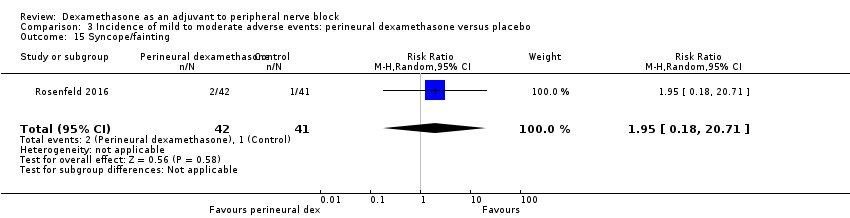
Comparison 3 Incidence of mild to moderate adverse events: perineural dexamethasone versus placebo, Outcome 15 Syncope/fainting.

Comparison 3 Incidence of mild to moderate adverse events: perineural dexamethasone versus placebo, Outcome 16 Bradycardia.

Comparison 3 Incidence of mild to moderate adverse events: perineural dexamethasone versus placebo, Outcome 17 Hypotension.

Comparison 3 Incidence of mild to moderate adverse events: perineural dexamethasone versus placebo, Outcome 18 Headache/10‐pound fluid gain/diarrhoea/frequent urination/muscle soreness.
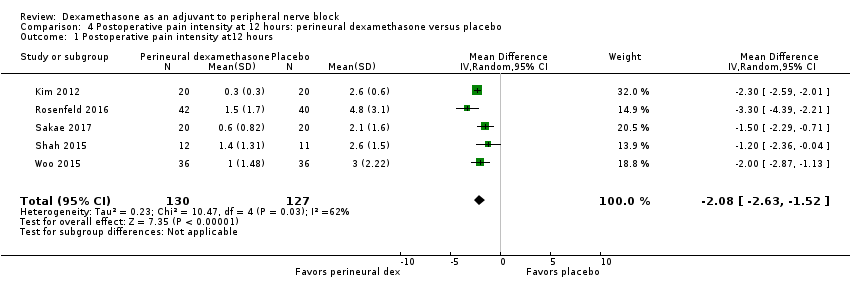
Comparison 4 Postoperative pain intensity at 12 hours: perineural dexamethasone versus placebo, Outcome 1 Postoperative pain intensity at12 hours.
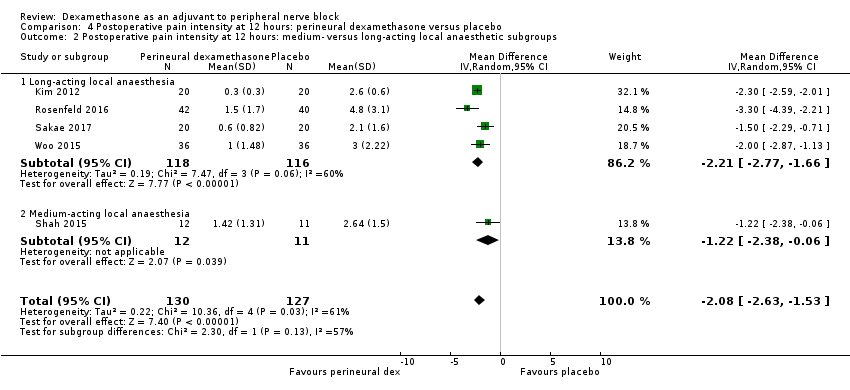
Comparison 4 Postoperative pain intensity at 12 hours: perineural dexamethasone versus placebo, Outcome 2 Postoperative pain intensity at 12 hours: medium‐ versus long‐acting local anaesthetic subgroups.
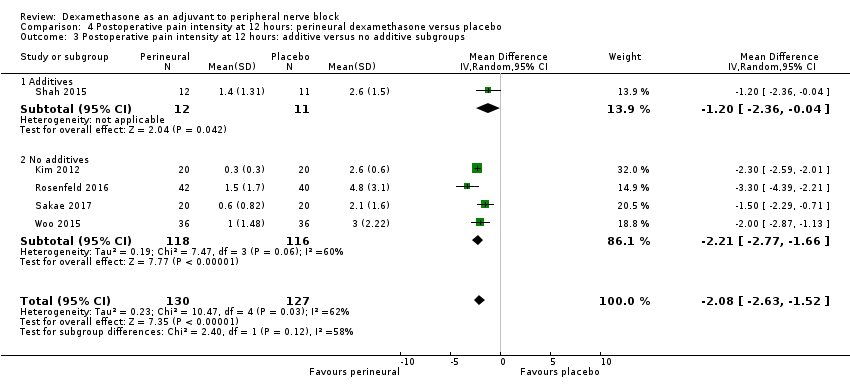
Comparison 4 Postoperative pain intensity at 12 hours: perineural dexamethasone versus placebo, Outcome 3 Postoperative pain intensity at 12 hours: additive versus no additive subgroups.

Comparison 4 Postoperative pain intensity at 12 hours: perineural dexamethasone versus placebo, Outcome 4 Postoperative pain intensity at 12 hours: high‐ versus low‐dose dexamethasone subgroups.
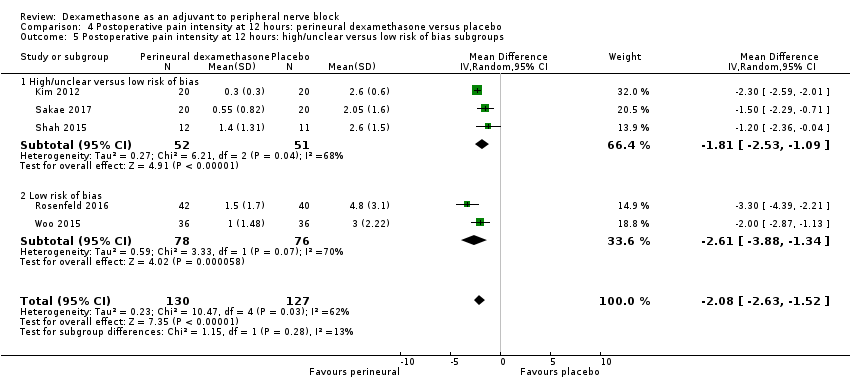
Comparison 4 Postoperative pain intensity at 12 hours: perineural dexamethasone versus placebo, Outcome 5 Postoperative pain intensity at 12 hours: high/unclear versus low risk of bias subgroups.

Comparison 5 Postoperative pain intensity at 24 hours: perineural dexamethasone versus placebo, Outcome 1 Postoperative pain intensity at 24 hours.

Comparison 5 Postoperative pain intensity at 24 hours: perineural dexamethasone versus placebo, Outcome 2 Postoperative pain intensity at 24 hours: long‐ versus medium‐acting local anaesthetic subgroups.
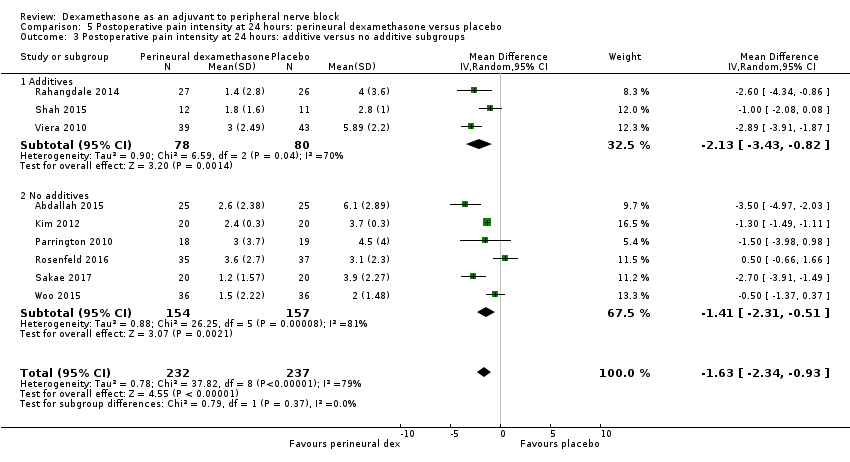
Comparison 5 Postoperative pain intensity at 24 hours: perineural dexamethasone versus placebo, Outcome 3 Postoperative pain intensity at 24 hours: additive versus no additive subgroups.
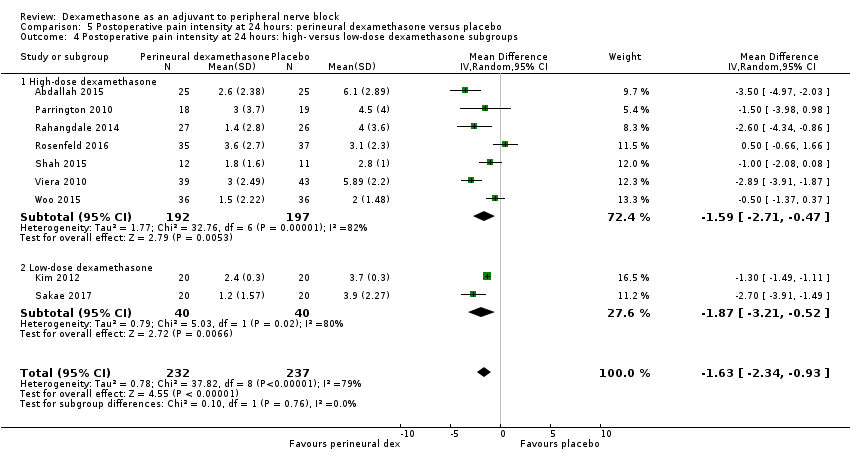
Comparison 5 Postoperative pain intensity at 24 hours: perineural dexamethasone versus placebo, Outcome 4 Postoperative pain intensity at 24 hours: high‐ versus low‐dose dexamethasone subgroups.
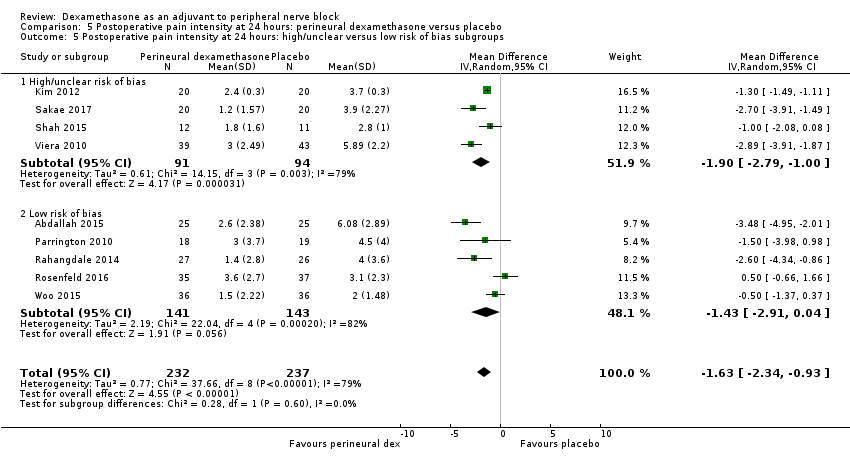
Comparison 5 Postoperative pain intensity at 24 hours: perineural dexamethasone versus placebo, Outcome 5 Postoperative pain intensity at 24 hours: high/unclear versus low risk of bias subgroups.

Comparison 6 Postoperative pain intensity at 48 hours: perineural dexamethasone versus placebo, Outcome 1 Postoperative pain intensity at 48 hours.

Comparison 6 Postoperative pain intensity at 48 hours: perineural dexamethasone versus placebo, Outcome 2 Postoperative pain intensity at 48 hours: additives versus no additives subgroups.
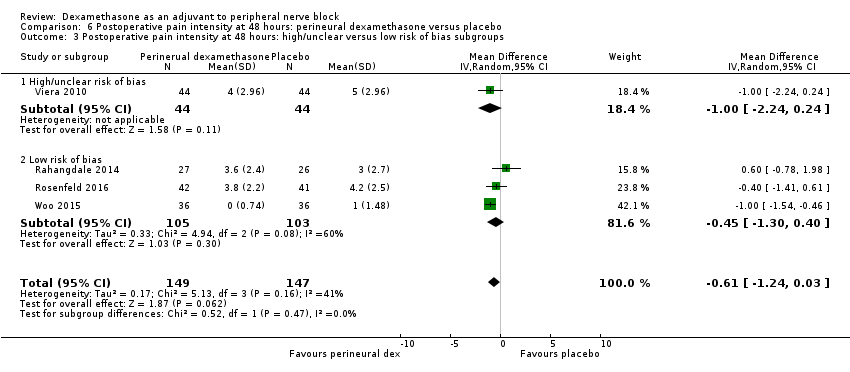
Comparison 6 Postoperative pain intensity at 48 hours: perineural dexamethasone versus placebo, Outcome 3 Postoperative pain intensity at 48 hours: high/unclear versus low risk of bias subgroups.
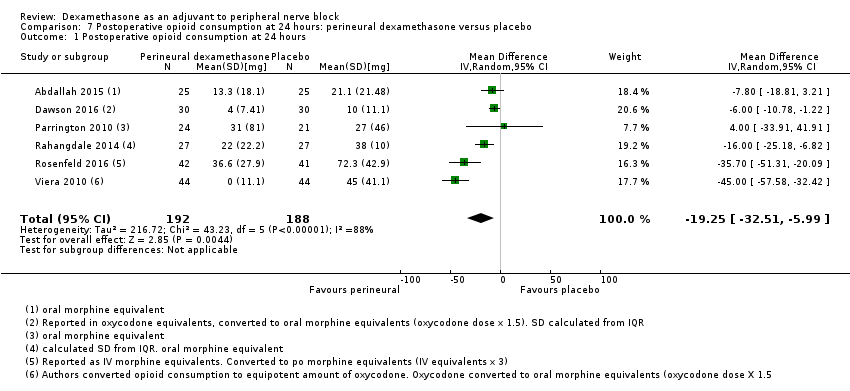
Comparison 7 Postoperative opioid consumption at 24 hours: perineural dexamethasone versus placebo, Outcome 1 Postoperative opioid consumption at 24 hours.

Comparison 7 Postoperative opioid consumption at 24 hours: perineural dexamethasone versus placebo, Outcome 2 Opioid consumption at 24 hours medium‐ versus long‐acting local anaesthetic subgroups.

Comparison 7 Postoperative opioid consumption at 24 hours: perineural dexamethasone versus placebo, Outcome 3 Opioid consumption at 24 hours: additive versus no additive subgroups.
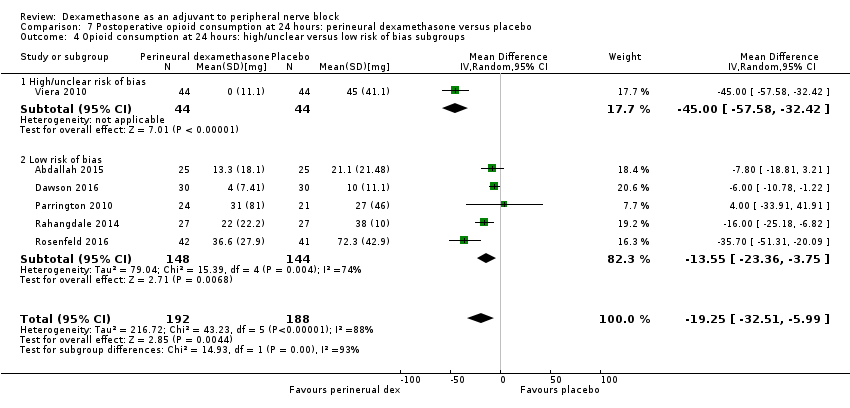
Comparison 7 Postoperative opioid consumption at 24 hours: perineural dexamethasone versus placebo, Outcome 4 Opioid consumption at 24 hours: high/unclear versus low risk of bias subgroups.
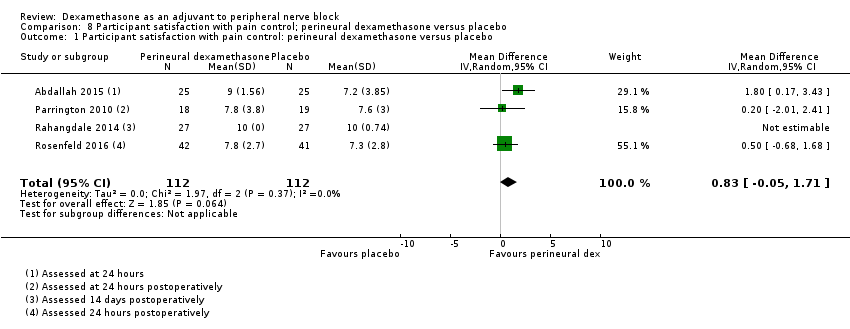
Comparison 8 Participant satisfaction with pain control; perineural dexamethasone versus placebo, Outcome 1 Participant satisfaction with pain control: perineural dexamethasone versus placebo.
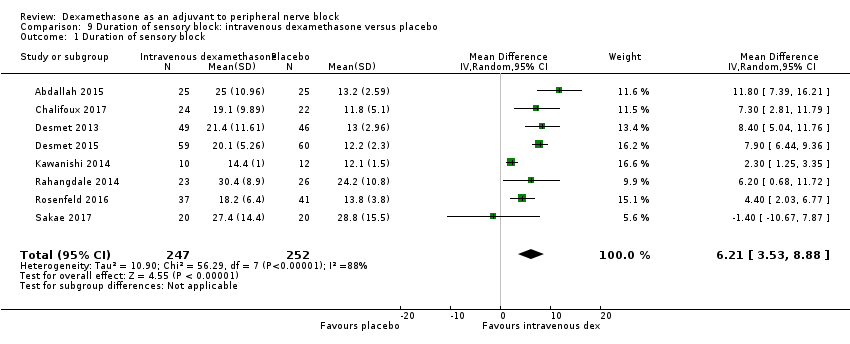
Comparison 9 Duration of sensory block: intravenous dexamethasone versus placebo, Outcome 1 Duration of sensory block.
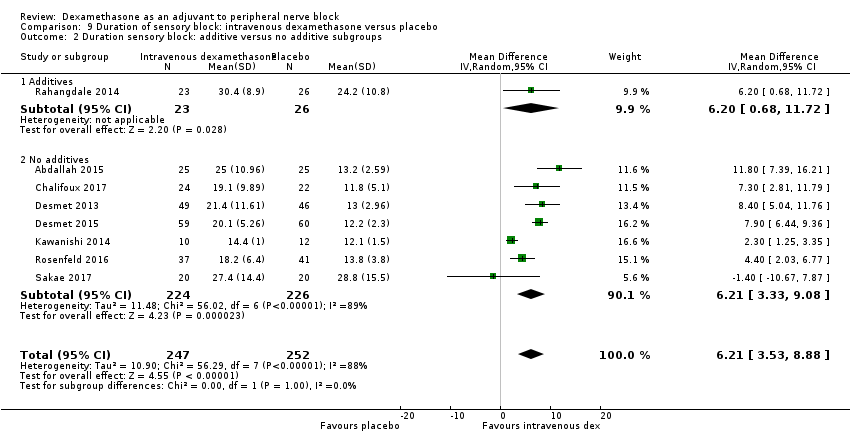
Comparison 9 Duration of sensory block: intravenous dexamethasone versus placebo, Outcome 2 Duration sensory block: additive versus no additive subgroups.

Comparison 9 Duration of sensory block: intravenous dexamethasone versus placebo, Outcome 3 Duration of sensory block: high‐ versus low‐dose dexamethasone subgroups.
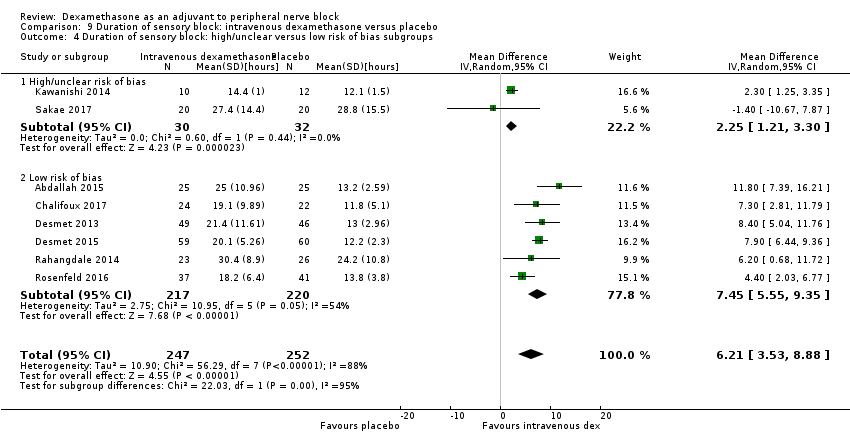
Comparison 9 Duration of sensory block: intravenous dexamethasone versus placebo, Outcome 4 Duration of sensory block: high/unclear versus low risk of bias subgroups.

Comparison 10 Duration of motor block: intravenous dexamethasone versus placebo, Outcome 1 Duration of motor block.

Comparison 10 Duration of motor block: intravenous dexamethasone versus placebo, Outcome 2 Duration of motor block: additive versus no additive subgroups.
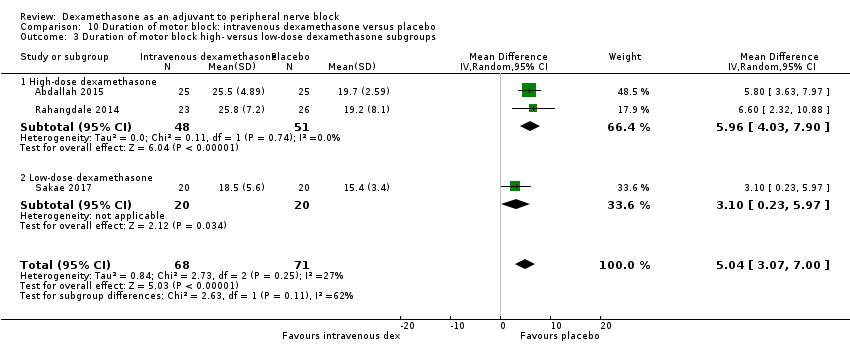
Comparison 10 Duration of motor block: intravenous dexamethasone versus placebo, Outcome 3 Duration of motor block high‐ versus low‐dose dexamethasone subgroups.
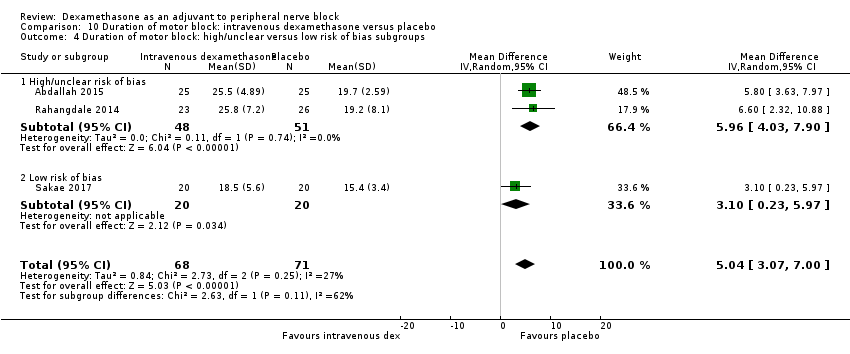
Comparison 10 Duration of motor block: intravenous dexamethasone versus placebo, Outcome 4 Duration of motor block: high/unclear versus low risk of bias subgroups.
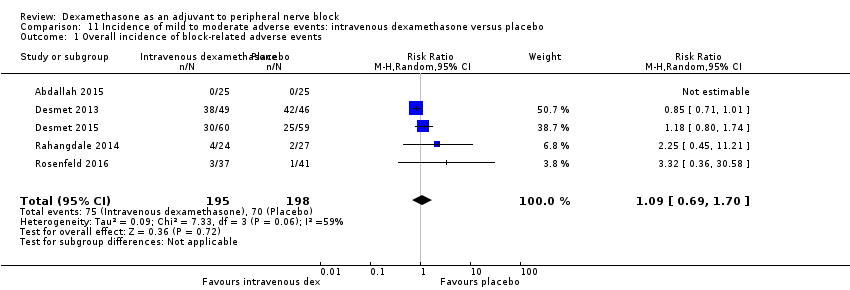
Comparison 11 Incidence of mild to moderate adverse events: intravenous dexamethasone versus placebo, Outcome 1 Overall incidence of block‐related adverse events.

Comparison 11 Incidence of mild to moderate adverse events: intravenous dexamethasone versus placebo, Outcome 2 Numbness/tingling 14 days after surgery.

Comparison 11 Incidence of mild to moderate adverse events: intravenous dexamethasone versus placebo, Outcome 3 Residual motor block/muscle weakness 24 hours after surgery.

Comparison 11 Incidence of mild to moderate adverse events: intravenous dexamethasone versus placebo, Outcome 4 Horner syndrome.
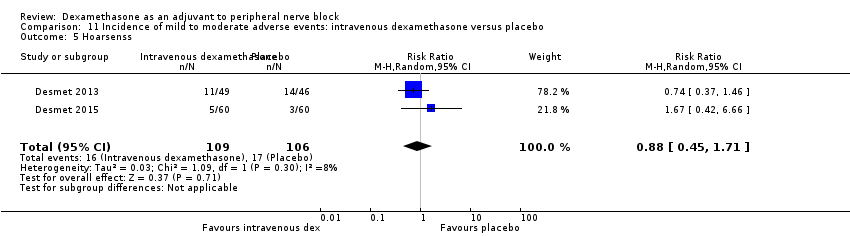
Comparison 11 Incidence of mild to moderate adverse events: intravenous dexamethasone versus placebo, Outcome 5 Hoarsenss.
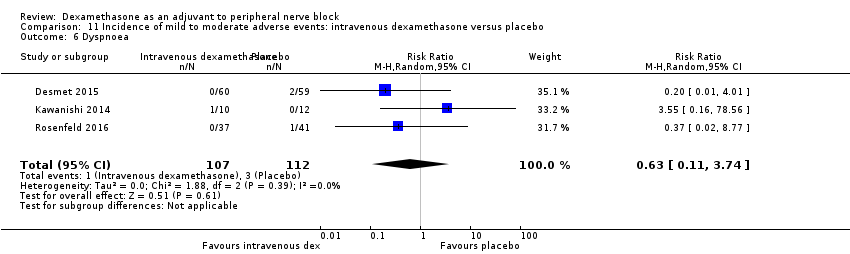
Comparison 11 Incidence of mild to moderate adverse events: intravenous dexamethasone versus placebo, Outcome 6 Dyspnoea.
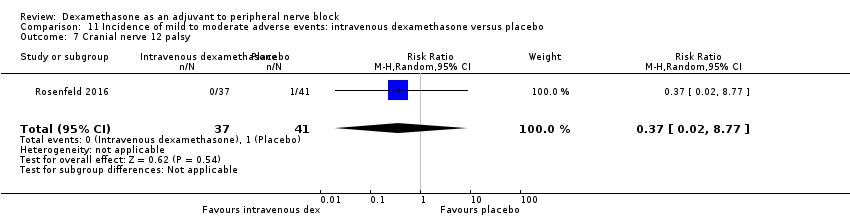
Comparison 11 Incidence of mild to moderate adverse events: intravenous dexamethasone versus placebo, Outcome 7 Cranial nerve 12 palsy.
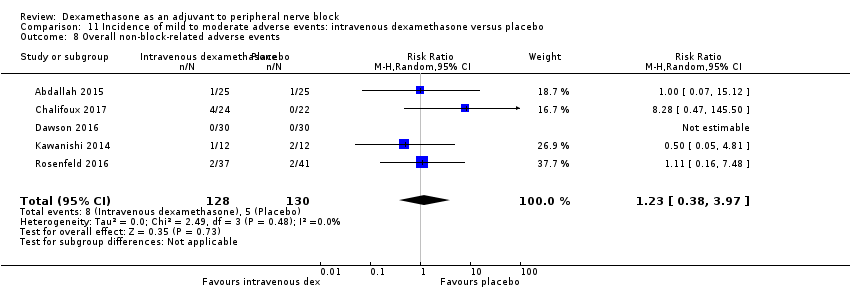
Comparison 11 Incidence of mild to moderate adverse events: intravenous dexamethasone versus placebo, Outcome 8 Overall non‐block‐related adverse events.
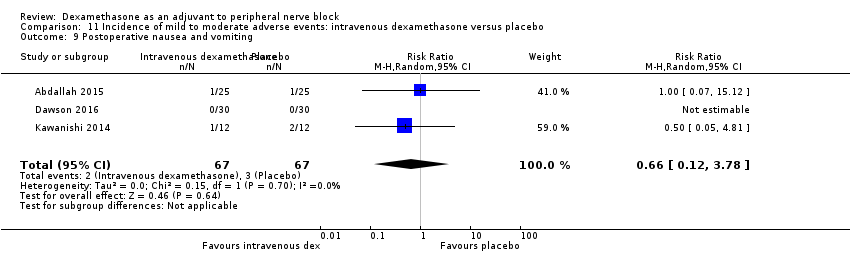
Comparison 11 Incidence of mild to moderate adverse events: intravenous dexamethasone versus placebo, Outcome 9 Postoperative nausea and vomiting.

Comparison 11 Incidence of mild to moderate adverse events: intravenous dexamethasone versus placebo, Outcome 10 Dermatological symptoms.

Comparison 11 Incidence of mild to moderate adverse events: intravenous dexamethasone versus placebo, Outcome 11 Dizziness/wrist, hand or finger pain, constipation.
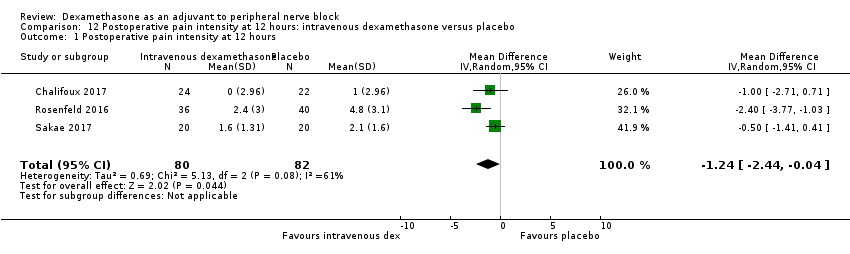
Comparison 12 Postoperative pain intensity at 12 hours: intravenous dexamethasone versus placebo, Outcome 1 Postoperative pain intensity at 12 hours.
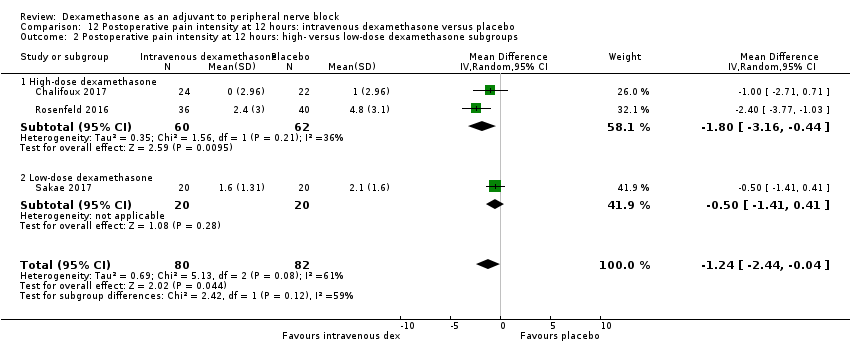
Comparison 12 Postoperative pain intensity at 12 hours: intravenous dexamethasone versus placebo, Outcome 2 Postoperative pain intensity at 12 hours: high‐ versus low‐dose dexamethasone subgroups.
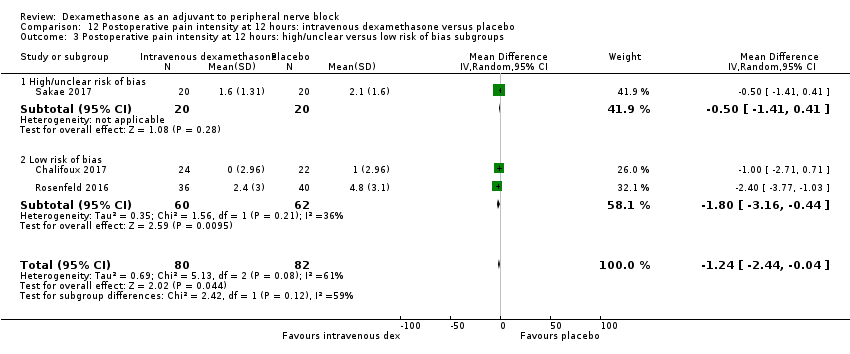
Comparison 12 Postoperative pain intensity at 12 hours: intravenous dexamethasone versus placebo, Outcome 3 Postoperative pain intensity at 12 hours: high/unclear versus low risk of bias subgroups.

Comparison 13 Postoperative pain intensity at 24 hours: intravenous dexamethasone versus placebo, Outcome 1 Postoperative pain intensity at 24 hours.

Comparison 13 Postoperative pain intensity at 24 hours: intravenous dexamethasone versus placebo, Outcome 2 Postoperative pain intensity at 24 hours: additive versus no additive subgroups.

Comparison 13 Postoperative pain intensity at 24 hours: intravenous dexamethasone versus placebo, Outcome 3 Postoperative pain intensity at 24 hours: high‐ versus low‐dose dexamethasone subgroups.
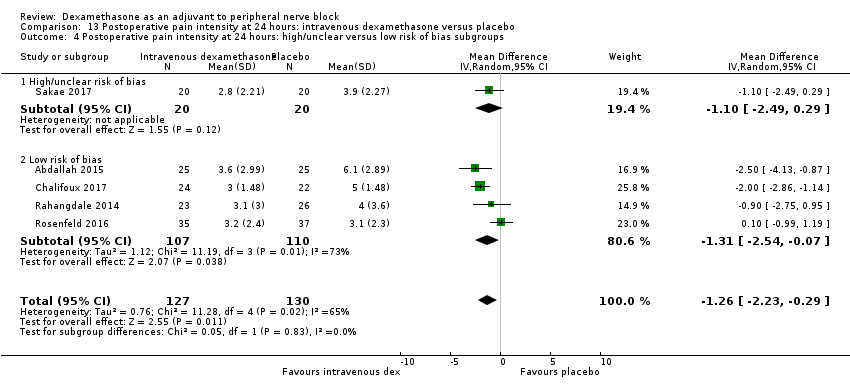
Comparison 13 Postoperative pain intensity at 24 hours: intravenous dexamethasone versus placebo, Outcome 4 Postoperative pain intensity at 24 hours: high/unclear versus low risk of bias subgroups.

Comparison 14 Postoperative pain intensity at 48 hours: intravenous dexamethasone versus placebo, Outcome 1 Postoperative pain intensity at 48 hours.

Comparison 14 Postoperative pain intensity at 48 hours: intravenous dexamethasone versus placebo, Outcome 2 Postoperative pain intensity at 48 hours: additive versus no additive subgroups.

Comparison 15 Postoperative opioid consumption at 24 hours: intravenous dexamethasone versus placebo, Outcome 1 24‐hour opioid consumption.
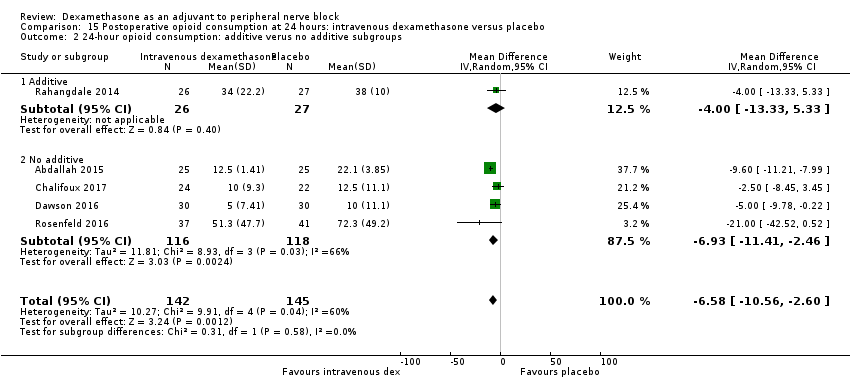
Comparison 15 Postoperative opioid consumption at 24 hours: intravenous dexamethasone versus placebo, Outcome 2 24‐hour opioid consumption: additive verus no additive subgroups.
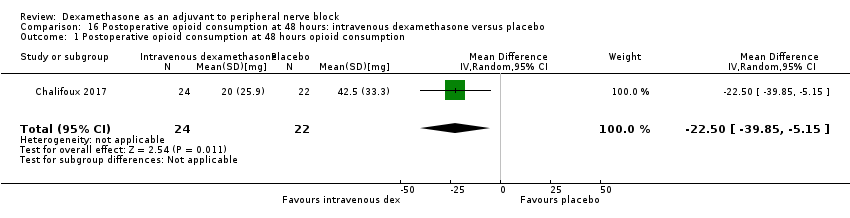
Comparison 16 Postoperative opioid consumption at 48 hours: intravenous dexamethasone versus placebo, Outcome 1 Postoperative opioid consumption at 48 hours opioid consumption.
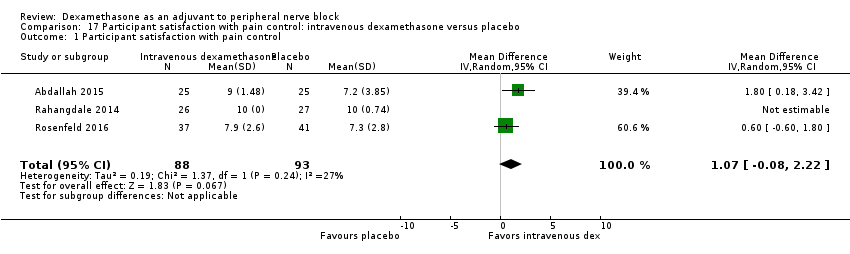
Comparison 17 Participant satisfaction with pain control: intravenous dexamethasone versus placebo, Outcome 1 Participant satisfaction with pain control.

Comparison 18 Duration of sensory block: perineural versus intravenous dexamethasone, Outcome 1 Duration of sensory block.
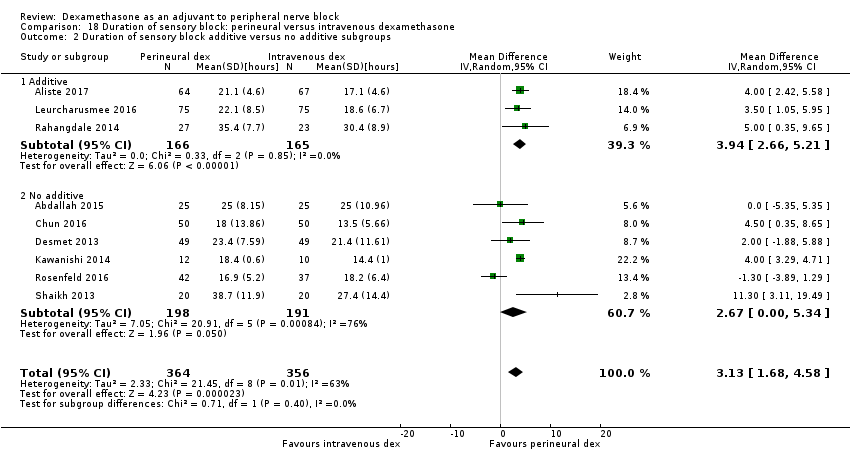
Comparison 18 Duration of sensory block: perineural versus intravenous dexamethasone, Outcome 2 Duration of sensory block additive versus no additive subgroups.

Comparison 18 Duration of sensory block: perineural versus intravenous dexamethasone, Outcome 3 Duration sensory block high‐dose versus low‐dose dexamethasone subgroups.

Comparison 18 Duration of sensory block: perineural versus intravenous dexamethasone, Outcome 4 Duration sensory block high/unclear versus low risk of bias subgroups.
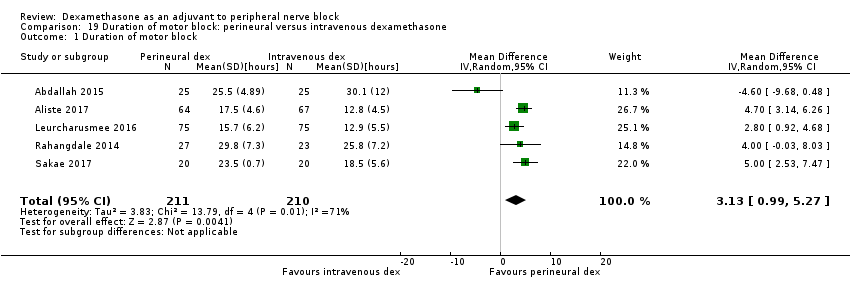
Comparison 19 Duration of motor block: perineural versus intravenous dexamethasone, Outcome 1 Duration of motor block.

Comparison 19 Duration of motor block: perineural versus intravenous dexamethasone, Outcome 2 Duration of motor block: additive versus no additive subgroups.

Comparison 19 Duration of motor block: perineural versus intravenous dexamethasone, Outcome 3 Duration of motor block: high‐ versus low‐dose dexamethasone subgroups.
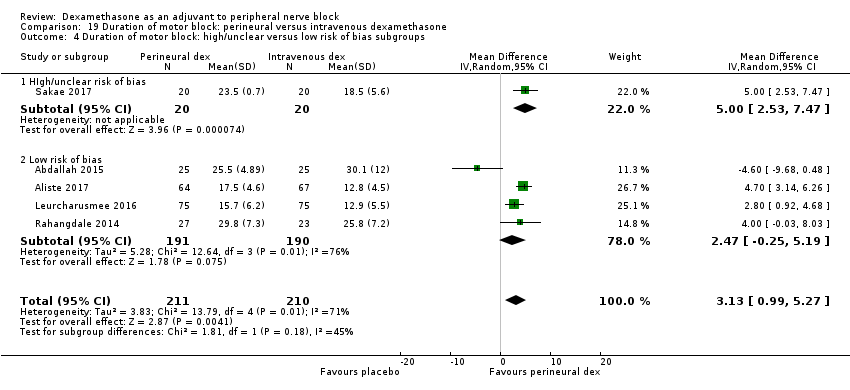
Comparison 19 Duration of motor block: perineural versus intravenous dexamethasone, Outcome 4 Duration of motor block: high/unclear versus low risk of bias subgroups.

Comparison 20 Incidence of mild to moderate adverse events: perineural versus intravenous dexamethasone, Outcome 1 Overall incidence of block‐related adverse events.
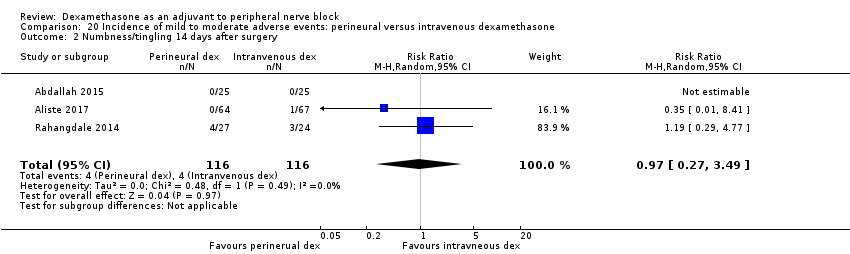
Comparison 20 Incidence of mild to moderate adverse events: perineural versus intravenous dexamethasone, Outcome 2 Numbness/tingling 14 days after surgery.

Comparison 20 Incidence of mild to moderate adverse events: perineural versus intravenous dexamethasone, Outcome 3 Residual motor block/weakness at 24 hours.
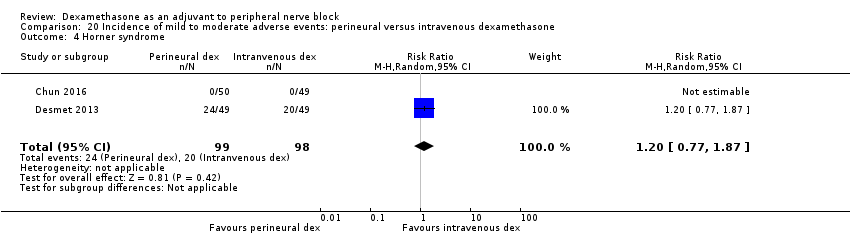
Comparison 20 Incidence of mild to moderate adverse events: perineural versus intravenous dexamethasone, Outcome 4 Horner syndrome.

Comparison 20 Incidence of mild to moderate adverse events: perineural versus intravenous dexamethasone, Outcome 5 Hoarsness.

Comparison 20 Incidence of mild to moderate adverse events: perineural versus intravenous dexamethasone, Outcome 6 Cranial nerve 12 motor palsy.
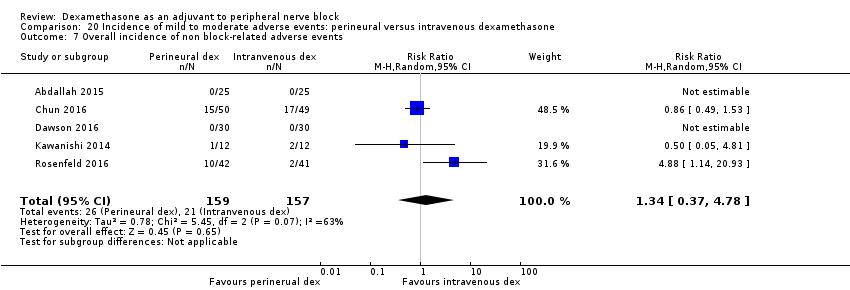
Comparison 20 Incidence of mild to moderate adverse events: perineural versus intravenous dexamethasone, Outcome 7 Overall incidence of non block‐related adverse events.
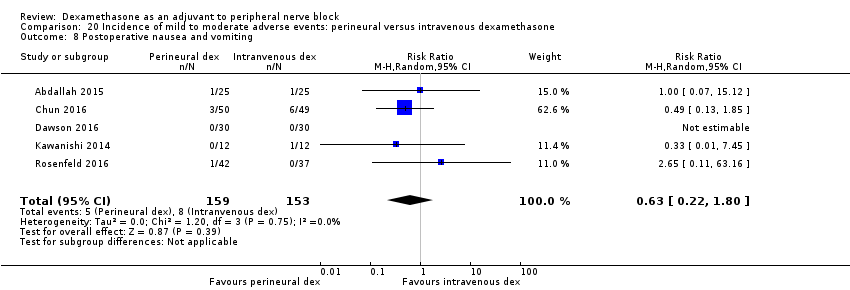
Comparison 20 Incidence of mild to moderate adverse events: perineural versus intravenous dexamethasone, Outcome 8 Postoperative nausea and vomiting.

Comparison 20 Incidence of mild to moderate adverse events: perineural versus intravenous dexamethasone, Outcome 9 Dermatologicial symptoms (pruritus/rash).

Comparison 20 Incidence of mild to moderate adverse events: perineural versus intravenous dexamethasone, Outcome 10 Syncope/fainting.

Comparison 20 Incidence of mild to moderate adverse events: perineural versus intravenous dexamethasone, Outcome 11 Dizziness.

Comparison 20 Incidence of mild to moderate adverse events: perineural versus intravenous dexamethasone, Outcome 12 Wrist, hand or finger pain.
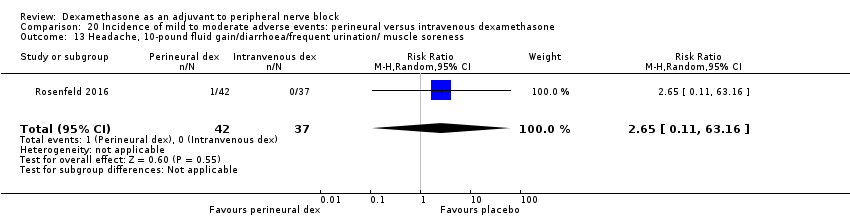
Comparison 20 Incidence of mild to moderate adverse events: perineural versus intravenous dexamethasone, Outcome 13 Headache, 10‐pound fluid gain/diarrhoea/frequent urination/ muscle soreness.
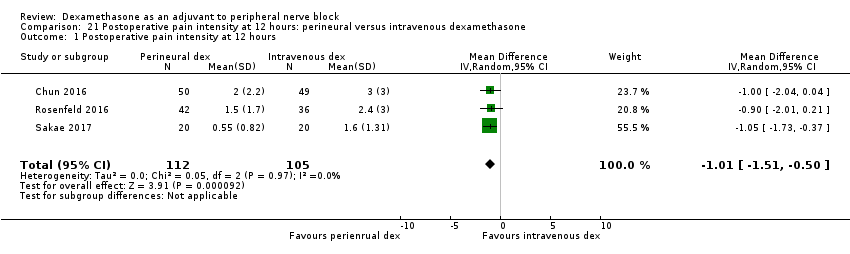
Comparison 21 Postoperative pain intensity at 12 hours: perineural versus intravenous dexamethasone, Outcome 1 Postoperative pain intensity at 12 hours.

Comparison 21 Postoperative pain intensity at 12 hours: perineural versus intravenous dexamethasone, Outcome 2 Postoperative pain intensity at 12 hours: low‐ versus high‐dose dexamethasone subgroups.
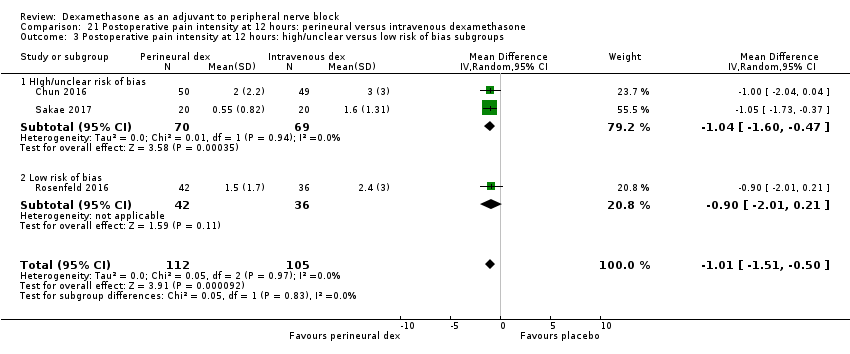
Comparison 21 Postoperative pain intensity at 12 hours: perineural versus intravenous dexamethasone, Outcome 3 Postoperative pain intensity at 12 hours: high/unclear versus low risk of bias subgroups.
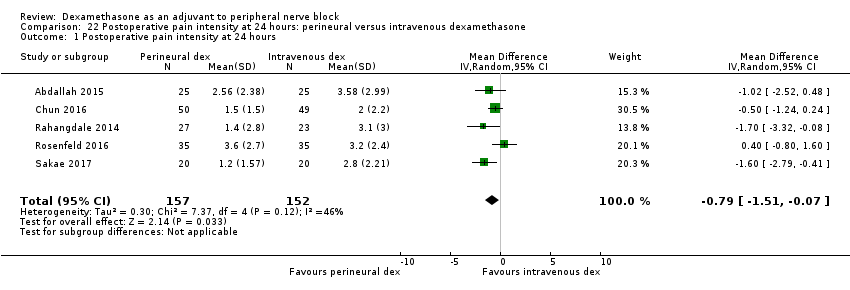
Comparison 22 Postoperative pain intensity at 24 hours: perineural versus intravenous dexamethasone, Outcome 1 Postoperative pain intensity at 24 hours.
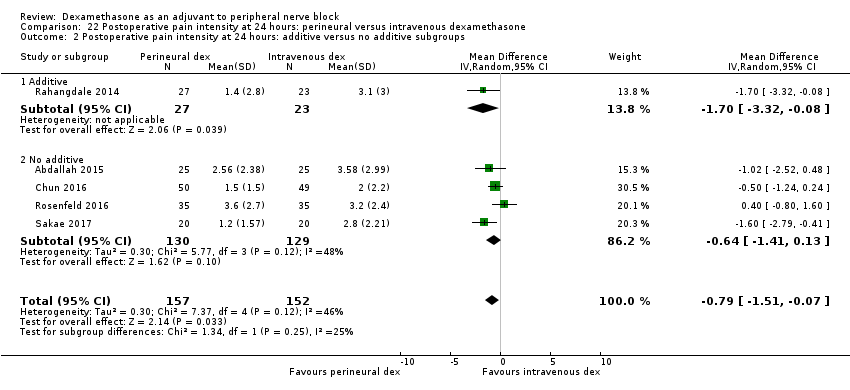
Comparison 22 Postoperative pain intensity at 24 hours: perineural versus intravenous dexamethasone, Outcome 2 Postoperative pain intensity at 24 hours: additive versus no additive subgroups.
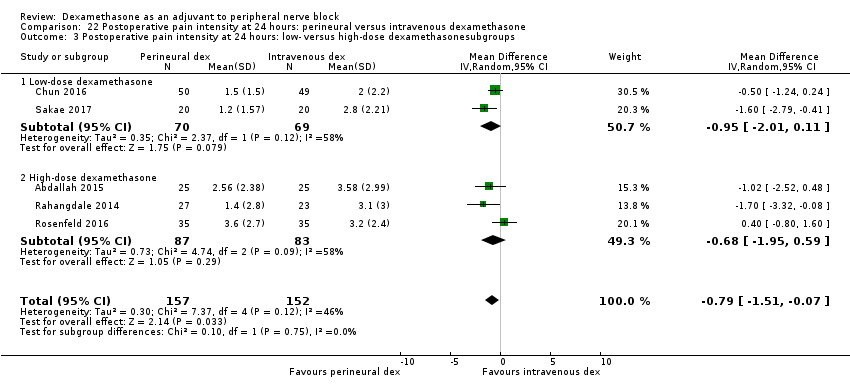
Comparison 22 Postoperative pain intensity at 24 hours: perineural versus intravenous dexamethasone, Outcome 3 Postoperative pain intensity at 24 hours: low‐ versus high‐dose dexamethasonesubgroups.

Comparison 22 Postoperative pain intensity at 24 hours: perineural versus intravenous dexamethasone, Outcome 4 Intensity of postoperative pain at 24 hours: high/unclear risk of bias versus low risk of bias subgroups.

Comparison 23 Postoperative pain intensity at 48 hours: perineural versus intravenous dexamethasone, Outcome 1 Postoperative pain intensity at 48 hours.
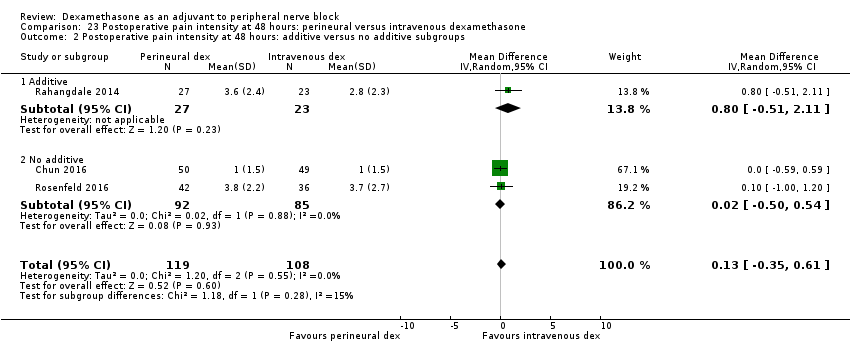
Comparison 23 Postoperative pain intensity at 48 hours: perineural versus intravenous dexamethasone, Outcome 2 Postoperative pain intensity at 48 hours: additive versus no additive subgroups.
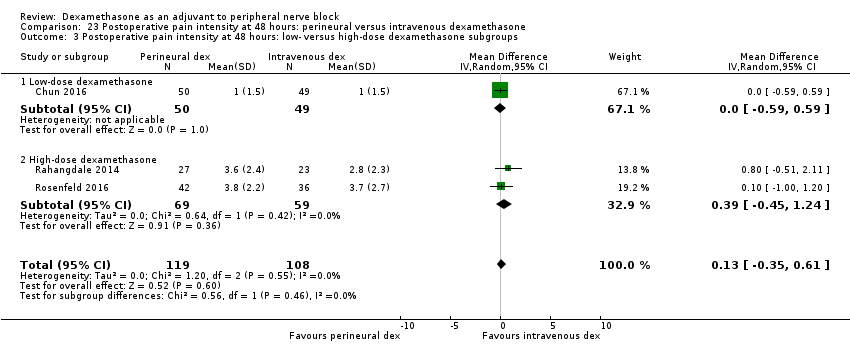
Comparison 23 Postoperative pain intensity at 48 hours: perineural versus intravenous dexamethasone, Outcome 3 Postoperative pain intensity at 48 hours: low‐ versus high‐dose dexamethasone subgroups.

Comparison 23 Postoperative pain intensity at 48 hours: perineural versus intravenous dexamethasone, Outcome 4 Postoperative pain intensity at 48 hours: high/unclear versus low risk of bias subgroups.
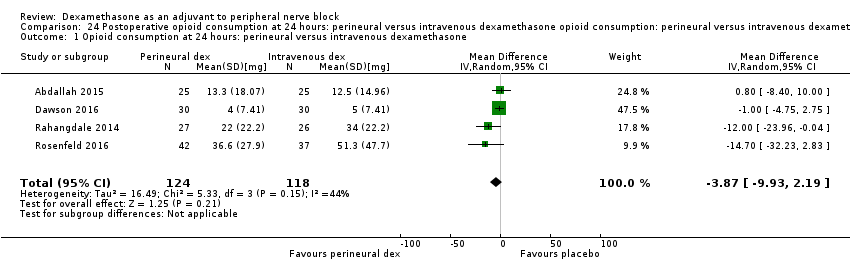
Comparison 24 Postoperative opioid consumption at 24 hours: perineural versus intravenous dexamethasone opioid consumption: perineural versus intravenous dexamethasone subgroups, Outcome 1 Opioid consumption at 24 hours: perineural versus intravenous dexamethasone.

Comparison 24 Postoperative opioid consumption at 24 hours: perineural versus intravenous dexamethasone opioid consumption: perineural versus intravenous dexamethasone subgroups, Outcome 2 24‐hour opioid consumption: additive versus no additive subgroups.

Comparison 25 Participant satisfaction with pain control: perineural versus intravenous dexamethasone, Outcome 1 Participant satisfaction with pain control.
| Patient or population: participants undergoing surgery with peripheral nerve block Intervention: perineural dexamethasone Comparison: placebo | ||||
| Outcomes | Anticipated absolute effects* (95% CI) | № of participants | Quality of the evidence | |
| Risk with placebo | Risk with perineural dexamethasone | |||
| Duration of sensory block (we included all studies describing duration of sensory block, regardless of how it was described) | The mean duration of sensory block was 10.2 hours | The mean duration of sensory block in the perineural dexamethasone group was 6.70 hours longer (5.54 longer to 7.85 longer) | 1625 | ⨁⨁◯◯ |
| Incidence of serious adverse events (we used the NIH definition of adverse events. A serious event includes death, a life‐threatening event that requires hospitalization or prolonged hospitalization, disability or congenital anomaly) | In seven studies, authors reported that they assessed for serious adverse events. Five serious adverse events were reported in three studies: one block‐related adverse event (pneumothorax) occurred in one participant in a trial comparing perineural dexamethasone and placebo; however, group allocation was not reported. The remaining non‐block‐related events occurred in two trials comparing perineural dexamethasone, intravenous dexamethasone and placebo. Two participants in the placebo group required hospitalization within one week of surgery; one for a fall, and one for a bowel infection. One participant in the placebo group developed Complex Regional Pain Syndrome Type I and one in the intravenous dexamethasone group developed pneumonia. | 620 (7 RCTs) | ⨁◯◯◯ LOWb | |
| Postoperative pain intensity at 12 hours (assessed by pain scores on an 11‐point VAS) | The mean postoperative pain intensity at 12 hours was 3.0 | The mean postoperative pain score at 12 hours in the perineural dexamethasone group was 2.08 points lower (1.52 lower to 2.63 lower) | 257 | ⨁◯◯◯ LOWc |
| Postoperative pain intensity at 24 hours. (assessed by pain scores on an 11‐point VAS) | The mean postoperative pain intensity at 24 hours was 3.9 | The mean postoperative pain score at 24 hours in the perineural dexamethasone group was 1.63 points lower (0.93 lower to 2.34 lower) | 469 | ⨁⨁◯◯ |
| Postoperative pain intensity at 48 hours (assessed by pain scores on an 11‐point VAS) | The mean postoperative pain intensity at 48 hours was 3.3 | The mean postoperative pain score at 48 hours in the perineural dexamethasone group was 0.61 points lower (1.24 lower to 0.03 higher) | 296 | ⨁⨁◯◯ |
| *The risk in the intervention group (and its 95% confidence interval) is based on the assumed risk in the comparison group and the relative effect of the intervention (and its 95% CI). | ||||
| GRADE Working Group grades of evidence | ||||
| aDowngraded by one level for risk of bias as 19 out of 27 studies are at unclear risk of bias. Reasons include lack of reporting on random sequence generation, concealment allocation, blinding, and attrition bias. Downgraded by one level for inconsistency (I2 = 99%, P value for heterogeneity is < 0.00001) and heterogeneity is not explained by subgroup analyses; point estimates vary widely among studies, confidence intervals show minimal overlap). bDowngraded by one level for risk of bias as four out of the seven studies are at unclear risk of bias. Reasons include lack of reporting on random sequence generation, concealment allocation, blinding, and evidence of selective reporting bias. Downgraded by two levels for imprecision due to very low number of events. c Downgraded by one level for risk of bias. Three out of five studies are at unclear risk of bias. Reasons include lack of reporting on random sequence generation and allocation concealment and evidence of attrition bias, selective reporting bias, and stopping early for benefit. Downgraded by one level for inconsistency (I2 = 61%, P value for heterogeneity is 0.03) and heterogeneity is not explained by subgroup analyses; point estimates vary widely among studies, confidence intervals show minimal overlap dDowngraded by one level for inconsistency (I2 = 80%, P value for heterogeneity is < 0.00001) and heterogeneity is not explained by subgroup analyses; point estimates vary widely across studies. Downgraded by one level for imprecision (95% confidence interval includes no clinical effect and a clinical effect). By no clinical effect we mean the lower bound of the CI did not surpass our chosen MID threshold of 1.2 on VAS. e Downgraded by two levels for imprecision because of a sparse number of participants (n=296) and a very wide confidence interval demonstrating that the treatment effect is not statistically significant and of questionable clinical significance. | ||||
| Patient or population: participants undergoing surgery with peripheral nerve block Intervention: intravenous dexamethasone Comparison: placebo | ||||
| Outcomes | Anticipated absolute effects* (95% CI) | № of participants | Quality of the evidence | |
| Risk with placebo | Risk with intravenous dexamethasone | |||
| Duration of sensory block (we included all studies describing duration of sensory block regardless of how it was described) | The mean duration of sensory block was 16.1 hours | The mean duration of sensory block in the intravenous dexamethasone group was 6.21 hours longer (3.53 longer to 8.88 longer) | 499 | ⨁⨁⨁◯ |
| Incidence of serious adverse events (we used the NIH definition of adverse events. A serious event includes death, a life‐threatening event that requires hospitalization or prolonged hospitalization, disability or congenital anomaly) | Please see incidence of serious adverse events in the perineural dexamethasone versus placebo 'Summary of findings' table. | |||
| Postoperative pain intensity at 12 hours (measured using pain scores on an 11‐point VAS) | The mean postoperative pain score at 12 hours was 2.6 | The mean postoperative pain score at 12 hours in the intravenous dexamethasone group was 1.24 points lower (2.44 lower to 0.04 lower) | 162 | ⨁⨁◯◯ |
| Postoperative pain intensity at 24 hours | The mean postoperative pain score at 24 hours was 4.4 | The mean postoperative pain score at 24 hours in the intravenous dexamethasone group was 1.26 points lower (2.23 lower to 0.29 lower) | 257 | ⨁⨁◯◯ |
| Postoperative pain intensity at 48 hours (measured using pain scores on an 11‐point VAS) | The mean postoperative pain score at 48 hours was 3.7 | The mean postoperative pain score at 48 hours in the intravenous dexamethasone group was 0.21 points lower (0.83 lower to 0.41 higher) | 172 | ⨁⨁◯◯ |
| *The risk in the intervention group (and its 95% confidence interval) is based on the assumed risk in the comparison group and the relative effect of the intervention (and its 95% CI). | ||||
| GRADE Working Group grades of evidence | ||||
| aDowngraded by one level for inconsistency (considerable heterogeneity (I2 = 88% and P value for heterogeneity <0.0001) and subgroup analyses did not explain observed heterogeneity. Downgraded by one level for imprecision because of a sparse number of participants (n=162). bDowngraded by one level for inconsistency (I2 = 61% and P value for heterogeneity 0.08) and subgroup analyses did not explain observed heterogeneity. Downgraded by one level for imprecision. Confidence interval includes both no clinical effect (minimally important difference 1.2 on VAS) and clinical effect (minimally important difference greater than 1.2 on VAS). cDowngraded by one level for inconsistency(I2 = 65% and P value for heterogeneity 0.02) and subgroup analyses did not explain observed heterogeneity. Point estimates vary widely across studies. Downgraded by one level for imprecision (95% confidence interval includes no clinical effect and a clinical effect). By no clinical effect we mean the lower bound of the CI did not surpass our chosen MID threshold of 1.2 on VAS. dDowngraded by two levels for precision (small sample size (n=172) and confidence interval crosses the line of null effect).. | ||||
| Patient or population: peripheral nerve block Setting: people undergoing upper or lower limb surgery with peripheral nerve block in hospitals in Australia, Belgium, Brazil, Canada and USA Intervention: perineural dexamethasone Comparison: intravenous dexamethasone | ||||
| Outcomes | Anticipated absolute effects* (95% CI) | № of participants | Quality of the evidence | |
| Risk with intravenous dexamethasone | Risk with perineural dexamethasone | |||
| Duration of sensory block (we included all studies describing duration of sensory block regardless of how it was described) | The mean duration of sensory block was 20.6 hours | The mean duration of sensory block in the perineural dexamethasone group was 3.13 hours longer (1.68 longer to 4.58 longer) | 720 | ⨁⨁⨁◯ |
| Incidence of serious adverse events (we used the NIH definition of adverse events. A serious event includes death, a life‐threatening event that requires hospitalization or prolonged hospitalization, disability or congenital anomaly) | Please see incidence of serious adverse events in the perineural dexamethasone versus placebo 'Summary of findings' table. | |||
| Postoperative pain intensity at 12 hours (measured using pain scores on an 11‐point VAS) | The mean postoperative pain score at 12 hours was 2.3 | The mean postoperative pain score at 12 hours in the perineural dexamethasone group was 1.01 points lower (0.50 lower to 1.51 lower) | 217 | ⨁⨁◯◯ |
| Postoperative pain intensity at 24 hours (measured using pain scores on an 11‐point VAS) | The mean postoperative pain score at 24 hours was 2.9 | The mean postoperative pain score at 24 hours in the perineural dexamethasone group was 0.77 points lower (0.08 lower to 1.47 lower) | 309 | ⨁⨁⨁◯ |
| Postoperative pain intensity at 48 hours (measured using pain scores on an 11‐point VAS) | The mean postoperative pain score at 48 hours was 2.8 | The mean postoperative pain score at 48 hours in the perineural dexamethasone group was 0.13 points higher (0.35 lower to 0.61 higher) | 227 | ⨁⨁◯◯ |
| *The risk in the intervention group (and its 95% confidence interval) is based on the assumed risk in the comparison group and the relative effect of the intervention (and its 95% CI). | ||||
| GRADE Working Group grades of evidence | ||||
| aDowngraded by one level for inconsistency (I2 = 67% and P value for heterogeneity is 0.001). bDowngraded by one level for risk of bias. Two out of the three studies are at unclear risk of bias. Reasons include unclear random sequence generation, unclear allocation concealment, and selective outcome reporting. Downgraded by one level for imprecision because of a sparse number of participants (n=217) and because the 95% confidence interval includes no clinical effect and a clinical effect. By no clinical effect we mean the lower bound of the CI did not surpass our chosen MID threshold of 1.2 on VAS. cDowngraded by one level for imprecision (95% confidence interval includes no clinical effect and a clinical effect). By no clinical effect we mean the lower bound of the CI did not surpass our chosen MID threshold of 1.2 on VAS. dDowngraded by one level for risk of bias. The one study that is at unclear risk of bias contributes half the data for this outcome. Downgraded by one level for imprecision because of a small sample size (n=227). | ||||
| Outcome or subgroup title | No. of studies | No. of participants | Statistical method | Effect size |
| 1 Duration of sensory block Show forest plot | 27 | 1625 | Mean Difference (IV, Random, 95% CI) | 6.70 [5.54, 7.85] |
| 2 Duration of sensory block: long‐ versus medium‐acting local anaesthetic subgroups Show forest plot | 26 | 1572 | Mean Difference (IV, Random, 95% CI) | 6.78 [5.62, 7.94] |
| 2.1 Long‐acting local anaesthetic | 20 | 1315 | Mean Difference (IV, Random, 95% CI) | 7.81 [6.40, 9.21] |
| 2.2 Medium‐acting local anaesthetic | 6 | 257 | Mean Difference (IV, Random, 95% CI) | 3.98 [1.76, 6.20] |
| 3 Duration of sensory block: additive versus no additive subgroups Show forest plot | 27 | 1625 | Mean Difference (IV, Random, 95% CI) | 6.70 [5.54, 7.85] |
| 3.1 Additives | 6 | 336 | Mean Difference (IV, Random, 95% CI) | 7.29 [3.77, 10.81] |
| 3.2 No additives | 21 | 1289 | Mean Difference (IV, Random, 95% CI) | 6.60 [5.30, 7.89] |
| 4 Duration of sensory block: high‐ versus low‐dose dexamethasone subgroups Show forest plot | 27 | 1627 | Mean Difference (IV, Random, 95% CI) | 6.70 [5.53, 7.86] |
| 4.1 High‐dose dexamethasone | 23 | 1447 | Mean Difference (IV, Random, 95% CI) | 7.09 [5.81, 8.38] |
| 4.2 Low‐dose dexamethasone | 4 | 180 | Mean Difference (IV, Random, 95% CI) | 4.32 [1.80, 6.85] |
| 5 Duration of sensory block: high/unclear versus low risk of bias subgroups Show forest plot | 26 | 1625 | Mean Difference (IV, Random, 95% CI) | 6.70 [5.54, 7.85] |
| 5.1 High or unclear risk of bias | 19 | 1037 | Mean Difference (IV, Random, 95% CI) | 6.28 [5.01, 7.56] |
| 5.2 Low risk of bias | 8 | 588 | Mean Difference (IV, Random, 95% CI) | 8.21 [4.56, 11.85] |
| Outcome or subgroup title | No. of studies | No. of participants | Statistical method | Effect size |
| 1 Duration of motor block Show forest plot | 16 | 912 | Mean Difference (IV, Random, 95% CI) | 5.87 [4.44, 7.30] |
| 2 Duration of motor block: long‐ versus medium‐acting local anaesthetic subgroups Show forest plot | 16 | 912 | Mean Difference (IV, Random, 95% CI) | 5.87 [4.44, 7.30] |
| 2.1 Long‐acting local anaesthetic | 13 | 764 | Mean Difference (IV, Random, 95% CI) | 6.61 [4.58, 8.65] |
| 2.2 Medium‐acting local anaesthetic | 3 | 148 | Mean Difference (IV, Random, 95% CI) | 2.59 [2.42, 2.76] |
| 3 Duration of motor block: additives verus no additives subgroups Show forest plot | 16 | 912 | Mean Difference (IV, Random, 95% CI) | 5.87 [4.44, 7.30] |
| 3.1 Additives | 5 | 280 | Mean Difference (IV, Random, 95% CI) | 7.47 [3.58, 11.36] |
| 3.2 No additives | 11 | 632 | Mean Difference (IV, Random, 95% CI) | 5.26 [3.17, 7.35] |
| 4 Duration of motor block: high‐ versus low‐dose dexamethasone subgroups Show forest plot | 16 | 912 | Mean Difference (IV, Random, 95% CI) | 5.87 [4.44, 7.30] |
| 4.1 High‐dose dexamethasone | 15 | 872 | Mean Difference (IV, Random, 95% CI) | 5.75 [4.29, 7.22] |
| 4.2 Low‐dose dexamethasone | 1 | 40 | Mean Difference (IV, Random, 95% CI) | 8.1 [4.69, 11.51] |
| 5 Duration of motor block: high/unclear versus low risk of bias subgroups Show forest plot | 16 | 912 | Mean Difference (IV, Random, 95% CI) | 5.87 [4.44, 7.30] |
| 5.1 High/unclear risk of bias | 14 | 809 | Mean Difference (IV, Random, 95% CI) | 5.67 [4.18, 7.16] |
| 5.2 Low risk of bias | 2 | 103 | Mean Difference (IV, Random, 95% CI) | 7.93 [2.74, 13.13] |
| Outcome or subgroup title | No. of studies | No. of participants | Statistical method | Effect size |
| 1 Overall incidence of block‐related adverse events Show forest plot | 10 | 677 | Risk Ratio (M‐H, Random, 95% CI) | 1.17 [0.99, 1.39] |
| 2 Numbness/tingling 14 days after surgery Show forest plot | 5 | 323 | Risk Ratio (M‐H, Random, 95% CI) | 1.76 [0.80, 3.89] |
| 3 Residual motor block/weakness 24 hours after surgery Show forest plot | 3 | 259 | Risk Ratio (M‐H, Random, 95% CI) | 4.69 [0.57, 38.68] |
| 4 Horner Syndrome Show forest plot | 4 | 321 | Risk Ratio (M‐H, Random, 95% CI) | 0.99 [0.73, 1.36] |
| 5 Hoarseness Show forest plot | 4 | 353 | Risk Ratio (M‐H, Random, 95% CI) | 1.23 [0.65, 2.34] |
| 6 Diaphragmatic paresis Show forest plot | 2 | 172 | Risk Ratio (M‐H, Random, 95% CI) | 1.46 [0.66, 3.23] |
| 7 Dyspnoea Show forest plot | 4 | 274 | Risk Ratio (M‐H, Random, 95% CI) | 0.34 [0.01, 8.14] |
| 8 Vascular injury Show forest plot | 1 | 100 | Risk Ratio (M‐H, Random, 95% CI) | 2.0 [0.19, 21.36] |
| 9 Cranial nerve 12 palsy Show forest plot | 1 | 83 | Risk Ratio (M‐H, Random, 95% CI) | 0.33 [0.01, 7.77] |
| 10 Bruising Show forest plot | 1 | 37 | Risk Ratio (M‐H, Random, 95% CI) | 1.06 [0.07, 15.64] |
| 11 Overall non‐block‐related adverse events Show forest plot | 10 | 625 | Risk Ratio (M‐H, Random, 95% CI) | 0.76 [0.35, 1.68] |
| 12 Postoperative nausea and vomiting Show forest plot | 10 | 585 | Risk Ratio (M‐H, Random, 95% CI) | 0.55 [0.26, 1.14] |
| 13 Deep sedation Show forest plot | 1 | 60 | Risk Ratio (M‐H, Random, 95% CI) | 7.0 [0.38, 129.93] |
| 14 Dermatological symptoms (pruritus/rash) Show forest plot | 1 | 83 | Risk Ratio (M‐H, Random, 95% CI) | 2.93 [0.32, 27.02] |
| 15 Syncope/fainting Show forest plot | 1 | 83 | Risk Ratio (M‐H, Random, 95% CI) | 1.95 [0.18, 20.71] |
| 16 Bradycardia Show forest plot | 1 | 60 | Risk Ratio (M‐H, Random, 95% CI) | 0.67 [0.12, 3.71] |
| 17 Hypotension Show forest plot | 2 | 140 | Risk Ratio (M‐H, Random, 95% CI) | 0.67 [0.21, 2.13] |
| 18 Headache/10‐pound fluid gain/diarrhoea/frequent urination/muscle soreness Show forest plot | 1 | 83 | Risk Ratio (M‐H, Random, 95% CI) | 2.93 [0.12, 69.92] |
| Outcome or subgroup title | No. of studies | No. of participants | Statistical method | Effect size |
| 1 Postoperative pain intensity at12 hours Show forest plot | 5 | 257 | Mean Difference (IV, Random, 95% CI) | ‐2.08 [‐2.63, ‐1.52] |
| 2 Postoperative pain intensity at 12 hours: medium‐ versus long‐acting local anaesthetic subgroups Show forest plot | 5 | 257 | Mean Difference (IV, Random, 95% CI) | ‐2.08 [‐2.63, ‐1.53] |
| 2.1 Long‐acting local anaesthesia | 4 | 234 | Mean Difference (IV, Random, 95% CI) | ‐2.21 [‐2.77, ‐1.66] |
| 2.2 Medium‐acting local anaesthesia | 1 | 23 | Mean Difference (IV, Random, 95% CI) | ‐1.22 [‐2.38, ‐0.06] |
| 3 Postoperative pain intensity at 12 hours: additive versus no additive subgroups Show forest plot | 5 | 257 | Mean Difference (IV, Random, 95% CI) | ‐2.08 [‐2.63, ‐1.52] |
| 3.1 Additives | 1 | 23 | Mean Difference (IV, Random, 95% CI) | ‐1.20 [‐2.36, ‐0.04] |
| 3.2 No additives | 4 | 234 | Mean Difference (IV, Random, 95% CI) | ‐2.21 [‐2.77, ‐1.66] |
| 4 Postoperative pain intensity at 12 hours: high‐ versus low‐dose dexamethasone subgroups Show forest plot | 5 | 257 | Mean Difference (IV, Random, 95% CI) | ‐2.08 [‐2.63, ‐1.52] |
| 4.1 High‐dose dexamethasone | 3 | 177 | Mean Difference (IV, Random, 95% CI) | ‐2.17 [‐3.29, ‐1.06] |
| 4.2 Low‐dose dexamethasone | 2 | 80 | Mean Difference (IV, Random, 95% CI) | ‐1.99 [‐2.75, ‐1.22] |
| 5 Postoperative pain intensity at 12 hours: high/unclear versus low risk of bias subgroups Show forest plot | 5 | 257 | Mean Difference (IV, Random, 95% CI) | ‐2.08 [‐2.63, ‐1.52] |
| 5.1 High/unclear versus low risk of bias | 3 | 103 | Mean Difference (IV, Random, 95% CI) | ‐1.81 [‐2.53, ‐1.09] |
| 5.2 Low risk of bias | 2 | 154 | Mean Difference (IV, Random, 95% CI) | ‐2.61 [‐3.88, ‐1.34] |
| Outcome or subgroup title | No. of studies | No. of participants | Statistical method | Effect size |
| 1 Postoperative pain intensity at 24 hours Show forest plot | 9 | 469 | Mean Difference (IV, Random, 95% CI) | ‐1.63 [‐2.34, ‐0.93] |
| 2 Postoperative pain intensity at 24 hours: long‐ versus medium‐acting local anaesthetic subgroups Show forest plot | 9 | 469 | Mean Difference (IV, Random, 95% CI) | ‐1.63 [‐2.34, ‐0.93] |
| 2.1 Long‐acting local anaesthesia | 7 | 409 | Mean Difference (IV, Random, 95% CI) | ‐1.75 [‐2.60, ‐0.90] |
| 2.2 Medium‐acting local anaesthesia | 2 | 60 | Mean Difference (IV, Random, 95% CI) | ‐1.08 [‐2.07, ‐0.09] |
| 3 Postoperative pain intensity at 24 hours: additive versus no additive subgroups Show forest plot | 9 | 469 | Mean Difference (IV, Random, 95% CI) | ‐1.63 [‐2.34, ‐0.93] |
| 3.1 Additives | 3 | 158 | Mean Difference (IV, Random, 95% CI) | ‐2.13 [‐3.43, ‐0.82] |
| 3.2 No additives | 6 | 311 | Mean Difference (IV, Random, 95% CI) | ‐1.41 [‐2.31, ‐0.51] |
| 4 Postoperative pain intensity at 24 hours: high‐ versus low‐dose dexamethasone subgroups Show forest plot | 9 | 469 | Mean Difference (IV, Random, 95% CI) | ‐1.63 [‐2.34, ‐0.93] |
| 4.1 High‐dose dexamethasone | 7 | 389 | Mean Difference (IV, Random, 95% CI) | ‐1.59 [‐2.71, ‐0.47] |
| 4.2 Low‐dose dexamethasone | 2 | 80 | Mean Difference (IV, Random, 95% CI) | ‐1.87 [‐3.21, ‐0.52] |
| 5 Postoperative pain intensity at 24 hours: high/unclear versus low risk of bias subgroups Show forest plot | 9 | 469 | Mean Difference (IV, Random, 95% CI) | ‐1.63 [‐2.34, ‐0.93] |
| 5.1 High/unclear risk of bias | 4 | 185 | Mean Difference (IV, Random, 95% CI) | ‐1.90 [‐2.79, ‐1.00] |
| 5.2 Low risk of bias | 5 | 284 | Mean Difference (IV, Random, 95% CI) | ‐1.43 [‐2.91, 0.04] |
| Outcome or subgroup title | No. of studies | No. of participants | Statistical method | Effect size |
| 1 Postoperative pain intensity at 48 hours Show forest plot | 4 | 296 | Mean Difference (IV, Random, 95% CI) | ‐0.61 [‐1.24, 0.03] |
| 2 Postoperative pain intensity at 48 hours: additives versus no additives subgroups Show forest plot | 4 | 296 | Mean Difference (IV, Random, 95% CI) | ‐0.61 [‐1.24, 0.03] |
| 2.1 No additives | 2 | 155 | Mean Difference (IV, Random, 95% CI) | ‐0.86 [‐1.36, ‐0.36] |
| 2.2 Additives | 2 | 141 | Mean Difference (IV, Random, 95% CI) | ‐0.23 [‐1.80, 1.34] |
| 3 Postoperative pain intensity at 48 hours: high/unclear versus low risk of bias subgroups Show forest plot | 4 | 296 | Mean Difference (IV, Random, 95% CI) | ‐0.61 [‐1.24, 0.03] |
| 3.1 High/unclear risk of bias | 1 | 88 | Mean Difference (IV, Random, 95% CI) | ‐1.0 [‐2.24, 0.24] |
| 3.2 Low risk of bias | 3 | 208 | Mean Difference (IV, Random, 95% CI) | ‐0.45 [‐1.30, 0.40] |
| Outcome or subgroup title | No. of studies | No. of participants | Statistical method | Effect size |
| 1 Postoperative opioid consumption at 24 hours Show forest plot | 6 | 380 | Mean Difference (IV, Random, 95% CI) | ‐19.25 [‐32.51, ‐5.99] |
| 2 Opioid consumption at 24 hours medium‐ versus long‐acting local anaesthetic subgroups Show forest plot | 6 | 380 | Mean Difference (IV, Random, 95% CI) | ‐19.25 [‐32.51, ‐5.99] |
| 2.1 Long‐acting local anaesthetic | 5 | 335 | Mean Difference (IV, Random, 95% CI) | ‐21.22 [‐35.20, ‐7.25] |
| 2.2 Medium‐acting local anaesthetic | 1 | 45 | Mean Difference (IV, Random, 95% CI) | 4.0 [‐33.91, 41.91] |
| 3 Opioid consumption at 24 hours: additive versus no additive subgroups Show forest plot | 6 | 380 | Mean Difference (IV, Random, 95% CI) | ‐19.25 [‐32.51, ‐5.99] |
| 3.1 Additives | 2 | 142 | Mean Difference (IV, Random, 95% CI) | ‐30.17 [‐58.58, ‐1.76] |
| 3.2 No additives | 4 | 238 | Mean Difference (IV, Random, 95% CI) | ‐12.98 [‐26.28, 0.32] |
| 4 Opioid consumption at 24 hours: high/unclear versus low risk of bias subgroups Show forest plot | 6 | 380 | Mean Difference (IV, Random, 95% CI) | ‐19.25 [‐32.51, ‐5.99] |
| 4.1 High/unclear risk of bias | 1 | 88 | Mean Difference (IV, Random, 95% CI) | ‐45.0 [‐57.58, ‐32.42] |
| 4.2 Low risk of bias | 5 | 292 | Mean Difference (IV, Random, 95% CI) | ‐13.55 [‐23.36, ‐3.75] |
| Outcome or subgroup title | No. of studies | No. of participants | Statistical method | Effect size |
| 1 Participant satisfaction with pain control: perineural dexamethasone versus placebo Show forest plot | 4 | 224 | Mean Difference (IV, Random, 95% CI) | 0.83 [‐0.05, 1.71] |
| Outcome or subgroup title | No. of studies | No. of participants | Statistical method | Effect size |
| 1 Duration of sensory block Show forest plot | 8 | 499 | Mean Difference (IV, Random, 95% CI) | 6.21 [3.53, 8.88] |
| 2 Duration sensory block: additive versus no additive subgroups Show forest plot | 8 | 499 | Mean Difference (IV, Random, 95% CI) | 6.21 [3.53, 8.88] |
| 2.1 Additives | 1 | 49 | Mean Difference (IV, Random, 95% CI) | 6.20 [0.68, 11.72] |
| 2.2 No additives | 7 | 450 | Mean Difference (IV, Random, 95% CI) | 6.21 [3.33, 9.08] |
| 3 Duration of sensory block: high‐ versus low‐dose dexamethasone subgroups Show forest plot | 8 | 499 | Mean Difference (IV, Random, 95% CI) | 6.21 [3.53, 8.88] |
| 3.1 High‐dose | 6 | 437 | Mean Difference (IV, Random, 95% CI) | 7.45 [5.55, 9.35] |
| 3.2 Low‐dose | 2 | 62 | Mean Difference (IV, Random, 95% CI) | 2.25 [1.21, 3.30] |
| 4 Duration of sensory block: high/unclear versus low risk of bias subgroups Show forest plot | 8 | 499 | Mean Difference (IV, Random, 95% CI) | 6.21 [3.53, 8.88] |
| 4.1 High/unclear risk of bias | 2 | 62 | Mean Difference (IV, Random, 95% CI) | 2.25 [1.21, 3.30] |
| 4.2 Low risk of bias | 6 | 437 | Mean Difference (IV, Random, 95% CI) | 7.45 [5.55, 9.35] |
| Outcome or subgroup title | No. of studies | No. of participants | Statistical method | Effect size |
| 1 Duration of motor block Show forest plot | 3 | 139 | Mean Difference (IV, Random, 95% CI) | 5.04 [3.07, 7.00] |
| 2 Duration of motor block: additive versus no additive subgroups Show forest plot | 3 | 139 | Mean Difference (IV, Random, 95% CI) | 5.54 [3.11, 7.97] |
| 2.1 Additives | 1 | 49 | Mean Difference (IV, Random, 95% CI) | 6.60 [2.32, 10.88] |
| 2.2 No additives | 2 | 90 | Mean Difference (IV, Random, 95% CI) | 3.67 [‐2.77, 10.11] |
| 3 Duration of motor block high‐ versus low‐dose dexamethasone subgroups Show forest plot | 3 | 139 | Mean Difference (IV, Random, 95% CI) | 5.04 [3.07, 7.00] |
| 3.1 High‐dose dexamethasone | 2 | 99 | Mean Difference (IV, Random, 95% CI) | 5.96 [4.03, 7.90] |
| 3.2 Low‐dose dexamethasone | 1 | 40 | Mean Difference (IV, Random, 95% CI) | 3.10 [0.23, 5.97] |
| 4 Duration of motor block: high/unclear versus low risk of bias subgroups Show forest plot | 3 | 139 | Mean Difference (IV, Random, 95% CI) | 5.04 [3.07, 7.00] |
| 4.1 High/unclear risk of bias | 2 | 99 | Mean Difference (IV, Random, 95% CI) | 5.96 [4.03, 7.90] |
| 4.2 Low risk of bias | 1 | 40 | Mean Difference (IV, Random, 95% CI) | 3.10 [0.23, 5.97] |
| Outcome or subgroup title | No. of studies | No. of participants | Statistical method | Effect size |
| 1 Overall incidence of block‐related adverse events Show forest plot | 5 | 393 | Risk Ratio (M‐H, Random, 95% CI) | 1.09 [0.69, 1.70] |
| 2 Numbness/tingling 14 days after surgery Show forest plot | 2 | 101 | Risk Ratio (M‐H, Random, 95% CI) | 1.69 [0.31, 9.26] |
| 3 Residual motor block/muscle weakness 24 hours after surgery Show forest plot | 3 | 265 | Risk Ratio (M‐H, Random, 95% CI) | 2.68 [0.80, 8.90] |
| 4 Horner syndrome Show forest plot | 2 | 214 | Risk Ratio (M‐H, Random, 95% CI) | 0.89 [0.63, 1.26] |
| 5 Hoarsenss Show forest plot | 2 | 215 | Risk Ratio (M‐H, Random, 95% CI) | 0.88 [0.45, 1.71] |
| 6 Dyspnoea Show forest plot | 3 | 219 | Risk Ratio (M‐H, Random, 95% CI) | 0.63 [0.11, 3.74] |
| 7 Cranial nerve 12 palsy Show forest plot | 1 | 78 | Risk Ratio (M‐H, Random, 95% CI) | 0.37 [0.02, 8.77] |
| 8 Overall non‐block‐related adverse events Show forest plot | 5 | 258 | Risk Ratio (M‐H, Random, 95% CI) | 1.23 [0.38, 3.97] |
| 9 Postoperative nausea and vomiting Show forest plot | 3 | 134 | Risk Ratio (M‐H, Random, 95% CI) | 0.66 [0.12, 3.78] |
| 10 Dermatological symptoms Show forest plot | 2 | 124 | Risk Ratio (M‐H, Random, 95% CI) | 1.88 [0.09, 40.62] |
| 11 Dizziness/wrist, hand or finger pain, constipation Show forest plot | 1 | 78 | Risk Ratio (M‐H, Random, 95% CI) | 0.37 [0.02, 8.77] |
| Outcome or subgroup title | No. of studies | No. of participants | Statistical method | Effect size |
| 1 Postoperative pain intensity at 12 hours Show forest plot | 3 | 162 | Mean Difference (IV, Random, 95% CI) | ‐1.24 [‐2.44, ‐0.04] |
| 2 Postoperative pain intensity at 12 hours: high‐ versus low‐dose dexamethasone subgroups Show forest plot | 3 | 162 | Mean Difference (IV, Random, 95% CI) | ‐1.24 [‐2.44, ‐0.04] |
| 2.1 High‐dose dexamethasone | 2 | 122 | Mean Difference (IV, Random, 95% CI) | ‐1.80 [‐3.16, ‐0.44] |
| 2.2 Low‐dose dexamethasone | 1 | 40 | Mean Difference (IV, Random, 95% CI) | ‐0.5 [‐1.41, 0.41] |
| 3 Postoperative pain intensity at 12 hours: high/unclear versus low risk of bias subgroups Show forest plot | 3 | 162 | Mean Difference (IV, Random, 95% CI) | ‐1.24 [‐2.44, ‐0.04] |
| 3.1 High/unclear risk of bias | 1 | 40 | Mean Difference (IV, Random, 95% CI) | ‐0.5 [‐1.41, 0.41] |
| 3.2 Low risk of bias | 2 | 122 | Mean Difference (IV, Random, 95% CI) | ‐1.80 [‐3.16, ‐0.44] |
| Outcome or subgroup title | No. of studies | No. of participants | Statistical method | Effect size |
| 1 Postoperative pain intensity at 24 hours Show forest plot | 5 | 257 | Mean Difference (IV, Random, 95% CI) | ‐1.26 [‐2.23, ‐0.29] |
| 2 Postoperative pain intensity at 24 hours: additive versus no additive subgroups Show forest plot | 5 | 257 | Mean Difference (IV, Random, 95% CI) | ‐1.26 [‐2.23, ‐0.29] |
| 2.1 Additive | 1 | 49 | Mean Difference (IV, Random, 95% CI) | ‐0.90 [‐2.75, 0.95] |
| 2.2 No additive | 4 | 208 | Mean Difference (IV, Random, 95% CI) | ‐1.33 [‐2.48, ‐0.18] |
| 3 Postoperative pain intensity at 24 hours: high‐ versus low‐dose dexamethasone subgroups Show forest plot | 5 | 257 | Mean Difference (IV, Random, 95% CI) | ‐1.26 [‐2.23, ‐0.29] |
| 3.1 High‐dose dexamethasone | 4 | 217 | Mean Difference (IV, Random, 95% CI) | ‐1.31 [‐2.54, ‐0.07] |
| 3.2 Low‐dose dexamethasone | 1 | 40 | Mean Difference (IV, Random, 95% CI) | ‐1.1 [‐2.49, 0.29] |
| 4 Postoperative pain intensity at 24 hours: high/unclear versus low risk of bias subgroups Show forest plot | 5 | 257 | Mean Difference (IV, Random, 95% CI) | ‐1.26 [‐2.23, ‐0.29] |
| 4.1 High/unclear risk of bias | 1 | 40 | Mean Difference (IV, Random, 95% CI) | ‐1.1 [‐2.49, 0.29] |
| 4.2 Low risk of bias | 4 | 217 | Mean Difference (IV, Random, 95% CI) | ‐1.31 [‐2.54, ‐0.07] |
| Outcome or subgroup title | No. of studies | No. of participants | Statistical method | Effect size |
| 1 Postoperative pain intensity at 48 hours Show forest plot | 3 | 172 | Mean Difference (IV, Random, 95% CI) | ‐0.18 [‐0.80, 0.44] |
| 2 Postoperative pain intensity at 48 hours: additive versus no additive subgroups Show forest plot | 3 | 172 | Mean Difference (IV, Random, 95% CI) | ‐0.18 [‐0.80, 0.44] |
| 2.1 Additive | 1 | 49 | Mean Difference (IV, Random, 95% CI) | ‐0.20 [‐1.60, 1.20] |
| 2.2 No additive | 2 | 123 | Mean Difference (IV, Random, 95% CI) | ‐0.17 [‐0.87, 0.52] |
| Outcome or subgroup title | No. of studies | No. of participants | Statistical method | Effect size |
| 1 24‐hour opioid consumption Show forest plot | 5 | 287 | Mean Difference (IV, Random, 95% CI) | ‐6.58 [‐10.56, ‐2.60] |
| 2 24‐hour opioid consumption: additive verus no additive subgroups Show forest plot | 5 | 287 | Mean Difference (IV, Random, 95% CI) | ‐6.58 [‐10.56, ‐2.60] |
| 2.1 Additive | 1 | 53 | Mean Difference (IV, Random, 95% CI) | ‐4.0 [‐13.33, 5.33] |
| 2.2 No additive | 4 | 234 | Mean Difference (IV, Random, 95% CI) | ‐6.93 [‐11.41, ‐2.46] |
| Outcome or subgroup title | No. of studies | No. of participants | Statistical method | Effect size |
| 1 Postoperative opioid consumption at 48 hours opioid consumption Show forest plot | 1 | 46 | Mean Difference (IV, Random, 95% CI) | ‐22.5 [‐39.85, ‐5.15] |
| Outcome or subgroup title | No. of studies | No. of participants | Statistical method | Effect size |
| 1 Participant satisfaction with pain control Show forest plot | 3 | 181 | Mean Difference (IV, Random, 95% CI) | 1.07 [‐0.08, 2.22] |
| Outcome or subgroup title | No. of studies | No. of participants | Statistical method | Effect size |
| 1 Duration of sensory block Show forest plot | 9 | 720 | Mean Difference (IV, Random, 95% CI) | 3.13 [1.68, 4.58] |
| 2 Duration of sensory block additive versus no additive subgroups Show forest plot | 9 | 720 | Mean Difference (IV, Random, 95% CI) | 3.13 [1.68, 4.58] |
| 2.1 Additive | 3 | 331 | Mean Difference (IV, Random, 95% CI) | 3.94 [2.66, 5.21] |
| 2.2 No additive | 6 | 389 | Mean Difference (IV, Random, 95% CI) | 2.67 [0.00, 5.34] |
| 3 Duration sensory block high‐dose versus low‐dose dexamethasone subgroups Show forest plot | 9 | 720 | Mean Difference (IV, Random, 95% CI) | 3.13 [1.68, 4.58] |
| 3.1 High‐dose dexamethasone | 6 | 508 | Mean Difference (IV, Random, 95% CI) | 2.35 [0.04, 4.66] |
| 3.2 Low‐dose dexamethasone | 3 | 212 | Mean Difference (IV, Random, 95% CI) | 4.14 [2.48, 5.81] |
| 4 Duration sensory block high/unclear versus low risk of bias subgroups Show forest plot | 9 | 720 | Mean Difference (IV, Random, 95% CI) | 3.13 [1.68, 4.58] |
| 4.1 High/unclear risk of bias | 3 | 162 | Mean Difference (IV, Random, 95% CI) | 4.67 [2.29, 7.04] |
| 4.2 Low risk of bias | 6 | 558 | Mean Difference (IV, Random, 95% CI) | 2.30 [0.23, 4.37] |
| Outcome or subgroup title | No. of studies | No. of participants | Statistical method | Effect size |
| 1 Duration of motor block Show forest plot | 5 | 421 | Mean Difference (IV, Random, 95% CI) | 3.13 [0.99, 5.27] |
| 2 Duration of motor block: additive versus no additive subgroups Show forest plot | 5 | 340 | Mean Difference (IV, Random, 95% CI) | 2.75 [0.32, 5.19] |
| 2.1 Additive | 1 | 50 | Mean Difference (IV, Random, 95% CI) | 4.0 [‐0.03, 8.03] |
| 2.2 No additive | 4 | 290 | Mean Difference (IV, Random, 95% CI) | 2.39 [‐0.58, 5.37] |
| 3 Duration of motor block: high‐ versus low‐dose dexamethasone subgroups Show forest plot | 5 | 421 | Mean Difference (IV, Random, 95% CI) | 3.13 [0.99, 5.27] |
| 3.1 High‐dose dexamethasone | 4 | 381 | Mean Difference (IV, Random, 95% CI) | 2.47 [‐0.25, 5.19] |
| 3.2 Low‐dose dexamethasone | 1 | 40 | Mean Difference (IV, Random, 95% CI) | 5.0 [2.53, 7.47] |
| 4 Duration of motor block: high/unclear versus low risk of bias subgroups Show forest plot | 5 | 421 | Mean Difference (IV, Random, 95% CI) | 3.13 [0.99, 5.27] |
| 4.1 HIgh/unclear risk of bias | 1 | 40 | Mean Difference (IV, Random, 95% CI) | 5.0 [2.53, 7.47] |
| 4.2 Low risk of bias | 4 | 381 | Mean Difference (IV, Random, 95% CI) | 2.47 [‐0.25, 5.19] |
| Outcome or subgroup title | No. of studies | No. of participants | Statistical method | Effect size |
| 1 Overall incidence of block‐related adverse events Show forest plot | 5 | 406 | Risk Ratio (M‐H, Random, 95% CI) | 1.20 [0.93, 1.55] |
| 2 Numbness/tingling 14 days after surgery Show forest plot | 3 | 232 | Risk Ratio (M‐H, Random, 95% CI) | 0.97 [0.27, 3.49] |
| 3 Residual motor block/weakness at 24 hours Show forest plot | 3 | 248 | Risk Ratio (M‐H, Random, 95% CI) | 1.22 [0.62, 2.37] |
| 4 Horner syndrome Show forest plot | 2 | 197 | Risk Ratio (M‐H, Random, 95% CI) | 1.2 [0.77, 1.87] |
| 5 Hoarsness Show forest plot | 2 | 197 | Risk Ratio (M‐H, Random, 95% CI) | 1.0 [0.48, 2.09] |
| 6 Cranial nerve 12 motor palsy Show forest plot | 1 | 81 | Risk Ratio (M‐H, Random, 95% CI) | 0.31 [0.01, 7.39] |
| 7 Overall incidence of non block‐related adverse events Show forest plot | 5 | 316 | Risk Ratio (M‐H, Random, 95% CI) | 1.34 [0.37, 4.78] |
| 8 Postoperative nausea and vomiting Show forest plot | 5 | 312 | Risk Ratio (M‐H, Random, 95% CI) | 0.63 [0.22, 1.80] |
| 9 Dermatologicial symptoms (pruritus/rash) Show forest plot | 1 | 79 | Risk Ratio (M‐H, Random, 95% CI) | 4.42 [0.22, 89.18] |
| 10 Syncope/fainting Show forest plot | 1 | 79 | Risk Ratio (M‐H, Fixed, 95% CI) | 4.42 [0.22, 89.18] |
| 11 Dizziness Show forest plot | 2 | 178 | Risk Ratio (M‐H, Random, 95% CI) | 0.41 [0.06, 2.72] |
| 12 Wrist, hand or finger pain Show forest plot | 1 | 79 | Risk Ratio (M‐H, Random, 95% CI) | 0.29 [0.01, 7.02] |
| 13 Headache, 10‐pound fluid gain/diarrhoea/frequent urination/ muscle soreness Show forest plot | 1 | 79 | Risk Ratio (M‐H, Random, 95% CI) | 2.65 [0.11, 63.16] |
| Outcome or subgroup title | No. of studies | No. of participants | Statistical method | Effect size |
| 1 Postoperative pain intensity at 12 hours Show forest plot | 3 | 217 | Mean Difference (IV, Random, 95% CI) | ‐1.01 [‐1.51, ‐0.50] |
| 2 Postoperative pain intensity at 12 hours: low‐ versus high‐dose dexamethasone subgroups Show forest plot | 3 | 217 | Mean Difference (IV, Random, 95% CI) | ‐1.01 [‐1.51, ‐0.50] |
| 2.1 Low‐dose dexamethasone | 2 | 139 | Mean Difference (IV, Random, 95% CI) | ‐1.04 [‐1.60, ‐0.47] |
| 2.2 High‐dose dexamethasone | 1 | 78 | Mean Difference (IV, Random, 95% CI) | ‐0.90 [‐2.01, 0.21] |
| 3 Postoperative pain intensity at 12 hours: high/unclear versus low risk of bias subgroups Show forest plot | 3 | 217 | Mean Difference (IV, Random, 95% CI) | ‐1.01 [‐1.51, ‐0.50] |
| 3.1 HIgh/unclear risk of bias | 2 | 139 | Mean Difference (IV, Random, 95% CI) | ‐1.04 [‐1.60, ‐0.47] |
| 3.2 Low risk of bias | 1 | 78 | Mean Difference (IV, Random, 95% CI) | ‐0.90 [‐2.01, 0.21] |
| Outcome or subgroup title | No. of studies | No. of participants | Statistical method | Effect size |
| 1 Postoperative pain intensity at 24 hours Show forest plot | 5 | 309 | Mean Difference (IV, Random, 95% CI) | ‐0.79 [‐1.51, ‐0.07] |
| 2 Postoperative pain intensity at 24 hours: additive versus no additive subgroups Show forest plot | 5 | 309 | Mean Difference (IV, Random, 95% CI) | ‐0.79 [‐1.51, ‐0.07] |
| 2.1 Additive | 1 | 50 | Mean Difference (IV, Random, 95% CI) | ‐1.70 [‐3.32, ‐0.08] |
| 2.2 No additive | 4 | 259 | Mean Difference (IV, Random, 95% CI) | ‐0.64 [‐1.41, 0.13] |
| 3 Postoperative pain intensity at 24 hours: low‐ versus high‐dose dexamethasonesubgroups Show forest plot | 5 | 309 | Mean Difference (IV, Random, 95% CI) | ‐0.79 [‐1.51, ‐0.07] |
| 3.1 Low‐dose dexamethasone | 2 | 139 | Mean Difference (IV, Random, 95% CI) | ‐0.95 [‐2.01, 0.11] |
| 3.2 High‐dose dexamethasone | 3 | 170 | Mean Difference (IV, Random, 95% CI) | ‐0.68 [‐1.95, 0.59] |
| 4 Intensity of postoperative pain at 24 hours: high/unclear risk of bias versus low risk of bias subgroups Show forest plot | 5 | 309 | Mean Difference (IV, Random, 95% CI) | ‐0.79 [‐1.51, ‐0.07] |
| 4.1 High/unclear risk of bias | 2 | 139 | Mean Difference (IV, Random, 95% CI) | ‐0.95 [‐2.01, 0.11] |
| 4.2 Low risk of bias | 3 | 170 | Mean Difference (IV, Random, 95% CI) | ‐0.68 [‐1.95, 0.59] |
| Outcome or subgroup title | No. of studies | No. of participants | Statistical method | Effect size |
| 1 Postoperative pain intensity at 48 hours Show forest plot | 3 | 227 | Mean Difference (IV, Random, 95% CI) | 0.13 [‐0.35, 0.61] |
| 2 Postoperative pain intensity at 48 hours: additive versus no additive subgroups Show forest plot | 3 | 227 | Mean Difference (IV, Random, 95% CI) | 0.13 [‐0.35, 0.61] |
| 2.1 Additive | 1 | 50 | Mean Difference (IV, Random, 95% CI) | 0.80 [‐0.51, 2.11] |
| 2.2 No additive | 2 | 177 | Mean Difference (IV, Random, 95% CI) | 0.02 [‐0.50, 0.54] |
| 3 Postoperative pain intensity at 48 hours: low‐ versus high‐dose dexamethasone subgroups Show forest plot | 3 | 227 | Mean Difference (IV, Random, 95% CI) | 0.13 [‐0.35, 0.61] |
| 3.1 Low‐dose dexamethasone | 1 | 99 | Mean Difference (IV, Random, 95% CI) | 0.0 [‐0.59, 0.59] |
| 3.2 High‐dose dexamethasone | 2 | 128 | Mean Difference (IV, Random, 95% CI) | 0.39 [‐0.45, 1.24] |
| 4 Postoperative pain intensity at 48 hours: high/unclear versus low risk of bias subgroups Show forest plot | 3 | 227 | Mean Difference (IV, Random, 95% CI) | 0.13 [‐0.35, 0.61] |
| 4.1 High/unclear risk of bias | 1 | 99 | Mean Difference (IV, Random, 95% CI) | 0.0 [‐0.59, 0.59] |
| 4.2 Low risk of bias | 2 | 128 | Mean Difference (IV, Random, 95% CI) | 0.39 [‐0.45, 1.24] |
| Outcome or subgroup title | No. of studies | No. of participants | Statistical method | Effect size |
| 1 Opioid consumption at 24 hours: perineural versus intravenous dexamethasone Show forest plot | 4 | 242 | Mean Difference (IV, Random, 95% CI) | ‐3.87 [‐9.93, 2.19] |
| 2 24‐hour opioid consumption: additive versus no additive subgroups Show forest plot | 4 | 242 | Mean Difference (IV, Random, 95% CI) | ‐3.87 [‐9.93, 2.19] |
| 2.1 Additive | 1 | 53 | Mean Difference (IV, Random, 95% CI) | ‐10.00 [‐23.96, ‐0.04] |
| 2.2 No additive | 3 | 189 | Mean Difference (IV, Random, 95% CI) | ‐1.56 [‐6.34, 3.22] |
| Outcome or subgroup title | No. of studies | No. of participants | Statistical method | Effect size |
| 1 Participant satisfaction with pain control Show forest plot | 3 | 181 | Mean Difference (IV, Random, 95% CI) | 0.19 [‐0.33, 0.70] |