| Study ID | Target condition(s) | Study design and participants | Prior risk | Index test details | Cutpoint | Reference standard | Comparator |
| MPSS | |
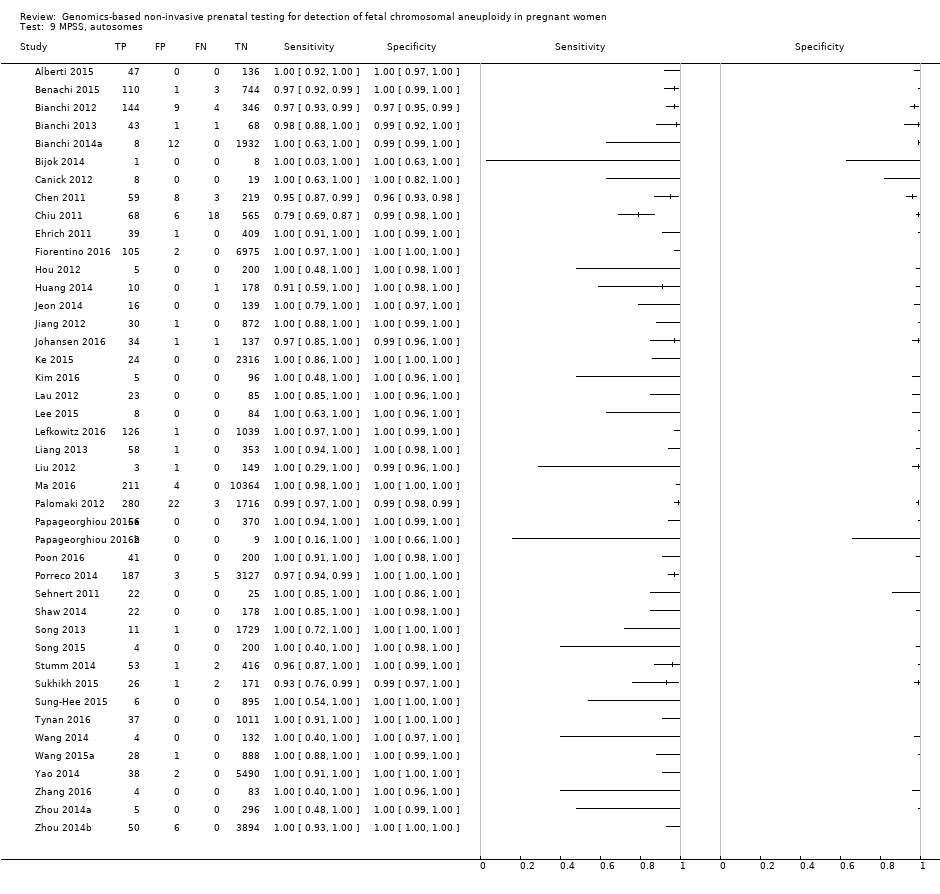
| Alberti 2015 | T21 | | High risk | | Z score of 3 | Fetal karyotypea | |
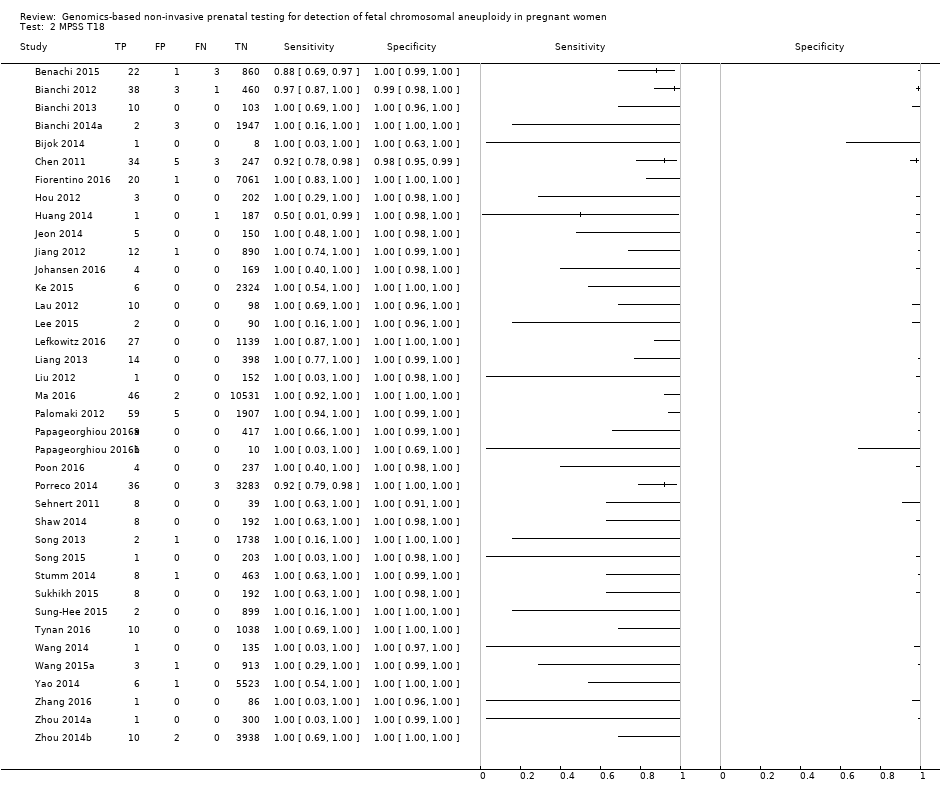
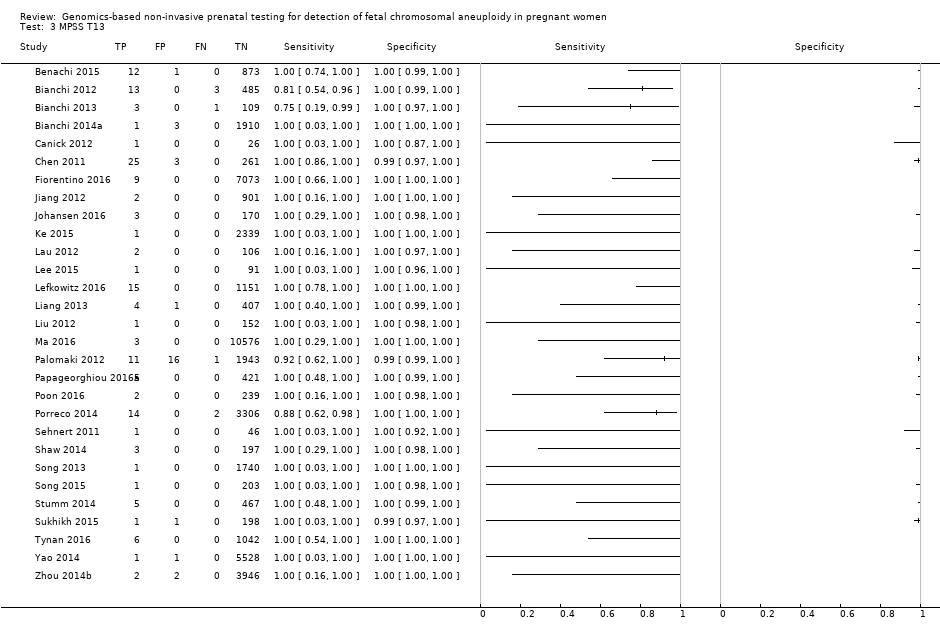
| Benachi 2015 | T21, T18, T13 | | High risk | | Z score of 3 for T21; 3.95 for T18 and T13 | Fetal karyotype or neonatal clinical examination | |
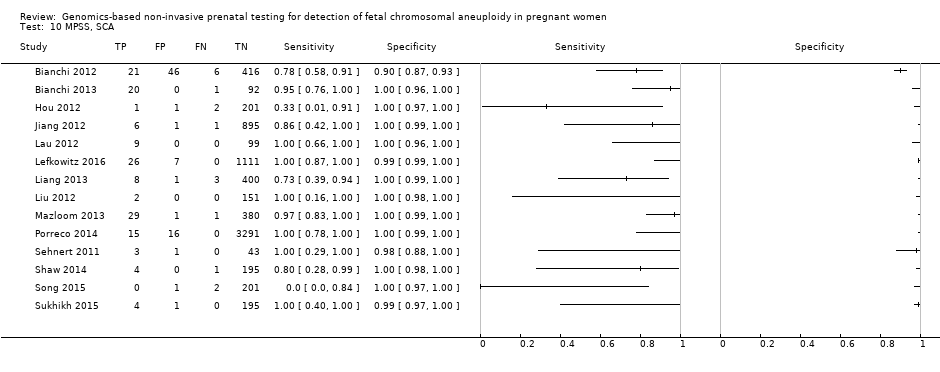
| Bianchi 2012 | T21, T18, T13, 45,X, 47,XXX, 47,XXY, 47,XYY | -
Nested case‐control study (1:4) from a prospective cohort (MELISSA) -
2882 singleton pregnancies enrolled, 503 for T21, 502 for T18, 501 for T13 and 489 for 45,X were analysed | High risk | | Different cutpoints used for autosomes and SCAb | Fetal karyotype | |
| Bianchi 2013 | T21, T18, T13, 45,X | | High risk | | Different cutpoints used for autosomes and SCAb | Fetal karyotype | |
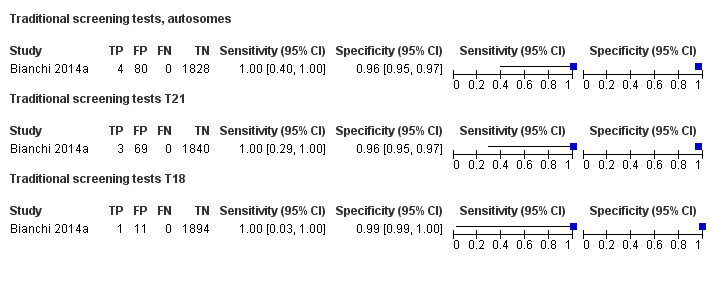
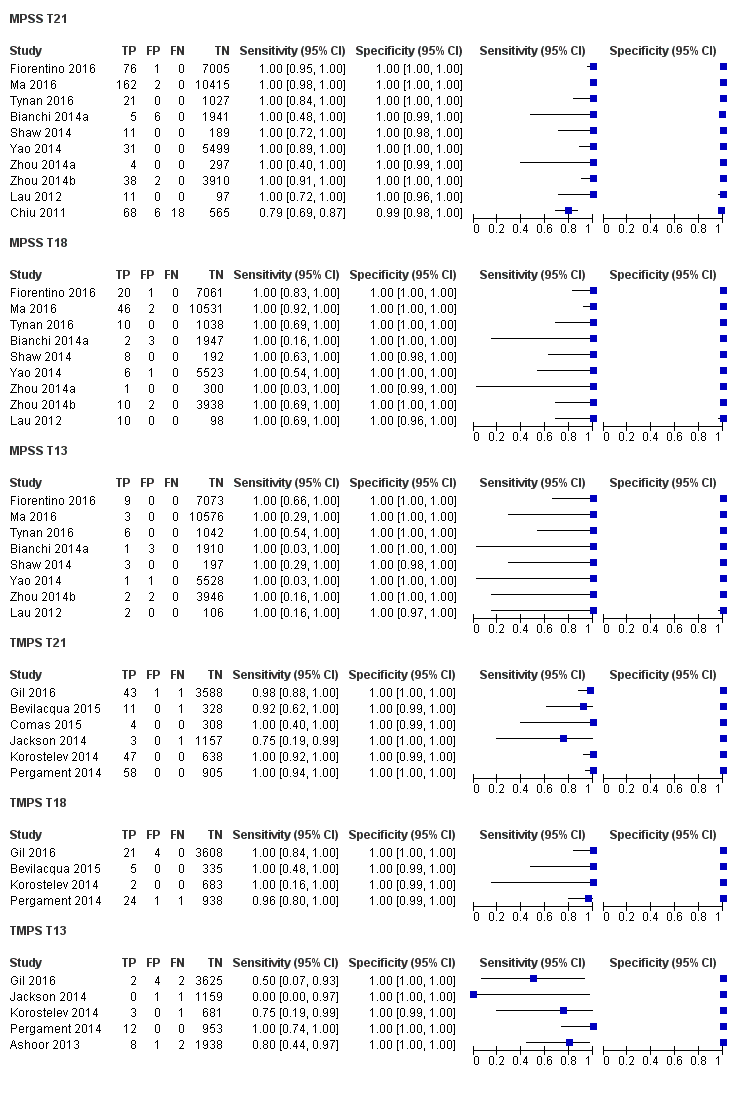
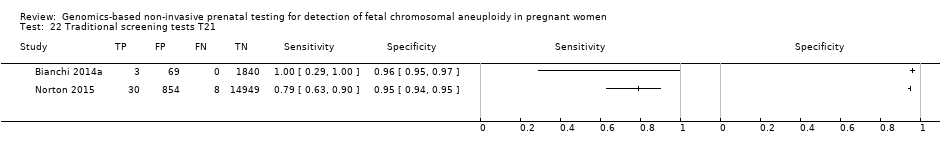
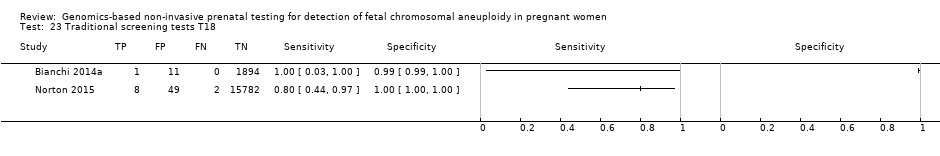
| Bianchi 2014a | T21, T18, T13 | -
Blinded prospective cohort study -
2052 singleton pregnancies enrolled, 1952 for T21 and T18, and 1914 for T13 were analysed | High, low and without prior risk | | NCV of 4; resequenced if NCV is between 3 and 4 | Fetal or postnatal karyotype, neonatal clinical examination or medical record from birth | Standard screening (T21 only with mixed cutpoints) which include first‐trimester combined test or a second‐trimester result (quadruple, serum integrated, fully integrated, or sequential). |
| Bijok 2014 | T21, T18, T13 | | High risk | -
IIIumina Genome Analyzer IIx or HiSeq 2000 sequencer in multiplex -
Commercial ‐ NIFTY™ test, BGI‐Shenzhen -
FF measured | NR | Fetal karyotype | |
| Canick 2012 | T21, T18, T13 | | High risk | | Z score of 3 | Fetal karyotype | |
| Chen 2011 | T18, T13 | -
Nested case‐control study from prospective and retrospective cohorts -
392 singleton pregnancies enrolled, 289 were analysed | High risk | | Z score of 3 | Fetal karyotype | |
| Chiu 2011 | T21 | -
Blinded case‐control study (1:5) from prospective and retrospective cohorts -
824 singleton pregnancies enrolled, 753 were analysed by 8‐plex method and 314 by 2‐plex method | Mostly high (> 1/300) and some intermediate risk (between 1/300 and 1/1000) | | Z score of 3 | Fetal karyotype | |
| Ehrich 2011 | T21 | -
Blinded case‐control study (1:11) from prospective cohort -
480 pregnant women enrolled, 449 were analysed | High risk | | Z score of 2.5 | Fetal karyotype | |
| Fiorentino 2016 | T21, T18, T13 | | Mostly high risk and without prior risk | | NCV of 4; aneuploidy suspected if NCV is between 3 and 4 | Fetal karyotype or neonatal clinical examination | |
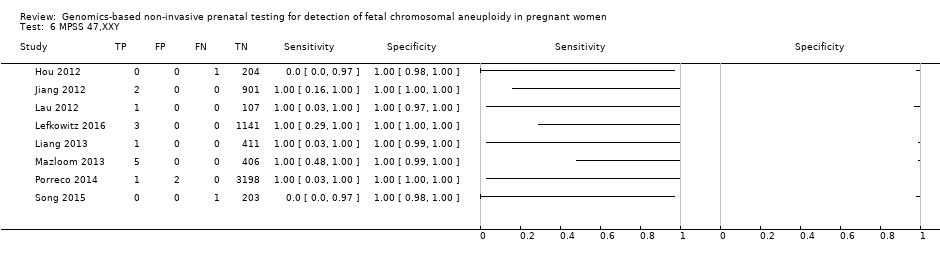
| Hou 2012 | T21, T18, T13, 45,X, 47,XXX, 47,XXY, 47,XYY | | High risk | | NR | Fetal karyotype | |
| Huang 2014 | T21, T18 | | High risk | | L score of 1 and t score of 2.5 including warning zone | Fetal karyotype | |
| Jeon 2014 | T21, T18 | | High risk | | Z score of 2.566 for T21; 2.459 for T18. | Fetal karyotype | |
| Jiang 2012 | T21, T18, T13, 45,X, 47,XXY, 47, XYY | | High risk | -
IIIumina Genome Analyzer IIx or HiSeq 2000 sequencer in multiplex -
Commercial ‐ NIFTY™ test, BGI‐Shenzhen -
FF measured | Different cutpoints used for autosomes and SCAb | Fetal karyotype | |
| Johansen 2016 | T21, T18, T13 | | High risk | | Z score of 4 (unclassified if Z score is between 3 and 4) and WISECONDOR of 1% | Fetal karyotype | |
| Ke 2015 | T21, T18, T13 | | High risk | | T score of 3 | Fetal karyotype or newborn outcome | |
| Kim 2016 | T21 | | High risk | | Z score of 2.10 for Ion Proton™ | Fetal karyotype | |
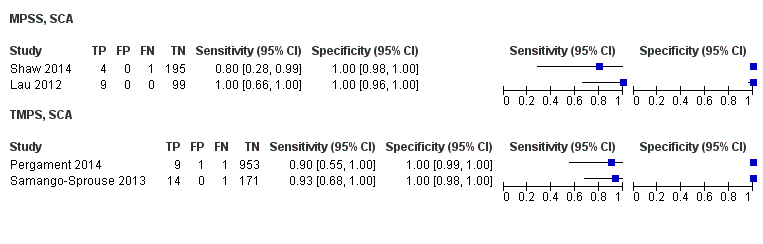
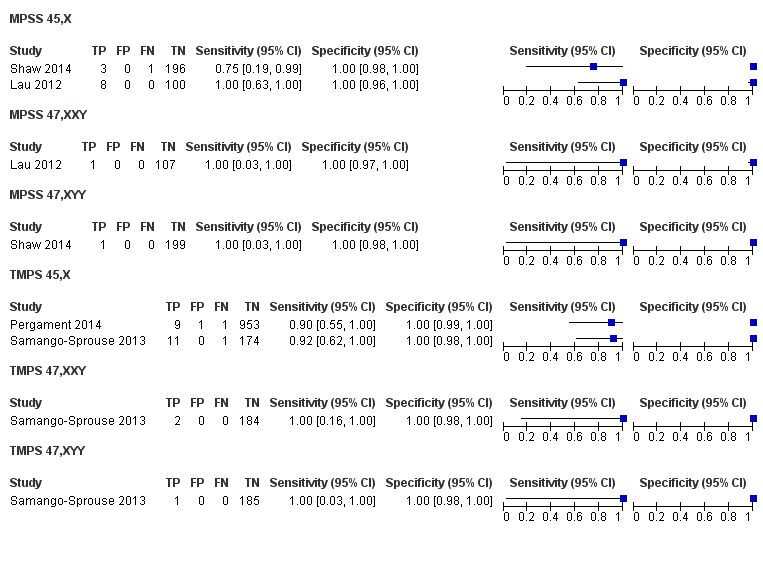
| Lau 2012 | T21, T18, T13, 45,X, 47,XXX, 47,XXY, 47,XYY | | Mostly high risk | | Different cutpoints used for autosomes and SCAb | Fetal karyotype | |
| Lee 2015 | T21, T18, T13 and SCA (no case found) | | High risk | -
Illumina MiSeq sequencer in 12‐plex or NextSeq sequencer in 96‐plex -
Commercial test ‐ MomGuard™, LabGenomics -
FF measured | Z score of 4 (intermediate risk if Z score is between 2.5 and 4) for T21 and T18; 2.8 for T13 (intermediate risk if Z score is between 1.9 and 2.8) | Fetal or neonatal karyotype | |
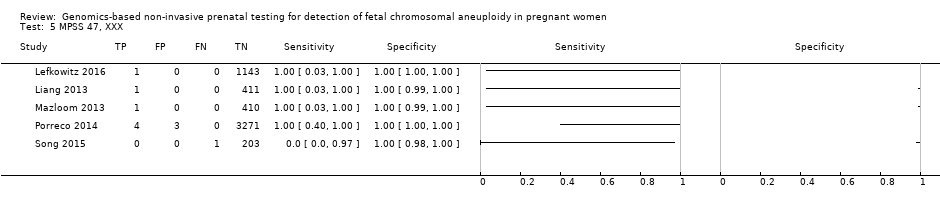
| Lefkowitz 2016 | T21, T18, T13, 45,X, 47,XXX, 47,XXY, 47,XYY | -
Retrospective cohort, blinded case‐control study -
5321 pregnant women enrolled but 1222 were selected and 1166 were analysed | High risk | | Different cutpoints used for autosomes and SCAb | Fetal karyotype | |
| Liang 2013 | T21, T18, T13, 45,X, 47,XXX, 47,XXY, 47,XYY | | High risk | | Different cutpoints used for autosomes and SCAb | Fetal karyotype | |
| Liu 2012 | T21, T18, T13, 45,X, 47,XXX, 47,XXY, 47,XYY | | High risk | | Z score of 3 | Fetal karyotype | |
| Ma 2016 | T21, T18, T13 | -
Blinded retrospective (archived samples) and prospective cohorts study -
10,598 singleton pregnancies enrolled, 10,579 were analysed | High and low risk | | Z score of 3 | Fetal karyotype or postnatal follow‐up | |
| Mazloom 2013 | 45,X, 47,XXX, 47,XXY, 47,XYY | -
Blinded prospective cohort study -
1975 singleton pregnancies enrolled, 411 samples from the validation set were analysed | High risk | -
Illumina v3 flow‐cell on a HiSeq 2000 sequencer in 12‐plex -
Laboratory test development by Sequenom, Inc. -
FF measured | Different cutpoints used for the four SCAb | Fetal karyotype | |
| Palomaki 2012 | T21, T18, T13 | | High risk | | Z score of 3 for T21; 3.88 for T18; 7.17 for T13 | Fetal karyotype | |
| Papageorghiou 2016a | T21, T18, T13 | -
Retrospective cohort, case‐control study (1:9) -
442 singleton and twin pregnancies enrolled, 426 singleton pregnancies were analysed | High risk | -
Ion Proton™ sequencer in 8‐plex -
Commercial ‐ IONA® test, Premaitha Health (public limited company in UK) -
FF measured | Likelihood ratio of 1 and maternal age‐adjusted probability risk score | Fetal karyotype or medical record from birth | |
| Papageorghiou 2016b | T21, T18, T13 | -
Retrospective cohort, case‐control study (1:9) -
442 singleton and twin pregnancies enrolled, 11 twin pregnancies were analysed | High risk | -
Ion Proton™ sequencer in 8‐plex -
Commercial ‐ IONA® test, Premaitha Health (public limited company in UK) -
FF measured | Likelihood ratio of 1 and maternal age‐adjusted probability risk score | Fetal karyotype or medical record from birth | |
| Poon 2016 | T21, T18, T13 | -
Retrospective cohort, blinded nested case‐control study -
242 singleton pregnancies enrolled, 241 were analysed | High risk | -
Ion Proton™ sequencer, IONA® software algorithm -
Commercial ‐ IONA® test, Premaitha Health (public limited company in UK) -
FF measured | NR (authors used the same gNIPT than Papageorghiou 2016a) | Fetal karyotype | |
| Porreco 2014 | T21, T18, T13, 45,X, 47,XXX, 47,XXY, 47,XYY | -
Blinded prospective cohort study -
4170 singleton pregnancies enrolled, 3322 for autosomes, 3278 for 45,X and 47,XXX and 3201 for 47,XXY and 47,XYY were analysed | High risk | | Different cutpoints used for autosomes and SCAb | Fetal karyotype or medical record from birth | |
| Sehnert 2011 | T21, T18, T13, 45,X | | High risk | | Different cutpoints used for autosomes and SCAb | Fetal karyotype | |
| Shaw 2014 | T21, T18, T13, 45,X, 47, XXX, 47,XXY, 47,XYY | | High and low risk | | Different cutpoints used for autosomes and SCAb | Fetal karyotype or medical record from birth | |
| Song 2013 | T21, T18, T13, 45,X, 47,XXX, 47, XXY, 47,XYY (SCA data not shown in this review) | | Without prior risk | | Z score of 3 | Fetal or postnatal karyotype or medical record from birth | Triple test for T21 and T18 (cutpoint of 1 in 270). |
| Song 2015 | T21, T18, T13, 45,X, 47,XXX, 47,XYY | | High risk | | Z score of 3 | Fetal karyotype or neonatal clinical examination or both | |
| Stumm 2014 | T21, T18, T13 | -
Prospective cohort, blinded study for T21 and unblinded for T18 and T13 -
522 singleton pregnancies enrolled, 472 were analysed | High risk | | MAD‐based Z score of 3 for T21; 3.2 for T18; 3.9 for T13 | Fetal karyotype | |
| Sukhikh 2015 | T21, T18, T13, 45,X | | High risk | -
Ion Proton™ sequencer -
In‐house test | T score of 5 for T21 and T18; 4 for T13; 0.04 Chrom. X and 0.04 Chrom. Y for 45,X | Fetal karyotype | |
| Sung‐Hee 2015 | T21, T18, T13, 45,X, 47,XXX, 47,XXY, 47,XYY | | High risk | -
IIIumina Genome Analyzer IIx or HiSeq 2000 sequencer in 12‐plex -
Commercial ‐ NIFTY™ test, BGI‐Shenzhen -
FF measured | L score of 1 and t score of 2.5 | Fetal karyotype or medical record from birth | |
| Tynan 2016 | T21, T18, T13 | | High and without prior risk | -
Illumina HiSeq 2000 or HiSeq 2500 sequencers in multiplex -
Commercial ‐ VisibiliT™ test, Sequenom, Inc. -
FF measured | risk score of 1% | Fetal karyotype or medical record from birth | |
| Wang 2014 | T21, T18, T13, 45,X | | High risk | | NR | Fetal or neonatal karyotype or clinical examination at 42 days after birth or both | |
| Wang 2015a | T21, T18, T13, 45,X, 47,XXX, 47,XXY, 47,XYY | | High risk | | Z score of 3 for T21, T18 and T13; ‐3 for Chrom. X and 3 for Chrom. Y for sex Chrom. classification. | Fetal karyotype or clinical follow‐up to 6 months from birth | |
| Yao 2014 | T21, T18, T13 and SCA (SCA data not shown in this review) | | High, low and without prior risk | -
IIIumina Genome Analyzer IIx or HiSeq 2000 sequencer in 12‐plex -
Commercial ‐ NIFTY™ test, BGI‐Shenzhen -
FF measured | Different cutpoints used for autosomes and SCAb | Fetal karyotype or clinical follow‐up | |
| Zhang 2016 | T21, T18, 45,X, 47,XXX (SCA data not shown in this review) | | High risk | | Z score of 3 for T21 (no other cutpoint reported) | Fetal or neonatal karyotype or neonatal clinical examination | |
| Zhou 2014a | T21, T18, T13 | | High, low and without prior risk | -
IIIumina Genome Analyzer IIx or HiSeq 2000 sequencer in 12‐plex -
Commercial ‐ NIFTY™ test, BGI‐Shenzhen -
FF measured | L score of 1 and t score of 2.5 | Fetal or neonatal karyotype or birth outcome | |
| Zhou 2014b | T21, T18, T13 | | High, low and without prior risk | -
IIIumina Genome Analyzer IIx or HiSeq 2000 sequencer in 12‐plex -
Commercial ‐ NIFTY™ test, BGI‐Shenzhen -
FF measured | L score of 1 and t score of 2.5 | Fetal or neonatal karyotype or birth outcome | |
| TMPS | |
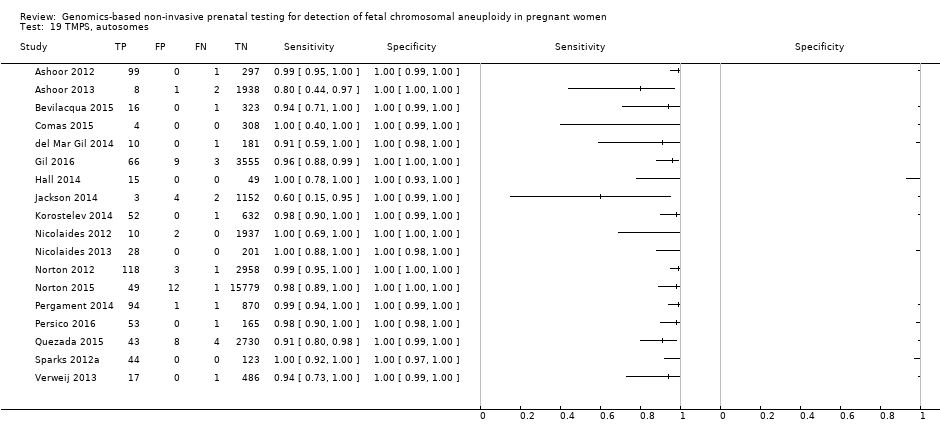
| Ashoor 2012 | T21, T18 | -
Nested case‐control study (1:3) from a prospective cohort -
400 singleton pregnancies enrolled, 397 were analysed | High risk | -
DANSR assay (FORTE algorithm), Illumina HiSeq 2000 in 96‐plex -
Commercial ‐ Harmony™ prenatal test, Ariosa Diagnostics, Inc. | NR (usually Harmony™ prenatal test uses FORTE risk score of 1%) | Fetal karyotype | |
| Ashoor 2013 | T13 | | High and low risk | -
DANSR assay (FORTE algorithm), Illumina HiSeq 2000 in 96‐plex -
Commercial ‐ Harmony™ prenatal test, Ariosa Diagnostics, Inc. -
FF measured | FORTE risk score of 1% | Fetal karyotype or neonatal clinical examination | |
| Bevilacqua 2015 | T21, T18, T13 | | High and without prior risk | -
DANSR assay (FORTE algorithm), Illumina HiSeq 2000 in 96‐plex -
Commercial ‐ Harmony™ prenatal test, Ariosa Diagnostics, Inc. -
FF measured | NR (usually Harmony™ prenatal test uses FORTE risk score of 1%) | Fetal or neonatal karyotype | |
| Comas 2015 | T21, T18, T13, 45,X, 47,XXX, 47, XXY, 47,XYY (SCA data not shown in this review) | | High and without prior risk | -
DANSR assay (FORTE algorithm) or SNP‐based method -
Commercial ‐ Panorama™ test, Natera, Inc. or Harmony™ prenatal test, Ariosa Diagnostics, Inc. -
FF measured | Harmony™ prenatal test: NR (usually Harmony™ prenatal test uses FORTE risk score of 1%)
Panorama™ test: NR | Fetal karyotype or neonatal clinical examination | |
| del Mar Gil 2014 | T21, T18, T13 | | Without prior risk | -
DANSR assay (FORTE algorithm), Illumina HiSeq 2000 in 96‐plex -
Commercial ‐ Harmony™ prenatal test, Ariosa Diagnostics, Inc. -
FF measured | NR (usually Harmony™ prenatal test uses FORTE risk score of 1%) | Fetal karyotype | |
| Gil 2016 | T21, T18, T13 | | High and intermediate riskc | -
DANSR assay (usually with FORTE algorithm) -
Commercial ‐ Harmony™ prenatal test, Ariosa Diagnostics, Inc. | NR (usually Harmony™ prenatal test uses FORTE risk score of 1%) | Fetal or postnatal karyotype or neonatal clinical examination | |
| Hall 2014 | T13 | | High risk | -
SNP‐based method (NATUS algorithm), IIIumina Genome Analyzer IIx or HiSeq sequencer, 11,000 or 19,488‐plex targeted PCR -
Commercial ‐ Natera's prenatal test -
FF measured | NR | Fetal karyotype or genetic testing of cord blood, buccal, saliva or products of conception | |
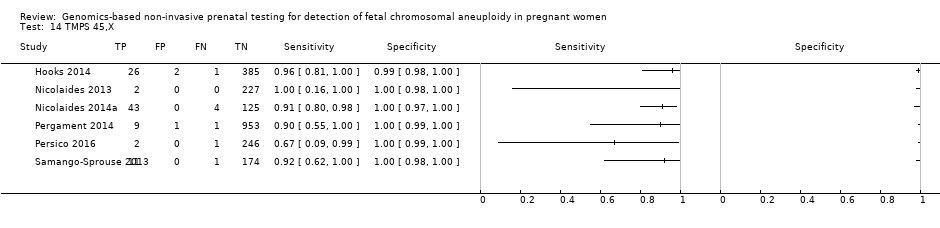
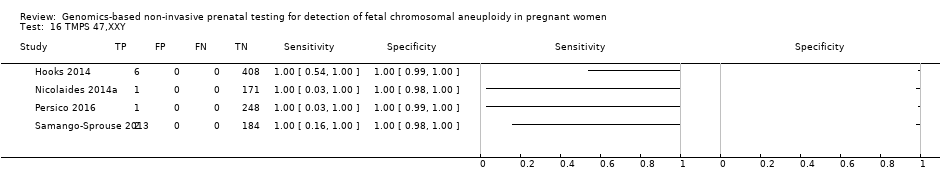
| Hooks 2014 | 45,X, 47,XXX, 47, XXY, 47,XYY | | High risk | -
DANSR assay (FORTE algorithm), Illumina HiSeq 2000 in 96‐plex -
Commercial ‐ Harmony™ prenatal test, Ariosa Diagnostics, Inc. -
FF measured | NR (usually Harmony™ prenatal test uses FORTE risk score of 1%) | Fetal karyotype | |
| Jackson 2014 | T21, T18, T13 | | High and low risk | -
DANSR assay (FORTE algorithm) -
Commercial ‐ Harmony™ prenatal test, Ariosa Diagnostics, Inc. | NR (usually Harmony™ prenatal test uses FORTE risk score of 1%) | Fetal karyotype or medical record from birth | |
| Korostelev 2014 | T21, T18, T13, 45,X, 47,XXX, 47, XXY, 47,XYY | | High and without prior risk | -
SNP‐based method (NATUS algorithm), IIIumina Genome Analyzer IIx or HiSeq sequencer, > 19,000‐plex targeted PCR -
Commercial ‐ Natera's prenatal test -
FF measured | NR | Fetal karyotype or medical record from birth | |
| Nicolaides 2012 | T21, T18 | | Without prior risk | -
DANSR assay (usually with FORTE algorithm) -
Commercial ‐ Harmony™ prenatal test, Ariosa Diagnostics, Inc. -
FF measured | Risk score of 1% | Fetal karyotype or neonatal clinical examination | First‐trimester combined test (cutpoint of 1 in 150). |
| Nicolaides 2013 | T21, T18, T13, 45,X, 47,XXX, 47,XXY, 47,XYY | | High risk | -
SNP‐based method (NATUS algorithm), IIIumina Genome Analyzer IIx or HiSeq sequencer, 19,488‐plex targeted PCR -
Commercial ‐ Natera's prenatal test -
FF measured | NR | Fetal karyotype | |
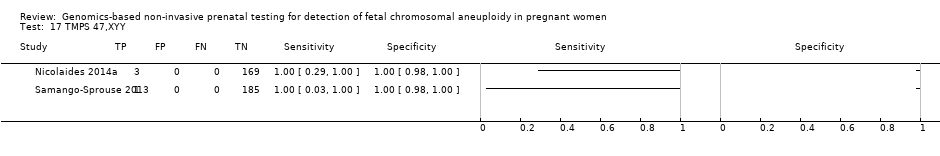
| Nicolaides 2014a | 45,X, 47,XXX, 47,XXY, 47,XYY | | High risk | | FORTE risk score of 1% | Fetal karyotype | |
| Norton 2012 | T21, T18 | | High risk | -
DANSR assay (FORTE algorithm), Illumina HiSeq 2000 in 96‐plex -
Commercial test‐ Ariosa Diagnostics, Inc. -
FF measured | FORTE risk score of 1% | Fetal karyotype | |
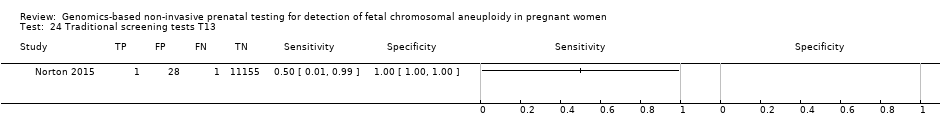
| Norton 2015 | T21, T18, T13 | -
Blinded prospective cohort study -
18,955 singleton pregnancies enrolled, 15,841 were analysed | Without prior risk | -
DANSR assay (FORTE algorithm) -
Commercial ‐ Harmony™ prenatal test, Ariosa Diagnostics, Inc. -
FF measured | NR (usually Harmony™ prenatal test uses FORTE risk score of 1%) | Fetal or postnatal karyotype, neonatal clinical examination or medical record from birth | First‐trimester combined test (cutpoint of 1 in 270 for T21 and 1 in 150 for T18 and T13). |
| Pergament 2014 | T21, T18, T13, 45,X | | High and low risk | -
SNP‐based method (NATUS algorithm), IIIumina Genome Analyzer IIx or HiSeq sequencer, 19,488‐plex targeted PCR -
Commercial ‐ Natera's prenatal test -
FF measured | NR | Fetal karyotype or genetic testing of cord blood, buccal, saliva or products of conception or birth outcome | |
| Persico 2016 | T21, T18, 45,X, 47,XXX, 47,XXY, 47,XYY | | High risk | -
SNP‐based method (NATUS algorithm), IIIumina Genome Analyzer IIx or HiSeq sequencer, 19,488‐plex targeted PCR -
Commercial ‐ Natera's prenatal test -
FF measured | Risk score of 1% | Fetal karyotype | |
| Quezada 2015 | T21, T18, T13 | | Without prior risk | | NR (usually Harmony™ prenatal test uses FORTE risk score of 1%) | Fetal or postnatal karyotype, neonatal clinical examination or medical record from birth | First‐trimester combined test (cutpoint of 1 in 100 for T21). |
| Samango‐Sprouse 2013 | 45,X, 47,XXX, 47,XXY, 47,XYY | -
Blinded prospective cohort study -
201 singleton pregnancies (with known SCA and euploid pregnancies) enrolled, 186 were analysed | High and low risk | -
SNP‐based method (NATUS algorithm), IIIumina HiSeq sequencer, 19,488‐plex targeted PCR -
Commercial ‐ Natera's prenatal test -
FF measured | NR | Fetal karyotype or genetic testing of cord blood, buccal, saliva or products of conception | |
| Sparks 2012a | T21, T18 | | High risk | -
DANSR assay (FORTE algorithm), Illumina HiSeq 2000 in 96‐plex -
Commercial test‐ Ariosa Diagnostics, Inc. -
FF measured | NR | Fetal karyotype | |
| Verweij 2013 | T21 | | High risk | -
DANSR assay (FORTE algorithm), Illumina HiSeq 2000 in 96‐plex -
Commercial test‐ Ariosa Diagnostics, Inc. -
FF measured | FORTE risk score of 1% | Fetal karyotype | |