Estimulación eléctrica neuromuscular para la prevención de la tromboembolia venosa
Resumen
Antecedentes
La tromboembolia venosa (TEV) es una causa grave pero prevenible de morbilidad y mortalidad. Los sistemas de estimulación eléctrica neuromuscular (SENM) para la prevención de TEV pueden ser beneficiosos para los pacientes en quienes están contraindicados los métodos de profilaxis mecánica estándar o farmacológicos o se consideran inseguros o poco prácticos. Aunque los resultados de los estudios experimentales indican que los SENM reducen la estasis venosa, la efectividad y la utilidad clínica de los SENM en la prevención de la TEV siguen siendo polémicas.
Objetivos
Evaluar la efectividad de la estimulación eléctrica neuromuscular en la prevención de la tromboembolia venosa.
Métodos de búsqueda
El especialista en información del Grupo Cochrane Vascular (The Cochrane Vascular Group Information Specialist, CIS) buscó en el registro especializado (22 marzo 2017) y en el Registro Cochrane Central de Estudios Controlados (Cochrane Central Register of Controlled Studies) (CENTRAL [2017, número 2]). El CIS también buscó en registros de ensayos para obtener detalles de los estudios en curso y no publicados. Los autores de la revisión buscaron en las listas bibliográficas de artículos y revisiones relevantes para buscar más ensayos potencialmente elegibles.
Criterios de selección
Se programó incluir ensayos controlados aleatorios (ECA) y ensayos cuasialeatorios que compararon cualquier forma de estimulación eléctrica neuromuscular como intervención para la profilaxis de la TEV (sola o combinada con métodos farmacológicos u otros métodos mecánicos) versus ninguna profilaxis y otros métodos mecánicos o farmacológicos de la profilaxis de la TEV.
Obtención y análisis de los datos
Al menos dos autores de la revisión independientes participaron en la selección de estudios, la extracción de datos, la evaluación de la calidad metodológica de los estudios incluidos y el análisis de los datos. Los desacuerdos se resolvieron mediante discusión entre los dos autores de la revisión. Si no se lograba un acuerdo, participaba un tercer autor de la revisión. Los resultados principales de la revisión fueron: trombosis venosa profunda (TVP) total, TVP sintomática y asintomática, embolia pulmonar (EP), TEV total y hemorragia (grave y leve). La calidad de la evidencia se evaluó mediante el enfoque GRADE y se indica en cursiva.
Resultados principales
Se incluyeron en la revisión cinco ensayos controlados aleatorios y tres ensayos cuasialeatorios, que incorporaron un total de 904 participantes. Entre éstos, cuatro estudios incluyeron pacientes sometidos a procedimientos quirúrgicos mayores; un estudio incorporó a pacientes sometidos a cirugía para la fractura de cadera bajo anestesia espinal; un estudio incorporó a pacientes con traumatismos y contraindicación para la heparina profiláctica; un estudio incorporó a pacientes neuroquirúrgicos operados bajo anestesia general; y un estudio incorporó a pacientes con lesiones de la médula espinal no funcionales. En total, ocho estudios investigaron 22 brazos de tratamiento. Cuatro estudios compararon el grupo de SENM con un grupo de ninguna profilaxis, y cinco estudios compararon el grupo de SENM con grupos de métodos alternativos de profilaxis. Los métodos alternativos de profilaxis fueron: heparina en dosis baja (5000 UI por vía subcutánea), dos estudios; dextrán 40, un estudio; medias de compresión graduadas (MCG) y dispositivos de compresión neumática intermitente (DCNI), un estudio. Un estudio comparó el SENM y la heparina en dosis baja combinados versus ninguna profilaxis o heparina en dosis baja sola.
No se encontró ninguna diferencia clara en los riesgos de TVP total (odds ratio [OR] 1,01; intervalo de confianza [IC] del 95%: 0,60 a 1,70; P = 0,98; seis estudios, 415 participantes; evidencia de baja calidad), TVP asintomática (OR 1,61; IC del 95%: 0,40 a 6,43; P = 0,50; un estudio, 89 participantes; evidencia de baja calidad), TVP sintomática (OR 0,40; IC del 95%: 0,02 a 10,07; P = 0,58; un estudio, 89 participantes; evidencia de baja calidad), EP (OR 1,31; IC del 95%: 0,38 a 4,48; P = 0,67; 2 estudios, 126 participantes;evidencia de baja calidad) y TEV total (OR 0,92; IC del 95%: 0,34 a 2,52; P = 0,88; un estudio, 72 participantes; evidencia de baja calidad) entre la profilaxis con SENM y los métodos alternativos de profilaxis. Ninguno de los estudios en esta comparación informó hemorragias.
En comparación con ninguna profilaxis, los SENM mostraron un menor riesgo de TVP total (OR 0,40; IC del 95%: 0,23 a 0,70; P = 0,02; cuatro estudios, 576 participantes; evidencia de calidad moderada) y TEV total (OR 0,23; IC del 95%: 0,09 a 0,59; P = 0,002; un estudio, 77 participantes; evidencia de baja calidad). Los datos no muestran ninguna diferencia clara del riesgo de TVP asintomática (OR 0,32; IC del 95%: 0,06 a 1,62; P = 0,17; un estudio, 200 participantes; evidencia de baja calidad), TVP sintomática (OR 0,06; IC del 95%: 0,00 a 1,36; P = 0,08; 1 estudio, 160 participantes;evidencia de baja calidad) ni de EP (OR 0,36; IC del 95%: 0,12 a 1,07; P = 0,07; un estudio, 77 participantes; evidencia de baja calidad) entre la profilaxis con SENM y ninguna profilaxis. Ninguno de los estudios en esta comparación informó hemorragias.
En comparación con la heparina en dosis baja, SENM se asoció con riesgo mayor de TVP total (OR 2,78; IC del 95%: 1,19 a 6,48; P = 0,02; dos estudios, 194 participantes; evidencia de baja calidad), pero los datos fueron insuficientes para otras comparaciones (SENM versus dextrán 40, SENM versus MCG, o SENM versus DCNI) y para otros resultados clínicos como TVP sintomática o asintomática, EP, TEV total y hemorragia en comparaciones individuales.
En términos generales, se consideró que la calidad de la evidencia disponible era baja debido al riesgo alto o poco claro de sesgo y los cálculos de efecto imprecisos por el número pequeño de estudios y eventos.
Conclusiones de los autores
La evidencia de baja calidad no muestra una diferencia clara en el riesgo de TVP entre los SENM y los métodos alternativos de profilaxis pero sugiere que los SENM pueden asociarse con un riesgo menor de TVP en comparación con ninguna profilaxis (evidencia de calidad moderada) y un riesgo mayor de TVP en comparación con la heparina en dosis baja (evidencia de baja calidad). La evidencia mejor disponible acerca de la efectividad de los SENM en la prevención de la TEV no es adecuadamente consistente para permitir conclusiones definitivas. Se necesitan ensayos controlados aleatorios de alta calidad y de poder estadístico suficiente para aportar pruebas sólidas.
PICO
Resumen en términos sencillos
Estimulación eléctrica neuromuscular para la prevención de la tromboembolia venosa
Antecedentes
La formación de coágulos sanguíneos en las venas profundas de las piernas es un problema de salud grave y potencialmente mortal porque estos coágulos pueden trasladarse hasta los pulmones y causar la muerte. La formación de coágulos pueden ocurrir como resultado de movilidad reducida (debido a una intervención quirúrgica, accidente cerebrovascular, lesiones, etc.), mayor tendencia a la coagulación de la sangre (por cáncer, trastornos hereditarios, etc.) y otros factores. La formación de coágulos sanguíneos en las piernas puede prevenirse con métodos farmacológicos (heparina, warfarina, etc.) o métodos mecánicos (medias específicas o dispositivos que ayudan a comprimir las piernas para promover el flujo de sangre dentro de las venas, reduciéndose el riesgo de coagulación de la sangre). Los sistemas de estimulación eléctrica neuromusculares (SENM) envían impulsos eléctricos a través de electrodos a la piel sobre grupos musculares o nervios seleccionados para inducir una contracción muscular involuntaria. Se piensa que los SENM son efectivos como método mecánico para prevenir la formación de coágulos sanguíneos en las piernas. Por lo tanto, se intentó identificar la evidencia disponible sobre la efectividad de los SENM comparados con otros métodos para prevenir la formación de coágulos sanguíneos no deseados.
Características de los estudios y resultados clave
Se identificaron ocho estudios (actualización al 22 de marzo de 2017), que incorporaron 904 participantes y que compararon los SENM con ningún tratamiento o con otros métodos para la prevención de coágulos sanguíneos, como la heparina en dosis baja y las medias de compresión. No se encontró ninguna diferencia clara en el riesgo de coágulos sanguíneos en las piernas entre los SENM y los métodos alternativos de prevención de coágulos sanguíneos. También se halló que los SENM se asocian con un riesgo menor de formación de coágulos sanguíneos en las piernas en comparación con ningún tratamiento, pero un riesgo mayor de formación de coágulos sanguíneos en comparación con la heparina. Se necesitan estudios adicionales para obtener pruebas más sólidas.
Calidad de la evidencia
En términos generales, la calidad de la evidencia disponible es baja y se ha disminuido debido al riesgo alto o poco claro de sesgo, las diferencias entre los estudios y los cálculos del efecto imprecisos por el número pequeño de estudios y eventos.
Authors' conclusions
Summary of findings
| NMES compared to alternative prophylaxis for the prevention of venous thromboembolism | ||||||
| Patient or population: participants at risk of venous thromboembolism | ||||||
| Outcomes | Anticipated absolute effects* (95% CI) | Relative effect | No. of participants | Quality of the evidence | Comments | |
| Risk with alternative prophylaxis | Risk with NMES | |||||
| Total DVT | Study population | OR 1.01 | 415 | ⊕⊕⊝⊝ | ||
| 170 per 1000 | 172 per 1000 | |||||
| Asymptomatic DVT | Study population | OR 1.61 | 89 | ⊕⊕⊝⊝ | ||
| 82 per 1000 | 125 per 1000 | |||||
| Symptomatic DVT | Study population | OR 0.40 | 89 | ⊕⊕⊝⊝ | ||
| 20 per 1000 | 8 per 1000 | |||||
| PE | Study population | OR 1.31 | 126 | ⊕⊕⊝⊝ | ||
| 70 per 1000 | 90 per 1000 | |||||
| Total VTE | Study population | OR 0.92 | 72 | ⊕⊕⊝⊝ | ||
| 314 per 1000 | 297 per 1000 | |||||
| Bleeding (major and minor) | see comment | see comment | not estimable | 415 | ‐ | None of the studies in this comparison reported this outcome. |
| *Assumed control intervention risks were calculated by the mean number of events in control groups of selected studies for each outcome. The risk in the intervention group (and its 95% confidence interval) is based on the assumed risk in the comparison group and the relative effect of the intervention (and its 95% CI). | ||||||
| GRADE Working Group grades of evidence. | ||||||
| aHigh or unclear risk of selection bias, performance bias, and detection bias ‐ downgraded by one level. | ||||||
| NMES compared to no prophylaxis for prevention of venous thromboembolism | ||||||
| Patient or population: participants at risk of venous thromboembolism | ||||||
| Outcomes | Anticipated absolute effects* (95% CI) | Relative effect | No. of participants | Quality of the evidence | Comments | |
| Risk with no prophylaxis | Risk with NMES | |||||
| Total DVT | Study population | OR 0.40 | 576 | ⊕⊕⊕⊝ | ||
| 219 per 1000 | 101 per 1000 | |||||
| Asymptomatic DVT Follow‐up: 7 days | Study population | OR 0.32 | 200 | ⊕⊕⊝⊝ | ||
| 60 per 1000 | 20 per 1000 | |||||
| Symptomatic DVT Follow‐up: 7 days | Study population | OR 0.06 | 160 | ⊕⊕⊝⊝ | ||
| 50 per 1000 | 3 per 1000 | |||||
| PE Follow‐up: 6 days | Study population | OR 0.36 | 77 | ⊕⊕⊝⊝ | ||
| 350 per 1000 | 162 per 1000 | |||||
| Total VTE Follow‐up: 6 days | Study population | OR 0.23 | 77 | ⊕⊕⊝⊝ | ||
| 650 per 1000 | 299 per 1000 | |||||
| Bleeding (major and minor) | see comment | see comment | not estimable | 576 (4 RCTs) | ‐ | None of the studies in this comparison reported this outcome. |
| *Assumed control intervention risks were calculated by the mean number of events in control groups of selected studies for each outcome. The risk in the intervention group (and its 95% confidence interval) is based on the assumed risk in the comparison group and the relative effect of the intervention (and its 95% CI). | ||||||
| GRADE Working Group grades of evidence. | ||||||
| aHigh or unclear risk of selection bias, performance bias, and detection bias ‐ downgraded by one level. | ||||||
| NMES compared to low‐dose heparin for the prevention of venous thromboembolism | ||||||
| Patient or population: participants at risk of venous thromboembolism | ||||||
| Outcomes | Anticipated absolute effects* (95% CI) | Relative effect | No. of participants | Quality of the evidence | Comments | |
| Risk with low‐dose heparin | Risk with NMES | |||||
| Total DVT | Study population | OR 2.78 | 194 | ⊕⊕⊝⊝ | ||
| 87 per 1000 | 208 per 1000 | |||||
| Asymptomatic DVT Follow‐up: 8 days | Study population | OR 1.61 | 89 | ⊕⊕⊝⊝ | ||
| 82 per 1000 | 125 per 1000 | |||||
| Symptomatic DVT Follow‐up: 8 days | Study population | OR 0.40 | 89 | ⊕⊕⊝⊝ | ||
| 20 per 1000 | 8 per 1000 | |||||
| PE | see comment | see comment | not estimable | 194 (2 RCTs) | ‐ | None of the studies in this comparison reported this outcome. |
| Total VTE | see comment | see comment | not estimable | 194 (2 RCTs) | ‐ | None of the studies in this comparison reported this outcome. |
| Bleeding (major and minor) | see comment | see comment | not estimable | 194 (2 RCTs) | ‐ | None of the studies in this comparison reported this outcome. |
| *Assumed control intervention risks were calculated by the mean number of events in control groups of selected studies for each outcome. The risk in the intervention group (and its 95% confidence interval) is based on the assumed risk in the comparison group and the relative effect of the intervention (and its 95% CI). | ||||||
| GRADE Working Group grades of evidence. | ||||||
| aHigh or unclear risk of selection bias, performance bias, and detection bias ‐ downgraded by one level. | ||||||
| NMES compared to Dextran 40 for the prevention of venous thromboembolism | ||||||
| Patient or population: participants at risk of venous thromboembolism | ||||||
| Outcomes | Anticipated absolute effects* (95% CI) | Relative effect | No. of participants | Quality of the evidence | Comments | |
| Risk with Dextran 40 | Risk with NMES | |||||
| Total DVT | Study population | OR 0.63 | 72 | ⊕⊕⊝⊝ | ||
| 200 per 1000 | 136 per 1000 | |||||
| Asymptomatic DVT | see comment | see comment | not estimable | 72 (1 RCT) | ‐ | The single study in this comparison did not report this outcome. |
| Symptomatic DVT | see comment | see comment | not estimable | 72 (1 RCT) | ‐ | The single study in this comparison did not report this outcome. |
| PE Follow‐up: 6 days | Study population | OR 1.50 | 72 | ⊕⊕⊝⊝ | ||
| 114 per 1000 | 162 per 1000 | |||||
| Total VTE Follow‐up: 6 days | Study population | OR 0.92 | 72 | ⊕⊕⊝⊝ | ||
| 314 per 1000 | 297 per 1000 | |||||
| Bleeding (major and minor) | see comment | see comment | not estimable | 72 (1 RCT) | ‐ | The single study in this comparison did not report this outcome. |
| Assumed control intervention risks were calculated by the mean number of events in control groups of selected studies for each outcome. *The risk in the intervention group (and its 95% confidence interval) is based on the assumed risk in the comparison group and the relative effect of the intervention (and its 95% CI). | ||||||
| GRADE Working Group grades of evidence. | ||||||
| aHigh or unclear risk of selection bias, performance bias, and detection bias ‐ downgraded by one level. | ||||||
| Combined NMES and low‐dose heparin compared to no prophylaxis for the prevention of venous thromboembolism | ||||||
| Patient or population: participants at risk of venous thromboembolism | ||||||
| Outcomes | Anticipated absolute effects* (95% CI) | Relative effect | No. of participants | Quality of the evidence | Comments | |
| Risk with no prophylaxis | Risk with combined NMES and low‐dose heparin | |||||
| Total DVT | Study population | OR 0.08 | 32 | ⊕⊕⊝⊝ | ||
| 471 per 1000 | 66 per 1000 | |||||
| Asymptomatic DVT | see comment | see comment | not estimable | 32 (1 RCT) | ‐ | The single study in this comparison did not report this outcome. |
| Symptomatic DVT | see comment | see comment | not estimable | 32 (1 RCT) | ‐ | The single study in this comparison did not report this outcome. |
| PE | see comment | see comment | not estimable | 32 (1 RCT) | ‐ | The single study in this comparison did not report this outcome. |
| Total VTE | see comment | see comment | not estimable | 32 (1 RCT) | ‐ | The single study in this comparison did not report this outcome. |
| Bleeding (major and minor) | see comment | see comment | not estimable | 32 (1 RCT) | ‐ | The single study in this comparison did not report this outcome. |
| *Assumed control intervention risks were calculated by the mean number of events in control groups of selected studies for each outcome. The risk in the intervention group (and its 95% confidence interval) is based on the assumed risk in the comparison group and the relative effect of the intervention (and its 95% CI). | ||||||
| GRADE Working Group grades of evidence. | ||||||
| aHigh or unclear risk of selection bias and detection bias ‐ downgraded by one level. | ||||||
| Combined NMES and low‐dose heparin compared to low‐dose heparin for the prevention of venous thromboembolism | ||||||
| Patient or population: participants at risk of venous thromboembolism | ||||||
| Outcomes | Anticipated absolute effects* (95% CI) | Relative effect | No. of participants | Quality of the evidence | Comments | |
| Risk with low‐dose heparin | Risk with combined NMES and low‐dose heparin | |||||
| Total DVT | Study population | OR 0.07 | 31 | ⊕⊕⊝⊝ | ||
| 500 per 1000 | 65 per 1000 | |||||
| Asymptomatic DVT | see comment | see comment | not estimable | 31 (1 RCT) | ‐ | The single study in this comparison did not report this outcome. |
| Symptomatic DVT | see comment | see comment | not estimable | 31 (1 RCT) | ‐ | The single study in this comparison did not report this outcome. |
| PE | see comment | see comment | not estimable | 31 (1 RCT) | ‐ | The single study in this comparison did not report this outcome. |
| Total VTE | see comment | see comment | not estimable | 31 (1 RCT) | ‐ | The single study in this comparison did not report this outcome. |
| Bleeding (major and minor) | see comment | see comment | not estimable | 31 (1 RCT) | ‐ | The single study in this comparison did not report this outcome. |
| *Assumed control intervention risks were calculated by the mean number of events in control groups of selected studies for each outcome. The risk in the intervention group (and its 95% confidence interval) is based on the assumed risk in the comparison group and the relative effect of the intervention (and its 95% CI). | ||||||
| GRADE Working Group grades of evidence. | ||||||
| aHigh or unclear risk of selection bias and detection bias ‐ downgraded by one level. | ||||||
| NMES compared to GCS for the prevention of venous thromboembolism | ||||||
| Patient or population: participants at risk of venous thromboembolism | ||||||
| Outcomes | Anticipated absolute effects* (95% CI) | Relative effect | No. of participants | Quality of the evidence | Comments | |
| Risk with GCS | Risk with NMES | |||||
| Total DVT | Study population | OR 0.32 | 36 | ⊕⊕⊝⊝ | ||
| 56 per 1000 | 18 per 1000 (1 to 327) | |||||
| Asymptomatic DVT | see comment | see comment | not estimable | 36 (1 RCT) | ‐ | None of the studies in this comparison reported this outcome. |
| Symptomatic DVT | see comment | see comment | not estimable | 36 (1 RCT) | ‐ | None of the studies in this comparison reported this outcome. |
| PE Follow‐up: 1 day | Study population | OR 0.32 | 36 | ⊕⊕⊝⊝ | ||
| 56 per 1000 | 18 per 1000 | |||||
| Total VTE | see comment | see comment | not estimable | 36 (1 RCT) | ‐ | None of the studies in this comparison reported this outcome. |
| Bleeding (major and minor) | see comment | see comment | not estimable | 36 (1 RCT) | ‐ | None of the studies in this comparison reported this outcome. |
| *Assumed control intervention risks were calculated by the mean number of events in control groups of selected studies for each outcome. The risk in the intervention group (and its 95% confidence interval) is based on the assumed risk in the comparison group and the relative effect of the intervention (and its 95% CI). | ||||||
| GRADE Working Group grades of evidence. | ||||||
| aHigh or unclear risk of selection bias, performance bias, and detection bias ‐ downgraded by one level. | ||||||
| NMES compared to IPCD for the prevention of venous thromboembolism | ||||||
| Patient or population: participants at risk of venous thromboembolism | ||||||
| Outcomes | Anticipated absolute effects* (95% CI) | Relative effect | No. of participants | Quality of the evidence | Comments | |
| Risk with IPCD | Risk with NMES | |||||
| Total DVT Follow‐up: 1 day | Study population | not estimable | 36 | ⊕⊕⊝⊝ | No DVT events were recorded. | |
| see comment | see comment | |||||
| Asymptomatic DVT | see comment | see comment | not estimable | 36 (1 RCT) | ‐ | None of the studies in this comparison reported this outcome. |
| Symptomatic DVT | see comment | see comment | not estimable | 36 (1 RCT) | ‐ | None of the studies in this comparison reported this outcome. |
| PE Follow‐up: 1 day | Study population | not estimable | 36 | ⊕⊕⊝⊝ | No PE events were recorded. | |
| see comment | see comment | |||||
| Total VTE | see comment | see comment | not estimable | 36 (1 RCT) | ‐ | None of the studies in this comparison reported this outcome. |
| Bleeding (major and minor) | see comment | see comment | not estimable | 36 (1 RCT) | ‐ | None of the studies in this comparison reported this outcome. |
| *Assumed control intervention risks were calculated by the mean number of events in control groups of selected studies for each outcome. The risk in the intervention group (and its 95% confidence interval) is based on the assumed risk in the comparison group and the relative effect of the intervention (and its 95% CI). | ||||||
| GRADE Working Group grades of evidence. | ||||||
| aHigh or unclear risk of selection bias, performance bias, and detection bias ‐ downgraded by one level. | ||||||
Background
Description of the condition
Venous thromboembolism (VTE) is a serious but preventable cause of morbidity and mortality (Arnold 2001), that occurs in approximately 1 per 1000 adults each year (White 2003). Clinical manifestations of VTE ‐ deep vein thrombosis (DVT) and pulmonary embolism (PE) with or without DVT ‐ constitute two‐thirds and one‐third of cases of VTE, respectively (White 2003). Endothelial injury, hypercoagulable state, and stasis, known as Virchow's triad, form the basis for the pathogenesis of VTE (Virchow 1856). Risk factors contributing to the development of VTE may be hereditary or acquired, and modifiable (e.g. obesity, surgery, trauma, immobility, malignancy) or non‐modifiable (e.g. paraplegia, hereditary thrombophilia such as factor V Leiden) (Anderson 2003; Cushman 2007). Hospitalisation is associated with increased risk of VTE due to the presence of multiple risk factors such as immobility, malignancy, infection, and surgery (Anderson 1992). Prophylaxis against VTE is very important for most hospitalised patients, in particular, patients in surgical, trauma, and intensive care units (ICUs), who are at higher risk of VTE as they are more likely to be immobile and to be exposed to the aforementioned VTE risk factors (Guyatt 2012).
Description of the intervention
Mechanical methods of prophylaxis include graduated compression stockings (GCS), intermittent pneumatic compression devices (IPCD), and neuromuscular electrical stimulation systems (NMES) (Roderick 2005). GCS and IPCD have been shown to be effective in VTE prophylaxis (Pavon 2016; Sachdeva 2014). However, despite their effectiveness and common use, these methods may be associated with poor patient compliance due to discomfort, excessive heat, itchiness, sweating under the inflatable cuffs, and the potential for peroneal nerve palsy (Faghri 1997; Froimson 2009; Kahn 2002; Laverick 1990; Masri 2004). Neuromuscular electrical stimulation systems deliver electrical energy to skeletal muscle nerve branches, then to muscle units, via superficial electrodes attached to the skin (Baker 1993). Neuromuscular electrical stimulation systems for the prevention of VTE may be beneficial for patients for whom pharmacological or standard mechanical methods of prophylaxis are contraindicated or are regarded as unsafe or impractical.
In terms of limitations, NMES may induce excessive neuromuscular fatigue (Gorgey 2009). Also, muscle contractions induced by NMES are not as unsynchronised and may not be as effective as voluntary muscle contractions. Considering the resistance created by the viscosity of subcutaneous tissue, activation of deeper structures with standard surface stimulation is usually limited (Doucet 2012). Therefore, ideal delivery settings (frequency, energy, etc.) remain unknown. Moreover, although modern devices are thought to be associated with better tolerability, older NMES delivery systems produced painful stimuli, so they could be used only during general anaesthesia (Nicolaides 2013). Owing to lack of comparative data, it is unclear whether NMES would result in better compliance than other methods of mechanical prophylaxis.
How the intervention might work
Experimental studies have shown that NMES increase venous blood velocity and blood flow in stimulated legs, thus reducing venous stasis (Breen 2012; Broderick 2010; Broderick 2013; Griffin 2010; Izumi 2010; Lyons 2002; Moloney 2006; Tucker 2010; Warwick 2013). Although the use of venous velocity as a surrogate outcome for VTE incidence is controversial, this effect may prove beneficial in VTE prevention (Morris 2004). Moreover, neural supply to the veins provides direct antithrombotic effects as the fourth factor not included in Virchow’s triad; NMES, via neurogenic pathways, may influence this fourth factor and suppress thrombogenesis (Stefanou 2016). Findings of experimental studies suggest acceptable tolerability of NMES that can potentially lead to good patient compliance (Broderick 2010; Broderick 2013; Moloney 2006; Warwick 2013).
Why it is important to do this review
Although findings of experimental studies suggest that NMES reduce venous stasis, the clinical utility and effectiveness of NMES in VTE prevention remain controversial (Hajibandeh 2015). This review of clinical trials investigating NMES as a mechanical method for VTE prevention will help to address current uncertainties about the benefits of NMES for different patient groups.
A glossary of terms is provided in Appendix 1 to help clarify some of the terms used.
Objectives
To assess the effectiveness of neuromuscular electrical stimulation in the prevention of venous thromboembolism.
Methods
Criteria for considering studies for this review
Types of studies
Randomised controlled trials (RCTs) and quasi‐randomised trials that investigate any form of neuromuscular electrical stimulation as an intervention for VTE prophylaxis.
Types of participants
Patients undergoing any form of neuromuscular electrical stimulation for the purpose of VTE prevention.
Types of interventions
Intervention of interest
-
Any form of neuromuscular electrical stimulation used alone or combined with pharmacological or mechanical methods of VTE prophylaxis, or both.
Comparison
-
Mechanical methods of VTE prevention (including GCS or IPCD), pharmacological VTE prophylaxis (including anticoagulant or antithrombotic drugs), both mechanical and pharmacological prophylaxis, or no prophylaxis.
Types of outcome measures
Primary outcomes
-
Incidence of DVT (asymptomatic or symptomatic)
-
Incidence of PE (with or without DVT)
-
Incidence of total VTE (fatal and non‐fatal)
-
Bleeding (major and minor)
Secondary outcomes
-
Device‐related adverse effects such as skin irritation or inflammation
-
Physiological measurements including changes in tissue oxygen levels, oxygen saturation, heart rate, and blood pressure
-
Patient compliance
-
Subjective discomfort measured by visual analogue scale (VAS) scores and verbal rating scores (VRS)
-
Freedom from VTE at 90 days (symptomatic or asymptomatic)
Diagnosis of PE should be made by ventilation‐perfusion scan, computed tomography, pulmonary angiography, or autopsy. DVT should be diagnosed by duplex ultrasonography, venography, or a fibrinogen uptake test.
Major bleeding was defined as fatal bleeding; retroperitoneal, intracranial, or intraocular bleeding; bleeding that causes haemodynamic compromise, a decrease in haemoglobin of 3 g/dL or more, or a decrease in haematocrit of 10% or more; or bleeding that requires intervention or any transfusion of more than 1 unit of packed red blood cells or whole blood. Minor bleeding is defined as gross haematuria, gastrointestinal haemorrhage, haemoptysis, subconjunctival haemorrhage, or epistaxis; haematoma that is larger than 5 cm or leads to prolonged or new hospitalisation; or bleeding that causes a decrease in haemoglobin of 2 to 3 g/dL (Mehran 2011).
Search methods for identification of studies
Electronic searches
The Cochrane Vascular Group Information Specialist (CIS) searched the Specialised Register (22 March 2017) and the Cochrane Central Register of Controlled Trials (CENTRAL; 2017, Issue 2) via the Cochrane Register of Studies (CRS) (http://www.metaxis.com/CRSWeb/Index.asp). See Appendix 2 for details of the search strategy used to search the CRS. The Specialised Register is maintained by the CIS and is constructed from weekly electronic searches of MEDLINE, Embase, the Cumulative Index to Nursing and Allied Health Literature (CINAHL), and the Allied and Complementary Medicine Database (AMED), and through handsearching of relevant journals. The full list of databases, journals, and conference proceedings that have been searched, as well as the search strategies used, is presented in the Specialised Register section of the Cochrane Vascular Module in the Cochrane Library (www.cochranelibrary.com).
In addition, the CIS searched the following trial databases for details of ongoing and unpublished studies.
-
World Health Organization International Clinical Trials Registry (http://apps.who.int/trialsearch/).
-
ClinicalTrials.gov (http://clinicaltrials.gov/).
-
International Standard Registered Clinical/social sTudy Number (ISRCTN) Register (http://www.isrctn.com/).
Searching other resources
We searched the bibliographic lists of relevant articles and reviews for further potentially eligible trials. We contacted manufacturer of the geko™ device (Sky Medical Technology Ltd, Newport, Vermont, USA) for relevant trials.
Data collection and analysis
Selection of studies
Two review authors (Shahab H, Shahin H) independently assessed the title and abstract of articles identified through the literature searches. We retrieved the full texts of relevant reports and selected articles that met the eligibility criteria of our review. We resolved discrepancies in study selection through discussion between review authors. We consulted a third review author (GA) in the event of disagreement.
Data extraction and management
We created an electronic data extraction spreadsheet consistent with the Cochrane data collection form for intervention reviews. We pilot‐tested the spreadsheet in randomly selected articles and adjusted it as needed. Our data extraction spreadsheet included the following.
-
Study‐related data (first author, year of publication, country of origin of the corresponding author, journal in which the study was published, study design, study size, clinical condition of study participants, type of intervention, duration of VTE prophylaxis, and information about NMES including type of device, frequency, pulse width, charge, and voltage).
-
Baseline demographic and clinical information of trial populations.
-
Primary and secondary outcome data.
Two review authors (Shahab H, Shahin H) independently collected and recorded data on the data extraction spreadsheet and resolved disagreements by discussion. If no agreement could be reached, we consulted a third review author (JS).
Assessment of risk of bias in included studies
We used the Cochrane tool for assessing risk of bias (Higgins 2011). Two review authors (Shahab H, Shahin H) independently assessed each included study for risk of bias. We assessed all domains (selection bias, performance bias, detection bias, attrition bias, reporting bias, and other sources of bias), and for each individual domain, we classified studies as having low, unclear, or high risk of bias. We resolved disagreements by discussion between the two review authors (Shahab H, Shahin H). If no agreement could be reached, a third review author (FT) acted as an adjudicator.
Measures of treatment effect
The primary outcomes in our review (frequency of DVT, PE, VTE, bleeding, and device‐related adverse effects) were dichotomous variables; therefore, we calculated the odds ratio (OR), which represents the odds of an adverse event in the NMES group compared with the non‐NMES group, as the summary measure. An OR of less than one would favour the NMES. For continuous parameters such as compliance and discomfort measurements, we planned to calculate the mean difference (MD) between NMES and non‐NMES groups, unless trials reported different scales of measurement, in which case we planned to compute the standardised mean difference (SMD).
Unit of analysis issues
We used the individual patient as the unit of analysis in our review. If any included study in our review reported outcomes related to a mixture of units of analysis, we extracted only data relevant to our unit of analysis. We excluded studies that randomised individual legs instead of individual participants, as we believe that two legs of one participant are not independent.
Dealing with missing data
We recorded information about dropouts and withdrawals and other missing data; if not reported, we contacted study authors to ask for this information. The final analysis was based on intention‐to‐treat data from individual clinical trials.
Assessment of heterogeneity
We assessed heterogeneity among studies by using the Chi² test. We quantified inconsistency by calculating I² and interpreted it using the following guide (Higgins 2011).
-
0% to 40%: might not be important.
-
30% to 60%: may represent moderate heterogeneity.
-
50% to 90%: may represent substantial heterogeneity.
-
75% to 100%: considerable heterogeneity.
Assessment of reporting biases
We planned to use the Egger’s regression intercept to assess reporting bias in our review. We planned to construct funnel plots and evaluate their symmetry to visually assess publication bias, as long as a sufficient number of trials (more than 10) were available.
Data synthesis
We used Review Manager 5.3 software for data synthesis (RevMan 2014). The first review author (Shahab H) entered extracted data into Review Manager, and the second review author (Shahin H) independently checked the data. We used random‐effects or fixed‐effect modelling, as appropriate, for analysis. We applied random‐effects models if we identified considerable heterogeneity among studies, as defined by Higgins 2011. We reported results in a forest plot with 95% confidence intervals (CIs).
Subgroup analysis and investigation of heterogeneity
If possible, we planned to perform separate analyses for the following subgroups.
-
Surgical patients.
-
Trauma patients.
-
ICU patients.
-
Patients with chronic venous disease.
-
Patients with neurological disorders.
If possible, we planned to perform separate analyses for individual NMES devices, old NMES devices (those no longer available for use at present), and contemporary NMES devices.
Sensitivity analysis
To explore potential sources of heterogeneity and to assess the robustness of our results, we performed additional analyses for outcomes reported by at least four studies. These included repeating the primary analysis using random‐effects and fixed‐effect models, calculating the pooled risk ratio (RR) or risk difference (RD) for each dichotomous variable, and assessing the effect of each study on overall effect size and heterogeneity by repeating the analysis after removing one study at a time. We also performed sensitivity analyses that excluded studies at high risk of bias.
'Summary of findings' table
We constructed a table to compile and summarise the best evidence on relevant outcomes of comparisons of NMES versus other methods of thromboprophylaxis. We considered study populations consisting of patients with surgical, trauma, or medical conditions. We selected the most important and clinically relevant outcomes (both desirable and undesirable) thought to be essential for decision‐making for inclusion in the 'Summary of findings' table. We have described these in the Types of outcome measures section. We calculated assumed control intervention risks by using the mean number of events in control groups of selected studies for each outcome. We used the system developed by the Grading of Recommendation, Assessment, Development and Evaluation Working Group (GRADE Working Group) in grading the quality of evidence as high, moderate, low, and very low, based on within‐study risk of bias, directness of evidence, heterogeneity, precision of effects estimates, and risk of publication bias (Atkins 2004; GRADEproGDT).
Results
Description of studies
We have provided characteristics of the included studies in the Characteristics of included studies section.
Results of the search
See Figure 1.

Study flow diagram.
Included studies
We included five RCTs ‐ Hou 2013; Kiudelis 2002; Lindstrom 1982; Merli 1988; Velmahos 2005 ‐ and three quasi‐randomised trials ‐ Bostrom 1986; Goyal 2012; Rosenberg 1975 ‐ enrolling a total of 904 participants. Among these, four studies included patients undergoing major surgical procedures (Hou 2013; Kiudelis 2002, Lindstrom 1982; Rosenberg 1975); one included patients undergoing surgery for hip fracture under spinal anaesthesia (Goyal 2012); one included trauma patients with a contraindication for prophylactic heparin (Velmahos 2005); one included neurosurgical patients who were operated on under general anaesthesia (Bostrom 1986); and one included patients with non‐functional spinal cord injuries (Merli 1988). We have reported in Table 1 the NMES delivery settings used in the included studies.
| Study | Device | Frequency (Hz) | Pulse width | Charge (mA) | Voltage (V) | Duration |
| G6805‐II | 30‐100 | NR | NR | 6‐15 | 7 days (20 minutes twice/d) | |
| VEINOPLUS | NR | NR | NR | 15–25 | Only during surgery | |
| Lymphavision | 1.75 | 3 ms | NR | 0‐120 | 7‐14 days (30 minutes twice/d) | |
| Mioritm 021 | NR | NR | 50‐100 | NR | Only during surgery | |
| NR | 10 | 50 μs | NR | NR | 28 days (23 hours/d) | |
| NR | 8 | 50 ms | 40‐50 | NR | 7 days | |
| NR | 8 | 50 ms | 40‐50 | NR | Only during surgery | |
| Thrombophylactor | NR | 50 ms | NR | Adjustable | Only during surgery |
NR: rot reported.
Four studies compared NMES versus no prophylaxis (Goyal 2012; Hou 2013; Lindstrom 1982; Rosenberg 1975). Two studies compared NMES versus low‐dose heparin (5000 IU subcutaneously) (Bostrom 1986; Rosenberg 1975). One study compared NMES versus Dextran 40 (Lindstrom 1982). One study compared NMES with no prophylaxis or with low‐dose heparin (Velmahos 2005). One study compared combined NMES and low‐dose heparin versus no prophylaxis or low‐dose heparin alone (Merli 1988). One study compared NMES versus GCS and IPCD (Kiudelis 2002). Six studies delivered NMES perioperatively (Bostrom 1986; Goyal 2012; Hou 2013; Kiudelis 2002; Lindstrom 1982; Rosenberg 1975).
In terms of methods to diagnose DVT, two studies used duplex ultrasonography (Goyal 2012; Hou 2013); one used either duplex ultrasonography or venography (Velmahos 2005); four used the fibrinogen uptake test with or without venography (Bostrom 1986; Lindstrom 1982; Merli 1988; Rosenberg 1975); and one used venous occlusion plethysmography (Kiudelis 2002). The median duration of follow‐up in the included studies was seven days (Interquartile range: five).
Excluded studies
We excluded 17 studies from the review (Browse 1970; Czyrny 2010; Doran 1967; Doran 1970; Faghri 1998; Hou 2014; Izumi 2014; Jansen 1972; Kaplan 2002; Lobastov 2014; Morita 2006; NCT02425917; Nicolaides 1983; Ojima 2017; Pambianco 1995; Rosengarten 1975; Yilmaz 2016). Among these, we excluded three studies because they included healthy participants (Czyrny 2010; Kaplan 2002; Morita 2006); four studies because they randomised legs instead of participants (Browse 1970; Doran 1967; Doran 1970; Nicolaides 1983); two studies because they were non‐randomised studies (Faghri 1998; Lobastov 2014); two studies because they investigated non‐mechanical methods of prophylaxis only (Jansen 1972; Rosengarten 1975); one study because only one leg was treated with NMES (Izumi 2014); one study because the NMES arm was terminated early in the pilot phase (Pambianco 1995); one study because researchers did not report the outcomes specified in this review (Hou 2014); two studies because they investigated haemodynamic outcomes and were powered for these outcomes only (Ojima 2017; Yilmaz 2016); and one study because the trial had been withdrawn before enrolment (NCT02425917).
Moreover, we assessed three articles containing data about unpublished trials for potentially eligible trials, but we identified no eligible trials, as all trials included healthy participants (Firstkind 2013; NICE 2011; Summers 2015).
In addition, we identified two relevant ongoing trials, results of which were not available at the time of this writing (ISRCTN95441725; NCT01935414). One study is still awaiting classification because the study has been completed but study results are not yet available (NCT01835990).
Risk of bias in included studies
We have presented the summary and results of methodological quality assessment graphically in Figure 2 and Figure 3.
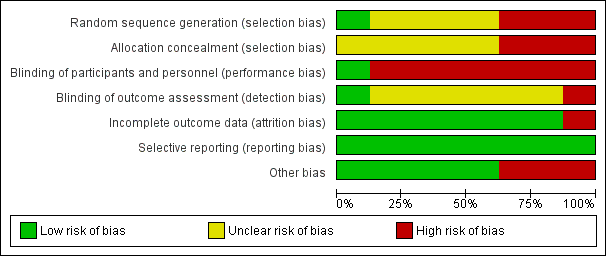
Risk of bias graph: review authors' judgements about each risk of bias item presented as percentages across all included studies.

Risk of bias summary: review authors' judgements about each risk of bias item for each included study.
Allocation
In terms of random sequence generation, we judged one study to be at low risk of selection bias (Hou 2013); three studies to be at high risk of selection bias because of inappropriate method of randomisation (Bostrom 1986; Goyal 2012; Rosenberg 1975); and four studies to be at unclear risk of selection bias because they did not report information about methods of randomisation (Kiudelis 2002; Lindstrom 1982; Merli 1988; Velmahos 2005).
In terms of allocation concealment, we judged three studies to be at high risk of bias (Bostrom 1986; Goyal 2012; Rosenberg 1975). The remaining studies did not provide adequate information about allocation concealment; therefore, risk of bias is unclear in these studies (Hou 2013; Kiudelis 2002; Lindstrom 1982; Merli 1988; Velmahos 2005).
Blinding
We judged risk of performance bias to be low in one study (Merli 1988). We judged risk of performance bias to be high in seven studies because trialists performed no blinding of participants and personnel (Bostrom 1986; Goyal 2012; Hou 2013; Kiudelis 2002; Lindstrom 1982; Rosenberg 1975; Velmahos 2005).
We judged risk of detection bias to be low in Goyal 2012 and high in Bostrom 1986. We were not able to assess risk of detection bias in the other studies, as reporting about blinding of outcome assessment was insufficient (Hou 2013; Kiudelis 2002; Lindstrom 1982; Merli 1988; Rosenberg 1975; Velmahos 2005).
Incomplete outcome data
We judged seven studies to be at low risk of attrition bias (Bostrom 1986; Goyal 2012; Hou 2013; Kiudelis 2002; Lindstrom 1982; Merli 1988; Rosenberg 1975). We judged risk of attrition bias to be high in one study because missing data were not balanced in numbers across intervention groups (Velmahos 2005).
Selective reporting
We judged risk of reporting bias in all included studies as low because although the protocols of the included studies were not available, it is clear that published reports included all expected outcomes.
Other potential sources of bias
We judged three studies to be potentially at high risk of bias because they were Industry sponsored (Hou 2013; Rosenberg 1975; Velmahos 2005). We deemed the remaining five studies to be at low risk of bias, as we identified no other potential sources of bias (Bostrom 1986; Goyal 2012; Kiudelis 2002; Lindstrom 1982; Merli 1988).
Effects of interventions
See: Summary of findings for the main comparison NMES compared to alternative prophylaxis for the prevention of venous thromboembolism; Summary of findings 2 NMES compared to no prophylaxis for prevention of venous thromboembolism; Summary of findings 3 NMES compared to low‐dose heparin for the prevention of venous thromboembolism; Summary of findings 4 NMES compared to Dextran 40 for the prevention of venous thromboembolism; Summary of findings 5 Combined NMES and low‐dose heparin compared to no prophylaxis for the prevention of venous thromboembolism; Summary of findings 6 Combined NMES and low‐dose heparin compared to low‐dose heparin for the prevention of venous thromboembolism; Summary of findings 7 NMES compared to GCS for the prevention of venous thromboembolism; Summary of findings 8 NMES compared to IPCD for the prevention of venous thromboembolism
Available data allowed us to perform eight comparisons. We have presented details about these comparisons in the Data and analyses section. In brief, we present data comparing NMES versus no prophylaxis, NMES versus alternative prophylaxis that is combining all studies using an alternative prophylaxis as a comparator, and NMES versus individual comparisons making up the alternative prophylaxis.
NMES versus alternative prophylaxis
This comparison includes all studies comparing NMES (alone or in combination with other methods of prophylaxis) versus any other method of VTE prophylaxis (Bostrom 1986; Kiudelis 2002; Lindstrom 1982; Merli 1988; Rosenberg 1975; Velmahos 2005).
Total DVT
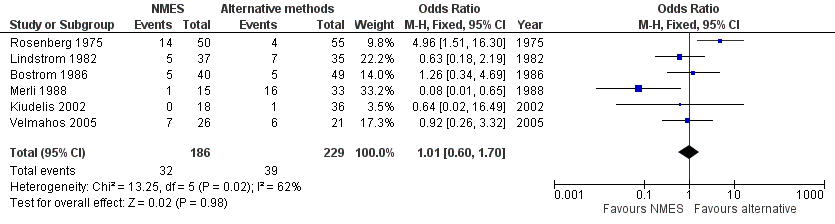
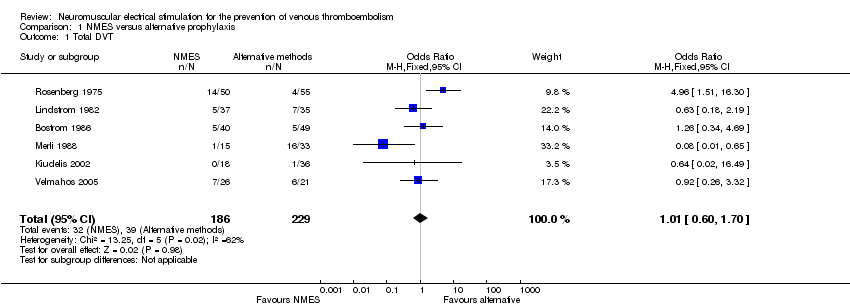
Six studies, enrolling a total of 415 participants, reported total DVT (Bostrom 1986; Kiudelis 2002; Lindstrom 1982; Merli 1988; Rosenberg 1975; Velmahos 2005). Data show no differences in risk of total DVT between NMES and alternative prophylaxis groups (odds ratio (OR) 1.01, 95% confidence interval (CI) 0.60 to 1.70, P = 0.98; low‐quality evidence). Studies show a moderate level of heterogeneity (I2 = 62%, P = 0.02) (Analysis 1.1) (Figure 4).

Forest plot of comparison: 1 NMES versus alternative prophylaxis, outcome: 1.1 Total DVT.
Asymptomatic DVT
One study, enrolling a total of 89 participants, reported asymptomatic DVT (Bostrom 1986). Data show no clear differences in the risk of asymptomatic DVT between NMES and alternative prophylaxis groups (OR 1.61, 95% CI 0.40 to 6.43, P = 0.50; low‐quality evidence) (Analysis 1.2).
Symptomatic DVT
One study, enrolling a total of 89 participants, reported symptomatic DVT (Bostrom 1986). Data show no clear differences in the risk of symptomatic DVT between NMES and alternative prophylaxis groups (OR 0.40, 95% CI 0.02 to 10.07, P = 0.58; low‐quality evidence) (Analysis 1.3).
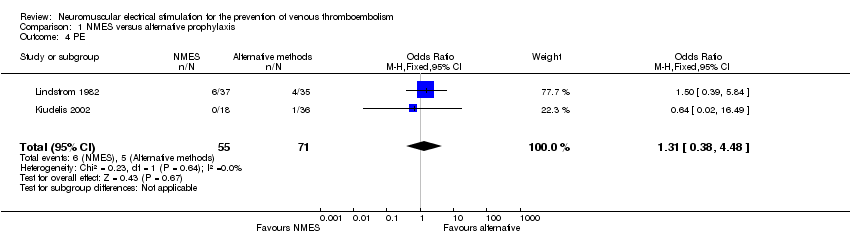
PE
Two studies, enrolling a total of 126 participants, reported PE (Kiudelis 2002; Lindstrom 1982). Data show no clear differences in the risk of PE between NMES and alternative prophylaxis groups (OR 1.31, 95% CI 0.38 to 4.48, P = 0.67; low‐quality evidence). Studies show a low level of heterogeneity (I2 = 0%, P = 0.64) (Analysis 1.4).
Total VTE
One study, enrolling a total of 72 participants, reported total VTE (Lindstrom 1982). Data show no clear differences in the risk of total VTE between NMES and alternative prophylaxis groups (OR 0.92, 95% CI 0.34 to 2.52, P = 0.88; low‐quality evidence) (Analysis 1.5).
The included studies did not report the other primary and secondary outcome measures of this review for this comparison.
NMES versus no prophylaxis
Total DVT
Four studies, enrolling a total of 576 participants, reported total DVT (Goyal 2012; Hou 2013; Lindstrom 1982; Rosenberg 1975). Prophylaxis with NMES was associated with lower risk of DVT than no prophylaxis (OR 0.40, 95% CI 0.23 to 0.70, P = 0.001; moderate‐quality evidence). Studies show a low level of heterogeneity (I2 = 0%, P = 0.61) (Analysis 2.1) (Figure 5).

Forest plot of comparison: 2 NMES versus no prophylaxis, outcome: 2.1 Total DVT.
Asymptomatic DVT
One study, enrolling a total of 200 participants, reported asymptomatic DVT (Goyal 2012). Data show no clear differences in the risk of asymptomatic DVT between NMES and no prophylaxis groups (OR 0.32, 95% CI 0.06 to 1.62, P = 0.17; low‐quality evidence) (Analysis 2.2).
Symptomatic DVT
One study, enrolling a total of 160 participants, reported symptomatic DVT (Hou 2013). Data show no clear differences in the risk of symptomatic DVT between NMES and no prophylaxis groups (OR 0.06, 95% CI 0.00 to 1.36, P = 0.08; low‐quality evidence) (Analysis 2.3).
PE
One study, enrolling a total of 77 participants, reported PE (Lindstrom 1982). Data show no clear differences in the risk of PE between NMES and no prophylaxis groups (OR 0.36, 95% CI 0.12 to 1.07, P = 0.07; low‐quality evidence) (Analysis 2.4).
Total VTE
One study, enrolling a total of 77 participants, reported total VTE (Lindstrom 1982). Risk of total VTE was lower in the NMES group than in the no prophylaxis group (OR 0.23, 95% CI 0.09 to 0.59, P = 0.002; low‐quality evidence) (Analysis 2.5).
The included studies did not report the other primary and secondary outcome measures of this review for this comparison.
NMES versus low‐dose heparin
Total DVT
Two studies, enrolling a total of 194 participants, reported total DVT (Bostrom 1986; Rosenberg 1975). Prophylaxis with NMES was associated with higher risk of DVT than prophylaxis with low‐dose heparin (OR 2.78, 95% CI 1.19 to 6.48, P = 0.02; low‐quality evidence). Studies show a moderate level of heterogeneity (I2 = 57%, P = 0.13) (Analysis 3.1).
Asymptomatic DVT
One study, enrolling a total of 89 participants, reported asymptomatic DVT (Bostrom 1986). Data show no clear differences in the risk of asymptomatic DVT between NMES and low‐dose heparin groups (OR 1.61, 95% CI 0.40 to 6.43, P = 0.50; low‐quality evidence) (Analysis 3.2).
Symptomatic DVT
One study, enrolling a total of 89 participants, reported symptomatic DVT (Bostrom 1986). Data show no clear differences in the risk of symptomatic DVT between NMES and low‐dose heparin groups (OR 0.40, 95% CI 0.02 to 10.07, P = 0.58; low‐quality evidence) (Analysis 3.3).
The included studies did not report the other primary and secondary outcome measures of this review for this comparison.
NMES versus Dextran 40
Total DVT
One study, enrolling a total of 72 participants, reported total DVT (Lindstrom 1982). Data show no clear differences in the risk of DVT between NMES and Dextran 40 groups (OR 0.63, 95% CI 0.18 to 2.19, P = 0.46; low‐quality evidence) (Analysis 4.1).
PE
One study, enrolling a total of 72 participants, reported PE (Lindstrom 1982). Data show no clear differences in the risk of PE between NMES and Dextran 40 groups (OR 1.50, 95% CI 0.39 to 5.84, P = 0.56; low‐quality evidence) (Analysis 4.2).
Total VTE
One study, enrolling a total of 72 participants, reported total VTE (Lindstrom 1982). Data show no clear differences in the risk of total VTE between NMES and Dextran 40 groups (OR 0.92, 95% CI 0.34 to 2.52, P = 0.88; low‐quality evidence) (Analysis 4.3).
The included studies did not report the other primary and secondary outcome measures of this review for this comparison.
Combined NMES and low‐dose heparin versus no prophylaxis
Total DVT
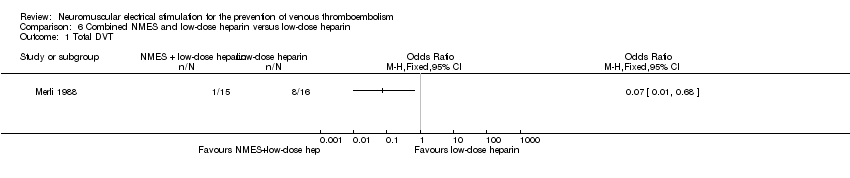
One study, enrolling a total of 32 participants, reported total DVT (Merli 1988). NMES combined with low‐dose heparin was associated with lower risk of DVT when compared with no prophylaxis (OR 0.08, 95% CI 0.01 to 0.76, P = 0.03; low‐quality evidence) (Analysis 5.1).
The included studies did not report the other primary and secondary outcome measures of this review for this comparison.
Combined NMES and low‐dose heparin versus low‐dose heparin
Total DVT
One study, enrolling a total of 31 participants, reported total DVT (Merli 1988). NMES combined with low‐dose heparin was associated with lower risk of DVT when compared with low‐dose heparin alone (OR 0.07, 95% CI 0.01 to 0.68, P = 0.02; low‐quality evidence) (Analysis 6.1).
The included studies did not report the other primary and secondary outcome measures of this review for this comparison.
NMES versus GCS
Total DVT
One study, enrolling a total of 36 participants, reported total DVT (Kiudelis 2002). Data show no clear differences in the risk of DVT between NMES and GCS groups (OR 0.32, 95% CI 0.01 to 8.27, P = 0.49; low‐quality evidence) (Analysis 7.1).
PE
One study, enrolling a total of 36 participants, reported PE (Kiudelis 2002). Data show no clear differences in the risk of PE between NMES and GCS groups (OR 0.32, 95% CI 0.01 to 8.27, P = 0.49; low‐quality evidence) (Analysis 7.2).
The included studies did not report the other primary and secondary outcome measures of this review for this comparison.
NMES versus IPCD
Total DVT
One study, enrolling a total of 36 participants, reported total DVT (Kiudelis 2002). Owing to the occurrence of no DVT in either group, the OR was not estimable (Analysis 8.1).
PE
One study, enrolling a total of 36 participants, reported PE (Kiudelis 2002). Owing to the occurrence of no PE in either group, the OR was not estimable (Analysis 8.2).
The included studies did not report the other primary and secondary outcome measures of this review for this comparison.
Subgroup analysis
We planned to perform subgroup analyses for surgical patients, trauma patients, ICU patients, patients with chronic venous disease, and patients with neurological disorders. However, after considering the limited number of studies, the quality of available data, the heterogeneity of included populations, NMES delivery systems, and the duration and frequency of stimulation, we decided not to perform any subgroup analyses in this review.
Available data did not allow for separate analyses based on individual NMES devices, old NMES devices (those no longer available for use at present), and contemporary NMES devices.
Sensitivity analysis
After considering the limited number of included studies, we performed sensitivity analysis for only one outcome measure in two comparisons (i.e. comparisons for which more than four studies reported the outcome) (Analysis 1.1; Analysis 2.1).
Total DVT in NMES versus alternative prophylaxis comparison
Use of random‐effects or fixed‐effect models did not affect the direction of the effect size (Analysis 1.1). Moreover, the direction of the effect size remained unchanged when pooled RRs or RDs were calculated. Removing one study at a time did not change the direction of the effect size and overall heterogeneity in this analysis. Excluding studies judged to be at high risk of bias did not change the direction of the effect size.
Total DVT in NMES versus no prophylaxis comparison
Use of random‐effects or fixed‐effect models did not affect the direction of the effect size (Analysis 2.1). Moreover, the direction of the effect size remained unchanged when pooled RRs or RDs were calculated. Removing one study at a time did not change the direction of the effect size and overall heterogeneity in this analysis. Excluding studies judged to be at high risk of bias did not change the direction of the effect size.
Discussion
Summary of main results
We conducted a systematic review of randomised controlled trials and quasi‐randomised trials of reported outcomes to evaluate the effectiveness of neuromuscular electrical stimulation systems (NMES) in the prevention of venous thromboembolism (VTE). We included eight trials, enrolling a total of 904 participants. Our results show no differences in the risk of deep vein thrombosis (DVT) between NMES and alternative methods of prophylaxis (odds ratio (OR) 1.01, 95% confidence interval (CI) 0.60 to 1.70, P = 0.98; low‐quality evidence; 6 studies, 415 participants). Our analysis also shows that prophylaxis with NMES was associated with lower risk of DVT compared with no prophylaxis (OR 0.40, 95% CI 0.23 to 0.70, P = 0.02; moderate‐quality evidence; 4 studies, 576 participants); however, prophylaxis with NMES was found to be associated with higher risk of DVT than prophylaxis with low‐dose heparin (OR 2.78, 95% CI 1.19 to 6.48, P = 0.02; low‐quality evidence; 2 studies, 194 participants). Available evidence did not allow us to reach a conclusion regarding the effectiveness of NMES in comparison with other mechanical or pharmacological methods of prophylaxis owing to limited data. The effect of NMES on some clinical outcomes such as symptomatic or asymptomatic DVT, pulmonary embolism (PE), total VTE, bleeding, or patient compliance remains unknown. The included studies were considerably heterogeneous in terms of participant populations and settings; devices and settings used to deliver NMES; duration and frequency of electrical stimulation; and methods used to diagnose VTE.
Overall completeness and applicability of evidence
The best available evidence about the effectiveness of NMES in the prevention of VTE is not adequately robust to allow definitive conclusions. Available evidence shows that NMES when compared with no prophylaxis was associated with lower risk of DVT; this suggests that NMES may be beneficial for individuals who are at high risk for VTE and are unable to receive any other mechanical or pharmacological methods of prophylaxis. However, the available evidence is derived from a very small number of studies with generally small sample sizes. We found inadequate evidence on the effectiveness of NMES versus commonly used mechanical methods of prophylaxis such as graduated compression stockings (GCS) and intermittent pneumatic compression devices (IPCD), which have been shown to be effective in VTE prophylaxis (Pavon 2016; Sachdeva 2014). Available evidence about effects of NMES on clinical VTE outcomes compared with pharmacological methods of prophylaxis is inconclusive. Moreover, the additional effectiveness of NMES combined with other methods of VTE prophylaxis remains unknown.
Bleeding was one of the primary outcomes of the current review that was not reported by any of the included trials. Moreover, none of the included trials reported physiological measurements or freedom from VTE at 90 days as an outcome. Poor patient compliance is one of the principal disadvantages of mechanical methods of prophylaxis. None of the included studies reported patient compliance or NMES device‐related adverse effects; therefore, it remains unclear whether NMES would result in better compliance in comparison with other methods of mechanical prophylaxis.
Heterogeneity among the included studies did not allow us to define the most effective device and setting for delivery of NMES. Moreover, evidence is insufficient to allow defining a group of patients who can benefit most from NMES as a method of VTE prophylaxis.
Quality of the evidence
See summary of findings Table for the main comparison; summary of findings Table 2; summary of findings Table 3; summary of findings Table 4; summary of findings Table 5; summary of findings Table 6; summary of findings Table 7; and summary of findings Table 8.
Overall, the quality of available evidence is low.
Allocation concealment and blinding of participants were inadequate in most of the included trials, subjecting them to high risk of selection and performance bias, respectively. Moreover, included studies show poorly reported blinding of outcome assessment, increasing the likelihood of detection bias. Consequently, the poor reporting and methodological quality of the included trials did not allow us to synthesise robust evidence about the effectiveness of NMES in the prevention of VTE.
For each comparison, a very limited number of studies reported most of the outcomes; therefore, few participants and few events may have led to imprecise effect estimates, reflected by wide confidence intervals for calculated ORs. Moreover, the included studies were heterogeneous in terms of participant populations and settings for delivery of NMES.
Most of the included studies did not contribute to one or more of the primary and secondary outcomes of our review (e.g. bleeding, device‐related adverse effects), subjecting the available evidence to some publication bias.
Potential biases in the review process
To minimise the risk of bias in this review, at least two independent review authors were involved in study selection, data extraction, methodological quality assessment, and data analysis. Some bias in the review process may arise, as the results of two ongoing trials were not available; we will include these trials in future updates of this review (ISRCTN95441725; NCT01935414).
Agreements and disagreements with other studies or reviews
In a recent systematic review of 21 randomised and non‐randomised studies, we identified conflicting evidence on the effect of NMES on the incidence of VTE (Hajibandeh 2015). Moreover, among the studies that compared the incidence of DVT in stimulated versus non‐stimulated legs in the same participant, some reported a reduction in the incidence of DVT in the stimulated leg (Browse 1970; Doran 1967; Nicolaides 2013), whereas others found no difference in the risk of DVT between legs (Doran 1970). NMES has proved experimentally effective in increasing venous blood velocity and flow; however, controversy exists as to whether venous velocity and flow should be used as surrogate outcome measures for the risk of VTE (Hajibandeh 2015). NMES may prevent VTE via other mechanisms. It has been argued that neuromuscular stimulation of the veins provides direct antithrombotic effects as a fourth factor not included in Virchow’s triad; NMES, via neurogenic pathways, may influence this fourth factor and suppress thrombogenesis (Stefanou 2016). This highlights the need for additional studies on the mechanisms of VTE prevention. Although available clinical trials have not reported any outcomes regarding tolerability of NMES, evidence from experimental studies suggests that modern NMES devices appear to be associated with mild pain and discomfort that can potentially lead to good patient compliance (Broderick 2010; Broderick 2013; Moloney 2006; Warwick 2013).

Study flow diagram.

Risk of bias graph: review authors' judgements about each risk of bias item presented as percentages across all included studies.

Risk of bias summary: review authors' judgements about each risk of bias item for each included study.
Forest plot of comparison: 1 NMES versus alternative prophylaxis, outcome: 1.1 Total DVT.

Forest plot of comparison: 2 NMES versus no prophylaxis, outcome: 2.1 Total DVT.
Comparison 1 NMES versus alternative prophylaxis, Outcome 1 Total DVT.

Comparison 1 NMES versus alternative prophylaxis, Outcome 2 Asymptomatic DVT.

Comparison 1 NMES versus alternative prophylaxis, Outcome 3 Symptomatic DVT.
Comparison 1 NMES versus alternative prophylaxis, Outcome 4 PE.
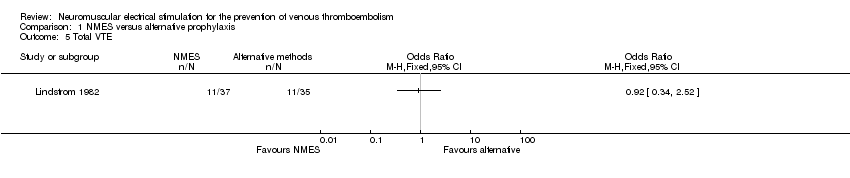
Comparison 1 NMES versus alternative prophylaxis, Outcome 5 Total VTE.

Comparison 2 NMES versus no prophylaxis, Outcome 1 Total DVT.

Comparison 2 NMES versus no prophylaxis, Outcome 2 Asymptomatic DVT.

Comparison 2 NMES versus no prophylaxis, Outcome 3 Symptomatic DVT.
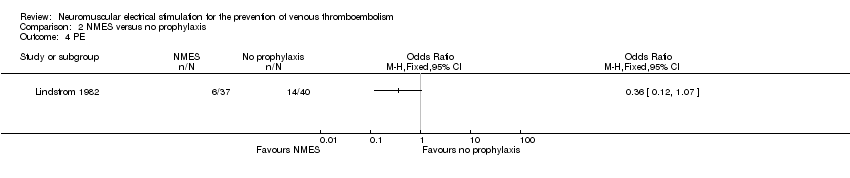
Comparison 2 NMES versus no prophylaxis, Outcome 4 PE.

Comparison 2 NMES versus no prophylaxis, Outcome 5 Total VTE.

Comparison 3 NMES versus low‐dose heparin, Outcome 1 Total DVT.

Comparison 3 NMES versus low‐dose heparin, Outcome 2 Asymptomatic DVT.

Comparison 3 NMES versus low‐dose heparin, Outcome 3 Symptomatic DVT.
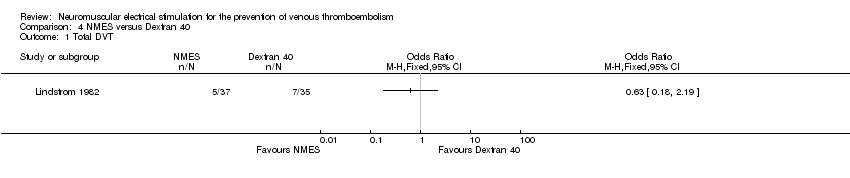
Comparison 4 NMES versus Dextran 40, Outcome 1 Total DVT.
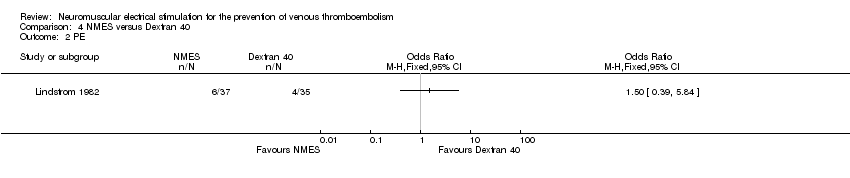
Comparison 4 NMES versus Dextran 40, Outcome 2 PE.
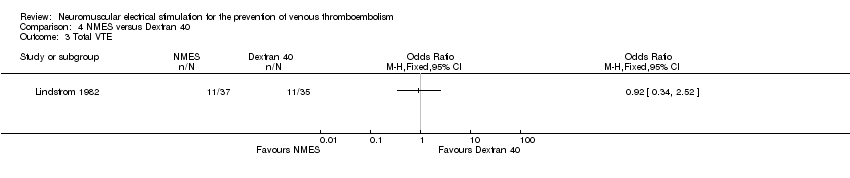
Comparison 4 NMES versus Dextran 40, Outcome 3 Total VTE.

Comparison 5 Combined NMES and low‐dose heparin versus no prophylaxis, Outcome 1 Total DVT.
Comparison 6 Combined NMES and low‐dose heparin versus low‐dose heparin, Outcome 1 Total DVT.
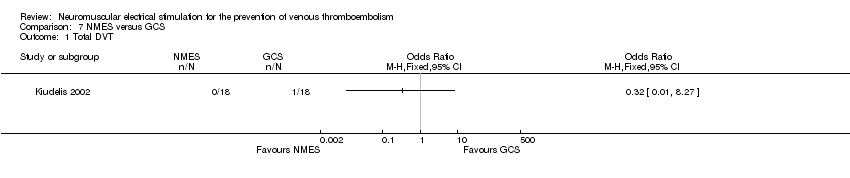
Comparison 7 NMES versus GCS, Outcome 1 Total DVT.

Comparison 7 NMES versus GCS, Outcome 2 PE.
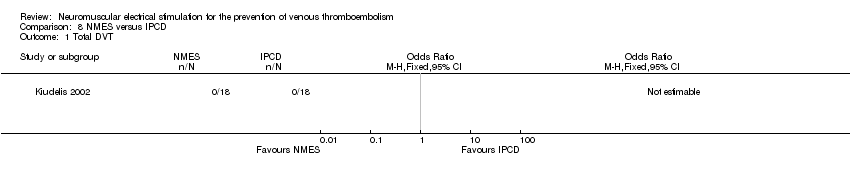
Comparison 8 NMES versus IPCD, Outcome 1 Total DVT.

Comparison 8 NMES versus IPCD, Outcome 2 PE.
| NMES compared to alternative prophylaxis for the prevention of venous thromboembolism | ||||||
| Patient or population: participants at risk of venous thromboembolism | ||||||
| Outcomes | Anticipated absolute effects* (95% CI) | Relative effect | No. of participants | Quality of the evidence | Comments | |
| Risk with alternative prophylaxis | Risk with NMES | |||||
| Total DVT | Study population | OR 1.01 | 415 | ⊕⊕⊝⊝ | ||
| 170 per 1000 | 172 per 1000 | |||||
| Asymptomatic DVT | Study population | OR 1.61 | 89 | ⊕⊕⊝⊝ | ||
| 82 per 1000 | 125 per 1000 | |||||
| Symptomatic DVT | Study population | OR 0.40 | 89 | ⊕⊕⊝⊝ | ||
| 20 per 1000 | 8 per 1000 | |||||
| PE | Study population | OR 1.31 | 126 | ⊕⊕⊝⊝ | ||
| 70 per 1000 | 90 per 1000 | |||||
| Total VTE | Study population | OR 0.92 | 72 | ⊕⊕⊝⊝ | ||
| 314 per 1000 | 297 per 1000 | |||||
| Bleeding (major and minor) | see comment | see comment | not estimable | 415 | ‐ | None of the studies in this comparison reported this outcome. |
| *Assumed control intervention risks were calculated by the mean number of events in control groups of selected studies for each outcome. The risk in the intervention group (and its 95% confidence interval) is based on the assumed risk in the comparison group and the relative effect of the intervention (and its 95% CI). | ||||||
| GRADE Working Group grades of evidence. | ||||||
| aHigh or unclear risk of selection bias, performance bias, and detection bias ‐ downgraded by one level. | ||||||
| NMES compared to no prophylaxis for prevention of venous thromboembolism | ||||||
| Patient or population: participants at risk of venous thromboembolism | ||||||
| Outcomes | Anticipated absolute effects* (95% CI) | Relative effect | No. of participants | Quality of the evidence | Comments | |
| Risk with no prophylaxis | Risk with NMES | |||||
| Total DVT | Study population | OR 0.40 | 576 | ⊕⊕⊕⊝ | ||
| 219 per 1000 | 101 per 1000 | |||||
| Asymptomatic DVT Follow‐up: 7 days | Study population | OR 0.32 | 200 | ⊕⊕⊝⊝ | ||
| 60 per 1000 | 20 per 1000 | |||||
| Symptomatic DVT Follow‐up: 7 days | Study population | OR 0.06 | 160 | ⊕⊕⊝⊝ | ||
| 50 per 1000 | 3 per 1000 | |||||
| PE Follow‐up: 6 days | Study population | OR 0.36 | 77 | ⊕⊕⊝⊝ | ||
| 350 per 1000 | 162 per 1000 | |||||
| Total VTE Follow‐up: 6 days | Study population | OR 0.23 | 77 | ⊕⊕⊝⊝ | ||
| 650 per 1000 | 299 per 1000 | |||||
| Bleeding (major and minor) | see comment | see comment | not estimable | 576 (4 RCTs) | ‐ | None of the studies in this comparison reported this outcome. |
| *Assumed control intervention risks were calculated by the mean number of events in control groups of selected studies for each outcome. The risk in the intervention group (and its 95% confidence interval) is based on the assumed risk in the comparison group and the relative effect of the intervention (and its 95% CI). | ||||||
| GRADE Working Group grades of evidence. | ||||||
| aHigh or unclear risk of selection bias, performance bias, and detection bias ‐ downgraded by one level. | ||||||
| NMES compared to low‐dose heparin for the prevention of venous thromboembolism | ||||||
| Patient or population: participants at risk of venous thromboembolism | ||||||
| Outcomes | Anticipated absolute effects* (95% CI) | Relative effect | No. of participants | Quality of the evidence | Comments | |
| Risk with low‐dose heparin | Risk with NMES | |||||
| Total DVT | Study population | OR 2.78 | 194 | ⊕⊕⊝⊝ | ||
| 87 per 1000 | 208 per 1000 | |||||
| Asymptomatic DVT Follow‐up: 8 days | Study population | OR 1.61 | 89 | ⊕⊕⊝⊝ | ||
| 82 per 1000 | 125 per 1000 | |||||
| Symptomatic DVT Follow‐up: 8 days | Study population | OR 0.40 | 89 | ⊕⊕⊝⊝ | ||
| 20 per 1000 | 8 per 1000 | |||||
| PE | see comment | see comment | not estimable | 194 (2 RCTs) | ‐ | None of the studies in this comparison reported this outcome. |
| Total VTE | see comment | see comment | not estimable | 194 (2 RCTs) | ‐ | None of the studies in this comparison reported this outcome. |
| Bleeding (major and minor) | see comment | see comment | not estimable | 194 (2 RCTs) | ‐ | None of the studies in this comparison reported this outcome. |
| *Assumed control intervention risks were calculated by the mean number of events in control groups of selected studies for each outcome. The risk in the intervention group (and its 95% confidence interval) is based on the assumed risk in the comparison group and the relative effect of the intervention (and its 95% CI). | ||||||
| GRADE Working Group grades of evidence. | ||||||
| aHigh or unclear risk of selection bias, performance bias, and detection bias ‐ downgraded by one level. | ||||||
| NMES compared to Dextran 40 for the prevention of venous thromboembolism | ||||||
| Patient or population: participants at risk of venous thromboembolism | ||||||
| Outcomes | Anticipated absolute effects* (95% CI) | Relative effect | No. of participants | Quality of the evidence | Comments | |
| Risk with Dextran 40 | Risk with NMES | |||||
| Total DVT | Study population | OR 0.63 | 72 | ⊕⊕⊝⊝ | ||
| 200 per 1000 | 136 per 1000 | |||||
| Asymptomatic DVT | see comment | see comment | not estimable | 72 (1 RCT) | ‐ | The single study in this comparison did not report this outcome. |
| Symptomatic DVT | see comment | see comment | not estimable | 72 (1 RCT) | ‐ | The single study in this comparison did not report this outcome. |
| PE Follow‐up: 6 days | Study population | OR 1.50 | 72 | ⊕⊕⊝⊝ | ||
| 114 per 1000 | 162 per 1000 | |||||
| Total VTE Follow‐up: 6 days | Study population | OR 0.92 | 72 | ⊕⊕⊝⊝ | ||
| 314 per 1000 | 297 per 1000 | |||||
| Bleeding (major and minor) | see comment | see comment | not estimable | 72 (1 RCT) | ‐ | The single study in this comparison did not report this outcome. |
| Assumed control intervention risks were calculated by the mean number of events in control groups of selected studies for each outcome. *The risk in the intervention group (and its 95% confidence interval) is based on the assumed risk in the comparison group and the relative effect of the intervention (and its 95% CI). | ||||||
| GRADE Working Group grades of evidence. | ||||||
| aHigh or unclear risk of selection bias, performance bias, and detection bias ‐ downgraded by one level. | ||||||
| Combined NMES and low‐dose heparin compared to no prophylaxis for the prevention of venous thromboembolism | ||||||
| Patient or population: participants at risk of venous thromboembolism | ||||||
| Outcomes | Anticipated absolute effects* (95% CI) | Relative effect | No. of participants | Quality of the evidence | Comments | |
| Risk with no prophylaxis | Risk with combined NMES and low‐dose heparin | |||||
| Total DVT | Study population | OR 0.08 | 32 | ⊕⊕⊝⊝ | ||
| 471 per 1000 | 66 per 1000 | |||||
| Asymptomatic DVT | see comment | see comment | not estimable | 32 (1 RCT) | ‐ | The single study in this comparison did not report this outcome. |
| Symptomatic DVT | see comment | see comment | not estimable | 32 (1 RCT) | ‐ | The single study in this comparison did not report this outcome. |
| PE | see comment | see comment | not estimable | 32 (1 RCT) | ‐ | The single study in this comparison did not report this outcome. |
| Total VTE | see comment | see comment | not estimable | 32 (1 RCT) | ‐ | The single study in this comparison did not report this outcome. |
| Bleeding (major and minor) | see comment | see comment | not estimable | 32 (1 RCT) | ‐ | The single study in this comparison did not report this outcome. |
| *Assumed control intervention risks were calculated by the mean number of events in control groups of selected studies for each outcome. The risk in the intervention group (and its 95% confidence interval) is based on the assumed risk in the comparison group and the relative effect of the intervention (and its 95% CI). | ||||||
| GRADE Working Group grades of evidence. | ||||||
| aHigh or unclear risk of selection bias and detection bias ‐ downgraded by one level. | ||||||
| Combined NMES and low‐dose heparin compared to low‐dose heparin for the prevention of venous thromboembolism | ||||||
| Patient or population: participants at risk of venous thromboembolism | ||||||
| Outcomes | Anticipated absolute effects* (95% CI) | Relative effect | No. of participants | Quality of the evidence | Comments | |
| Risk with low‐dose heparin | Risk with combined NMES and low‐dose heparin | |||||
| Total DVT | Study population | OR 0.07 | 31 | ⊕⊕⊝⊝ | ||
| 500 per 1000 | 65 per 1000 | |||||
| Asymptomatic DVT | see comment | see comment | not estimable | 31 (1 RCT) | ‐ | The single study in this comparison did not report this outcome. |
| Symptomatic DVT | see comment | see comment | not estimable | 31 (1 RCT) | ‐ | The single study in this comparison did not report this outcome. |
| PE | see comment | see comment | not estimable | 31 (1 RCT) | ‐ | The single study in this comparison did not report this outcome. |
| Total VTE | see comment | see comment | not estimable | 31 (1 RCT) | ‐ | The single study in this comparison did not report this outcome. |
| Bleeding (major and minor) | see comment | see comment | not estimable | 31 (1 RCT) | ‐ | The single study in this comparison did not report this outcome. |
| *Assumed control intervention risks were calculated by the mean number of events in control groups of selected studies for each outcome. The risk in the intervention group (and its 95% confidence interval) is based on the assumed risk in the comparison group and the relative effect of the intervention (and its 95% CI). | ||||||
| GRADE Working Group grades of evidence. | ||||||
| aHigh or unclear risk of selection bias and detection bias ‐ downgraded by one level. | ||||||
| NMES compared to GCS for the prevention of venous thromboembolism | ||||||
| Patient or population: participants at risk of venous thromboembolism | ||||||
| Outcomes | Anticipated absolute effects* (95% CI) | Relative effect | No. of participants | Quality of the evidence | Comments | |
| Risk with GCS | Risk with NMES | |||||
| Total DVT | Study population | OR 0.32 | 36 | ⊕⊕⊝⊝ | ||
| 56 per 1000 | 18 per 1000 (1 to 327) | |||||
| Asymptomatic DVT | see comment | see comment | not estimable | 36 (1 RCT) | ‐ | None of the studies in this comparison reported this outcome. |
| Symptomatic DVT | see comment | see comment | not estimable | 36 (1 RCT) | ‐ | None of the studies in this comparison reported this outcome. |
| PE Follow‐up: 1 day | Study population | OR 0.32 | 36 | ⊕⊕⊝⊝ | ||
| 56 per 1000 | 18 per 1000 | |||||
| Total VTE | see comment | see comment | not estimable | 36 (1 RCT) | ‐ | None of the studies in this comparison reported this outcome. |
| Bleeding (major and minor) | see comment | see comment | not estimable | 36 (1 RCT) | ‐ | None of the studies in this comparison reported this outcome. |
| *Assumed control intervention risks were calculated by the mean number of events in control groups of selected studies for each outcome. The risk in the intervention group (and its 95% confidence interval) is based on the assumed risk in the comparison group and the relative effect of the intervention (and its 95% CI). | ||||||
| GRADE Working Group grades of evidence. | ||||||
| aHigh or unclear risk of selection bias, performance bias, and detection bias ‐ downgraded by one level. | ||||||
| NMES compared to IPCD for the prevention of venous thromboembolism | ||||||
| Patient or population: participants at risk of venous thromboembolism | ||||||
| Outcomes | Anticipated absolute effects* (95% CI) | Relative effect | No. of participants | Quality of the evidence | Comments | |
| Risk with IPCD | Risk with NMES | |||||
| Total DVT Follow‐up: 1 day | Study population | not estimable | 36 | ⊕⊕⊝⊝ | No DVT events were recorded. | |
| see comment | see comment | |||||
| Asymptomatic DVT | see comment | see comment | not estimable | 36 (1 RCT) | ‐ | None of the studies in this comparison reported this outcome. |
| Symptomatic DVT | see comment | see comment | not estimable | 36 (1 RCT) | ‐ | None of the studies in this comparison reported this outcome. |
| PE Follow‐up: 1 day | Study population | not estimable | 36 | ⊕⊕⊝⊝ | No PE events were recorded. | |
| see comment | see comment | |||||
| Total VTE | see comment | see comment | not estimable | 36 (1 RCT) | ‐ | None of the studies in this comparison reported this outcome. |
| Bleeding (major and minor) | see comment | see comment | not estimable | 36 (1 RCT) | ‐ | None of the studies in this comparison reported this outcome. |
| *Assumed control intervention risks were calculated by the mean number of events in control groups of selected studies for each outcome. The risk in the intervention group (and its 95% confidence interval) is based on the assumed risk in the comparison group and the relative effect of the intervention (and its 95% CI). | ||||||
| GRADE Working Group grades of evidence. | ||||||
| aHigh or unclear risk of selection bias, performance bias, and detection bias ‐ downgraded by one level. | ||||||
| Study | Device | Frequency (Hz) | Pulse width | Charge (mA) | Voltage (V) | Duration |
| G6805‐II | 30‐100 | NR | NR | 6‐15 | 7 days (20 minutes twice/d) | |
| VEINOPLUS | NR | NR | NR | 15–25 | Only during surgery | |
| Lymphavision | 1.75 | 3 ms | NR | 0‐120 | 7‐14 days (30 minutes twice/d) | |
| Mioritm 021 | NR | NR | 50‐100 | NR | Only during surgery | |
| NR | 10 | 50 μs | NR | NR | 28 days (23 hours/d) | |
| NR | 8 | 50 ms | 40‐50 | NR | 7 days | |
| NR | 8 | 50 ms | 40‐50 | NR | Only during surgery | |
| Thrombophylactor | NR | 50 ms | NR | Adjustable | Only during surgery | |
| NR: rot reported. | ||||||
| Outcome or subgroup title | No. of studies | No. of participants | Statistical method | Effect size |
| 1 Total DVT Show forest plot | 6 | 415 | Odds Ratio (M‐H, Fixed, 95% CI) | 1.01 [0.60, 1.70] |
| 2 Asymptomatic DVT Show forest plot | 1 | Odds Ratio (M‐H, Fixed, 95% CI) | Totals not selected | |
| 3 Symptomatic DVT Show forest plot | 1 | Odds Ratio (M‐H, Fixed, 95% CI) | Totals not selected | |
| 4 PE Show forest plot | 2 | 126 | Odds Ratio (M‐H, Fixed, 95% CI) | 1.31 [0.38, 4.48] |
| 5 Total VTE Show forest plot | 1 | Odds Ratio (M‐H, Fixed, 95% CI) | Totals not selected | |
| Outcome or subgroup title | No. of studies | No. of participants | Statistical method | Effect size |
| 1 Total DVT Show forest plot | 4 | 576 | Odds Ratio (M‐H, Fixed, 95% CI) | 0.40 [0.23, 0.70] |
| 2 Asymptomatic DVT Show forest plot | 1 | Odds Ratio (M‐H, Fixed, 95% CI) | Totals not selected | |
| 3 Symptomatic DVT Show forest plot | 1 | Odds Ratio (M‐H, Fixed, 95% CI) | Totals not selected | |
| 4 PE Show forest plot | 1 | Odds Ratio (M‐H, Fixed, 95% CI) | Totals not selected | |
| 5 Total VTE Show forest plot | 1 | Odds Ratio (M‐H, Fixed, 95% CI) | Totals not selected | |
| Outcome or subgroup title | No. of studies | No. of participants | Statistical method | Effect size |
| 1 Total DVT Show forest plot | 2 | 194 | Odds Ratio (M‐H, Fixed, 95% CI) | 2.78 [1.19, 6.48] |
| 2 Asymptomatic DVT Show forest plot | 1 | Odds Ratio (M‐H, Fixed, 95% CI) | Totals not selected | |
| 3 Symptomatic DVT Show forest plot | 1 | Odds Ratio (M‐H, Fixed, 95% CI) | Totals not selected | |
| Outcome or subgroup title | No. of studies | No. of participants | Statistical method | Effect size |
| 1 Total DVT Show forest plot | 1 | Odds Ratio (M‐H, Fixed, 95% CI) | Totals not selected | |
| 2 PE Show forest plot | 1 | Odds Ratio (M‐H, Fixed, 95% CI) | Totals not selected | |
| 3 Total VTE Show forest plot | 1 | Odds Ratio (M‐H, Fixed, 95% CI) | Totals not selected | |
| Outcome or subgroup title | No. of studies | No. of participants | Statistical method | Effect size |
| 1 Total DVT Show forest plot | 1 | Odds Ratio (M‐H, Fixed, 95% CI) | Totals not selected | |
| Outcome or subgroup title | No. of studies | No. of participants | Statistical method | Effect size |
| 1 Total DVT Show forest plot | 1 | Odds Ratio (M‐H, Fixed, 95% CI) | Totals not selected | |
| Outcome or subgroup title | No. of studies | No. of participants | Statistical method | Effect size |
| 1 Total DVT Show forest plot | 1 | Odds Ratio (M‐H, Fixed, 95% CI) | Totals not selected | |
| 2 PE Show forest plot | 1 | Odds Ratio (M‐H, Fixed, 95% CI) | Totals not selected | |
| Outcome or subgroup title | No. of studies | No. of participants | Statistical method | Effect size |
| 1 Total DVT Show forest plot | 1 | Odds Ratio (M‐H, Fixed, 95% CI) | Totals not selected | |
| 2 PE Show forest plot | 1 | Odds Ratio (M‐H, Fixed, 95% CI) | Totals not selected | |