Ranolazina para la angina de pecho estable
Información
- DOI:
- https://doi.org/10.1002/14651858.CD011747.pub2Copiar DOI

- Base de datos:
-
- Cochrane Database of Systematic Reviews
- Versión publicada:
-
- 08 febrero 2017see what's new
- Tipo:
-
- Intervention
- Etapa:
-
- Review
- Grupo Editorial Cochrane:
-
Grupo Cochrane de Corazón
- Copyright:
-
- Copyright © 2019 The Cochrane Collaboration. Published by John Wiley & Sons, Ltd.
Cifras del artículo
Altmetric:
Citado por:
Autores
Contributions of authors
-
CS: selection of studies, data extraction, risk of bias assessment, data analysis, writing the final review.
-
JB: selection of studies, data extraction, risk of bias assessment, data analysis, writing the final review.
-
JM: selection of studies, data extraction.
-
LV: selection of studies, data extraction, risk of bias assessment, writing the final review.
-
DR: data extraction.
-
CL: data analysis.
Sources of support
Internal sources
-
None, Other.
No sources of support supplied
External sources
-
None, Other.
No sources of support supplied
Declarations of interest
None of the authors received any payment or service from a third party (government, private foundation, other) for any aspect of the submitted work. Relationships that were present during the 36 months prior to publication are reported. None of the authors have any patent, either planned, pending or issued, broadly relevant to the work or have any other relationships or activities that readers could perceive to have influenced, or that give the appearance of potentially influencing, this review.
Acknowledgements
We thank Diane Horsley, Nicole Martin and the peer review editors of the Cochrane Heart Group for their help in developing the protocol and performing the review. Finally, we are especially grateful to Juan Nivin for his contributions to the initial design and development of the review.
Version history
| Published | Title | Stage | Authors | Version |
| 2017 Feb 08 | Ranolazine for stable angina pectoris | Review | Carlos A Salazar, Juan E Basilio Flores, Liz E Veramendi Espinoza, Jhon W Mejia Dolores, Diego E Rey Rodriguez, César Loza Munárriz | |
| 2015 Jun 13 | Ranolazine for stable angina pectoris | Protocol | Carlos A Salazar, Juan E Basilio Flores, Jhon W Mejia Dolores, Liz E Veramendi Espinoza, Diego E Rey Rodriguez, César Loza Munárriz | |
Differences between protocol and review
We changed the minimal duration of follow‐up of outcome measures for inclusion in analysis to one week from six weeks in the protocol, and performed an additional sensitivity analysis restricting to results of outcomes measured with a follow‐up of at least six weeks. We included an additional outcome regarding exercise electrocardiogram (time to 1‐mm ST‐segment depression, measured at peak) as a secondary effectiveness outcome. We added type of stable angina diagnosis (macrovascular versus microvascular) as an additional variable for subgroup analysis. We calculated some missing data using formulae from the Cochrane Handbook, but did not perform imputation of any missing data. Thus, we did not perform sensitivity analysis regarding the method of dealing with missing data.
Keywords
MeSH
Medical Subject Headings (MeSH) Keywords
- Angina, Stable [*drug therapy, mortality, prevention & control];
- Cardiovascular Agents [administration & dosage, adverse effects, *therapeutic use];
- Cause of Death;
- Incidence;
- Myocardial Infarction [epidemiology];
- Quality of Life;
- Randomized Controlled Trials as Topic;
- Ranolazine [administration & dosage, adverse effects, *therapeutic use];
Medical Subject Headings Check Words
Humans; Middle Aged;
PICO
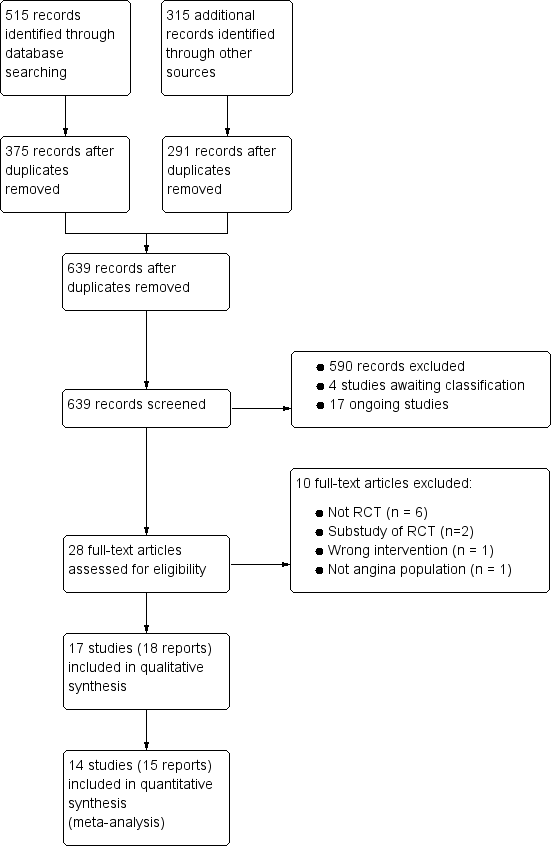
Study flow diagram
†Two included articles report data from the RIVER‐PCI trial
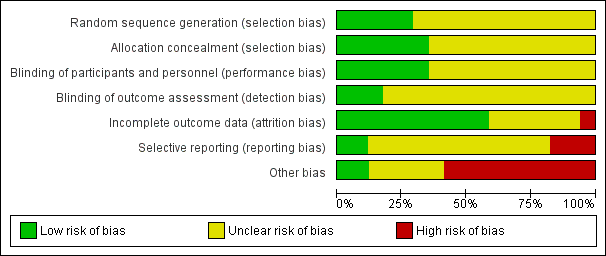
Risk of bias graph: review authors' judgements about each risk of bias item presented as percentages across all included studies
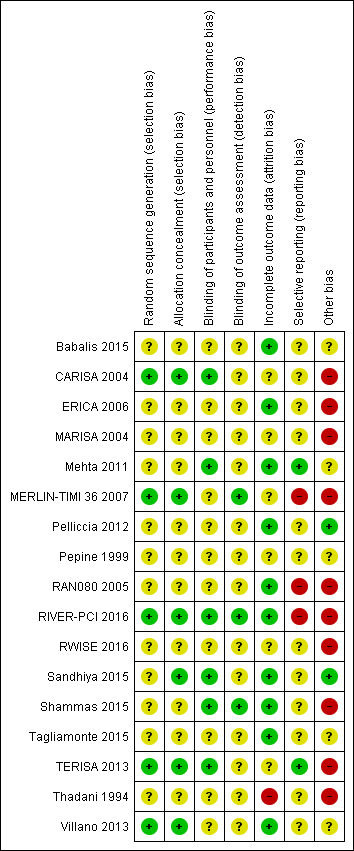
Risk of bias summary: review authors' judgements about each risk of bias item for each included study.
Other bias criteria: we considered the source of funding in this section, we scored high risk of bias if the source of funding was solely from private organisations, unclear risk of bias if it was mixed (private and public) and low risk of bias if it was solely not external or from public organisations.

Comparison 1 Ranolazine (monotherapy) 1000 mg twice daily versus placebo, Outcome 1 Cardiovascular mortality.

Comparison 1 Ranolazine (monotherapy) 1000 mg twice daily versus placebo, Outcome 2 All‐cause mortality.

Comparison 1 Ranolazine (monotherapy) 1000 mg twice daily versus placebo, Outcome 3 Quality of life.

Comparison 1 Ranolazine (monotherapy) 1000 mg twice daily versus placebo, Outcome 4 AMI incidence.
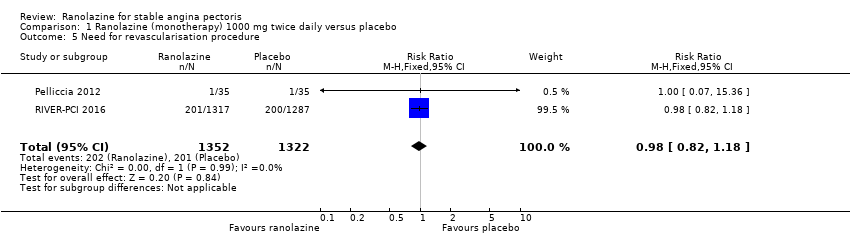
Comparison 1 Ranolazine (monotherapy) 1000 mg twice daily versus placebo, Outcome 5 Need for revascularisation procedure.
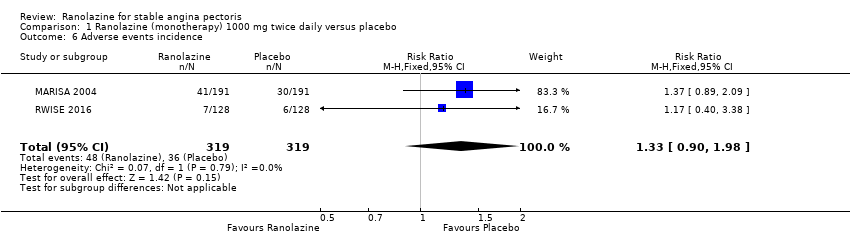
Comparison 1 Ranolazine (monotherapy) 1000 mg twice daily versus placebo, Outcome 6 Adverse events incidence.

Comparison 2 Ranolazine (monotherapy) any dose versus placebo, Outcome 1 AMI incidence.

Comparison 2 Ranolazine (monotherapy) any dose versus placebo, Outcome 2 Angina episodes frequency.

Comparison 2 Ranolazine (monotherapy) any dose versus placebo, Outcome 3 Adverse events incidence.

Comparison 3 Ranolazine (add‐on therapy) 1000 mg twice daily versus placebo, Outcome 1 All‐cause mortality.

Comparison 3 Ranolazine (add‐on therapy) 1000 mg twice daily versus placebo, Outcome 2 Quality of life.

Comparison 3 Ranolazine (add‐on therapy) 1000 mg twice daily versus placebo, Outcome 3 AMI incidence (fatal).

Comparison 3 Ranolazine (add‐on therapy) 1000 mg twice daily versus placebo, Outcome 4 AMI incidence (non‐fatal).
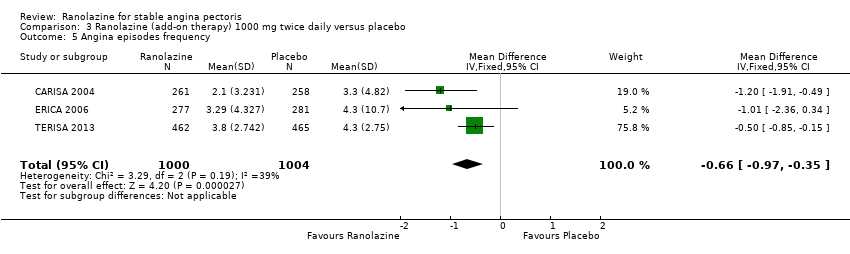
Comparison 3 Ranolazine (add‐on therapy) 1000 mg twice daily versus placebo, Outcome 5 Angina episodes frequency.
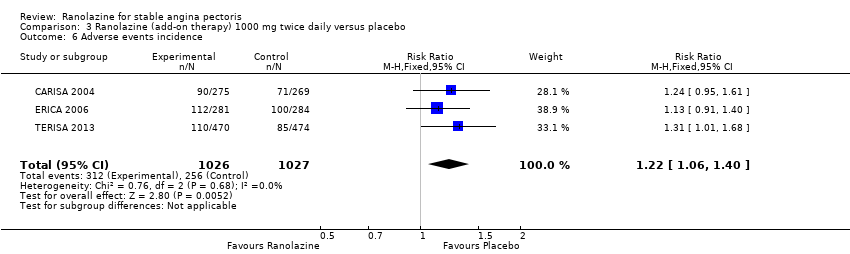
Comparison 3 Ranolazine (add‐on therapy) 1000 mg twice daily versus placebo, Outcome 6 Adverse events incidence.

Comparison 4 Ranolazine (add‐on therapy) any dose versus placebo, Outcome 1 Quality of life.
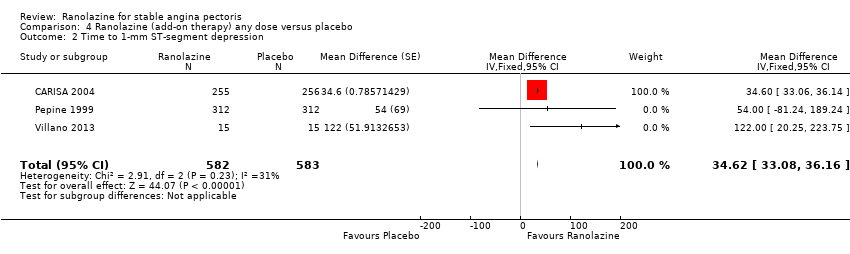
Comparison 4 Ranolazine (add‐on therapy) any dose versus placebo, Outcome 2 Time to 1‐mm ST‐segment depression.
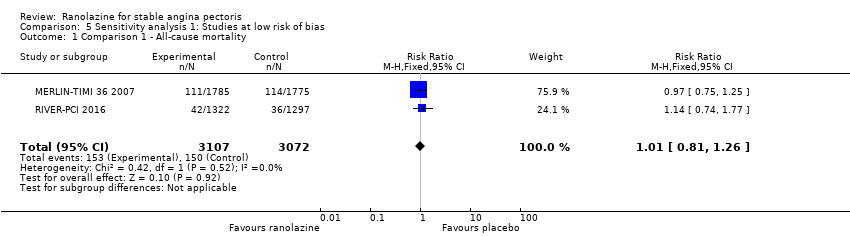
Comparison 5 Sensitivity analysis 1: Studies at low risk of bias, Outcome 1 Comparison 1 ‐ All‐cause mortality.
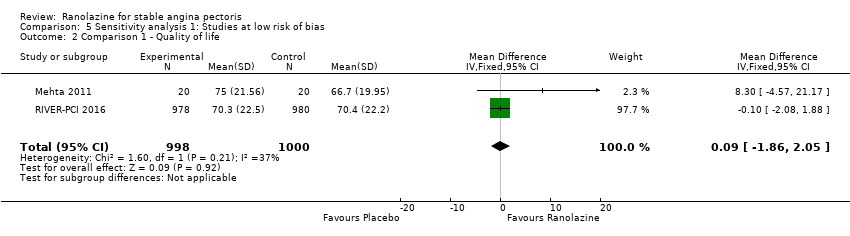
Comparison 5 Sensitivity analysis 1: Studies at low risk of bias, Outcome 2 Comparison 1 ‐ Quality of life.

Comparison 5 Sensitivity analysis 1: Studies at low risk of bias, Outcome 3 Comparison 1 ‐ AMI incidence.
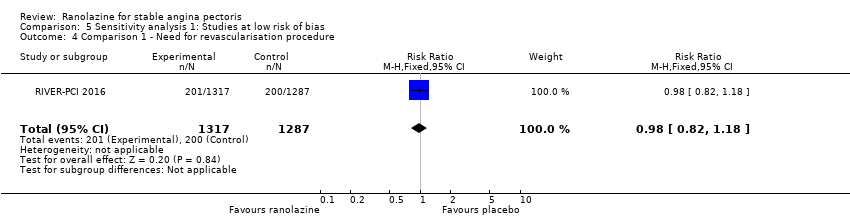
Comparison 5 Sensitivity analysis 1: Studies at low risk of bias, Outcome 4 Comparison 1 ‐ Need for revascularisation procedure.

Comparison 5 Sensitivity analysis 1: Studies at low risk of bias, Outcome 5 Comparison 2 ‐ AMI incidence.

Comparison 5 Sensitivity analysis 1: Studies at low risk of bias, Outcome 6 Comparison 3 ‐ All‐cause mortality.
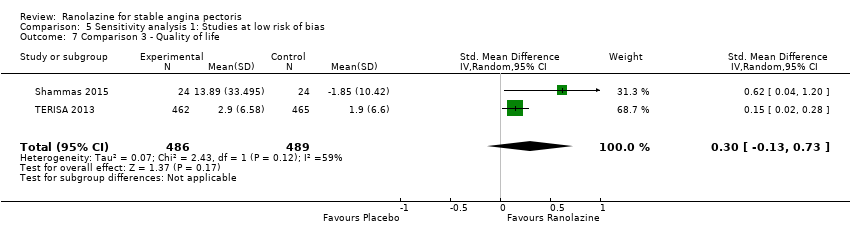
Comparison 5 Sensitivity analysis 1: Studies at low risk of bias, Outcome 7 Comparison 3 ‐ Quality of life.

Comparison 5 Sensitivity analysis 1: Studies at low risk of bias, Outcome 8 Comparison 3 ‐ AMI incidence (fatal).

Comparison 5 Sensitivity analysis 1: Studies at low risk of bias, Outcome 9 Comparison 3 ‐ AMI incidence (non‐fatal).

Comparison 5 Sensitivity analysis 1: Studies at low risk of bias, Outcome 10 Comparison 3 ‐ Angina episodes frequency.
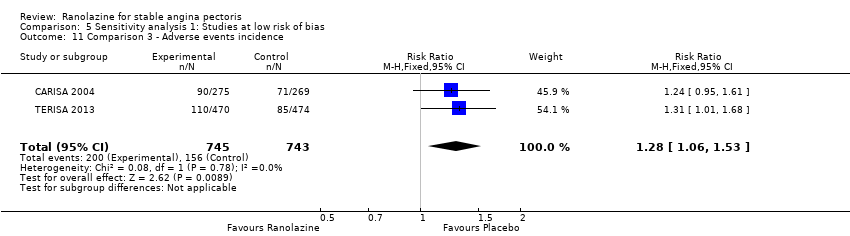
Comparison 5 Sensitivity analysis 1: Studies at low risk of bias, Outcome 11 Comparison 3 ‐ Adverse events incidence.

Comparison 5 Sensitivity analysis 1: Studies at low risk of bias, Outcome 12 Comparison 4 ‐ Quality of life.

Comparison 5 Sensitivity analysis 1: Studies at low risk of bias, Outcome 13 Comparison 4 ‐ Time to 1‐mm ST‐segment depression.
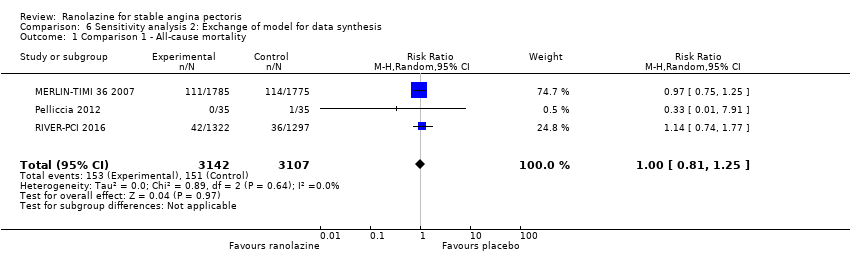
Comparison 6 Sensitivity analysis 2: Exchange of model for data synthesis, Outcome 1 Comparison 1 ‐ All‐cause mortality.

Comparison 6 Sensitivity analysis 2: Exchange of model for data synthesis, Outcome 2 Comparison 1 ‐ Quality of life.

Comparison 6 Sensitivity analysis 2: Exchange of model for data synthesis, Outcome 3 Comparison 1 ‐ AMI incidence.
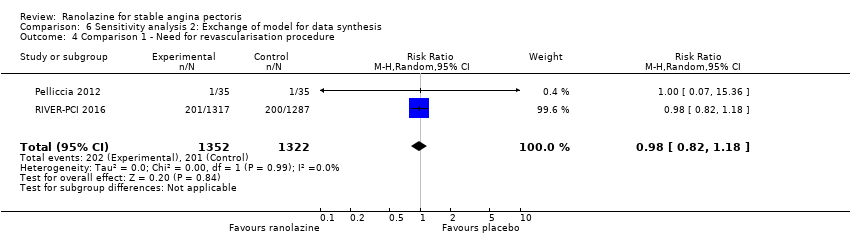
Comparison 6 Sensitivity analysis 2: Exchange of model for data synthesis, Outcome 4 Comparison 1 ‐ Need for revascularisation procedure.

Comparison 6 Sensitivity analysis 2: Exchange of model for data synthesis, Outcome 5 Comparison 1 ‐ Adverse events incidence.

Comparison 6 Sensitivity analysis 2: Exchange of model for data synthesis, Outcome 6 Comparison 2 ‐ AMI incidence.

Comparison 6 Sensitivity analysis 2: Exchange of model for data synthesis, Outcome 7 Comparison 2 ‐ Angina episodes frequency.
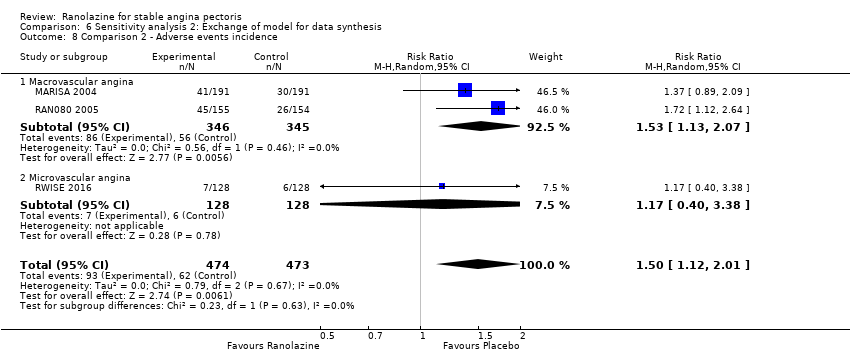
Comparison 6 Sensitivity analysis 2: Exchange of model for data synthesis, Outcome 8 Comparison 2 ‐ Adverse events incidence.

Comparison 6 Sensitivity analysis 2: Exchange of model for data synthesis, Outcome 9 Comparison 3 ‐ All‐cause mortality.

Comparison 6 Sensitivity analysis 2: Exchange of model for data synthesis, Outcome 10 Comparison 3 ‐ Quality of life.

Comparison 6 Sensitivity analysis 2: Exchange of model for data synthesis, Outcome 11 Comparison 3 ‐ AMI incidence (fatal).
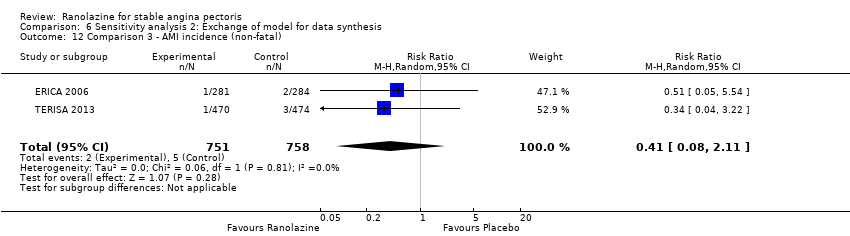
Comparison 6 Sensitivity analysis 2: Exchange of model for data synthesis, Outcome 12 Comparison 3 ‐ AMI incidence (non‐fatal).

Comparison 6 Sensitivity analysis 2: Exchange of model for data synthesis, Outcome 13 Comparison 3 ‐ Angina episodes frequency.
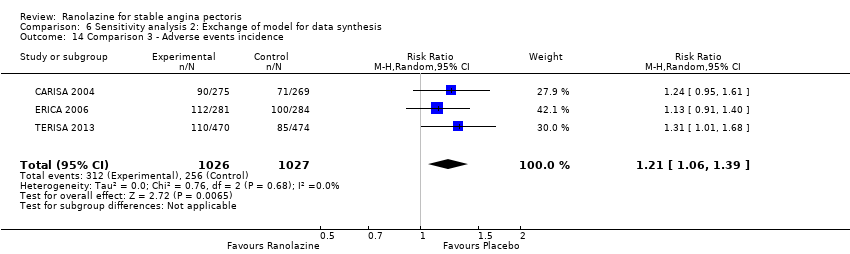
Comparison 6 Sensitivity analysis 2: Exchange of model for data synthesis, Outcome 14 Comparison 3 ‐ Adverse events incidence.
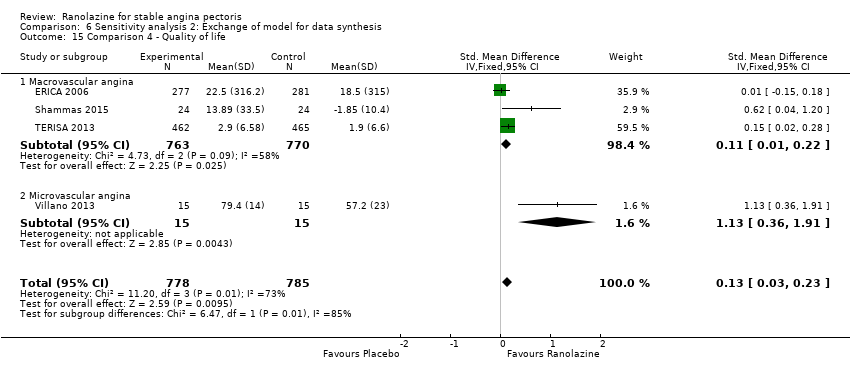
Comparison 6 Sensitivity analysis 2: Exchange of model for data synthesis, Outcome 15 Comparison 4 ‐ Quality of life.

Comparison 6 Sensitivity analysis 2: Exchange of model for data synthesis, Outcome 16 Comparison 4 ‐ Time to 1‐mm ST‐segment depression.

Comparison 7 Sensitivity analysis 3: Change of the measure of treatment effect, Outcome 1 Comparison 1 ‐ All‐cause mortality.

Comparison 7 Sensitivity analysis 3: Change of the measure of treatment effect, Outcome 2 Comparison 1 ‐ Quality of life.
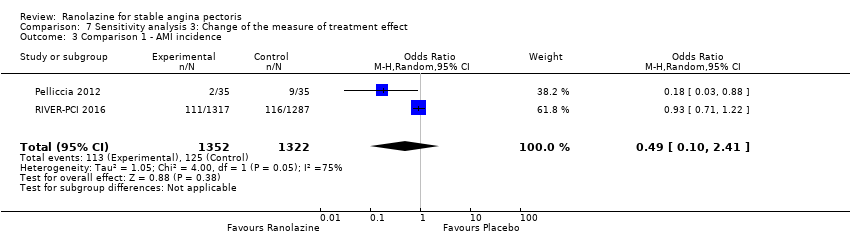
Comparison 7 Sensitivity analysis 3: Change of the measure of treatment effect, Outcome 3 Comparison 1 ‐ AMI incidence.

Comparison 7 Sensitivity analysis 3: Change of the measure of treatment effect, Outcome 4 Comparison 1 ‐ Need for revascularisation procedure.

Comparison 7 Sensitivity analysis 3: Change of the measure of treatment effect, Outcome 5 Comparison 1 ‐ Adverse events incidence.

Comparison 7 Sensitivity analysis 3: Change of the measure of treatment effect, Outcome 6 Comparison 2 ‐ AMI incidence.

Comparison 7 Sensitivity analysis 3: Change of the measure of treatment effect, Outcome 7 Comparison 2 ‐ Angina episodes frequency.
Comparison 7 Sensitivity analysis 3: Change of the measure of treatment effect, Outcome 8 Comparison 2 ‐ Adverse events incidence.
Comparison 7 Sensitivity analysis 3: Change of the measure of treatment effect, Outcome 9 Comparison 3 ‐ All‐cause mortality.

Comparison 7 Sensitivity analysis 3: Change of the measure of treatment effect, Outcome 10 Comparison 3 ‐ Quality of life.

Comparison 7 Sensitivity analysis 3: Change of the measure of treatment effect, Outcome 11 Comparison 3 ‐ AMI incidence (fatal).
Comparison 7 Sensitivity analysis 3: Change of the measure of treatment effect, Outcome 12 Comparison 3 ‐ AMI incidence (non‐fatal).
Comparison 7 Sensitivity analysis 3: Change of the measure of treatment effect, Outcome 13 Comparison 3 ‐ Angina episodes frequency.

Comparison 7 Sensitivity analysis 3: Change of the measure of treatment effect, Outcome 14 Comparison 3 ‐ Adverse events incidence.

Comparison 7 Sensitivity analysis 3: Change of the measure of treatment effect, Outcome 15 Comparison 4 ‐ Quality of life.

Comparison 8 Sensitivity analysis 4: follow‐up ≥ 6 weeks, Outcome 1 Comparison 1 ‐ All‐cause mortality.

Comparison 8 Sensitivity analysis 4: follow‐up ≥ 6 weeks, Outcome 2 Comparison 1 ‐ Quality of life.
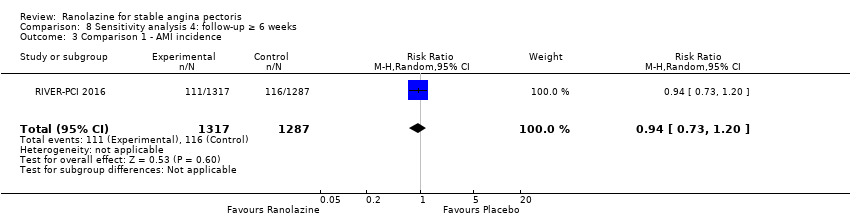
Comparison 8 Sensitivity analysis 4: follow‐up ≥ 6 weeks, Outcome 3 Comparison 1 ‐ AMI incidence.

Comparison 8 Sensitivity analysis 4: follow‐up ≥ 6 weeks, Outcome 4 Comparison 1 ‐ Need for revascularisation procedure.
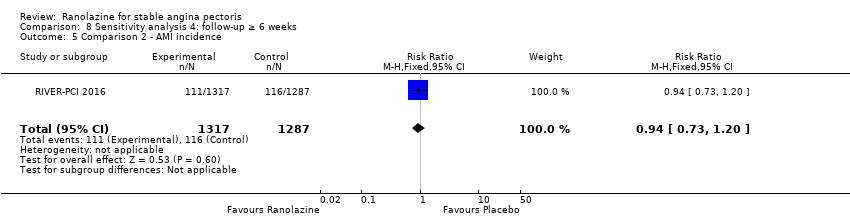
Comparison 8 Sensitivity analysis 4: follow‐up ≥ 6 weeks, Outcome 5 Comparison 2 ‐ AMI incidence.

Comparison 8 Sensitivity analysis 4: follow‐up ≥ 6 weeks, Outcome 6 Comparison 3 ‐ All‐cause mortality.
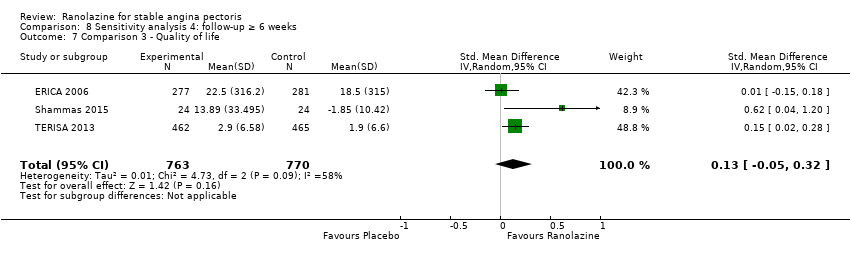
Comparison 8 Sensitivity analysis 4: follow‐up ≥ 6 weeks, Outcome 7 Comparison 3 ‐ Quality of life.

Comparison 8 Sensitivity analysis 4: follow‐up ≥ 6 weeks, Outcome 8 Comparison 3 ‐ AMI incidence (fatal).

Comparison 8 Sensitivity analysis 4: follow‐up ≥ 6 weeks, Outcome 9 Comparison 3 ‐ AMI incidence (non‐fatal).

Comparison 8 Sensitivity analysis 4: follow‐up ≥ 6 weeks, Outcome 10 Comparison 3 ‐ Angina episodes frequency.

Comparison 8 Sensitivity analysis 4: follow‐up ≥ 6 weeks, Outcome 11 Comparison 3 ‐ Adverse events incidence.
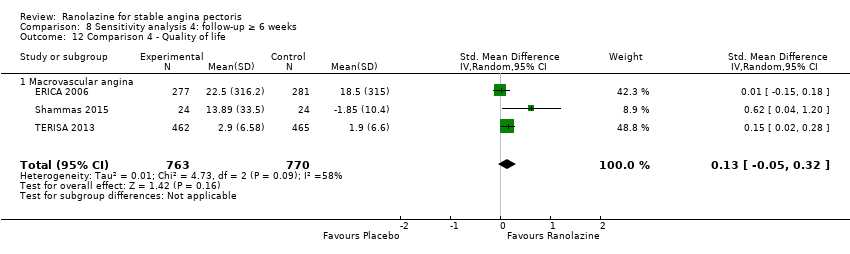
Comparison 8 Sensitivity analysis 4: follow‐up ≥ 6 weeks, Outcome 12 Comparison 4 ‐ Quality of life.

Comparison 8 Sensitivity analysis 4: follow‐up ≥ 6 weeks, Outcome 13 Comparison 4 ‐ Time to 1‐mm ST‐segment depression.
| Ranolazine (add‐on therapy) versus placebo for stable angina pectoris* | ||||||
| Patient or population: patients with stable angina pectoris | ||||||
| Outcomes | Illustrative comparative risks** (95% CI) | Relative effect | No of Participants | Quality of the evidence | Comments | |
| Assumed risk | Corresponding risk | |||||
| Placebo | Ranolazine | |||||
| Cardiovascular mortality ‐ not reported | See comment | See comment | Not estimable | ‐ | See comment | No data were available for this outcome |
| Non‐cardiovascular mortality ‐ not reported | See comment | See comment | Not estimable | ‐ | See comment | No data were available for this outcome |
| All‐cause mortality | 6 per 1000 | 5 per 1000 | RR 0.83 | 2053 | ⊕⊕⊝⊝ | Ranolazine 1000 mg twice daily |
| Quality of life | Mean quality of life in control group participants was | Mean quality of life in intervention group participants was | 1563 | ⊕⊕⊕⊝ | Ranolazine any dose (SMD 0.25, 95% CI ‐0.01 to 0.52) | |
| AMI incidence | 7 per 1000 | 3 per 1000 | RR 0.40 | 1509 | ⊕⊕⊝⊝ | Ranolazine 1000 mg twice daily |
| Angina episodes frequency | Mean angina episode frequency in control group participants was | Mean angina episodes frequency in intervention group participants was | 2004 | ⊕⊕⊕⊝ | Ranolazine 1000 mg twice daily (MD ‐0.66, 95% CI ‐0.97 to ‐0.35) | |
| Adverse events incidence | 241 per 1000 | 294 per 1000 | RR 1.22 | 2123 | ⊕⊕⊕⊝ | Ranolazine 1000 mg twice daily |
| *Add‐on therapy: refers to the addition of ranolazine to an antianginal regimen already in course. The results reported correspond to the comparisons (data and analyses) 3 and 4 of the review (involving ranolazine given at 1000mg twice daily or any dosage); this is specified in the Comments column. **The assumed risk is based on the median control group risk across studies. The corresponding risk (and its 95% confidence interval) is based on the assumed risk in the comparison group and the relative effect of the intervention (and its 95% CI). | ||||||
| GRADE Working Group grades of evidence | ||||||
| ¹ Quality of evidence was downgraded one level due to unclear risk of bias regarding blinding of outcome assessment and incomplete outcome data | ||||||
| Ranolazine (monotherapy) versus placebo for stable angina pectoris* | ||||||
| Patient or population: patients with stable angina pectoris | ||||||
| Outcomes | Illustrative comparative risks** (95% CI) | Relative effect | No of Participants | Quality of the evidence | Comments | |
| Assumed risk | Corresponding risk | |||||
| Placebo | Ranolazine | |||||
| Cardiovascular mortality | 16 per 1000 | 16 per 1000 | RR 1.03 | 2604 | ⊕⊕⊝⊝ | Ranolazine 1000 mg twice daily |
| Non‐cardiovascular mortality ‐ not reported | See comment | See comment | Not estimable | ‐ | See comment | No data were available for this outcome |
| All‐cause mortality | 49 per 1000 | 49 per 1000 | RR 1.00 | 6249 | ⊕⊕⊝⊝ | Ranolazine 1000 mg twice daily |
| Quality of life | Mean quality of life in control group participants was | Mean quality of life in intervention group participants was | 2256 | ⊕⊕⊕⊝ | Ranolazine 1000 mg twice daily (MD 0.28. 95% CI ‐1.57 to 2.13) | |
| AMI incidence | 85 per 1000 | 75 per 1000 | RR 0.88 | 2983 | ⊕⊕⊝⊝ | Ranolazine any dose |
| Angina episodes frequency | Mean angina episode frequency in control group participants was | Mean angina episode frequency in intervention group participants was | 402 | ⊕⊕⊝⊝ | Ranolazine any dose (MD 0.08, 95% CI ‐0.85 to 1.01) | |
| Adverse events incidence | 131 per 1000 | 197 per 1000 | RR 1.50 | 947 | ⊕⊝⊝⊝ | Ranolazine any dose |
| *Monotherapy: refers to the administration of ranolazine as the only antianginal drug. The results reported correspond to the comparisons (data and analyses) 1 and 2 of the review (involving ranolazine given at 1000mg twice daily or any dosage); this is specified in the Comments column. **The assumed risk is based on the median control group risk across studies. The corresponding risk (and its 95% confidence interval) is based on the assumed risk in the comparison group and the relative effect of the intervention (and its 95% CI). | ||||||
| GRADE Working Group grades of evidence | ||||||
| ¹ Quality of evidence was downgraded one level due to unclear risk of bias regarding allocation concealment and high risk of bias regarding selective reporting | ||||||
| Outcome or subgroup title | No. of studies | No. of participants | Statistical method | Effect size |
| 1 Cardiovascular mortality Show forest plot | 1 | 2604 | Risk Ratio (M‐H, Fixed, 95% CI) | 1.03 [0.56, 1.88] |
| 2 All‐cause mortality Show forest plot | 3 | 6249 | Risk Ratio (M‐H, Fixed, 95% CI) | 1.00 [0.81, 1.25] |
| 3 Quality of life Show forest plot | 3 | 2254 | Mean Difference (IV, Fixed, 95% CI) | 0.28 [‐1.57, 2.13] |
| 4 AMI incidence Show forest plot | 2 | 2674 | Risk Ratio (M‐H, Random, 95% CI) | 0.55 [0.14, 2.15] |
| 5 Need for revascularisation procedure Show forest plot | 2 | 2674 | Risk Ratio (M‐H, Fixed, 95% CI) | 0.98 [0.82, 1.18] |
| 6 Adverse events incidence Show forest plot | 2 | 638 | Risk Ratio (M‐H, Fixed, 95% CI) | 1.33 [0.90, 1.98] |
| Outcome or subgroup title | No. of studies | No. of participants | Statistical method | Effect size |
| 1 AMI incidence Show forest plot | 3 | 2983 | Risk Ratio (M‐H, Fixed, 95% CI) | 0.88 [0.69, 1.12] |
| 2 Angina episodes frequency Show forest plot | 2 | 402 | Mean Difference (IV, Fixed, 95% CI) | 0.08 [‐0.85, 1.01] |
| 3 Adverse events incidence Show forest plot | 3 | 947 | Risk Ratio (M‐H, Fixed, 95% CI) | 1.50 [1.12, 2.00] |
| 3.1 Macrovascular angina | 2 | 691 | Risk Ratio (M‐H, Fixed, 95% CI) | 1.53 [1.13, 2.07] |
| 3.2 Microvascular angina | 1 | 256 | Risk Ratio (M‐H, Fixed, 95% CI) | 1.17 [0.40, 3.38] |
| Outcome or subgroup title | No. of studies | No. of participants | Statistical method | Effect size |
| 1 All‐cause mortality Show forest plot | 3 | 2053 | Risk Ratio (M‐H, Fixed, 95% CI) | 0.83 [0.26, 2.71] |
| 2 Quality of life Show forest plot | 3 | 1533 | Std. Mean Difference (IV, Random, 95% CI) | 0.13 [‐0.05, 0.32] |
| 3 AMI incidence (fatal) Show forest plot | 2 | 1509 | Risk Ratio (M‐H, Fixed, 95% CI) | 1.51 [0.25, 9.05] |
| 4 AMI incidence (non‐fatal) Show forest plot | 2 | 1509 | Risk Ratio (M‐H, Fixed, 95% CI) | 0.40 [0.08, 2.07] |
| 5 Angina episodes frequency Show forest plot | 3 | 2004 | Mean Difference (IV, Fixed, 95% CI) | ‐0.66 [‐0.97, ‐0.35] |
| 6 Adverse events incidence Show forest plot | 3 | 2053 | Risk Ratio (M‐H, Fixed, 95% CI) | 1.22 [1.06, 1.40] |
| Outcome or subgroup title | No. of studies | No. of participants | Statistical method | Effect size |
| 1 Quality of life Show forest plot | 4 | 1563 | Std. Mean Difference (IV, Random, 95% CI) | 0.25 [‐0.01, 0.52] |
| 1.1 Macrovascular angina | 3 | 1533 | Std. Mean Difference (IV, Random, 95% CI) | 0.13 [‐0.05, 0.32] |
| 1.2 Microvascular angina | 1 | 30 | Std. Mean Difference (IV, Random, 95% CI) | 1.13 [0.36, 1.91] |
| 2 Time to 1‐mm ST‐segment depression Show forest plot | 3 | 1165 | Mean Difference (Fixed, 95% CI) | 34.62 [33.08, 36.16] |
| Outcome or subgroup title | No. of studies | No. of participants | Statistical method | Effect size |
| 1 Comparison 1 ‐ All‐cause mortality Show forest plot | 2 | 6179 | Risk Ratio (M‐H, Fixed, 95% CI) | 1.01 [0.81, 1.26] |
| 2 Comparison 1 ‐ Quality of life Show forest plot | 2 | 1998 | Mean Difference (IV, Fixed, 95% CI) | 0.09 [‐1.86, 2.05] |
| 3 Comparison 1 ‐ AMI incidence Show forest plot | 1 | 2604 | Risk Ratio (M‐H, Random, 95% CI) | 0.94 [0.73, 1.20] |
| 4 Comparison 1 ‐ Need for revascularisation procedure Show forest plot | 1 | 2604 | Risk Ratio (M‐H, Fixed, 95% CI) | 0.98 [0.82, 1.18] |
| 5 Comparison 2 ‐ AMI incidence Show forest plot | 1 | 2604 | Risk Ratio (M‐H, Fixed, 95% CI) | 0.94 [0.73, 1.20] |
| 6 Comparison 3 ‐ All‐cause mortality Show forest plot | 2 | 1488 | Risk Ratio (M‐H, Fixed, 95% CI) | 0.80 [0.22, 2.95] |
| 7 Comparison 3 ‐ Quality of life Show forest plot | 2 | 975 | Std. Mean Difference (IV, Random, 95% CI) | 0.30 [‐0.13, 0.73] |
| 8 Comparison 3 ‐ AMI incidence (fatal) Show forest plot | 1 | 944 | Risk Ratio (M‐H, Fixed, 95% CI) | 5.04 [0.24, 104.75] |
| 9 Comparison 3 ‐ AMI incidence (non‐fatal) Show forest plot | 1 | 944 | Risk Ratio (M‐H, Fixed, 95% CI) | 0.34 [0.04, 3.22] |
| 10 Comparison 3 ‐ Angina episodes frequency Show forest plot | 2 | 1446 | Mean Difference (IV, Fixed, 95% CI) | ‐0.64 [‐0.96, ‐0.32] |
| 11 Comparison 3 ‐ Adverse events incidence Show forest plot | 2 | 1488 | Risk Ratio (M‐H, Fixed, 95% CI) | 1.28 [1.06, 1.53] |
| 12 Comparison 4 ‐ Quality of life Show forest plot | 3 | 1005 | Std. Mean Difference (IV, Random, 95% CI) | 0.54 [‐0.03, 1.10] |
| 12.1 Macrovascular angina | 2 | 975 | Std. Mean Difference (IV, Random, 95% CI) | 0.30 [‐0.13, 0.73] |
| 12.2 Microvascular angina | 1 | 30 | Std. Mean Difference (IV, Random, 95% CI) | 1.13 [0.36, 1.91] |
| 13 Comparison 4 ‐ Time to 1‐mm ST‐segment depression Show forest plot | 2 | Mean Difference (Fixed, 95% CI) | 34.62 [33.08, 36.16] | |
| Outcome or subgroup title | No. of studies | No. of participants | Statistical method | Effect size |
| 1 Comparison 1 ‐ All‐cause mortality Show forest plot | 3 | 6249 | Risk Ratio (M‐H, Random, 95% CI) | 1.00 [0.81, 1.25] |
| 2 Comparison 1 ‐ Quality of life Show forest plot | 3 | 2254 | Mean Difference (IV, Random, 95% CI) | 0.28 [‐1.57, 2.13] |
| 3 Comparison 1 ‐ AMI incidence Show forest plot | 2 | 2674 | Risk Ratio (M‐H, Fixed, 95% CI) | 0.88 [0.69, 1.13] |
| 4 Comparison 1 ‐ Need for revascularisation procedure Show forest plot | 2 | 2674 | Risk Ratio (M‐H, Random, 95% CI) | 0.98 [0.82, 1.18] |
| 5 Comparison 1 ‐ Adverse events incidence Show forest plot | 2 | 638 | Risk Ratio (M‐H, Random, 95% CI) | 1.34 [0.90, 1.99] |
| 6 Comparison 2 ‐ AMI incidence Show forest plot | 3 | 2983 | Risk Ratio (M‐H, Random, 95% CI) | 0.56 [0.19, 1.63] |
| 7 Comparison 2 ‐ Angina episodes frequency Show forest plot | 2 | 402 | Mean Difference (IV, Random, 95% CI) | 0.08 [‐0.85, 1.01] |
| 8 Comparison 2 ‐ Adverse events incidence Show forest plot | 3 | 947 | Risk Ratio (M‐H, Random, 95% CI) | 1.50 [1.12, 2.01] |
| 8.1 Macrovascular angina | 2 | 691 | Risk Ratio (M‐H, Random, 95% CI) | 1.53 [1.13, 2.07] |
| 8.2 Microvascular angina | 1 | 256 | Risk Ratio (M‐H, Random, 95% CI) | 1.17 [0.40, 3.38] |
| 9 Comparison 3 ‐ All‐cause mortality Show forest plot | 3 | 2053 | Risk Ratio (M‐H, Random, 95% CI) | 0.87 [0.25, 3.04] |
| 10 Comparison 3 ‐ Quality of life Show forest plot | 3 | 1533 | Std. Mean Difference (IV, Fixed, 95% CI) | 0.11 [0.01, 0.22] |
| 11 Comparison 3 ‐ AMI incidence (fatal) Show forest plot | 2 | 1509 | Risk Ratio (M‐H, Random, 95% CI) | 1.37 [0.10, 19.46] |
| 12 Comparison 3 ‐ AMI incidence (non‐fatal) Show forest plot | 2 | 1509 | Risk Ratio (M‐H, Random, 95% CI) | 0.41 [0.08, 2.11] |
| 13 Comparison 3 ‐ Angina episodes frequency Show forest plot | 3 | 2004 | Mean Difference (IV, Random, 95% CI) | ‐0.78 [‐1.28, ‐0.27] |
| 14 Comparison 3 ‐ Adverse events incidence Show forest plot | 3 | 2053 | Risk Ratio (M‐H, Random, 95% CI) | 1.21 [1.06, 1.39] |
| 15 Comparison 4 ‐ Quality of life Show forest plot | 4 | 1563 | Std. Mean Difference (IV, Fixed, 95% CI) | 0.13 [0.03, 0.23] |
| 15.1 Macrovascular angina | 3 | 1533 | Std. Mean Difference (IV, Fixed, 95% CI) | 0.11 [0.01, 0.22] |
| 15.2 Microvascular angina | 1 | 30 | Std. Mean Difference (IV, Fixed, 95% CI) | 1.13 [0.36, 1.91] |
| 16 Comparison 4 ‐ Time to 1‐mm ST‐segment depression Show forest plot | 3 | Mean Difference (Random, 95% CI) | 51.05 [4.05, 98.04] | |
| Outcome or subgroup title | No. of studies | No. of participants | Statistical method | Effect size |
| 1 Comparison 1 ‐ All‐cause mortality Show forest plot | 3 | 6249 | Odds Ratio (M‐H, Fixed, 95% CI) | 1.00 [0.80, 1.27] |
| 2 Comparison 1 ‐ Quality of life Show forest plot | 3 | 2254 | Std. Mean Difference (IV, Fixed, 95% CI) | 0.01 [‐0.07, 0.09] |
| 3 Comparison 1 ‐ AMI incidence Show forest plot | 2 | 2674 | Odds Ratio (M‐H, Random, 95% CI) | 0.49 [0.10, 2.41] |
| 4 Comparison 1 ‐ Need for revascularisation procedure Show forest plot | 2 | 2674 | Odds Ratio (M‐H, Fixed, 95% CI) | 0.98 [0.79, 1.21] |
| 5 Comparison 1 ‐ Adverse events incidence Show forest plot | 2 | 638 | Odds Ratio (M‐H, Fixed, 95% CI) | 1.41 [0.88, 2.26] |
| 6 Comparison 2 ‐ AMI incidence Show forest plot | 3 | 2983 | Odds Ratio (M‐H, Fixed, 95% CI) | 0.87 [0.67, 1.13] |
| 7 Comparison 2 ‐ Angina episodes frequency Show forest plot | 2 | 402 | Std. Mean Difference (IV, Fixed, 95% CI) | 0.01 [‐0.19, 0.20] |
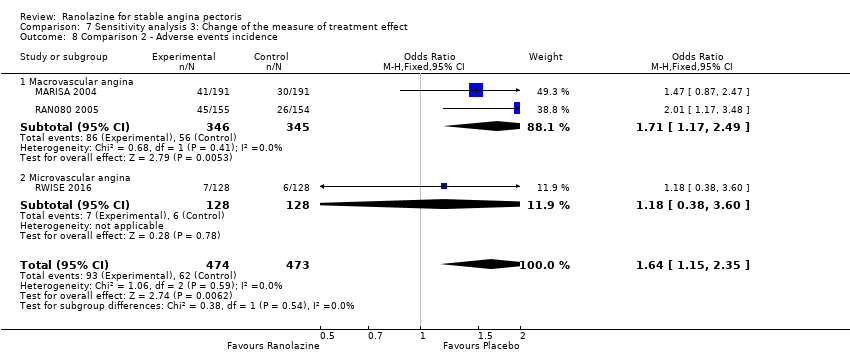
| 8 Comparison 2 ‐ Adverse events incidence Show forest plot | 3 | 947 | Odds Ratio (M‐H, Fixed, 95% CI) | 1.64 [1.15, 2.35] |
| 8.1 Macrovascular angina | 2 | 691 | Odds Ratio (M‐H, Fixed, 95% CI) | 1.71 [1.17, 2.49] |
| 8.2 Microvascular angina | 1 | 256 | Odds Ratio (M‐H, Fixed, 95% CI) | 1.18 [0.38, 3.60] |
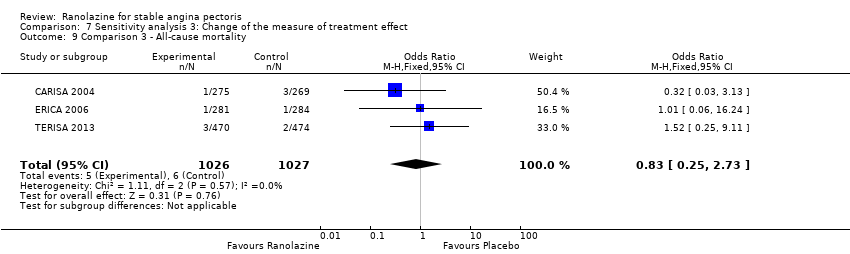
| 9 Comparison 3 ‐ All‐cause mortality Show forest plot | 3 | 2053 | Odds Ratio (M‐H, Fixed, 95% CI) | 0.83 [0.25, 2.73] |
| 10 Comparison 3 ‐ Quality of life Show forest plot | 3 | 1533 | Mean Difference (IV, Random, 95% CI) | 5.91 [‐5.52, 17.34] |
| 11 Comparison 3 ‐ AMI incidence (fatal) Show forest plot | 2 | 1509 | Odds Ratio (M‐H, Fixed, 95% CI) | 1.52 [0.25, 9.09] |
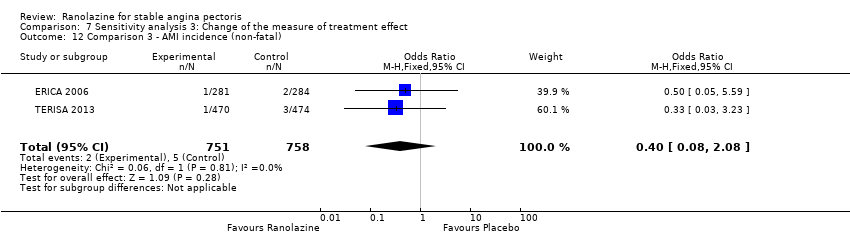
| 12 Comparison 3 ‐ AMI incidence (non‐fatal) Show forest plot | 2 | 1509 | Odds Ratio (M‐H, Fixed, 95% CI) | 0.40 [0.08, 2.08] |
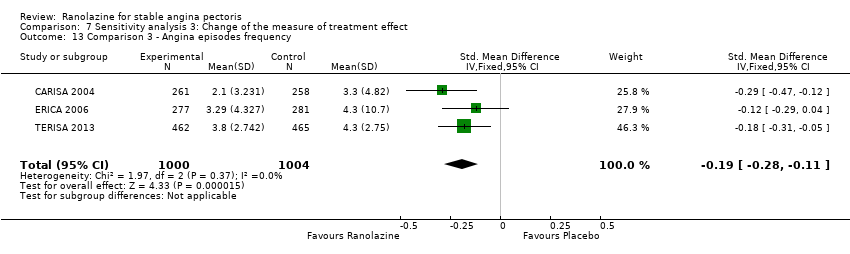
| 13 Comparison 3 ‐ Angina episodes frequency Show forest plot | 3 | 2004 | Std. Mean Difference (IV, Fixed, 95% CI) | ‐0.19 [‐0.28, ‐0.11] |
| 14 Comparison 3 ‐ Adverse events incidence Show forest plot | 3 | 2053 | Odds Ratio (M‐H, Fixed, 95% CI) | 1.32 [1.09, 1.61] |
| 15 Comparison 4 ‐ Quality of life Show forest plot | 4 | 1563 | Mean Difference (IV, Random, 95% CI) | 11.17 [‐2.54, 24.87] |
| 15.1 Macrovascular angina | 3 | 1533 | Mean Difference (IV, Random, 95% CI) | 5.91 [‐5.52, 17.34] |
| 15.2 Microvascular angina | 1 | 30 | Mean Difference (IV, Random, 95% CI) | 22.20 [8.57, 35.83] |
| Outcome or subgroup title | No. of studies | No. of participants | Statistical method | Effect size |
| 1 Comparison 1 ‐ All‐cause mortality Show forest plot | 2 | 6179 | Risk Ratio (M‐H, Fixed, 95% CI) | 1.01 [0.81, 1.26] |
| 2 Comparison 1 ‐ Quality of life Show forest plot | 1 | 1958 | Mean Difference (IV, Fixed, 95% CI) | ‐0.10 [‐2.08, 1.88] |
| 3 Comparison 1 ‐ AMI incidence Show forest plot | 1 | 2604 | Risk Ratio (M‐H, Random, 95% CI) | 0.94 [0.73, 1.20] |
| 4 Comparison 1 ‐ Need for revascularisation procedure Show forest plot | 1 | 2604 | Risk Ratio (M‐H, Fixed, 95% CI) | 0.98 [0.82, 1.18] |
| 5 Comparison 2 ‐ AMI incidence Show forest plot | 1 | 2604 | Risk Ratio (M‐H, Fixed, 95% CI) | 0.94 [0.73, 1.20] |
| 6 Comparison 3 ‐ All‐cause mortality Show forest plot | 3 | 2053 | Risk Ratio (M‐H, Fixed, 95% CI) | 0.83 [0.26, 2.71] |
| 7 Comparison 3 ‐ Quality of life Show forest plot | 3 | 1533 | Std. Mean Difference (IV, Random, 95% CI) | 0.13 [‐0.05, 0.32] |
| 8 Comparison 3 ‐ AMI incidence (fatal) Show forest plot | 2 | 1509 | Risk Ratio (M‐H, Fixed, 95% CI) | 1.51 [0.25, 9.05] |
| 9 Comparison 3 ‐ AMI incidence (non‐fatal) Show forest plot | 2 | 1509 | Risk Ratio (M‐H, Fixed, 95% CI) | 0.40 [0.08, 2.07] |
| 10 Comparison 3 ‐ Angina episodes frequency Show forest plot | 3 | 2004 | Mean Difference (IV, Fixed, 95% CI) | ‐0.66 [‐0.97, ‐0.35] |
| 11 Comparison 3 ‐ Adverse events incidence Show forest plot | 3 | 2053 | Risk Ratio (M‐H, Fixed, 95% CI) | 1.22 [1.06, 1.40] |
| 12 Comparison 4 ‐ Quality of life Show forest plot | 3 | 1533 | Std. Mean Difference (IV, Random, 95% CI) | 0.13 [‐0.05, 0.32] |
| 12.1 Macrovascular angina | 3 | 1533 | Std. Mean Difference (IV, Random, 95% CI) | 0.13 [‐0.05, 0.32] |
| 13 Comparison 4 ‐ Time to 1‐mm ST‐segment depression Show forest plot | 1 | Mean Difference (Fixed, 95% CI) | 34.6 [33.06, 36.14] | |