Scolaris Content Display Scolaris Content Display

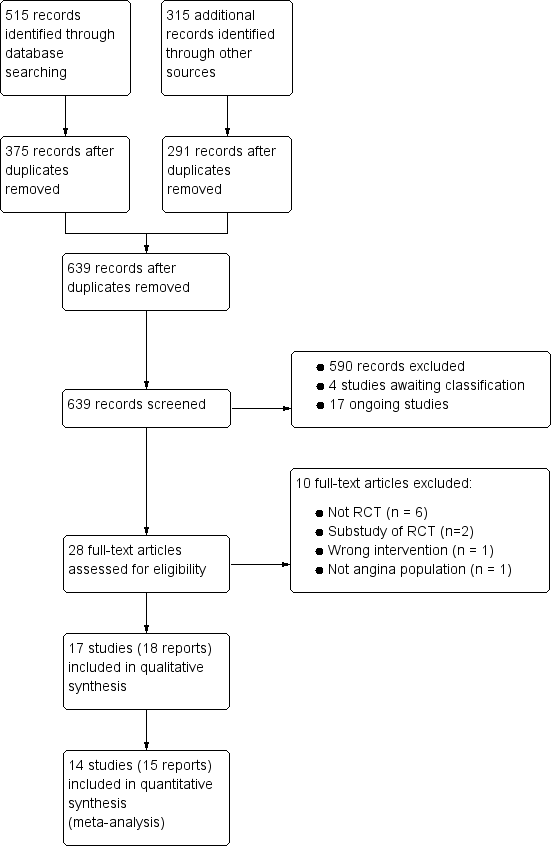
Study flow diagram†Two included articles report data from the RIVER‐PCI trial
Figuras y tablas -
Figure 1

Study flow diagram

Two included articles report data from the RIVER‐PCI trial

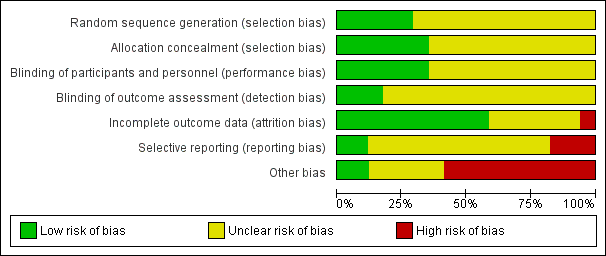
Risk of bias graph: review authors' judgements about each risk of bias item presented as percentages across all included studies
Figuras y tablas -
Figure 2

Risk of bias graph: review authors' judgements about each risk of bias item presented as percentages across all included studies

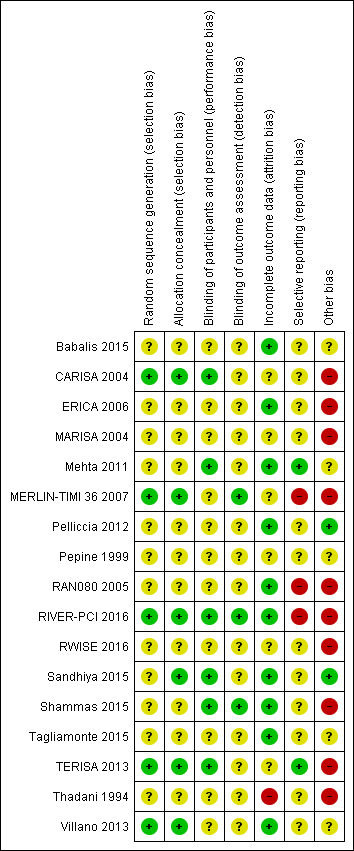
Risk of bias summary: review authors' judgements about each risk of bias item for each included study. Other bias criteria: we considered the source of funding in this section, we scored high risk of bias if the source of funding was solely from private organisations, unclear risk of bias if it was mixed (private and public) and low risk of bias if it was solely not external or from public organisations.
Figuras y tablas -
Figure 3

Risk of bias summary: review authors' judgements about each risk of bias item for each included study.

Other bias criteria: we considered the source of funding in this section, we scored high risk of bias if the source of funding was solely from private organisations, unclear risk of bias if it was mixed (private and public) and low risk of bias if it was solely not external or from public organisations.

Comparison 1 Ranolazine (monotherapy) 1000 mg twice daily versus placebo, Outcome 1 Cardiovascular mortality.
Figuras y tablas -
Analysis 1.1

Comparison 1 Ranolazine (monotherapy) 1000 mg twice daily versus placebo, Outcome 1 Cardiovascular mortality.

Comparison 1 Ranolazine (monotherapy) 1000 mg twice daily versus placebo, Outcome 2 All‐cause mortality.
Figuras y tablas -
Analysis 1.2

Comparison 1 Ranolazine (monotherapy) 1000 mg twice daily versus placebo, Outcome 2 All‐cause mortality.

Comparison 1 Ranolazine (monotherapy) 1000 mg twice daily versus placebo, Outcome 3 Quality of life.
Figuras y tablas -
Analysis 1.3

Comparison 1 Ranolazine (monotherapy) 1000 mg twice daily versus placebo, Outcome 3 Quality of life.

Comparison 1 Ranolazine (monotherapy) 1000 mg twice daily versus placebo, Outcome 4 AMI incidence.
Figuras y tablas -
Analysis 1.4

Comparison 1 Ranolazine (monotherapy) 1000 mg twice daily versus placebo, Outcome 4 AMI incidence.

Comparison 1 Ranolazine (monotherapy) 1000 mg twice daily versus placebo, Outcome 5 Need for revascularisation procedure.
Figuras y tablas -
Analysis 1.5

Comparison 1 Ranolazine (monotherapy) 1000 mg twice daily versus placebo, Outcome 5 Need for revascularisation procedure.

Comparison 1 Ranolazine (monotherapy) 1000 mg twice daily versus placebo, Outcome 6 Adverse events incidence.
Figuras y tablas -
Analysis 1.6

Comparison 1 Ranolazine (monotherapy) 1000 mg twice daily versus placebo, Outcome 6 Adverse events incidence.

Comparison 2 Ranolazine (monotherapy) any dose versus placebo, Outcome 1 AMI incidence.
Figuras y tablas -
Analysis 2.1

Comparison 2 Ranolazine (monotherapy) any dose versus placebo, Outcome 1 AMI incidence.

Comparison 2 Ranolazine (monotherapy) any dose versus placebo, Outcome 2 Angina episodes frequency.
Figuras y tablas -
Analysis 2.2

Comparison 2 Ranolazine (monotherapy) any dose versus placebo, Outcome 2 Angina episodes frequency.

Comparison 2 Ranolazine (monotherapy) any dose versus placebo, Outcome 3 Adverse events incidence.
Figuras y tablas -
Analysis 2.3

Comparison 2 Ranolazine (monotherapy) any dose versus placebo, Outcome 3 Adverse events incidence.

Comparison 3 Ranolazine (add‐on therapy) 1000 mg twice daily versus placebo, Outcome 1 All‐cause mortality.
Figuras y tablas -
Analysis 3.1

Comparison 3 Ranolazine (add‐on therapy) 1000 mg twice daily versus placebo, Outcome 1 All‐cause mortality.

Comparison 3 Ranolazine (add‐on therapy) 1000 mg twice daily versus placebo, Outcome 2 Quality of life.
Figuras y tablas -
Analysis 3.2

Comparison 3 Ranolazine (add‐on therapy) 1000 mg twice daily versus placebo, Outcome 2 Quality of life.

Comparison 3 Ranolazine (add‐on therapy) 1000 mg twice daily versus placebo, Outcome 3 AMI incidence (fatal).
Figuras y tablas -
Analysis 3.3

Comparison 3 Ranolazine (add‐on therapy) 1000 mg twice daily versus placebo, Outcome 3 AMI incidence (fatal).

Comparison 3 Ranolazine (add‐on therapy) 1000 mg twice daily versus placebo, Outcome 4 AMI incidence (non‐fatal).
Figuras y tablas -
Analysis 3.4

Comparison 3 Ranolazine (add‐on therapy) 1000 mg twice daily versus placebo, Outcome 4 AMI incidence (non‐fatal).

Comparison 3 Ranolazine (add‐on therapy) 1000 mg twice daily versus placebo, Outcome 5 Angina episodes frequency.
Figuras y tablas -
Analysis 3.5

Comparison 3 Ranolazine (add‐on therapy) 1000 mg twice daily versus placebo, Outcome 5 Angina episodes frequency.

Comparison 3 Ranolazine (add‐on therapy) 1000 mg twice daily versus placebo, Outcome 6 Adverse events incidence.
Figuras y tablas -
Analysis 3.6

Comparison 3 Ranolazine (add‐on therapy) 1000 mg twice daily versus placebo, Outcome 6 Adverse events incidence.

Comparison 4 Ranolazine (add‐on therapy) any dose versus placebo, Outcome 1 Quality of life.
Figuras y tablas -
Analysis 4.1

Comparison 4 Ranolazine (add‐on therapy) any dose versus placebo, Outcome 1 Quality of life.

Comparison 4 Ranolazine (add‐on therapy) any dose versus placebo, Outcome 2 Time to 1‐mm ST‐segment depression.
Figuras y tablas -
Analysis 4.2

Comparison 4 Ranolazine (add‐on therapy) any dose versus placebo, Outcome 2 Time to 1‐mm ST‐segment depression.

Comparison 5 Sensitivity analysis 1: Studies at low risk of bias, Outcome 1 Comparison 1 ‐ All‐cause mortality.
Figuras y tablas -
Analysis 5.1

Comparison 5 Sensitivity analysis 1: Studies at low risk of bias, Outcome 1 Comparison 1 ‐ All‐cause mortality.

Comparison 5 Sensitivity analysis 1: Studies at low risk of bias, Outcome 2 Comparison 1 ‐ Quality of life.
Figuras y tablas -
Analysis 5.2

Comparison 5 Sensitivity analysis 1: Studies at low risk of bias, Outcome 2 Comparison 1 ‐ Quality of life.

Comparison 5 Sensitivity analysis 1: Studies at low risk of bias, Outcome 3 Comparison 1 ‐ AMI incidence.
Figuras y tablas -
Analysis 5.3

Comparison 5 Sensitivity analysis 1: Studies at low risk of bias, Outcome 3 Comparison 1 ‐ AMI incidence.

Comparison 5 Sensitivity analysis 1: Studies at low risk of bias, Outcome 4 Comparison 1 ‐ Need for revascularisation procedure.
Figuras y tablas -
Analysis 5.4

Comparison 5 Sensitivity analysis 1: Studies at low risk of bias, Outcome 4 Comparison 1 ‐ Need for revascularisation procedure.

Comparison 5 Sensitivity analysis 1: Studies at low risk of bias, Outcome 5 Comparison 2 ‐ AMI incidence.
Figuras y tablas -
Analysis 5.5

Comparison 5 Sensitivity analysis 1: Studies at low risk of bias, Outcome 5 Comparison 2 ‐ AMI incidence.

Comparison 5 Sensitivity analysis 1: Studies at low risk of bias, Outcome 6 Comparison 3 ‐ All‐cause mortality.
Figuras y tablas -
Analysis 5.6

Comparison 5 Sensitivity analysis 1: Studies at low risk of bias, Outcome 6 Comparison 3 ‐ All‐cause mortality.

Comparison 5 Sensitivity analysis 1: Studies at low risk of bias, Outcome 7 Comparison 3 ‐ Quality of life.
Figuras y tablas -
Analysis 5.7

Comparison 5 Sensitivity analysis 1: Studies at low risk of bias, Outcome 7 Comparison 3 ‐ Quality of life.

Comparison 5 Sensitivity analysis 1: Studies at low risk of bias, Outcome 8 Comparison 3 ‐ AMI incidence (fatal).
Figuras y tablas -
Analysis 5.8

Comparison 5 Sensitivity analysis 1: Studies at low risk of bias, Outcome 8 Comparison 3 ‐ AMI incidence (fatal).

Comparison 5 Sensitivity analysis 1: Studies at low risk of bias, Outcome 9 Comparison 3 ‐ AMI incidence (non‐fatal).
Figuras y tablas -
Analysis 5.9

Comparison 5 Sensitivity analysis 1: Studies at low risk of bias, Outcome 9 Comparison 3 ‐ AMI incidence (non‐fatal).

Comparison 5 Sensitivity analysis 1: Studies at low risk of bias, Outcome 10 Comparison 3 ‐ Angina episodes frequency.
Figuras y tablas -
Analysis 5.10

Comparison 5 Sensitivity analysis 1: Studies at low risk of bias, Outcome 10 Comparison 3 ‐ Angina episodes frequency.

Comparison 5 Sensitivity analysis 1: Studies at low risk of bias, Outcome 11 Comparison 3 ‐ Adverse events incidence.
Figuras y tablas -
Analysis 5.11

Comparison 5 Sensitivity analysis 1: Studies at low risk of bias, Outcome 11 Comparison 3 ‐ Adverse events incidence.

Comparison 5 Sensitivity analysis 1: Studies at low risk of bias, Outcome 12 Comparison 4 ‐ Quality of life.
Figuras y tablas -
Analysis 5.12

Comparison 5 Sensitivity analysis 1: Studies at low risk of bias, Outcome 12 Comparison 4 ‐ Quality of life.

Comparison 5 Sensitivity analysis 1: Studies at low risk of bias, Outcome 13 Comparison 4 ‐ Time to 1‐mm ST‐segment depression.
Figuras y tablas -
Analysis 5.13

Comparison 5 Sensitivity analysis 1: Studies at low risk of bias, Outcome 13 Comparison 4 ‐ Time to 1‐mm ST‐segment depression.

Comparison 6 Sensitivity analysis 2: Exchange of model for data synthesis, Outcome 1 Comparison 1 ‐ All‐cause mortality.
Figuras y tablas -
Analysis 6.1

Comparison 6 Sensitivity analysis 2: Exchange of model for data synthesis, Outcome 1 Comparison 1 ‐ All‐cause mortality.

Comparison 6 Sensitivity analysis 2: Exchange of model for data synthesis, Outcome 2 Comparison 1 ‐ Quality of life.
Figuras y tablas -
Analysis 6.2

Comparison 6 Sensitivity analysis 2: Exchange of model for data synthesis, Outcome 2 Comparison 1 ‐ Quality of life.

Comparison 6 Sensitivity analysis 2: Exchange of model for data synthesis, Outcome 3 Comparison 1 ‐ AMI incidence.
Figuras y tablas -
Analysis 6.3

Comparison 6 Sensitivity analysis 2: Exchange of model for data synthesis, Outcome 3 Comparison 1 ‐ AMI incidence.

Comparison 6 Sensitivity analysis 2: Exchange of model for data synthesis, Outcome 4 Comparison 1 ‐ Need for revascularisation procedure.
Figuras y tablas -
Analysis 6.4

Comparison 6 Sensitivity analysis 2: Exchange of model for data synthesis, Outcome 4 Comparison 1 ‐ Need for revascularisation procedure.

Comparison 6 Sensitivity analysis 2: Exchange of model for data synthesis, Outcome 5 Comparison 1 ‐ Adverse events incidence.
Figuras y tablas -
Analysis 6.5

Comparison 6 Sensitivity analysis 2: Exchange of model for data synthesis, Outcome 5 Comparison 1 ‐ Adverse events incidence.

Comparison 6 Sensitivity analysis 2: Exchange of model for data synthesis, Outcome 6 Comparison 2 ‐ AMI incidence.
Figuras y tablas -
Analysis 6.6

Comparison 6 Sensitivity analysis 2: Exchange of model for data synthesis, Outcome 6 Comparison 2 ‐ AMI incidence.

Comparison 6 Sensitivity analysis 2: Exchange of model for data synthesis, Outcome 7 Comparison 2 ‐ Angina episodes frequency.
Figuras y tablas -
Analysis 6.7

Comparison 6 Sensitivity analysis 2: Exchange of model for data synthesis, Outcome 7 Comparison 2 ‐ Angina episodes frequency.

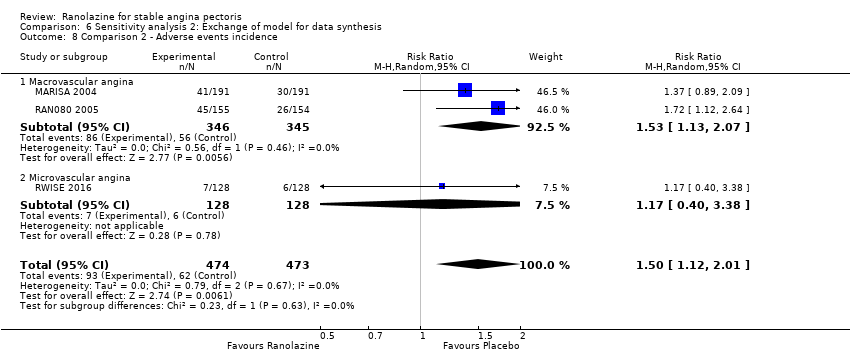
Comparison 6 Sensitivity analysis 2: Exchange of model for data synthesis, Outcome 8 Comparison 2 ‐ Adverse events incidence.
Figuras y tablas -
Analysis 6.8

Comparison 6 Sensitivity analysis 2: Exchange of model for data synthesis, Outcome 8 Comparison 2 ‐ Adverse events incidence.

Comparison 6 Sensitivity analysis 2: Exchange of model for data synthesis, Outcome 9 Comparison 3 ‐ All‐cause mortality.
Figuras y tablas -
Analysis 6.9

Comparison 6 Sensitivity analysis 2: Exchange of model for data synthesis, Outcome 9 Comparison 3 ‐ All‐cause mortality.

Comparison 6 Sensitivity analysis 2: Exchange of model for data synthesis, Outcome 10 Comparison 3 ‐ Quality of life.
Figuras y tablas -
Analysis 6.10

Comparison 6 Sensitivity analysis 2: Exchange of model for data synthesis, Outcome 10 Comparison 3 ‐ Quality of life.

Comparison 6 Sensitivity analysis 2: Exchange of model for data synthesis, Outcome 11 Comparison 3 ‐ AMI incidence (fatal).
Figuras y tablas -
Analysis 6.11

Comparison 6 Sensitivity analysis 2: Exchange of model for data synthesis, Outcome 11 Comparison 3 ‐ AMI incidence (fatal).

Comparison 6 Sensitivity analysis 2: Exchange of model for data synthesis, Outcome 12 Comparison 3 ‐ AMI incidence (non‐fatal).
Figuras y tablas -
Analysis 6.12

Comparison 6 Sensitivity analysis 2: Exchange of model for data synthesis, Outcome 12 Comparison 3 ‐ AMI incidence (non‐fatal).

Comparison 6 Sensitivity analysis 2: Exchange of model for data synthesis, Outcome 13 Comparison 3 ‐ Angina episodes frequency.
Figuras y tablas -
Analysis 6.13

Comparison 6 Sensitivity analysis 2: Exchange of model for data synthesis, Outcome 13 Comparison 3 ‐ Angina episodes frequency.

Comparison 6 Sensitivity analysis 2: Exchange of model for data synthesis, Outcome 14 Comparison 3 ‐ Adverse events incidence.
Figuras y tablas -
Analysis 6.14

Comparison 6 Sensitivity analysis 2: Exchange of model for data synthesis, Outcome 14 Comparison 3 ‐ Adverse events incidence.

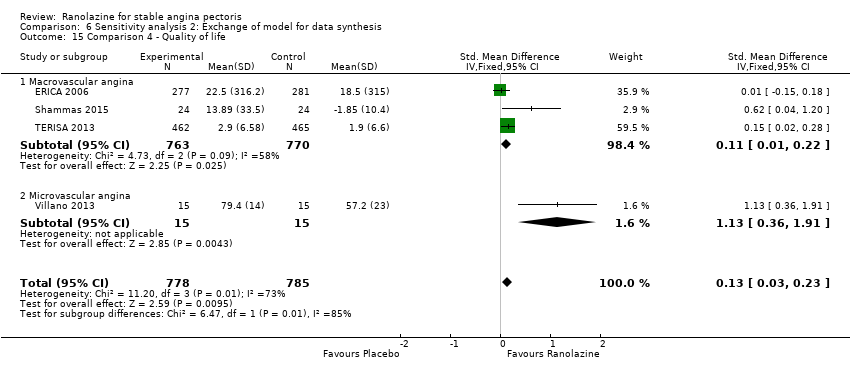
Comparison 6 Sensitivity analysis 2: Exchange of model for data synthesis, Outcome 15 Comparison 4 ‐ Quality of life.
Figuras y tablas -
Analysis 6.15

Comparison 6 Sensitivity analysis 2: Exchange of model for data synthesis, Outcome 15 Comparison 4 ‐ Quality of life.

Comparison 6 Sensitivity analysis 2: Exchange of model for data synthesis, Outcome 16 Comparison 4 ‐ Time to 1‐mm ST‐segment depression.
Figuras y tablas -
Analysis 6.16

Comparison 6 Sensitivity analysis 2: Exchange of model for data synthesis, Outcome 16 Comparison 4 ‐ Time to 1‐mm ST‐segment depression.

Comparison 7 Sensitivity analysis 3: Change of the measure of treatment effect, Outcome 1 Comparison 1 ‐ All‐cause mortality.
Figuras y tablas -
Analysis 7.1

Comparison 7 Sensitivity analysis 3: Change of the measure of treatment effect, Outcome 1 Comparison 1 ‐ All‐cause mortality.

Comparison 7 Sensitivity analysis 3: Change of the measure of treatment effect, Outcome 2 Comparison 1 ‐ Quality of life.
Figuras y tablas -
Analysis 7.2

Comparison 7 Sensitivity analysis 3: Change of the measure of treatment effect, Outcome 2 Comparison 1 ‐ Quality of life.

Comparison 7 Sensitivity analysis 3: Change of the measure of treatment effect, Outcome 3 Comparison 1 ‐ AMI incidence.
Figuras y tablas -
Analysis 7.3

Comparison 7 Sensitivity analysis 3: Change of the measure of treatment effect, Outcome 3 Comparison 1 ‐ AMI incidence.

Comparison 7 Sensitivity analysis 3: Change of the measure of treatment effect, Outcome 4 Comparison 1 ‐ Need for revascularisation procedure.
Figuras y tablas -
Analysis 7.4

Comparison 7 Sensitivity analysis 3: Change of the measure of treatment effect, Outcome 4 Comparison 1 ‐ Need for revascularisation procedure.

Comparison 7 Sensitivity analysis 3: Change of the measure of treatment effect, Outcome 5 Comparison 1 ‐ Adverse events incidence.
Figuras y tablas -
Analysis 7.5

Comparison 7 Sensitivity analysis 3: Change of the measure of treatment effect, Outcome 5 Comparison 1 ‐ Adverse events incidence.

Comparison 7 Sensitivity analysis 3: Change of the measure of treatment effect, Outcome 6 Comparison 2 ‐ AMI incidence.
Figuras y tablas -
Analysis 7.6

Comparison 7 Sensitivity analysis 3: Change of the measure of treatment effect, Outcome 6 Comparison 2 ‐ AMI incidence.

Comparison 7 Sensitivity analysis 3: Change of the measure of treatment effect, Outcome 7 Comparison 2 ‐ Angina episodes frequency.
Figuras y tablas -
Analysis 7.7

Comparison 7 Sensitivity analysis 3: Change of the measure of treatment effect, Outcome 7 Comparison 2 ‐ Angina episodes frequency.

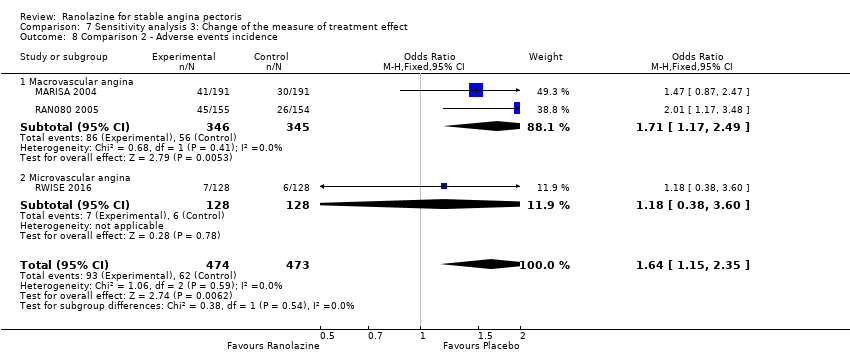
Comparison 7 Sensitivity analysis 3: Change of the measure of treatment effect, Outcome 8 Comparison 2 ‐ Adverse events incidence.
Figuras y tablas -
Analysis 7.8

Comparison 7 Sensitivity analysis 3: Change of the measure of treatment effect, Outcome 8 Comparison 2 ‐ Adverse events incidence.

Comparison 7 Sensitivity analysis 3: Change of the measure of treatment effect, Outcome 9 Comparison 3 ‐ All‐cause mortality.
Figuras y tablas -
Analysis 7.9

Comparison 7 Sensitivity analysis 3: Change of the measure of treatment effect, Outcome 9 Comparison 3 ‐ All‐cause mortality.

Comparison 7 Sensitivity analysis 3: Change of the measure of treatment effect, Outcome 10 Comparison 3 ‐ Quality of life.
Figuras y tablas -
Analysis 7.10

Comparison 7 Sensitivity analysis 3: Change of the measure of treatment effect, Outcome 10 Comparison 3 ‐ Quality of life.

Comparison 7 Sensitivity analysis 3: Change of the measure of treatment effect, Outcome 11 Comparison 3 ‐ AMI incidence (fatal).
Figuras y tablas -
Analysis 7.11

Comparison 7 Sensitivity analysis 3: Change of the measure of treatment effect, Outcome 11 Comparison 3 ‐ AMI incidence (fatal).

Comparison 7 Sensitivity analysis 3: Change of the measure of treatment effect, Outcome 12 Comparison 3 ‐ AMI incidence (non‐fatal).
Figuras y tablas -
Analysis 7.12

Comparison 7 Sensitivity analysis 3: Change of the measure of treatment effect, Outcome 12 Comparison 3 ‐ AMI incidence (non‐fatal).

Comparison 7 Sensitivity analysis 3: Change of the measure of treatment effect, Outcome 13 Comparison 3 ‐ Angina episodes frequency.
Figuras y tablas -
Analysis 7.13

Comparison 7 Sensitivity analysis 3: Change of the measure of treatment effect, Outcome 13 Comparison 3 ‐ Angina episodes frequency.

Comparison 7 Sensitivity analysis 3: Change of the measure of treatment effect, Outcome 14 Comparison 3 ‐ Adverse events incidence.
Figuras y tablas -
Analysis 7.14

Comparison 7 Sensitivity analysis 3: Change of the measure of treatment effect, Outcome 14 Comparison 3 ‐ Adverse events incidence.

Comparison 7 Sensitivity analysis 3: Change of the measure of treatment effect, Outcome 15 Comparison 4 ‐ Quality of life.
Figuras y tablas -
Analysis 7.15

Comparison 7 Sensitivity analysis 3: Change of the measure of treatment effect, Outcome 15 Comparison 4 ‐ Quality of life.

Comparison 8 Sensitivity analysis 4: follow‐up ≥ 6 weeks, Outcome 1 Comparison 1 ‐ All‐cause mortality.
Figuras y tablas -
Analysis 8.1

Comparison 8 Sensitivity analysis 4: follow‐up ≥ 6 weeks, Outcome 1 Comparison 1 ‐ All‐cause mortality.

Comparison 8 Sensitivity analysis 4: follow‐up ≥ 6 weeks, Outcome 2 Comparison 1 ‐ Quality of life.
Figuras y tablas -
Analysis 8.2

Comparison 8 Sensitivity analysis 4: follow‐up ≥ 6 weeks, Outcome 2 Comparison 1 ‐ Quality of life.

Comparison 8 Sensitivity analysis 4: follow‐up ≥ 6 weeks, Outcome 3 Comparison 1 ‐ AMI incidence.
Figuras y tablas -
Analysis 8.3

Comparison 8 Sensitivity analysis 4: follow‐up ≥ 6 weeks, Outcome 3 Comparison 1 ‐ AMI incidence.

Comparison 8 Sensitivity analysis 4: follow‐up ≥ 6 weeks, Outcome 4 Comparison 1 ‐ Need for revascularisation procedure.
Figuras y tablas -
Analysis 8.4

Comparison 8 Sensitivity analysis 4: follow‐up ≥ 6 weeks, Outcome 4 Comparison 1 ‐ Need for revascularisation procedure.

Comparison 8 Sensitivity analysis 4: follow‐up ≥ 6 weeks, Outcome 5 Comparison 2 ‐ AMI incidence.
Figuras y tablas -
Analysis 8.5

Comparison 8 Sensitivity analysis 4: follow‐up ≥ 6 weeks, Outcome 5 Comparison 2 ‐ AMI incidence.

Comparison 8 Sensitivity analysis 4: follow‐up ≥ 6 weeks, Outcome 6 Comparison 3 ‐ All‐cause mortality.
Figuras y tablas -
Analysis 8.6

Comparison 8 Sensitivity analysis 4: follow‐up ≥ 6 weeks, Outcome 6 Comparison 3 ‐ All‐cause mortality.

Comparison 8 Sensitivity analysis 4: follow‐up ≥ 6 weeks, Outcome 7 Comparison 3 ‐ Quality of life.
Figuras y tablas -
Analysis 8.7

Comparison 8 Sensitivity analysis 4: follow‐up ≥ 6 weeks, Outcome 7 Comparison 3 ‐ Quality of life.

Comparison 8 Sensitivity analysis 4: follow‐up ≥ 6 weeks, Outcome 8 Comparison 3 ‐ AMI incidence (fatal).
Figuras y tablas -
Analysis 8.8

Comparison 8 Sensitivity analysis 4: follow‐up ≥ 6 weeks, Outcome 8 Comparison 3 ‐ AMI incidence (fatal).

Comparison 8 Sensitivity analysis 4: follow‐up ≥ 6 weeks, Outcome 9 Comparison 3 ‐ AMI incidence (non‐fatal).
Figuras y tablas -
Analysis 8.9

Comparison 8 Sensitivity analysis 4: follow‐up ≥ 6 weeks, Outcome 9 Comparison 3 ‐ AMI incidence (non‐fatal).

Comparison 8 Sensitivity analysis 4: follow‐up ≥ 6 weeks, Outcome 10 Comparison 3 ‐ Angina episodes frequency.
Figuras y tablas -
Analysis 8.10

Comparison 8 Sensitivity analysis 4: follow‐up ≥ 6 weeks, Outcome 10 Comparison 3 ‐ Angina episodes frequency.

Comparison 8 Sensitivity analysis 4: follow‐up ≥ 6 weeks, Outcome 11 Comparison 3 ‐ Adverse events incidence.
Figuras y tablas -
Analysis 8.11

Comparison 8 Sensitivity analysis 4: follow‐up ≥ 6 weeks, Outcome 11 Comparison 3 ‐ Adverse events incidence.

Comparison 8 Sensitivity analysis 4: follow‐up ≥ 6 weeks, Outcome 12 Comparison 4 ‐ Quality of life.
Figuras y tablas -
Analysis 8.12

Comparison 8 Sensitivity analysis 4: follow‐up ≥ 6 weeks, Outcome 12 Comparison 4 ‐ Quality of life.

Comparison 8 Sensitivity analysis 4: follow‐up ≥ 6 weeks, Outcome 13 Comparison 4 ‐ Time to 1‐mm ST‐segment depression.
Figuras y tablas -
Analysis 8.13

Comparison 8 Sensitivity analysis 4: follow‐up ≥ 6 weeks, Outcome 13 Comparison 4 ‐ Time to 1‐mm ST‐segment depression.

Summary of findings for the main comparison. Ranolazine (add‐on therapy) versus placebo for stable angina pectoris

Ranolazine (add‐on therapy) versus placebo for stable angina pectoris*

Patient or population: patients with stable angina pectoris
Settings: not specified
Intervention: ranolazine (add‐on therapy)
Comparison: placebo (add‐on therapy)

Outcomes

Illustrative comparative risks** (95% CI)

Relative effect
(95% CI)

No of Participants
(studies)

Quality of the evidence
(GRADE)

Comments

Assumed risk

Corresponding risk

Placebo

Ranolazine

Cardiovascular mortality ‐ not reported

See comment

See comment

Not estimable

See comment

No data were available for this outcome

Non‐cardiovascular mortality ‐ not reported

See comment

See comment

Not estimable

See comment

No data were available for this outcome

All‐cause mortality
Follow‐up: 42 to 84 days

6 per 1000

5 per 1000
(2 to 16)

RR 0.83
(0.26 to 2.71)

2053
(3 studies)

⊕⊕⊝⊝
low¹ ²

Ranolazine 1000 mg twice daily

Quality of life
Scale: 0 to 100.
Follow‐up: 28 to 56 days

Mean quality of life in control group participants was
44.3 points

Mean quality of life in intervention group participants was
0.25 standard deviations higher
(0.01 lower to 0.52 higher)

1563
(4 studies)

⊕⊕⊕⊝
moderate³

Ranolazine any dose

(SMD 0.25, 95% CI ‐0.01 to 0.52)

AMI incidence
Follow‐up: 42 to 56 days

7 per 1000

3 per 1000
(1 to 14)

RR 0.40
(0.08 to 2.07)

1509
(2 studies)

⊕⊕⊝⊝
low

Ranolazine 1000 mg twice daily

Angina episodes frequency
Follow‐up: 42 to 84 days

Mean angina episode frequency in control group participants was
4.1 episodes per week

Mean angina episodes frequency in intervention group participants was
0.66 lower
(0.97 to 0.35 lower)

2004
(3 studies)

⊕⊕⊕⊝
moderate¹

Ranolazine 1000 mg twice daily

(MD ‐0.66, 95% CI ‐0.97 to ‐0.35)

Adverse events incidence
Follow‐up: 42 to 84 days

241 per 1000

294 per 1000
(256 to 337)

RR 1.22
(1.06 to 1.4)

2123
(3 studies)

⊕⊕⊕⊝
moderate

Ranolazine 1000 mg twice daily

*Add‐on therapy: refers to the addition of ranolazine to an antianginal regimen already in course. The results reported correspond to the comparisons (data and analyses) 3 and 4 of the review (involving ranolazine given at 1000mg twice daily or any dosage); this is specified in the Comments column.

**The assumed risk is based on the median control group risk across studies. The corresponding risk (and its 95% confidence interval) is based on the assumed risk in the comparison group and the relative effect of the intervention (and its 95% CI).
CI: Confidence interval; RR: Risk ratio

GRADE Working Group grades of evidence
High quality: Further research is very unlikely to change our confidence in the estimate of effect.
Moderate quality: Further research is likely to have an important impact on our confidence in the estimate of effect and may change the estimate.
Low quality: Further research is very likely to have an important impact on our confidence in the estimate of effect and is likely to change the estimate.
Very low quality: We are very uncertain about the estimate.

¹ Quality of evidence was downgraded one level due to unclear risk of bias regarding blinding of outcome assessment and incomplete outcome data
² Quality of evidence was downgraded one level due to insufficient number of events (less than 300), and the 95% confidence interval around the pooled effect includes both 1) no effect and 2) appreciable benefit/harm
³ Quality of evidence was downgraded one level due to substantial heterogeneity
⁴ Quality of evidence was downgraded two levels due to insufficient number of events (less than 300), and the 95% confidence interval around the pooled effect includes both 1) no effect and 2) appreciable benefit/harm
⁵ Quality of evidence was downgraded one level due to unclear risk of bias regarding blinding of outcome assessment and selective reporting

Figuras y tablas -
Summary of findings for the main comparison. Ranolazine (add‐on therapy) versus placebo for stable angina pectoris
Summary of findings 2. Ranolazine (monotherapy) versus placebo for stable angina pectoris

Ranolazine (monotherapy) versus placebo for stable angina pectoris*

Patient or population: patients with stable angina pectoris
Settings: not specified
Intervention: ranolazine (monotherapy)
Comparison: placebo (monotherapy)

Outcomes

Illustrative comparative risks** (95% CI)

Relative effect
(95% CI)

No of Participants
(studies)

Quality of the evidence
(GRADE)

Comments

Assumed risk

Corresponding risk

Placebo

Ranolazine

Cardiovascular mortality
Follow‐up: mean 643 days

16 per 1000

16 per 1000
(9 to 29)

RR 1.03
(0.56 to 1.88)

2604
(1 study)

⊕⊕⊝⊝
low¹ ²

Ranolazine 1000 mg twice daily

Non‐cardiovascular mortality ‐ not reported

See comment

See comment

Not estimable

See comment

No data were available for this outcome

All‐cause mortality
Follow‐up: 37 to 643 days

49 per 1000

49 per 1000
(39 to 61)

RR 1.00
(0.81 to 1.25)

6249
(3 studies)

⊕⊕⊝⊝
low² ³

Ranolazine 1000 mg twice daily

Quality of life
Scale: 0 to 100
Follow‐up: 14 to 643 days

Mean quality of life in control group participants was
68.6 points

Mean quality of life in intervention group participants was
0.28 higher
(1.57 lower to 2.13 higher)

2256
(3 studies)

⊕⊕⊕⊝
moderate

Ranolazine 1000 mg twice daily

(MD 0.28. 95% CI ‐1.57 to 2.13)

AMI incidence
Follow‐up: 7 to 643 days

85 per 1000

75 per 1000
(59 to 96)

RR 0.88
(0.69 to 1.12)

2983
(3 studies)

⊕⊕⊝⊝
low

Ranolazine any dose

Angina episodes frequency
Follow‐up: 14 to 28 days

Mean angina episode frequency in control group participants was
2.08 episodes per week

Mean angina episode frequency in intervention group participants was
0.08 higher
(0.85 lower to 1.01 higher)

402
(2 studies)

⊕⊕⊝⊝
low³ ⁵

Ranolazine any dose

(MD 0.08, 95% CI ‐0.85 to 1.01)

Adverse events incidence
Follow‐up: 7 to 14 days

131 per 1000

197 per 1000
(147 to 262)

RR 1.50
(1.12 to 2)

947
(3 studies)

⊕⊝⊝⊝
very low³ ⁵ ⁶

Ranolazine any dose

*Monotherapy: refers to the administration of ranolazine as the only antianginal drug. The results reported correspond to the comparisons (data and analyses) 1 and 2 of the review (involving ranolazine given at 1000mg twice daily or any dosage); this is specified in the Comments column.

**The assumed risk is based on the median control group risk across studies. The corresponding risk (and its 95% confidence interval) is based on the assumed risk in the comparison group and the relative effect of the intervention (and its 95% CI).
CI: Confidence interval; RR: Risk ratio

GRADE Working Group grades of evidence
High quality: Further research is very unlikely to change our confidence in the estimate of effect.
Moderate quality: Further research is likely to have an important impact on our confidence in the estimate of effect and may change the estimate.
Low quality: Further research is very likely to have an important impact on our confidence in the estimate of effect and is likely to change the estimate.
Very low quality: We are very uncertain about the estimate.

¹ Quality of evidence was downgraded one level due to unclear risk of bias regarding allocation concealment and high risk of bias regarding selective reporting
² Quality of evidence was downgraded one level due to insufficient numbers of events (< 300), and the 95% CI around the pooled effect includes both 1) no effect and 2) appreciable benefit/harm
³ Quality of evidence was downgraded one level because a group of participants (not quantified) in one or more included studies received ranolazine in addition to usual anti‐anginals (i.e. not as monotherapy)
⁴ Quality of evidence was downgraded one level because the 95% CI around the pooled effect included both 1) no effect and 2) appreciable benefit/harm
⁵ Quality of evidence was downgraded one level due to unclear risk of bias for most criteria
⁶ Quality of evidence was downgraded one level due to insufficient numbers of events (< 300)

Figuras y tablas -
Summary of findings 2. Ranolazine (monotherapy) versus placebo for stable angina pectoris
Comparison 1. Ranolazine (monotherapy) 1000 mg twice daily versus placebo

Outcome or subgroup title

No. of studies

No. of participants

Statistical method

Effect size

1 Cardiovascular mortality Show forest plot

1

2604

Risk Ratio (M‐H, Fixed, 95% CI)

1.03 [0.56, 1.88]

2 All‐cause mortality Show forest plot

3

6249

Risk Ratio (M‐H, Fixed, 95% CI)

1.00 [0.81, 1.25]

3 Quality of life Show forest plot

3

2254

Mean Difference (IV, Fixed, 95% CI)

0.28 [‐1.57, 2.13]

4 AMI incidence Show forest plot

2

2674

Risk Ratio (M‐H, Random, 95% CI)

0.55 [0.14, 2.15]

5 Need for revascularisation procedure Show forest plot

2

2674

Risk Ratio (M‐H, Fixed, 95% CI)

0.98 [0.82, 1.18]

6 Adverse events incidence Show forest plot

2

638

Risk Ratio (M‐H, Fixed, 95% CI)

1.33 [0.90, 1.98]

Figuras y tablas -
Comparison 1. Ranolazine (monotherapy) 1000 mg twice daily versus placebo
Comparison 2. Ranolazine (monotherapy) any dose versus placebo

Outcome or subgroup title

No. of studies

No. of participants

Statistical method

Effect size

1 AMI incidence Show forest plot

3

2983

Risk Ratio (M‐H, Fixed, 95% CI)

0.88 [0.69, 1.12]

2 Angina episodes frequency Show forest plot

2

402

Mean Difference (IV, Fixed, 95% CI)

0.08 [‐0.85, 1.01]

3 Adverse events incidence Show forest plot

3

947

Risk Ratio (M‐H, Fixed, 95% CI)

1.50 [1.12, 2.00]

3.1 Macrovascular angina

2

691

Risk Ratio (M‐H, Fixed, 95% CI)

1.53 [1.13, 2.07]

3.2 Microvascular angina

1

256

Risk Ratio (M‐H, Fixed, 95% CI)

1.17 [0.40, 3.38]

Figuras y tablas -
Comparison 2. Ranolazine (monotherapy) any dose versus placebo
Comparison 3. Ranolazine (add‐on therapy) 1000 mg twice daily versus placebo

Outcome or subgroup title

No. of studies

No. of participants

Statistical method

Effect size

1 All‐cause mortality Show forest plot

3

2053

Risk Ratio (M‐H, Fixed, 95% CI)

0.83 [0.26, 2.71]

2 Quality of life Show forest plot

3

1533

Std. Mean Difference (IV, Random, 95% CI)

0.13 [‐0.05, 0.32]

3 AMI incidence (fatal) Show forest plot

2

1509

Risk Ratio (M‐H, Fixed, 95% CI)

1.51 [0.25, 9.05]

4 AMI incidence (non‐fatal) Show forest plot

2

1509

Risk Ratio (M‐H, Fixed, 95% CI)

0.40 [0.08, 2.07]

5 Angina episodes frequency Show forest plot

3

2004

Mean Difference (IV, Fixed, 95% CI)

‐0.66 [‐0.97, ‐0.35]

6 Adverse events incidence Show forest plot

3

2053

Risk Ratio (M‐H, Fixed, 95% CI)

1.22 [1.06, 1.40]

Figuras y tablas -
Comparison 3. Ranolazine (add‐on therapy) 1000 mg twice daily versus placebo
Comparison 4. Ranolazine (add‐on therapy) any dose versus placebo

Outcome or subgroup title

No. of studies

No. of participants

Statistical method

Effect size

1 Quality of life Show forest plot

4

1563

Std. Mean Difference (IV, Random, 95% CI)

0.25 [‐0.01, 0.52]

1.1 Macrovascular angina

3

1533

Std. Mean Difference (IV, Random, 95% CI)

0.13 [‐0.05, 0.32]

1.2 Microvascular angina

1

30

Std. Mean Difference (IV, Random, 95% CI)

1.13 [0.36, 1.91]

2 Time to 1‐mm ST‐segment depression Show forest plot

3

1165

Mean Difference (Fixed, 95% CI)

34.62 [33.08, 36.16]

Figuras y tablas -
Comparison 4. Ranolazine (add‐on therapy) any dose versus placebo
Comparison 5. Sensitivity analysis 1: Studies at low risk of bias

Outcome or subgroup title

No. of studies

No. of participants

Statistical method

Effect size

1 Comparison 1 ‐ All‐cause mortality Show forest plot

2

6179

Risk Ratio (M‐H, Fixed, 95% CI)

1.01 [0.81, 1.26]

2 Comparison 1 ‐ Quality of life Show forest plot

2

1998

Mean Difference (IV, Fixed, 95% CI)

0.09 [‐1.86, 2.05]

3 Comparison 1 ‐ AMI incidence Show forest plot

1

2604

Risk Ratio (M‐H, Random, 95% CI)

0.94 [0.73, 1.20]

4 Comparison 1 ‐ Need for revascularisation procedure Show forest plot

1

2604

Risk Ratio (M‐H, Fixed, 95% CI)

0.98 [0.82, 1.18]

5 Comparison 2 ‐ AMI incidence Show forest plot

1

2604

Risk Ratio (M‐H, Fixed, 95% CI)

0.94 [0.73, 1.20]

6 Comparison 3 ‐ All‐cause mortality Show forest plot

2

1488

Risk Ratio (M‐H, Fixed, 95% CI)

0.80 [0.22, 2.95]

7 Comparison 3 ‐ Quality of life Show forest plot

2

975

Std. Mean Difference (IV, Random, 95% CI)

0.30 [‐0.13, 0.73]

8 Comparison 3 ‐ AMI incidence (fatal) Show forest plot

1

944

Risk Ratio (M‐H, Fixed, 95% CI)

5.04 [0.24, 104.75]

9 Comparison 3 ‐ AMI incidence (non‐fatal) Show forest plot

1

944

Risk Ratio (M‐H, Fixed, 95% CI)

0.34 [0.04, 3.22]

10 Comparison 3 ‐ Angina episodes frequency Show forest plot

2

1446

Mean Difference (IV, Fixed, 95% CI)

‐0.64 [‐0.96, ‐0.32]

11 Comparison 3 ‐ Adverse events incidence Show forest plot

2

1488

Risk Ratio (M‐H, Fixed, 95% CI)

1.28 [1.06, 1.53]

12 Comparison 4 ‐ Quality of life Show forest plot

3

1005

Std. Mean Difference (IV, Random, 95% CI)

0.54 [‐0.03, 1.10]

12.1 Macrovascular angina

2

975

Std. Mean Difference (IV, Random, 95% CI)

0.30 [‐0.13, 0.73]

12.2 Microvascular angina

1

30

Std. Mean Difference (IV, Random, 95% CI)

1.13 [0.36, 1.91]

13 Comparison 4 ‐ Time to 1‐mm ST‐segment depression Show forest plot

2

Mean Difference (Fixed, 95% CI)

34.62 [33.08, 36.16]

Figuras y tablas -
Comparison 5. Sensitivity analysis 1: Studies at low risk of bias
Comparison 6. Sensitivity analysis 2: Exchange of model for data synthesis

Outcome or subgroup title

No. of studies

No. of participants

Statistical method

Effect size

1 Comparison 1 ‐ All‐cause mortality Show forest plot

3

6249

Risk Ratio (M‐H, Random, 95% CI)

1.00 [0.81, 1.25]

2 Comparison 1 ‐ Quality of life Show forest plot

3

2254

Mean Difference (IV, Random, 95% CI)

0.28 [‐1.57, 2.13]

3 Comparison 1 ‐ AMI incidence Show forest plot

2

2674

Risk Ratio (M‐H, Fixed, 95% CI)

0.88 [0.69, 1.13]

4 Comparison 1 ‐ Need for revascularisation procedure Show forest plot

2

2674

Risk Ratio (M‐H, Random, 95% CI)

0.98 [0.82, 1.18]

5 Comparison 1 ‐ Adverse events incidence Show forest plot

2

638

Risk Ratio (M‐H, Random, 95% CI)

1.34 [0.90, 1.99]

6 Comparison 2 ‐ AMI incidence Show forest plot

3

2983

Risk Ratio (M‐H, Random, 95% CI)

0.56 [0.19, 1.63]

7 Comparison 2 ‐ Angina episodes frequency Show forest plot

2

402

Mean Difference (IV, Random, 95% CI)

0.08 [‐0.85, 1.01]

8 Comparison 2 ‐ Adverse events incidence Show forest plot

3

947

Risk Ratio (M‐H, Random, 95% CI)

1.50 [1.12, 2.01]

8.1 Macrovascular angina

2

691

Risk Ratio (M‐H, Random, 95% CI)

1.53 [1.13, 2.07]

8.2 Microvascular angina

1

256

Risk Ratio (M‐H, Random, 95% CI)

1.17 [0.40, 3.38]

9 Comparison 3 ‐ All‐cause mortality Show forest plot

3

2053

Risk Ratio (M‐H, Random, 95% CI)

0.87 [0.25, 3.04]

10 Comparison 3 ‐ Quality of life Show forest plot

3

1533

Std. Mean Difference (IV, Fixed, 95% CI)

0.11 [0.01, 0.22]

11 Comparison 3 ‐ AMI incidence (fatal) Show forest plot

2

1509

Risk Ratio (M‐H, Random, 95% CI)

1.37 [0.10, 19.46]

12 Comparison 3 ‐ AMI incidence (non‐fatal) Show forest plot

2

1509

Risk Ratio (M‐H, Random, 95% CI)

0.41 [0.08, 2.11]

13 Comparison 3 ‐ Angina episodes frequency Show forest plot

3

2004

Mean Difference (IV, Random, 95% CI)

‐0.78 [‐1.28, ‐0.27]

14 Comparison 3 ‐ Adverse events incidence Show forest plot

3

2053

Risk Ratio (M‐H, Random, 95% CI)

1.21 [1.06, 1.39]

15 Comparison 4 ‐ Quality of life Show forest plot

4

1563

Std. Mean Difference (IV, Fixed, 95% CI)

0.13 [0.03, 0.23]

15.1 Macrovascular angina

3

1533

Std. Mean Difference (IV, Fixed, 95% CI)

0.11 [0.01, 0.22]

15.2 Microvascular angina

1

30

Std. Mean Difference (IV, Fixed, 95% CI)

1.13 [0.36, 1.91]

16 Comparison 4 ‐ Time to 1‐mm ST‐segment depression Show forest plot

3

Mean Difference (Random, 95% CI)

51.05 [4.05, 98.04]

Figuras y tablas -
Comparison 6. Sensitivity analysis 2: Exchange of model for data synthesis
Comparison 7. Sensitivity analysis 3: Change of the measure of treatment effect

Outcome or subgroup title

No. of studies

No. of participants

Statistical method

Effect size

1 Comparison 1 ‐ All‐cause mortality Show forest plot

3

6249

Odds Ratio (M‐H, Fixed, 95% CI)

1.00 [0.80, 1.27]

2 Comparison 1 ‐ Quality of life Show forest plot

3

2254

Std. Mean Difference (IV, Fixed, 95% CI)

0.01 [‐0.07, 0.09]

3 Comparison 1 ‐ AMI incidence Show forest plot

2

2674

Odds Ratio (M‐H, Random, 95% CI)

0.49 [0.10, 2.41]

4 Comparison 1 ‐ Need for revascularisation procedure Show forest plot

2

2674

Odds Ratio (M‐H, Fixed, 95% CI)

0.98 [0.79, 1.21]

5 Comparison 1 ‐ Adverse events incidence Show forest plot

2

638

Odds Ratio (M‐H, Fixed, 95% CI)

1.41 [0.88, 2.26]

6 Comparison 2 ‐ AMI incidence Show forest plot

3

2983

Odds Ratio (M‐H, Fixed, 95% CI)

0.87 [0.67, 1.13]

7 Comparison 2 ‐ Angina episodes frequency Show forest plot

2

402

Std. Mean Difference (IV, Fixed, 95% CI)

0.01 [‐0.19, 0.20]

8 Comparison 2 ‐ Adverse events incidence Show forest plot

3

947

Odds Ratio (M‐H, Fixed, 95% CI)

1.64 [1.15, 2.35]

8.1 Macrovascular angina

2

691

Odds Ratio (M‐H, Fixed, 95% CI)

1.71 [1.17, 2.49]

8.2 Microvascular angina

1

256

Odds Ratio (M‐H, Fixed, 95% CI)

1.18 [0.38, 3.60]

9 Comparison 3 ‐ All‐cause mortality Show forest plot

3

2053

Odds Ratio (M‐H, Fixed, 95% CI)

0.83 [0.25, 2.73]

10 Comparison 3 ‐ Quality of life Show forest plot

3

1533

Mean Difference (IV, Random, 95% CI)

5.91 [‐5.52, 17.34]

11 Comparison 3 ‐ AMI incidence (fatal) Show forest plot

2

1509

Odds Ratio (M‐H, Fixed, 95% CI)

1.52 [0.25, 9.09]

12 Comparison 3 ‐ AMI incidence (non‐fatal) Show forest plot

2

1509

Odds Ratio (M‐H, Fixed, 95% CI)

0.40 [0.08, 2.08]

13 Comparison 3 ‐ Angina episodes frequency Show forest plot

3

2004

Std. Mean Difference (IV, Fixed, 95% CI)

‐0.19 [‐0.28, ‐0.11]

14 Comparison 3 ‐ Adverse events incidence Show forest plot

3

2053

Odds Ratio (M‐H, Fixed, 95% CI)

1.32 [1.09, 1.61]

15 Comparison 4 ‐ Quality of life Show forest plot

4

1563

Mean Difference (IV, Random, 95% CI)

11.17 [‐2.54, 24.87]

15.1 Macrovascular angina

3

1533

Mean Difference (IV, Random, 95% CI)

5.91 [‐5.52, 17.34]

15.2 Microvascular angina

1

30

Mean Difference (IV, Random, 95% CI)

22.20 [8.57, 35.83]

Figuras y tablas -
Comparison 7. Sensitivity analysis 3: Change of the measure of treatment effect
Comparison 8. Sensitivity analysis 4: follow‐up ≥ 6 weeks

Outcome or subgroup title

No. of studies

No. of participants

Statistical method

Effect size

1 Comparison 1 ‐ All‐cause mortality Show forest plot

2

6179

Risk Ratio (M‐H, Fixed, 95% CI)

1.01 [0.81, 1.26]

2 Comparison 1 ‐ Quality of life Show forest plot

1

1958

Mean Difference (IV, Fixed, 95% CI)

‐0.10 [‐2.08, 1.88]

3 Comparison 1 ‐ AMI incidence Show forest plot

1

2604

Risk Ratio (M‐H, Random, 95% CI)

0.94 [0.73, 1.20]

4 Comparison 1 ‐ Need for revascularisation procedure Show forest plot

1

2604

Risk Ratio (M‐H, Fixed, 95% CI)

0.98 [0.82, 1.18]

5 Comparison 2 ‐ AMI incidence Show forest plot

1

2604

Risk Ratio (M‐H, Fixed, 95% CI)

0.94 [0.73, 1.20]

6 Comparison 3 ‐ All‐cause mortality Show forest plot

3

2053

Risk Ratio (M‐H, Fixed, 95% CI)

0.83 [0.26, 2.71]

7 Comparison 3 ‐ Quality of life Show forest plot

3

1533

Std. Mean Difference (IV, Random, 95% CI)

0.13 [‐0.05, 0.32]

8 Comparison 3 ‐ AMI incidence (fatal) Show forest plot

2

1509

Risk Ratio (M‐H, Fixed, 95% CI)

1.51 [0.25, 9.05]

9 Comparison 3 ‐ AMI incidence (non‐fatal) Show forest plot

2

1509

Risk Ratio (M‐H, Fixed, 95% CI)

0.40 [0.08, 2.07]

10 Comparison 3 ‐ Angina episodes frequency Show forest plot

3

2004

Mean Difference (IV, Fixed, 95% CI)

‐0.66 [‐0.97, ‐0.35]

11 Comparison 3 ‐ Adverse events incidence Show forest plot

3

2053

Risk Ratio (M‐H, Fixed, 95% CI)

1.22 [1.06, 1.40]

12 Comparison 4 ‐ Quality of life Show forest plot

3

1533

Std. Mean Difference (IV, Random, 95% CI)

0.13 [‐0.05, 0.32]

12.1 Macrovascular angina

3

1533

Std. Mean Difference (IV, Random, 95% CI)

0.13 [‐0.05, 0.32]

13 Comparison 4 ‐ Time to 1‐mm ST‐segment depression Show forest plot

1

Mean Difference (Fixed, 95% CI)

34.6 [33.06, 36.14]

Figuras y tablas -
Comparison 8. Sensitivity analysis 4: follow‐up ≥ 6 weeks