Tratamiento con antibióticos para las parejas sexuales de las pacientes con vaginosis bacteriana
Información
- DOI:
- https://doi.org/10.1002/14651858.CD011701.pub2Copiar DOI

- Base de datos:
-
- Cochrane Database of Systematic Reviews
- Versión publicada:
-
- 01 octubre 2016see what's new
- Tipo:
-
- Intervention
- Etapa:
-
- Review
- Grupo Editorial Cochrane:
-
Grupo Cochrane de Enfermedades de transmisión sexual
- Copyright:
-
- Copyright © 2016 The Cochrane Collaboration. Published by John Wiley & Sons, Ltd.
Cifras del artículo
Altmetric:
Citado por:
Autores
Contributions of authors
JA‐G and CFG‐A screened the titles of articles identified by the literature search, assessed the quality of the evidence in the included trials, extracted data, performed data analyses, wrote the first draft of the review and made subsequent amendments. DAV‐C and EMS‐B participated in screening the title of articles, assessed trial quality, extracted data and wrote the first draft of the review. MYM‐V assessed trial quality, performed data analyses, commented on and revised the systematic review draft.
Sources of support
Internal sources
-
No sources of support supplied
External sources
-
National University of Colombia, Colombia.
Declarations of interest
Jairo Amaya‐Guio has no known conflicts of interest, Mercy Yolima Martinez‐Velasquez has no known conflicts of interest, David Andres Viveros‐Carreño has no known conflicts of interest, Eloisa Mercedes Sierra‐Barrios has no known conflicts of interest, Carlos F Grillo‐Ardila has no known conflicts of interest. None of review authors are or have been involved with the included studies in this review.
Acknowledgements
As part of the prepublication editorial process, three peers (an editor and two referees who were external to the editorial team), a member of the Sexually Transmitted Infection Group’s international panel of consumers and the Group’s Statistical Adviser commented on the review draft.
Version history
| Published | Title | Stage | Authors | Version |
| 2016 Oct 01 | Antibiotic treatment for the sexual partners of women with bacterial vaginosis | Review | Jairo Amaya‐Guio, David Andres Viveros‐Carreño, Eloisa Mercedes Sierra‐Barrios, Mercy Yolima Martinez‐Velasquez, Carlos F Grillo‐Ardila | |
| 2015 May 15 | Antibiotic treatment for the sexual partners of women with bacterial vaginosis | Protocol | Jairo Amaya‐Guio, Mercy Yolima Martinez‐Velasquez, David Andres Viveros‐Carreño, Eloisa Mercedes Sierra‐Barrios, Carlos F Grillo‐Ardila | |
Keywords
MeSH
Medical Subject Headings (MeSH) Keywords
- Anti-Bacterial Agents [adverse effects, *therapeutic use];
- Clindamycin [therapeutic use];
- Indazoles [therapeutic use];
- Lincosamides [therapeutic use];
- Metronidazole [therapeutic use];
- Randomized Controlled Trials as Topic;
- Recurrence;
- *Secondary Prevention;
- *Sexual Partners;
- Time Factors;
- Tinidazole [therapeutic use];
- Vaginosis, Bacterial [*prevention & control];
Medical Subject Headings Check Words
Adolescent; Adult; Female; Humans; Male; Middle Aged;
PICO

Study flow diagram.

'Risk of bias' graph: review authors' judgements about each 'Risk of bias' item presented as percentages across all included studies.
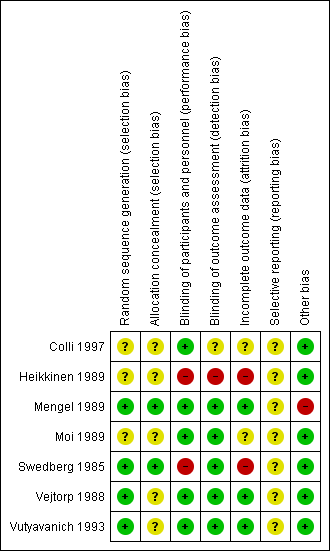
'Risk of bias' summary: review authors' judgements about each 'Risk of bias' item for each included study.
Forest plot of comparison: 1 Any antibiotic treatment versus placebo, outcome: 1.2 Recurrence of BV after the fourth week.
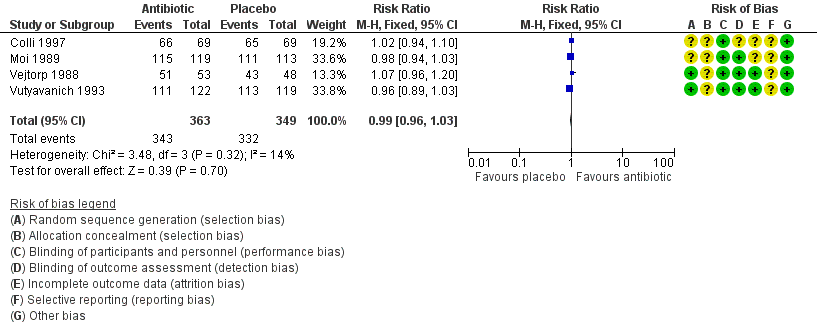
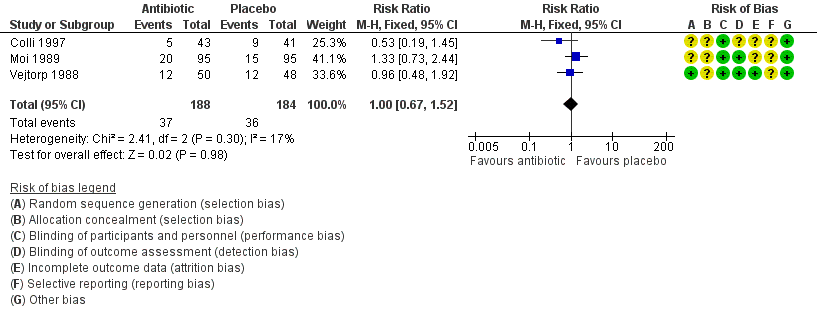
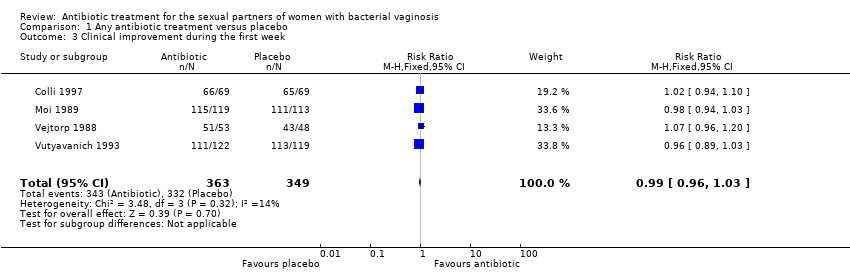
Forest plot of comparison: 1 Any antibiotic treatment versus placebo, outcome: 1.3 Clinical improvement during the first week.

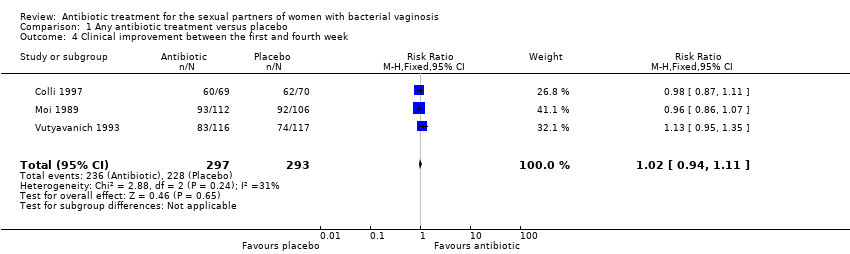
Forest plot of comparison: 1 Any antibiotic treatment versus placebo, outcome: 1.4 Clinical improvement between the first and fourth week.

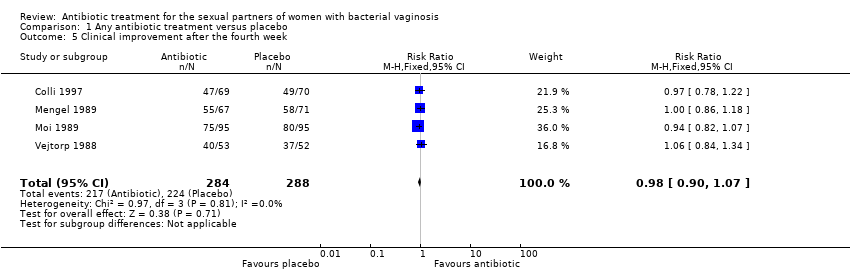
Forest plot of comparison: 1 Any antibiotic treatment versus placebo, outcome: 1.5 Clinical improvement after the fourth week.

Forest plot of comparison: 1 Any antibiotic treatment versus placebo, outcome: 1.6 Symptomatic improvement during the first week.

Forest plot of comparison: 1 Any antibiotic treatment versus placebo, outcome: 1.9 Minor adverse events during therapy in sexual partner.

Comparison 1 Any antibiotic treatment versus placebo, Outcome 1 Recurrence of BV between the first and fourth week.

Comparison 1 Any antibiotic treatment versus placebo, Outcome 2 Recurrence of BV after the fourth week.
Comparison 1 Any antibiotic treatment versus placebo, Outcome 3 Clinical improvement during the first week.
Comparison 1 Any antibiotic treatment versus placebo, Outcome 4 Clinical improvement between the first and fourth week.
Comparison 1 Any antibiotic treatment versus placebo, Outcome 5 Clinical improvement after the fourth week.

Comparison 1 Any antibiotic treatment versus placebo, Outcome 6 Symptomatic improvement during the first week.
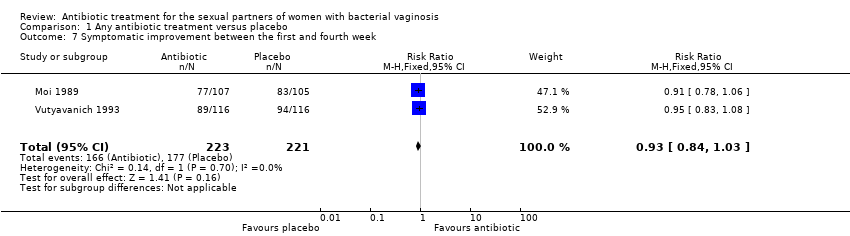
Comparison 1 Any antibiotic treatment versus placebo, Outcome 7 Symptomatic improvement between the first and fourth week.

Comparison 1 Any antibiotic treatment versus placebo, Outcome 8 Symptomatic improvement after the fourth week.

Comparison 1 Any antibiotic treatment versus placebo, Outcome 9 Minor adverse events during therapy in sexual partner.
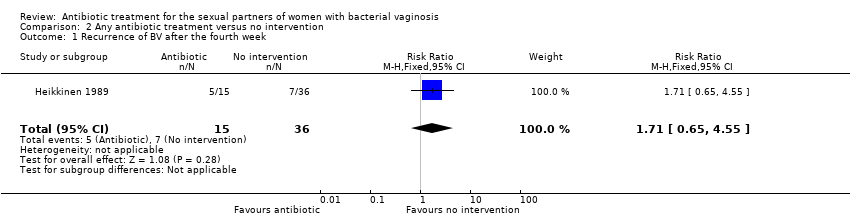
Comparison 2 Any antibiotic treatment versus no intervention, Outcome 1 Recurrence of BV after the fourth week.

Comparison 2 Any antibiotic treatment versus no intervention, Outcome 2 Clinical improvement between the first and fourth week.

Comparison 2 Any antibiotic treatment versus no intervention, Outcome 3 Symptomatic improvement after the fourth week.

Comparison 3 Any antibiotic treatment versus placebo (by antibiotic type), Outcome 1 Recurrence of BV after the fourth week.

Comparison 3 Any antibiotic treatment versus placebo (by antibiotic type), Outcome 2 Clinical improvement during the first week.

Comparison 3 Any antibiotic treatment versus placebo (by antibiotic type), Outcome 3 Clinical improvement between the first and fourth week.

Comparison 3 Any antibiotic treatment versus placebo (by antibiotic type), Outcome 4 Clinical improvement after the fourth week.
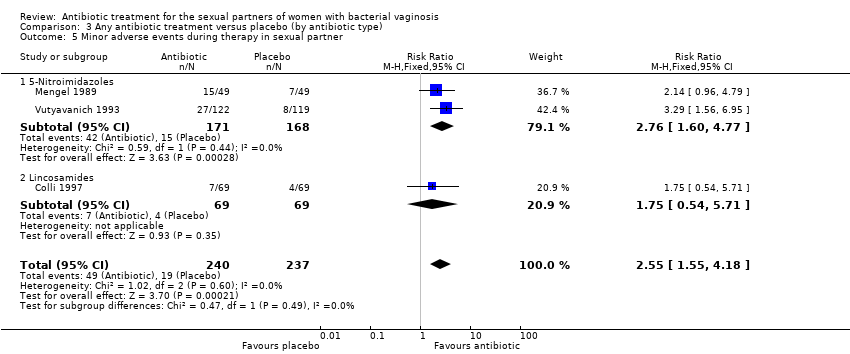
Comparison 3 Any antibiotic treatment versus placebo (by antibiotic type), Outcome 5 Minor adverse events during therapy in sexual partner.

Comparison 4 Any antibiotic treatment versus placebo (by dose), Outcome 1 Clinical improvement during the first week.

Comparison 4 Any antibiotic treatment versus placebo (by dose), Outcome 2 Clinical improvement between the first and fourth week.

Comparison 4 Any antibiotic treatment versus placebo (by dose), Outcome 3 Clinical improvement after the fourth week.

Comparison 4 Any antibiotic treatment versus placebo (by dose), Outcome 4 Symptomatic improvement during the first week.

Comparison 4 Any antibiotic treatment versus placebo (by dose), Outcome 5 Symptomatic improvement between the first and fourth week.
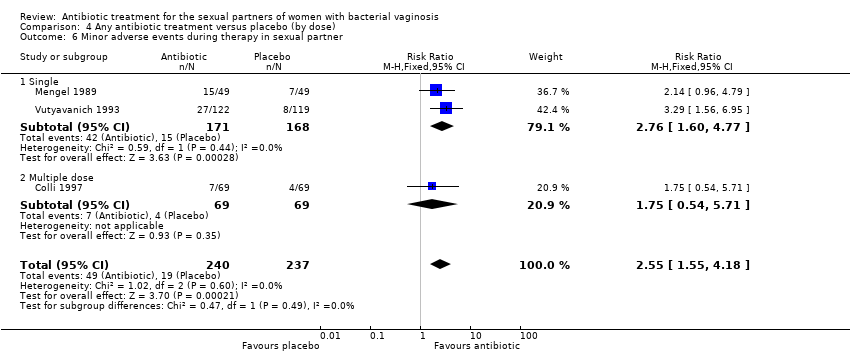
Comparison 4 Any antibiotic treatment versus placebo (by dose), Outcome 6 Minor adverse events during therapy in sexual partner.

Comparison 5 Any antibiotic treatment versus placebo (attrition bias), Outcome 1 Recurrence of BV after the fourth week.
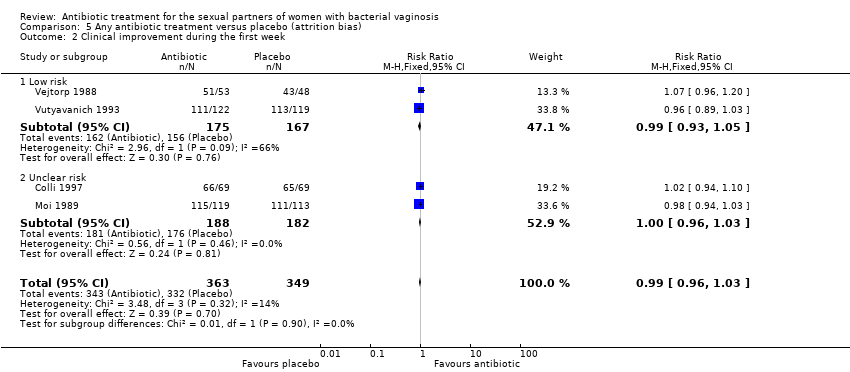
Comparison 5 Any antibiotic treatment versus placebo (attrition bias), Outcome 2 Clinical improvement during the first week.

Comparison 5 Any antibiotic treatment versus placebo (attrition bias), Outcome 3 Clinical improvement between the first and fourth week.

Comparison 5 Any antibiotic treatment versus placebo (attrition bias), Outcome 4 Clinical improvement after the fourth week.
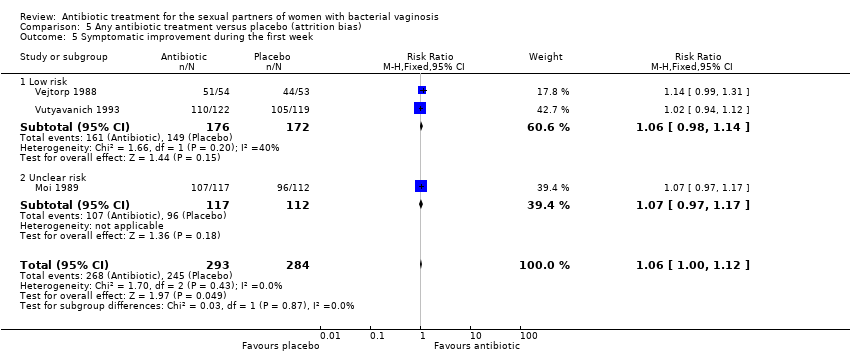
Comparison 5 Any antibiotic treatment versus placebo (attrition bias), Outcome 5 Symptomatic improvement during the first week.
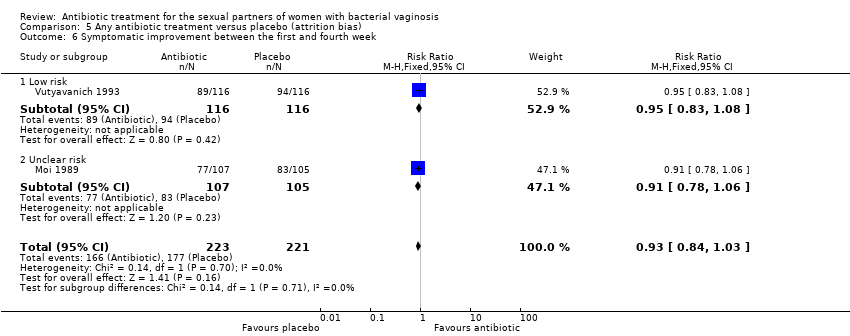
Comparison 5 Any antibiotic treatment versus placebo (attrition bias), Outcome 6 Symptomatic improvement between the first and fourth week.

Comparison 5 Any antibiotic treatment versus placebo (attrition bias), Outcome 7 Symptomatic improvement after the fourth week.

Comparison 5 Any antibiotic treatment versus placebo (attrition bias), Outcome 8 Minor adverse events during therapy in sexual partner.
| Any antibiotic treatment versus placebo for the sexual partners of woman with bacterial vaginosis | |||||
| Patient or population: sexual partners of women with bacterial vaginosis | |||||
| Outcomes | Anticipated absolute effects* (95% CI) | Relative effect | Number of participants | Quality of the evidence | |
| Risk with placebo | Risk with any antibiotic treatment | ||||
| Recurrence follow‐up 4 to 12 weeks | Study population | RR 1.00 | 372 | ⊕⊝⊝⊝ | |
| 196 per 1000 | 196 per 1000 | ||||
| Clinical improvement follow‐up 1 to 4 weeks | Study population | RR 1.02 | 590 | ⊕⊕⊕⊕ | |
| 778 per 1000 | 794 per 1000 | ||||
| Clinical improvement follow‐up 4 to 12 weeks | Study population | RR 0.98 | 572 | ⊕⊕⊕⊕ | |
| 778 per 1000 | 762 per 1000 | ||||
| Symptomatic improvement during the first week | Study population | RR 1.06 | 577 | ⊕⊕⊕⊕ | |
| 863 per 1000 | 914 per 1000 | ||||
| Symptomatic improvement follow‐up 1 to 4 weeks | Study population | RR 0.93 | 444 | ⊕⊕⊕⊕ | |
| 801 per 1000 | 745 per 1000 | ||||
| Symptomatic improvement follow‐up 4 to 12 weeks | Study population | RR 1.03 | 296 | ⊕⊕⊕⊕ | |
| 743 per 1000 | 766 per 1000 | ||||
| Minor adverse events in sexual partner | Study population | RR 2.55 | 477 | ⊕⊕⊝⊝ | |
| 80 per 1000 | 204 per 1000 | ||||
| *The risk in the intervention group (and its 95% CI) is based on the assumed risk in the comparison group and the relative effect of the intervention (and its 95% CI). | |||||
| GRADE Working Group grades of evidence | |||||
| 1Downgraded by 1 level for significant imprecision as the 95% CI was below 0.75 and over 1.25. | |||||
| Any antibiotic treatment versus no intervention | |||||
| Patient or population: sexual partners of women with bacterial vaginosis | |||||
| Outcomes | Anticipated absolute effects* (95% CI) | Relative effect | Number of participants | Quality of the evidence | |
| Risk with no intervention | Risk with any antibiotic treatment | ||||
| Recurrence follow‐up 4 to 12 weeks | Study population | RR 1.71 | 51 | ⊕⊝⊝⊝ | |
| 194 per 1000 | 333 per 1000 | ||||
| Clinical improvement follow‐up 1 to 4 weeks | Study population | RR 0.93 | 152 | ⊕⊝⊝⊝ | |
| 851 per 1000 | 792 per 1000 | ||||
| Symptomatic improvement follow‐up 4 to 12 weeks | Study population | RR 0.66 | 70 | ⊕⊝⊝⊝ | |
| 630 per 1000 | 416 per 1000 | ||||
| *The risk in the intervention group (and its 95% CI) is based on the assumed risk in the comparison group and the relative effect of the intervention (and its 95% CI). | |||||
| GRADE Working Group grades of evidence | |||||
| 1Downgraded by 2 levels due to imprecision as OIS was not achieved and the 95% CI crosses through 0.75 and 1.25. | |||||
| Any antibiotic treatment versus placebo | |||||
| Patient or population: sexual partners of women with bacterial vaginosis | |||||
| Outcomes | Anticipated absolute effects* (95% CI) | Relative effect | Number of participants | Quality of the evidence | |
| Risk with placebo | Risk with any antibiotic treatment | ||||
| Recurrence | Study population | RR 1.28 | 218 | ⊕⊕⊝⊝ | |
| 132 per 1000 | 169 per 1000 | ||||
| Clinical improvement during the first week | Study population | RR 0.99 | 712 | ⊕⊕⊕⊕ | |
| 951 per 1000 | 942 per 1000 | ||||
| *The risk in the intervention group (and its 95% CI) is based on the assumed risk in the comparison group and the relative effect of the intervention (and its 95% CI). | |||||
| GRADE Working Group grades of evidence | |||||
| 1Downgraded by 2 levels for imprecision as the 95% CI crosses through 0.75 and 1.25 and OIS is not achieved. | |||||
| Outcome or subgroup title | No. of studies | No. of participants | Statistical method | Effect size |
| 1 Recurrence of BV between the first and fourth week Show forest plot | 1 | 218 | Risk Ratio (M‐H, Fixed, 95% CI) | 1.28 [0.68, 2.43] |
| 2 Recurrence of BV after the fourth week Show forest plot | 3 | 372 | Risk Ratio (M‐H, Fixed, 95% CI) | 1.00 [0.67, 1.52] |
| 3 Clinical improvement during the first week Show forest plot | 4 | 712 | Risk Ratio (M‐H, Fixed, 95% CI) | 0.99 [0.96, 1.03] |
| 4 Clinical improvement between the first and fourth week Show forest plot | 3 | 590 | Risk Ratio (M‐H, Fixed, 95% CI) | 1.02 [0.94, 1.11] |
| 5 Clinical improvement after the fourth week Show forest plot | 4 | 572 | Risk Ratio (M‐H, Fixed, 95% CI) | 0.98 [0.90, 1.07] |
| 6 Symptomatic improvement during the first week Show forest plot | 3 | 577 | Risk Ratio (M‐H, Fixed, 95% CI) | 1.06 [1.00, 1.12] |
| 7 Symptomatic improvement between the first and fourth week Show forest plot | 2 | 444 | Risk Ratio (M‐H, Fixed, 95% CI) | 0.93 [0.84, 1.03] |
| 8 Symptomatic improvement after the fourth week Show forest plot | 2 | 296 | Risk Ratio (M‐H, Fixed, 95% CI) | 1.03 [0.90, 1.17] |
| 9 Minor adverse events during therapy in sexual partner Show forest plot | 3 | 477 | Risk Ratio (M‐H, Fixed, 95% CI) | 2.55 [1.55, 4.18] |
| Outcome or subgroup title | No. of studies | No. of participants | Statistical method | Effect size |
| 1 Recurrence of BV after the fourth week Show forest plot | 1 | 51 | Risk Ratio (M‐H, Fixed, 95% CI) | 1.71 [0.65, 4.55] |
| 2 Clinical improvement between the first and fourth week Show forest plot | 2 | 152 | Risk Ratio (M‐H, Random, 95% CI) | 0.93 [0.70, 1.25] |
| 3 Symptomatic improvement after the fourth week Show forest plot | 1 | 70 | Risk Ratio (M‐H, Fixed, 95% CI) | 0.66 [0.39, 1.11] |
| Outcome or subgroup title | No. of studies | No. of participants | Statistical method | Effect size |
| 1 Recurrence of BV after the fourth week Show forest plot | 3 | 372 | Risk Ratio (M‐H, Fixed, 95% CI) | 1.00 [0.67, 1.52] |
| 1.1 5‐Nitroimidazoles | 2 | 288 | Risk Ratio (M‐H, Fixed, 95% CI) | 1.17 [0.74, 1.84] |
| 1.2 Lincosamides | 1 | 84 | Risk Ratio (M‐H, Fixed, 95% CI) | 0.53 [0.19, 1.45] |
| 2 Clinical improvement during the first week Show forest plot | 4 | 712 | Risk Ratio (M‐H, Fixed, 95% CI) | 0.99 [0.96, 1.03] |
| 2.1 5‐Nitroimidazoles | 3 | 574 | Risk Ratio (M‐H, Fixed, 95% CI) | 0.99 [0.95, 1.03] |
| 2.2 Lincosamides | 1 | 138 | Risk Ratio (M‐H, Fixed, 95% CI) | 1.02 [0.94, 1.10] |
| 3 Clinical improvement between the first and fourth week Show forest plot | 3 | 590 | Risk Ratio (M‐H, Fixed, 95% CI) | 1.02 [0.94, 1.11] |
| 3.1 5‐Nitroimidazoles | 2 | 451 | Risk Ratio (M‐H, Fixed, 95% CI) | 1.03 [0.93, 1.14] |
| 3.2 Lincosamides | 1 | 139 | Risk Ratio (M‐H, Fixed, 95% CI) | 0.98 [0.87, 1.11] |
| 4 Clinical improvement after the fourth week Show forest plot | 4 | 572 | Risk Ratio (M‐H, Fixed, 95% CI) | 0.98 [0.90, 1.07] |
| 4.1 5‐Nitroimidazoles | 3 | 433 | Risk Ratio (M‐H, Fixed, 95% CI) | 0.99 [0.90, 1.08] |
| 4.2 Lincosamides | 1 | 139 | Risk Ratio (M‐H, Fixed, 95% CI) | 0.97 [0.78, 1.22] |
| 5 Minor adverse events during therapy in sexual partner Show forest plot | 3 | 477 | Risk Ratio (M‐H, Fixed, 95% CI) | 2.55 [1.55, 4.18] |
| 5.1 5‐Nitroimidazoles | 2 | 339 | Risk Ratio (M‐H, Fixed, 95% CI) | 2.76 [1.60, 4.77] |
| 5.2 Lincosamides | 1 | 138 | Risk Ratio (M‐H, Fixed, 95% CI) | 1.75 [0.54, 5.71] |
| Outcome or subgroup title | No. of studies | No. of participants | Statistical method | Effect size |
| 1 Clinical improvement during the first week Show forest plot | 4 | 712 | Risk Ratio (M‐H, Fixed, 95% CI) | 0.99 [0.96, 1.03] |
| 1.1 Single | 1 | 241 | Risk Ratio (M‐H, Fixed, 95% CI) | 0.96 [0.89, 1.03] |
| 1.2 Multiple dose | 3 | 471 | Risk Ratio (M‐H, Fixed, 95% CI) | 1.01 [0.97, 1.05] |
| 2 Clinical improvement between the first and fourth week Show forest plot | 3 | 590 | Risk Ratio (M‐H, Fixed, 95% CI) | 1.02 [0.94, 1.11] |
| 2.1 Single | 1 | 233 | Risk Ratio (M‐H, Fixed, 95% CI) | 1.13 [0.95, 1.35] |
| 2.2 Multiple dose | 2 | 357 | Risk Ratio (M‐H, Fixed, 95% CI) | 0.97 [0.89, 1.05] |
| 3 Clinical improvement after the fourth week Show forest plot | 4 | 572 | Risk Ratio (M‐H, Fixed, 95% CI) | 0.98 [0.90, 1.07] |
| 3.1 Single | 1 | 138 | Risk Ratio (M‐H, Fixed, 95% CI) | 1.00 [0.86, 1.18] |
| 3.2 Multiple dose | 3 | 434 | Risk Ratio (M‐H, Fixed, 95% CI) | 0.98 [0.88, 1.09] |
| 4 Symptomatic improvement during the first week Show forest plot | 3 | 577 | Risk Ratio (M‐H, Fixed, 95% CI) | 1.06 [1.00, 1.12] |
| 4.1 Single | 1 | 241 | Risk Ratio (M‐H, Fixed, 95% CI) | 1.02 [0.94, 1.12] |
| 4.2 Multiple dose | 2 | 336 | Risk Ratio (M‐H, Fixed, 95% CI) | 1.09 [1.01, 1.18] |
| 5 Symptomatic improvement between the first and fourth week Show forest plot | 2 | 444 | Risk Ratio (M‐H, Fixed, 95% CI) | 0.93 [0.84, 1.03] |
| 5.1 Single | 1 | 232 | Risk Ratio (M‐H, Fixed, 95% CI) | 0.95 [0.83, 1.08] |
| 5.2 Multiple dose | 1 | 212 | Risk Ratio (M‐H, Fixed, 95% CI) | 0.91 [0.78, 1.06] |
| 6 Minor adverse events during therapy in sexual partner Show forest plot | 3 | 477 | Risk Ratio (M‐H, Fixed, 95% CI) | 2.55 [1.55, 4.18] |
| 6.1 Single | 2 | 339 | Risk Ratio (M‐H, Fixed, 95% CI) | 2.76 [1.60, 4.77] |
| 6.2 Multiple dose | 1 | 138 | Risk Ratio (M‐H, Fixed, 95% CI) | 1.75 [0.54, 5.71] |
| Outcome or subgroup title | No. of studies | No. of participants | Statistical method | Effect size |
| 1 Recurrence of BV after the fourth week Show forest plot | 3 | 372 | Risk Ratio (M‐H, Fixed, 95% CI) | 1.00 [0.67, 1.52] |
| 1.1 Low risk | 1 | 98 | Risk Ratio (M‐H, Fixed, 95% CI) | 0.96 [0.48, 1.92] |
| 1.2 Unclear risk | 2 | 274 | Risk Ratio (M‐H, Fixed, 95% CI) | 1.03 [0.62, 1.71] |
| 2 Clinical improvement during the first week Show forest plot | 4 | 712 | Risk Ratio (M‐H, Fixed, 95% CI) | 0.99 [0.96, 1.03] |
| 2.1 Low risk | 2 | 342 | Risk Ratio (M‐H, Fixed, 95% CI) | 0.99 [0.93, 1.05] |
| 2.2 Unclear risk | 2 | 370 | Risk Ratio (M‐H, Fixed, 95% CI) | 1.00 [0.96, 1.03] |
| 3 Clinical improvement between the first and fourth week Show forest plot | 3 | 590 | Risk Ratio (M‐H, Fixed, 95% CI) | 1.02 [0.94, 1.11] |
| 3.1 Low risk | 1 | 233 | Risk Ratio (M‐H, Fixed, 95% CI) | 1.13 [0.95, 1.35] |
| 3.2 Unclear risk | 2 | 357 | Risk Ratio (M‐H, Fixed, 95% CI) | 0.97 [0.89, 1.05] |
| 4 Clinical improvement after the fourth week Show forest plot | 4 | 572 | Risk Ratio (M‐H, Fixed, 95% CI) | 0.98 [0.90, 1.07] |
| 4.1 Low risk | 2 | 243 | Risk Ratio (M‐H, Fixed, 95% CI) | 1.03 [0.90, 1.17] |
| 4.2 Unclear risk | 2 | 329 | Risk Ratio (M‐H, Fixed, 95% CI) | 0.95 [0.84, 1.07] |
| 5 Symptomatic improvement during the first week Show forest plot | 3 | 577 | Risk Ratio (M‐H, Fixed, 95% CI) | 1.06 [1.00, 1.12] |
| 5.1 Low risk | 2 | 348 | Risk Ratio (M‐H, Fixed, 95% CI) | 1.06 [0.98, 1.14] |
| 5.2 Unclear risk | 1 | 229 | Risk Ratio (M‐H, Fixed, 95% CI) | 1.07 [0.97, 1.17] |
| 6 Symptomatic improvement between the first and fourth week Show forest plot | 2 | 444 | Risk Ratio (M‐H, Fixed, 95% CI) | 0.93 [0.84, 1.03] |
| 6.1 Low risk | 1 | 232 | Risk Ratio (M‐H, Fixed, 95% CI) | 0.95 [0.83, 1.08] |
| 6.2 Unclear risk | 1 | 212 | Risk Ratio (M‐H, Fixed, 95% CI) | 0.91 [0.78, 1.06] |
| 7 Symptomatic improvement after the fourth week Show forest plot | 2 | 296 | Risk Ratio (M‐H, Fixed, 95% CI) | 1.03 [0.90, 1.17] |
| 7.1 Low risk | 1 | 107 | Risk Ratio (M‐H, Fixed, 95% CI) | 1.03 [0.83, 1.29] |
| 7.2 Unclear risk | 1 | 189 | Risk Ratio (M‐H, Fixed, 95% CI) | 1.02 [0.87, 1.20] |
| 8 Minor adverse events during therapy in sexual partner Show forest plot | 3 | 477 | Risk Ratio (M‐H, Fixed, 95% CI) | 2.55 [1.55, 4.18] |
| 8.1 Low risk | 2 | 339 | Risk Ratio (M‐H, Fixed, 95% CI) | 2.76 [1.60, 4.77] |
| 8.2 Unclear risk | 1 | 138 | Risk Ratio (M‐H, Fixed, 95% CI) | 1.75 [0.54, 5.71] |