Tratamiento con antibióticos para las parejas sexuales de las pacientes con vaginosis bacteriana
Resumen
Antecedentes
La vaginosis bacteriana (VB) es una infección con una prevalencia de entre un 10% a un 50% en todo el mundo. La VB da lugar a un desequilibrio de la flora vaginal normal. Los microorganismos asociados con la VB han sido aislados de la flora normal del aparato genital masculino, y su presencia podría estar relacionada con la recurrencia de la VB después del tratamiento con antibióticos. Por lo tanto, el tratamiento de las parejas sexuales podría reducir la recurrencia de la infección y quizás la carga de la enfermedad.
Objetivos
Evaluar la efectividad en pacientes mujeres y la seguridad en pacientes hombres del tratamiento concurrente con antibióticos para las parejas sexuales de las pacientes con tratamiento para la VB.
Métodos de búsqueda
Se hicieron búsquedas en el registro especializado del Grupo Cochrane de Infecciones de Transmisión Sexual (Cochrane Sexually Transmitted Infections Group Specialized Register) (23 julio 2016), CENTRAL (1991 hasta 23 julio 2016), MEDLINE (1946 hasta 23 julio 2016), Embase (1974 hasta 23 julio 2016), LILACS (1982 hasta 23 julio 2016), la World Health Organization (WHO) International Clinical Trials Registry Platform (ICTRP) (23 julio 2016), ClinicalTrials.gov (23 julio 2016) y en Web of Science™ (2001 hasta 23 julio 2016). También se realizaron búsquedas manuales en actas de congresos, se contactó con los autores de los ensayos y se revisaron las listas de referencias de los estudios recuperados.
Criterios de selección
Ensayos controlados aleatorios (ECA) que comparaban el uso concurrente de cualquier tratamiento con antibióticos con placebo, ninguna intervención o cualquier otra intervención para las parejas sexuales de las pacientes con tratamiento para la VB.
Obtención y análisis de los datos
Tres autores de la revisión, de forma independiente, evaluaron los ensayos para la inclusión, extrajeron los datos y evaluaron el riesgo de sesgo en los estudios incluidos. Los desacuerdos se resolvieron mediante consenso. La calidad de las pruebas se evaluó mediante el enfoque GRADE.
Resultados principales
Siete ECA (1026 participantes) cumplieron los criterios de inclusión, y la industria farmacéutica financió cuatro de estos ensayos. Cinco ensayos (854 pacientes) compararon cualquier tratamiento con antibióticos para las parejas sexuales versus placebo. Basado en pruebas de alta calidad, el tratamiento con antibióticos no aumenta la tasa de mejoría clínica o sintomática en las pacientes durante la primera semana (cociente de riesgos [CR] 0,99; intervalo de confianza [IC] del 95%: 0,96 a 1,03; 712 participantes, cuatro estudios; CR 1,06; IC del 95%: 1,00 a 1,12; 577 pacientes, tres estudios, respectivamente), entre la primera y la cuarta semana (CR 1,02; IC del 95%: 0,94 a 1,11; 590 participantes, tres estudios; CR 0,93; IC del 95%: 0,84 a 1,03; 444 participantes, dos estudios; respectivamente) o después de la cuarta semana (CR 0,98; IC del 95%: 0,90 a 1,07; 572 participantes, cuatro estudios; CR 1,03; IC del 95%: 0,90 a 1,17; 296 participantes, dos estudios; respectivamente). El tratamiento con antibióticos no da lugar a una recurrencia inferior durante la primera y la cuarta semana (CR 1,28; IC del 95%: 0,68 a 2,43; 218 participantes, un estudio; pruebas de baja calidad) o después de la cuarta semana de tratamiento (CR 1,00; IC del 95%: 0,67 a 1,52; 372 participantes, tres estudios; pruebas de baja calidad) en las pacientes, aunque aumenta la frecuencia de los eventos adversos (más frecuentemente los síntomas gastrointestinales) informados por las parejas sexuales (CR 2,55; IC del 95%: 1,55 a 4,18; 477 participantes, tres estudios; pruebas de baja calidad).
Dos ensayos (172 participantes) compararon cualquier tratamiento con antibióticos para las parejas sexuales con ninguna intervención. Cuando se lo comparó con ninguna intervención, los efectos del tratamiento con antibióticos en la tasa de recurrencia después de la cuarta semana (CR 1,71; IC del 95%: 0,65 a 4,55; 51 participantes, un estudio), la mejoría clínica entre la primera y la cuarta semana (CR 0,93; IC del 95%: 0,70 a 1,25; 152 participantes, dos estudios) y la mejoría sintomática después de la cuarta semana (CR 0,66; IC del 95%: 0,39 a 1,11; 70 participantes, un estudio) fueron imprecisos y no hubo diferencias entre los grupos. Se disminuyó la calificación de la calidad de las pruebas a baja o muy baja.
Conclusiones de los autores
Las pruebas de alta calidad indican que el tratamiento con antibióticos para las parejas sexuales de las pacientes con VB, en comparación con placebo, no aumenta la tasa de mejoría clínica o sintomática durante la primera, entre la primera y la cuarta o después de la cuarta semana en las pacientes. Hay pruebas de baja calidad que sugieren que el tratamiento con antibióticos no da lugar a una tasa de recurrencia inferior durante la primera y la cuarta o después de la cuarta semana de tratamiento en las pacientes, aunque aumenta la frecuencia de los eventos adversos informados por las parejas sexuales. Finalmente, en comparación con ninguna intervención, el tratamiento con antibióticos no reduce la tasa de recurrencia después de la cuarta semana y no aumenta la frecuencia de la mejoría clínica o sintomática entre la primera y la cuarta o después de la cuarta semana en las pacientes, respectivamente.
PICOs
Resumen en términos sencillos
Tratamiento con antibióticos para las parejas sexuales de las pacientes con vaginosis bacteriana
Pregunta de la revisión
Se evaluó la efectividad en las pacientes mujeres y la seguridad en los pacientes hombres del tratamiento concurrente con antibióticos para las parejas sexuales de las pacientes con tratamiento para la vaginosis bacteriana (VB).
Antecedentes
La vaginosis bacteriana (VB) es una infección con una prevalencia de entre un 10% a un 50% en todo el mundo. La VB da lugar a un desequilibrio de la flora vaginal normal. Los microorganismos asociados con la VB han sido aislados de la flora normal del aparato genital masculino, y su presencia podría estar relacionada con la recurrencia de la infección después del tratamiento con antibióticos. Por lo tanto, el tratamiento de las parejas sexuales podría ofrecer ventajas relacionadas con la reducción de la recurrencia de la infección y posiblemente de la carga de la enfermedad.
Características de los ensayos
Los investigadores Cochrane buscaron en la literatura disponible hasta el 23 de julio de 2016 e incluyeron siete ensayos con 1026 participantes. Los ensayos incluyeron a pacientes mujeres no embarazadas sexualmente activas entre 17 y 56 años de edad, solteras o casadas, con VB sintomática. Cuatro estudios sólo incluyeron a pacientes involucradas en una relación heterosexual monógama y no hubo información acerca de este tema en los ensayos restantes. Seis ensayos utilizaron 5‐nitroimidazoles para el tratamiento en la pareja sexual, cuatro ensayos utilizaron metronidazol y dos ensayos usaron tinidazol; sólo un estudio utilizó una lincosamida para el tratamiento. Cinco ensayos compararon antibióticos versus placebo (854 participantes) y dos ensayos compararon el tratamiento con antibióticos con ninguna intervención (172 participantes). Las compañías farmacéuticas financiaron cuatro de los ensayos incluidos.
Resultados clave
En comparación con placebo, el tratamiento con antibióticos para las parejas sexuales de las pacientes con tratamiento para la VB no tuvo ningún efecto sobre la mejoría clínica o sintomática en las pacientes, de forma independiente del período sobre el cual los ensayos evaluaron estos resultados (durante la primera, entre la primera y la cuarta o después de la cuarta semana). Además, el tratamiento con antibióticos de la pareja sexual puede no tener ningún efecto sobre la recurrencia de la VB hasta 12 semanas después del tratamiento, aunque puede aumentar la frecuencia de los eventos adversos menores informados por las parejas sexuales. En comparación con ninguna intervención, el tratamiento de las parejas sexuales de las pacientes con VB puede no tener ningún efecto sobre la reducción de la tasa de recurrencia ni sobre la frecuencia de la mejoría clínica o sintomática entre la primera y la cuarta o después de la cuarta semana, respectivamente.
Calidad de la evidencia
La calidad de las pruebas fue alta para los resultados de la mejoría clínica y sintomática. La calidad de las pruebas fue muy baja para la recurrencia debido a algunas limitaciones con respecto al riesgo de sesgo y la imprecisión.
Conclusiones de los autores
Summary of findings
| Any antibiotic treatment versus placebo for the sexual partners of woman with bacterial vaginosis | |||||
| Patient or population: sexual partners of women with bacterial vaginosis | |||||
| Outcomes | Anticipated absolute effects* (95% CI) | Relative effect | Number of participants | Quality of the evidence | |
| Risk with placebo | Risk with any antibiotic treatment | ||||
| Recurrence follow‐up 4 to 12 weeks | Study population | RR 1.00 | 372 | ⊕⊝⊝⊝ | |
| 196 per 1000 | 196 per 1000 | ||||
| Clinical improvement follow‐up 1 to 4 weeks | Study population | RR 1.02 | 590 | ⊕⊕⊕⊕ | |
| 778 per 1000 | 794 per 1000 | ||||
| Clinical improvement follow‐up 4 to 12 weeks | Study population | RR 0.98 | 572 | ⊕⊕⊕⊕ | |
| 778 per 1000 | 762 per 1000 | ||||
| Symptomatic improvement during the first week | Study population | RR 1.06 | 577 | ⊕⊕⊕⊕ | |
| 863 per 1000 | 914 per 1000 | ||||
| Symptomatic improvement follow‐up 1 to 4 weeks | Study population | RR 0.93 | 444 | ⊕⊕⊕⊕ | |
| 801 per 1000 | 745 per 1000 | ||||
| Symptomatic improvement follow‐up 4 to 12 weeks | Study population | RR 1.03 | 296 | ⊕⊕⊕⊕ | |
| 743 per 1000 | 766 per 1000 | ||||
| Minor adverse events in sexual partner | Study population | RR 2.55 | 477 | ⊕⊕⊝⊝ | |
| 80 per 1000 | 204 per 1000 | ||||
| *The risk in the intervention group (and its 95% CI) is based on the assumed risk in the comparison group and the relative effect of the intervention (and its 95% CI). | |||||
| GRADE Working Group grades of evidence | |||||
| 1Downgraded by 1 level for significant imprecision as the 95% CI was below 0.75 and over 1.25. | |||||
| Any antibiotic treatment versus no intervention | |||||
| Patient or population: sexual partners of women with bacterial vaginosis | |||||
| Outcomes | Anticipated absolute effects* (95% CI) | Relative effect | Number of participants | Quality of the evidence | |
| Risk with no intervention | Risk with any antibiotic treatment | ||||
| Recurrence follow‐up 4 to 12 weeks | Study population | RR 1.71 | 51 | ⊕⊝⊝⊝ | |
| 194 per 1000 | 333 per 1000 | ||||
| Clinical improvement follow‐up 1 to 4 weeks | Study population | RR 0.93 | 152 | ⊕⊝⊝⊝ | |
| 851 per 1000 | 792 per 1000 | ||||
| Symptomatic improvement follow‐up 4 to 12 weeks | Study population | RR 0.66 | 70 | ⊕⊝⊝⊝ | |
| 630 per 1000 | 416 per 1000 | ||||
| *The risk in the intervention group (and its 95% CI) is based on the assumed risk in the comparison group and the relative effect of the intervention (and its 95% CI). | |||||
| GRADE Working Group grades of evidence | |||||
| 1Downgraded by 2 levels due to imprecision as OIS was not achieved and the 95% CI crosses through 0.75 and 1.25. | |||||
| Any antibiotic treatment versus placebo | |||||
| Patient or population: sexual partners of women with bacterial vaginosis | |||||
| Outcomes | Anticipated absolute effects* (95% CI) | Relative effect | Number of participants | Quality of the evidence | |
| Risk with placebo | Risk with any antibiotic treatment | ||||
| Recurrence | Study population | RR 1.28 | 218 | ⊕⊕⊝⊝ | |
| 132 per 1000 | 169 per 1000 | ||||
| Clinical improvement during the first week | Study population | RR 0.99 | 712 | ⊕⊕⊕⊕ | |
| 951 per 1000 | 942 per 1000 | ||||
| *The risk in the intervention group (and its 95% CI) is based on the assumed risk in the comparison group and the relative effect of the intervention (and its 95% CI). | |||||
| GRADE Working Group grades of evidence | |||||
| 1Downgraded by 2 levels for imprecision as the 95% CI crosses through 0.75 and 1.25 and OIS is not achieved. | |||||
Antecedentes
Descripción de la afección
Las secreciones de la vagina (conocidas como exudado vaginal) son normales y resultan de la secreción cervical y otros componentes derivados de los microorganismos que colonizan la flora vaginal, sobre todo lactobacilos (Mylonas 2011). Los lactobacilos desempeñan una función predominante en la homeostasis vaginal mediante la producción de ácido láctico, peróxido de hidrógeno y bacteriocinas, que son compuestos que controlan el sobrecrecimiento de los microorganismos patógenos (Taylor 2013). Un aumento de la cantidad de exudado vaginal se asocia generalmente con la presencia de una infección del aparato genital (Mylonas 2011). Las pacientes con un exudado vaginal anormal en su mayoría presenta vaginosis bacteriana (VB) (39,6%) o, con menor frecuencia, candidiasis vulvovaginal (11%) o tricomoniasis (0,8%); sin embargo, la etiología exacta del exudado vaginal puede cambiar de acuerdo a la población (�?ngel‐Müller 2012). Se cree que la VB surge como resultado de un desequilibrio en la flora vaginal normal cuando disminuye la concentración de lactobacilos y son reemplazados por bacterias anaerobias y aerobias facultativas (Taylor 2013), como Gardnerella vaginalis(40%) o, con menor frecuencia, por Mycoplasma hominis, Clostridia (Mirmonsef 2012), Peptostreptococcus o Mobiluncus (Mylonas 2011). Aunque la causa precisa de esta disbacteriosis no se comprende completamente, algunos factores, como la actividad sexual alta, una nueva pareja sexual y un comportamiento sexual peligroso (Bradshaw 2005; Mirmonsef 2012; Mylonas 2011), podrían contribuir con esta afección (Mylonas 2011).
La VB se encuentra en todo el mundo con una prevalencia de entre un 10% y un 50%, y generalmente es mayor entre los trabajadores sexuales, los pacientes seropositivos para el VIH, las mujeres de raza negra e hispanas (Kenyon 2013) y entre mujeres con una nueva pareja sexual o un número alto de parejas sexuales (Marrazzo 2011). El hecho de haber tenido tres o más parejas sexuales masculinas en los últimos 12 meses se ha identificado como un factor de riesgo de VB (Marrazzo 2011). Además, se ha informado que el hecho de tener una pareja sexual femenina aumenta el riesgo de VB en un 60% (Smart 2004). La carga de la VB está relacionada no sólo a la prevalencia de la afección, sino también a una reducción de la calidad de vida, así como a la ansiedad y los sentimientos de cohibición relacionados con el temor a la exclusión debido al mal olor asociado con la infección (Bilardi 2013). Las bacterias asociadas con la VB pueden ser transportadas por los genitales masculinos, aunque los hombres generalmente son asintomáticos (Nelson 2012). El costo directo de la atención de la VB se ha evaluado en pacientes embarazadas y está particularmente relacionado con las complicaciones del embarazo que derivan de la misma: en un estudio que evaluó a una población de los EE.UU., los Países Bajos y el Reino Unido se calculó que el costo global de la VB fue de alrededor de 1 000 000 000 USD por año (Oleen‐Burkey 1995). La VB también se ha asociado con el riesgo de contraer una infección de transmisión sexual (ITS), como la enfermedad pélvica inflamatoria (Mirmonsef 2012; Taylor 2013) e infecciones causadas por Neisseria gonorrhoeae, Chlamydiia trachomatis y VIH (Mirmonsef 2012) y con un riesgo mayor de desarrollar cáncer cervicouterino (Gillet 2012) e incluso subfertilidad (Taylor 2013). Además, la VB puede aumentar el riesgo de resultados perinatales adversos, como bajo peso al nacer, parto prematuro y muy bajo peso al nacer (Sangkomkamhang 2008), y puede dar lugar a cerca de 80 000 partos excesivamente prematuros por año en los EE.UU. (Goldenberg 2005).
Los criterios Amsel y la tinción de Gram pueden usarse para diagnosticar la VB, y la tinción de Gram se considera el valor de referencia (gold standard) para esta finalidad (Workowski 2015). El sistema de calificación de Nugent se aplica a las tinciones de Gram de los frotis vaginales para calcular visualmente los números de lactobacilos y los microorganismos asociados con la VB; una puntuación Nugent de cero a tres se considera saludable, cuatro a seis es intermedio y siete a diez implica la presencia de VB (Brotman 2011). Este método tiene una serie de desventajas: se requiere un profesional entrenado para la interpretación de los resultados y la tinción de Gram no puede detectar algunos microorganismos, como Ureaplasma y Micoplasma (Taylor 2013). Cuando la tinción de Gram no es posible, los criterios Amsel proporcionan una buena herramienta clínica para el diagnóstico de la VB, que requiere la presencia de al menos tres de los siguientes cuatro criterios (Taylor 2013).
-
Exudado vaginal homogéneo, poco consistente, blanco.
-
Presencia de células indicadoras en la revisión microscópica.
-
Un pH mayor que 4,5.
-
Una “prueba de olor” positiva (un olor sospechoso después de agregar hidróxido de potasio al 10%).
Los cultivos in vitro para la G. vaginalis son de utilidad limitada debido a que aunque los cultivos en casi todas las pacientes con una infección sintomática son positivos, un 50% de los cultivos de las pacientes asintomáticas saludables también son positivos (Mylonas 2011). Finalmente, en algunas circunstancias es posible lograr un diagnóstico mediante la combinación de la historia clínica con la caracterización clínica del exudado durante una revisión ginecológica (Ministerio de Salud y Protección Social 2013). Este enfoque, el enfoque sindrómico, se basa en la presuposición de que las infecciones del aparato genital comparten algunos síntomas y signos comunes lo cual permite asignarles una etiología específica sin la necesidad de una prueba de laboratorio (Ministerio de Salud y Protección Social 2013).
En la actualidad no se considera a la VB una ITS aunque está bien establecido que ambas tienen muchos aspectos en común (Morris 2001). Varios estudios informaron una asociación entre la VB y la coexistencia de ITS, comportamientos sexuales peligrosos, edad temprana al momento del primer coito, el hecho de compartir juguetes sexuales, y una nueva pareja sexual o múltiples parejas sexuales masculinas o femeninas (Chavez 2009; Fethers 2008; Fethers 2009; Marrazzo 2005; Morris 2001). Además, la VB es poco común en las pacientes sin antecedentes de contacto sexual (Fethers 2009), y su prevalencia es menos frecuente en las pacientes que informan que usan preservativos regularmente o que tienen una pareja sexual estable (Chavez 2009; Fethers 2008); estos hallazgos son compatibles con una asociación fuerte entre la VB y la actividad sexual (Fethers 2009).
Además, algunos estudios han propuesto que las bacterias asociadas con la VB pueden ser trasportadas por los genitales masculinos (Nelson 2012), basado en el aislamiento microbiológico de los microorganismos asociados con esta infección en la flora del pene y la uretra en las parejas masculinas de las pacientes infectadas (Mandar 2013; Nelson 2012). Este hecho es particularmente notable en los hombres no circuncidados en los que la presencia de una superficie mayor de contacto podría tener una función principal como reservorio, y favorecer la aparición de una infección después del coito (Bukusi 2011; Mehta 2012). Las bacterias asociadas con la VB han sido aisladas de la flora normal del surco coronal masculino y la uretra y podría estar relacionadas con la infección en las parejas femeninas y a la recurrencia de la infección después del tratamiento (observada en alrededor de un 20% de los individuos y definida como tres o más episodios comprobados de VB en 12 meses) (Colli 1997; Cook 1992). Otro mecanismo para la infección podría ser la transferencia mecánica de las bacterias entéricas perineales de la flora de los genitales masculinos mediante el coito con y sin protección (Mandar 2013).
Descripción de la intervención
Debido a que se considera que la VB surge de un desequilibrio en la flora vaginal normal (Taylor 2013), el tratamiento incluye la administración de antibióticos, como nitroimidazoles, lincosamidas, macrólidos (p.ej. eritromicina) y, en algunas circunstancias, penicilinas (Oduyebo 2009; Workowski 2015), cuyo objetivo es erradicar la flora bacteriana vaginal anormal (Mylonas 2011). Los derivados de los 5‐nitroimidazoles están disponibles para la administración oral e intravaginal (Workowski 2015). Estos fármacos se absorben completamente después de la ingesta oral y el volumen de distribución de estos agentes se aproxima al del agua corporal total debido a que se asocian con un nivel bajo de unión a las proteínas (Lamp 1999). Los derivados de los 5‐nitroimidazoles penetran bien en los tejidos y los líquidos corporales, con la excepción de la placenta, y se eliminan en la orina después de metabolizarse en el hígado (Brunton 2011; Trevor 2012). Los efectos secundarios de los 5‐nitroimidazoles son generalmente leves y los más comunes son cefalea, náuseas, sensación de sequedad en la boca y sabor metálico (Brunton 2011; Trevor 2012). Los regímenes recomendados para el tratamiento de la VB incluyen metronidazol 500 mg por vía oral dos veces al día durante siete días o una aplicación total (5 g) de metronidazol gel al 0,75% de forma intravaginal una vez al día durante cinco días; tinidazol 2 g por vía oral una vez al día durante uno o dos días o 1 g por vía oral una vez al día durante cinco días; o secnidazol 1 g o 2 g por vía oral en dosis únicas (Oduyebo 2009; Workowski 2015).
La clindamicina, la más representativa de las lincosamidas, se absorbe casi completamente luego de la administración oral (Bouazza 2012), con una vida media de alrededor de tres horas, y es ampliamente distribuida en los líquidos y los tejidos (Bouazza 2012; Gatti 1993). Más del 80% de este agente está ligado a las proteínas del plasma, principalmente a la α1‐glucoproteína ácida (Flaherty 1996); se metaboliza en el hígado mediante el citocromo P450 3A4 y se excreta en la orina y la bilis (Trevor 2012; Wynalda 2003, Yasuda 2008). Los efectos secundarios más frecuentes relacionados con la administración de clindamicina incluyen diarrea y, en un número pequeño de individuos, colitis pseudomembranosa (Gurwith 1977). Pueden ocurrir erupciones en alrededor del 10% de los individuos; otras reacciones, como el síndrome de Stevens‐Johnson, la elevación reversible de las transaminasas, la granulocitopenia, la trombocitopenia y las reacciones anafilácticas, son menos frecuentes (Brunton 2011). Los regímenes sugeridos para el tratamiento de la VB incluyen una aplicación total de crema de clindamicina al 2% (5 mg) de forma intravaginal a la hora de acostarse durante siete días; clindamicina 300 mg por vía oral dos veces al día durante siete días; u óvulos de clindamicina 100 mg de forma intravaginal una vez al día a la hora de acostarse durante tres días (Workowski 2015).
La vida media sérica de la eritromicina es de cerca de dos horas (Josefsson 1982; Zuckerman 2011). El fármaco se metaboliza en el hígado mediante el citocromo P450 3A4 y un 2% a un 5% se elimina de una forma activa en la orina (Trevor 2012; Zuckerman 2011). La hepatitis colestásica es el efecto secundario más notable de los macrólidos y también se ha observado hepatotoxicidad (Derby 1993). Las dosis grandes se han asociado con retortijones abdominales, náuseas, vómitos y diarrea (Zuckerman 2011). Entre las reacciones alérgicas reconocidas se encuentran la fiebre, la eosinofilia y las erupciones cutáneas, que pueden ocurrir solas o en combinación; todas desaparecen poco después de suspender el tratamiento (Brunton 2011). La eritromicina para el tratamiento de la VB se usa a una dosis de 333 mg por vía oral tres veces al día durante 14 días en combinación con metronidazol (Brocklehurst 2013).
Algunos estudios han usado la aminopenicilina amoxicilina para el tratamiento de la VB (Amit 2013; Brocklehurst 2013). Este agente es una penicilina semisintética con una vida media de casi 80 minutos, que se une a las proteínas en el plasma y se excreta en los riñones (Brocklehurst 2013). Los efectos secundarios más importantes asociados con la amoxicilina son náuseas, vómitos, erupciones y colitis asociada con los antibióticos. La administración de ampicilina actualmente se evita en general debido a la aparición de bacterias resistentes a la ampicilina en los individuos con VB (Amit 2013).
De qué manera podría funcionar la intervención
Hasta la fecha, las pruebas con respecto a si tratar o no a la pareja sexual de una mujer con VB son no concluyentes (Mehta 2013; Potter 1999). Debido a que los antibióticos administrados con frecuencia para el tratamiento de la VB son distribuidos ampliamente en los líquidos y los tejidos del cuerpo humano (Bouazza 2012; Brunton 2011; Gatti 1993; Trevor 2012), el tratamiento de las parejas sexuales podría eliminar la flora anormal presente en el área genital masculina que puede promover la recaída, o una nueva infección, en las pacientes con VB (Bradshaw 2006).
Los derivados de los 5‐nitroimidazoles son agentes con propiedades antiprotozoarias y antibacterianas (Amit 2013). Cuando un 5‐nitroimidazol se introduce en el ambiente celular, es reducido por el sistema de piruvato ferredoxina oxidorreductasa presente en la mitocondria bacteriana, que modifica su estructura química (Amit 2013). El piruvato ferredoxina oxidorreductasa genera trifosfato de adenosina (ATP) mediante la descarboxilación oxidativa del piruvato; en presencia de un 5‐nitroimidazol estructuralmente modificado, los electrones que serían transferidos a los iones de hidrógeno durante la generación del ATP son capturados por el grupo nitro (Amit 2013). Esta interrupción de la producción de ATP promueve la formación de compuestos intermedios y radicales libres que son sumamente tóxicos para las bacterias (Brunton 2011). Las lincosamidas se unen a la subunidad 50S de los ribosomas bacterianos y consecuentemente suprimen la síntesis de proteínas bacteriana (Brunton 2011; Trevor 2012). Los macrólidos (p.ej. eritromicina) son agentes bacteriostáticos que inhiben la síntesis de proteínas mediante la unión reversible a las subunidades ribosomales 50S de los microorganismos sensibles (Brunton 2011; Trevor 2012).
La administración de cualquier intervención efectiva y segura para la pareja sexual de una mujer con VB podría ofrecer las ventajas de disminuir la recurrencia de la infección, lo cual rompería la cadena de la infección y posiblemente disminuiría la prevalencia de ITS, con la reducción de la carga asociada con la afección y un impacto positivo en la salud sexual y reproductiva de la paciente (Mehta 2013).
Por qué es importante realizar esta revisión
Esta revisión sistemática es de importancia capital debido a que algunos estudios indican que la VB presenta un comportamiento similar al de una ITS (Potter 1999). Sin embargo, todavía hay dudas con respecto a si la recurrencia de la VB en las pacientes podría deberse al fracaso en la erradicación del microorganismo causal o a una consecuencia de una nueva infección por parte de la pareja sexual (Bradshaw 2006). Actualmente, no se recomienda el tratamiento de las parejas sexuales de las pacientes con VB (Workowski 2015), aunque este hecho se basa en la evaluación crítica de los ensayos clínicos individuales (ninguno de los cuales aporta pruebas definitivas con respecto a la eficacia y la seguridad del tratamiento de la pareja sexual masculina para las pacientes con VB [Mehta 2013]) en lugar de una síntesis de las pruebas clínicas disponibles (Mehta 2012; Potter 1999). Si se encontrara que el tratamiento de las parejas sexuales reduce la tasa de la recurrencia de VB, entonces esto podría reducir los costos. Sin embargo, lo anterior debería sopesarse con el riesgo posible de resistencia a los antibióticos que podría surgir de los tratamientos adicionales múltiples que incluiría una política de este tipo. Por lo tanto, se necesitan revisiones sistemáticas de alta calidad para mejorar el tratamiento clínico de la VB (Madhivanan 2013). Esta revisión sistemática facilitará la síntesis de las pruebas actuales, y reconocerá las fortalezas y los puntos débiles, considerará la incertidumbre del conocimiento actual y permitirá evaluar la efectividad y la seguridad de esta intervención.
Objetivos
Evaluar la efectividad en pacientes mujeres y la seguridad en pacientes hombres del tratamiento concurrente con antibióticos para las parejas sexuales de las pacientes con tratamiento para la VB.
Métodos
Criterios de inclusión de estudios para esta revisión
Tipos de estudios
Ensayos clínicos controlados aleatorios, publicados y no publicados, que compararan el uso habitual de cualquier tratamiento con antibióticos (cualquier concentración, frecuencia, duración y vía) con placebo, ninguna intervención o cualquier otra intervención (cualquier concentración, frecuencia, duración y vía) en las parejas sexuales de las pacientes con tratamiento para la vaginosis bacteriana (VB). Se excluyeron los ensayos cuasialeatorios debido a que este enfoque produce cálculos del efecto que indican beneficios más extremos en comparación con los generados por los ensayos clínicos controlados aleatorios (Higgins 2011). También se excluyeron los ensayos cruzados y los ensayos con asignación al azar por grupos debido a la naturaleza de la afección (Higgins 2011).
Tipos de participantes
Parejas sexuales (hombres o mujeres) de las pacientes con tratamiento para la VB no recurrente.
Tipos de intervenciones
Cualquier tratamiento con antibióticos (en cualquier concentración, frecuencia, duración y vía) versus uno de los siguientes.
-
Placebo.
-
Ninguna intervención.
-
Cualquier otra intervención diferente al tratamiento con antibióticos (cualquier concentración, frecuencia, duración y vía).
Tipos de medida de resultado
Resultados primarios
-
Recurrencia de la VB en pacientes mujeres con tratamiento para la VB (proporción de participantes previamente saludables luego del tratamiento para la VB que desarrollaron un nuevo episodio de VB, según los criterios de Amsel u otros criterios clínicos).
-
Mejoría clínica (según los criterios de Amsel u otros criterios clínicos) en pacientes con tratamiento para la VB.
-
Mejoría sintomática definida como la desaparición o la mejoría (auto‐informada) de los síntomas en las pacientes con tratamiento para la VB.
-
Eventos adversos graves de la intervención (hipersensibilidad, colitis pseudomembranosa o síndrome de Stevens‐Johnson) en las parejas sexuales de las pacientes con tratamiento para la VB.
Resultados secundarios
-
Eventos adversos menores de la intervención durante el tratamiento (sabor metálico, náuseas, vómitos, diarrea o cefalea) en las parejas sexuales de las pacientes con tratamiento para la VB.
-
Costo‐efectividad de la intervención.
Los resultados primarios (recurrencia, mejoría clínica y sintomática) se evaluaron durante la primera semana, entre la primera y la cuarta semana y después de la cuarta semana. Se evaluaron los eventos adversos de la intervención durante el tratamiento.
Results
Description of studies
Results of the search
We searched the available literature up to 23 July 2016 and retrieved a total of 110 references, of which we screened 80 after we removed duplicates. Of these, we initially screened the full‐text articles of 20 references. Seven published trials met our inclusion criteria (Colli 1997; Heikkinen 1989; Mengel 1989; Moi 1989; Swedberg 1985; Vejtorp 1988; Vutyavanich 1993). We excluded 12 studies (see the 'Characteristics of excluded studies' table) and one trial is currently recruiting participants (see the 'Characteristics of ongoing studies' table). We have presented a PRISMA diagram in Figure 1 to illustrate the study selection process.
Included studies
The seven included trials had a total of 1026 participants and sample sizes ranged from 82 to 250 participants. These trials were from Denmark (Vejtorp 1988), Finland (Heikkinen 1989), Italy (Colli 1997), Thailand (Vutyavanich 1993), the USA (Mengel 1989; Swedberg 1985), and one trial involved the participation of institutions located in four Nordic countries namely Denmark, Finland, Norway and Sweden (Moi 1989). Three trials were multicentric (Colli 1997; Mengel 1989; Moi 1989), only one trial implemented a valid method for sample size calculation (Colli 1997), and all trials included outpatients and were published in English.
Population
The included studies recruited sexually‐active non‐pregnant women between 17 and 56 years of age, either single or married, with symptomatic BV. Four studies only included women who were involved into a monogamous heterosexual relationship (Colli 1997; Mengel 1989; Moi 1989; Vutyavanich 1993), and there was no information about this for the remaining trials (Heikkinen 1989; Swedberg 1985; Vejtorp 1988). All included trials used the Amsel's criteria to diagnose the presence of the condition and required the discovery of at least three of these four criteria, in the absence of clinical evidence of mucopurulent
cervicitis, trichomoniasis, genital herpes, papilloma virus or candidiasis. The included studies excluded participants with a recent history of systemic or topical
antibiotic treatment for other condition different to bacterial vaginosis (BV).
There were no restrictions regarding the concurrent use of contraceptive methods during the treatment period, except for Colli 1997, which excluded barrier method users. Four studies specified the contraceptive method at entry (Heikkinen 1989; Moi 1989; Vejtorp 1988; Vutyavanich 1993), and the most frequently used was the birth control pill, followed by intrauterine device, tubal resection and the condom. Two trials allowed sexual activity during the study (Moi 1989; Vutyavanich 1993), while Colli 1997 invited the participants to abstain. The remaining included trials did not mentioned whether sexual intercourse allowed or advised against. Finally, most women were treated with 5‐nitroimidazoles, namely the most commonly prescribed metronidazole (Mengel 1989; Moi 1989; Swedberg 1985; Vejtorp 1988), followed by tinidazole (Heikkinen 1989; Vutyavanich 1993). One study used clindamycin cream at bed time (Colli 1997).
Interventions
All included trials used the oral route to provide the sexual partner's treatment. The most frequently reported intervention was the use of 5‐nitroimidazoles in six studies (Heikkinen 1989; Mengel 1989; Moi 1989; Swedberg 1985; Vejtorp 1988; Vutyavanich 1993). Four of these trials used metronidazole as treatment (Mengel 1989; Moi 1989; Swedberg 1985; Vejtorp 1988), while two trials used tinidazole (Heikkinen 1989; Vutyavanich 1993). Only one study used a lincosamide for treatment (Colli 1997).
The schemes used for metronidazole included 2 g as a single dose (Mengel 1989; Swedberg 1985), 2 g on day one and day three (Moi 1989; Vejtorp 1988), and 500 mg twice daily for seven days (Swedberg 1985). The included studies that used tinidazole gave a 2 g single dose (Vutyavanich 1993), or 1 g for four days (Heikkinen 1989). One study provided clindamycin 150 mg four times daily for seven consecutive days (Colli 1997). None of the included trials assessed the effectiveness of other antibiotic treatments occasionally prescribed in clinical practice, such as aminopenicillins and macrolides.
Comparisons
Five trials used placebo (Colli 1997; Mengel 1989; Moi 1989; Vejtorp 1988; Vutyavanich 1993). Two trials compared the effectiveness of concurrent antibiotic treatment for the sexual partners with no intervention (Heikkinen 1989; Swedberg 1985).
Outcomes
None of the primary or secondary outcomes were reported by the totality of the retrieved clinical trials and there were some differences in reporting and definition of the outcomes between trials. Four included studies reported recurrence (Colli 1997; Heikkinen 1989; Moi 1989; Vejtorp 1988), and their presence was established based on the application of Amsel criteria on healthy participants following treatment for BV, with the exception of Moi 1989, which also required the reappearance of symptoms. Only one study assessed this outcome between the first and fourth week (Moi 1989), and the other three studies assessed for this outcome posterior to the fourth week.
Seven studies reported clinical improvement after treatment (Colli 1997; Heikkinen 1989; Mengel 1989; Moi 1989; Swedberg 1985; Vejtorp 1988; Vutyavanich 1993), and used the definition of the absence of Amsel's criteria through physical exam plus wet mount. Four trials assessed clinical improvement at the first week (Colli 1997; Moi 1989; Vejtorp 1988; Vutyavanich 1993), five trials assessed this outcome between the first and fourth week (Colli 1997; Heikkinen 1989; Moi 1989; Swedberg 1985; Vutyavanich 1993), and four trials assessed it after the fourth week (Colli 1997; Mengel 1989; Moi 1989; Vejtorp 1988). On the other hand, four studies monitored symptomatic improvement (Heikkinen 1989; Moi 1989; Vejtorp 1988; Vutyavanich 1993). Three trials evaluated symptomatic improvement at the first week (Moi 1989; Vejtorp 1988; Vutyavanich 1993), two trials assessed it between the first and fourth week (Moi 1989; Vutyavanich 1993), and three trials reported it after the fourth week (Heikkinen 1989; Moi 1989; Vejtorp 1988).
Finally, three trials reported the frequency of minor adverse events during treatment. Two of them captured the information through symptoms reported by participants (Colli 1997; Vutyavanich 1993), and the other trial used a questionnaire (Mengel 1989). The minor side effects reported in sexual partners of women treated for BV were the presence of nausea, stomachache, metallic taste and dizziness. We did not obtain any data on the secondary outcomes serious adverse events and cost‐effectiveness of the intervention.
Length of follow‐up
There were some differences in length of follow‐up between the included studies, which followed participants for either three (Swedberg 1985), four (Vutyavanich 1993), five (Vejtorp 1988), eight (Mengel 1989) or 12 weeks (Moi 1989; Colli 1997; Heikkinen 1989).
Excluded studies
We excluded 13 studies for the following reasons: 10 studies were not RCTs or did not provide a comparison group (all sexual partners were treated) and two studies did not provide a valid intervention (the sexual partners did not received antibiotic treatment or not all women were treated) (see the 'Characteristics of excluded studies' table). One trial is currently recruiting participants (see the 'Characteristics of ongoing studies' table).
Risk of bias in included studies
We have summarized the 'Risk of bias' assessment in Figure 2 and Figure 3. Also, we provided additional details of the included trials in the 'Characteristics of included studies' tables.

'Risk of bias' graph: review authors' judgements about each 'Risk of bias' item presented as percentages across all included studies.

'Risk of bias' summary: review authors' judgements about each 'Risk of bias' item for each included study.
Allocation
Random sequence generation (checking for possible selection bias)
Four trials adequately reported the random sequence generation method by using a computer‐generated randomisation list, so that selection bias at entry was low (Mengel 1989; Swedberg 1985; Vejtorp 1988; Vutyavanich 1993). The remaining included trials did not report the random sequence generation methods, and the risk of selection bias at entry was unclear (Colli 1997; Heikkinen 1989; Moi 1989).
Allocation concealment (checking for possible selection bias)
Two trials adequately implemented a valid allocation concealment method using sequentially numbered drugs containers (Mengel 1989), or by pharmacy‐controlled allocation (Swedberg 1985); thus the risk of selection bias at entry in these trials was low. The five remaining included trials did not report the method used to conceal allocation to interventions prior to assignment, and the risk of selection bias at entry was unclear (Colli 1997; Heikkinen 1989; Moi 1989; Vejtorp 1988; Vutyavanich 1993).
Blinding
Five trials used placebo for the control group to blind trial participants and personnel, and we judged the risk of performance bias as low (Colli 1997; Mengel 1989; Moi 1989; Vejtorp 1988; Vutyavanich 1993). The trial authors assessed two outcomes, recurrence and clinical improvement objectively, in contrast with other outcomes, such as symptomatic improvement and side effects pain, which were subjectively evaluated. However, we judged that the blinding of the outcome assessors from knowledge of which intervention each participant received prevented the risk of detection bias.
The remaining two trials compared the concurrent use of antibiotic treatment with no intervention (Heikkinen 1989; Swedberg 1985). Swedberg 1985 was unblinded to personnel and trial participants and was at high risk of performance bias. However, we appraised the outcome clinical improvement as at low risk of detection bias. This is because it was objectively assessed with Amsel's criteria, and lack of blinding of the outcome assessor was unlikely to affect the results. We considered Heikkinen 1989 as at high risk of performance and detection bias because was unblinded to personnel and trial participants. Also, the outcomes recurrence and symptomatic improvement were subjectively assessed and lack of blinding of the outcome assessor was likely to affect the results. The trial authors objectively assessed the outcome of clinical cure through Amsel's criteria, which made detection bias unlikely for this outcome.
Incomplete outcome data
Three trials appropriately stated the attrition and exclusions at each stage and the reasons were balanced across groups (Mengel 1989; Vejtorp 1988; Vutyavanich 1993). In addition, the level of missing data was not over 20% and the attrition or exclusion probably was unrelated to the outcomes, which made attrition bias unlikely.
We assessed two trials as at unclear risk of bias (Colli 1997; Moi 1989). In Colli 1997, we judged the outcomes of clinical cure at 1, 4 and 12 weeks and gastrointestinal symptoms as at low risk of bias (e.g. no missing outcome data; missing outcome data balanced across groups). However, we assessed the outcome of recurrence as at high risk of bias because the level of missing data was over 20%. Something similar occurred with Moi 1989, where we judged the outcomes of symptomatic improvement and clinical cure at the first and fourth week as at low risk of bias (e.g. no missing outcome data; missing outcome data balanced across groups). However, for the same outcomes at 12 weeks, the risk of bias was high according to the level of missing data (greater than 20%).
Two trials had missing data greater that 20% and did not state the reasons why (Heikkinen 1989; Swedberg 1985); the trial authors conducted the analyses only for those participants who were completely treated (per protocol analysis). We assessed these trials as at high risk of bias.
Selective reporting
The trial protocol was unavailable for each of the included trials (Colli 1997; Heikkinen 1989; Mengel 1989; Moi 1989; Swedberg 1985; Vejtorp 1988; Vutyavanich 1993). It is unclear whether or not the published reports included all the expected outcomes, including those that were prespecified. The report had insufficient information to permit judgment of “yes” or “no”, and we rated this factor as at unclear risk of bias in each of the included trials.
Other potential sources of bias
Pharmaceutical companies funded four trials (Heikkinen 1989; Moi 1989; Swedberg 1985; Vejtorp 1988), and academic institutions sponsored two trials (Mengel 1989; Vutyavanich 1993). One trial did not mention the funding sources (Colli 1997). We judged one trial, Mengel 1989, as at high risk of bias because of the nature and direction of their results. The remaining studies appeared to be free from other sources of bias.
Effects of interventions
See: Summary of findings for the main comparison Any antibiotic treatment versus placebo; Summary of findings 2 Any antibiotic treatment versus no intervention; Summary of findings 3 Any antibiotic treatment versus placebo
1. Any antibiotic treatment versus placebo
Five trials ( Colli 1997; Mengel 1989; Moi 1989; Vejtorp 1988; Vutyavanich 1993) including 854 participants compared any antibiotic treatment versus placebo. They did not all contribute data to each outcome.
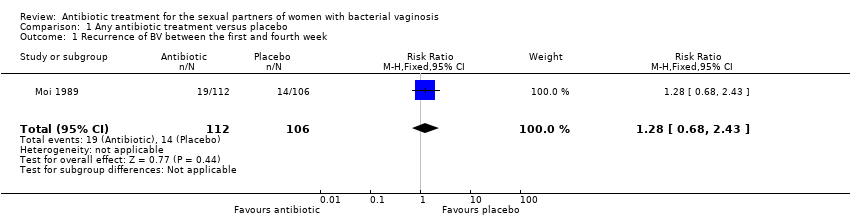
1.1.Recurrence of BV between the first and fourth week
Only one trial reported on this outcome (Moi 1989). There was no evidence of significant difference between antibiotic treatment and placebo in the recurrence between first and fourth week of treatment (RR 1.28, 95% CI 0.68 to 2.43; 218 participants, one study; Analysis 1.1). The quality of evidence was low due to the limitations of imprecision.
1.2. Recurrence of BV after the fourth week
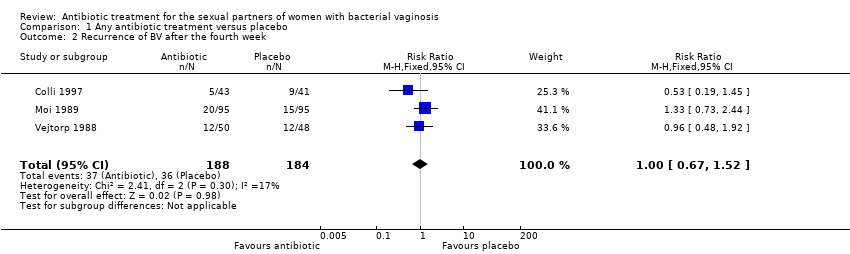
The results correspond to the meta‐analysis of three trials (Colli 1997; Moi 1989; Vejtorp 1988). There was no evidence of significant difference between antibiotic treatment and placebo in recurrence of BV after the fourth week of treatment (RR 1.00, 95% CI 0.67 to 1.52; 372 participants, three studies; I² statistic = 17%; Analysis 1.2; Figure 4). The quality of the evidence was very low due to the limitations of imprecision.

Forest plot of comparison: 1 Any antibiotic treatment versus placebo, outcome: 1.2 Recurrence of BV after the fourth week.
1.3. Clinical improvement during the first week
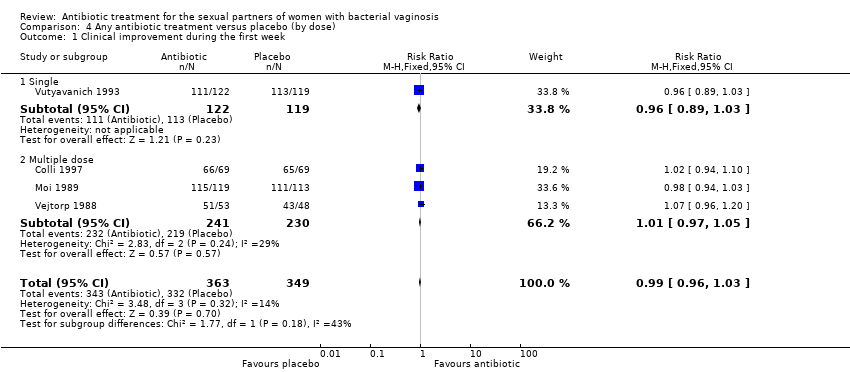
The results correspond to the meta‐analysis of four trials (Colli 1997; Moi 1989; Vejtorp 1988; Vutyavanich 1993). There was no evidence of significant difference in clinical improvement during the first week (RR 0.99, 95% CI 0.96 to 1.03; 712 participants, four studies; I² statistic = 14%; Analysis 1.3; Figure 5). The quality of the evidence was high.

Forest plot of comparison: 1 Any antibiotic treatment versus placebo, outcome: 1.3 Clinical improvement during the first week.
1.4. Clinical improvement between the first and fourth week
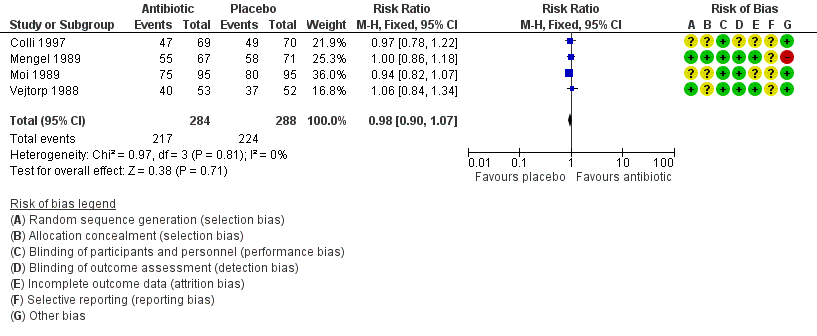
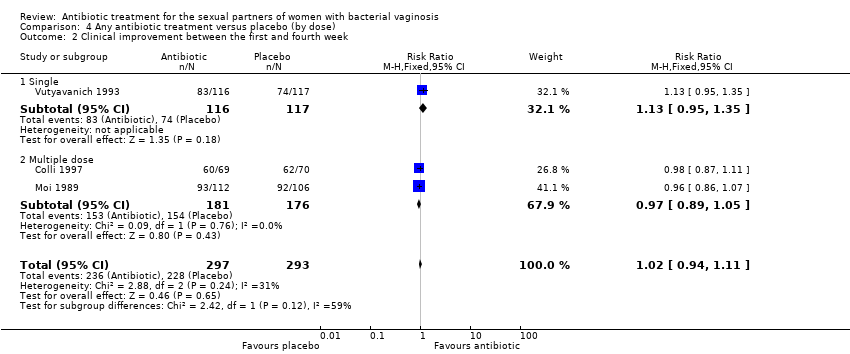
The results correspond to the meta‐analysis of three trials (Colli 1997; Moi 1989; Vutyavanich 1993). There was no evidence of significant difference in clinical improvement between the first and fourth week (RR 1.02, 95% CI 0.94 to 1.11; 590 participants, three studies; I² statistic = 31%; Analysis 1.4; Figure 6). The quality of the evidence was high.
Forest plot of comparison: 1 Any antibiotic treatment versus placebo, outcome: 1.4 Clinical improvement between the first and fourth week.
1.5. Clinical improvement after the fourth week
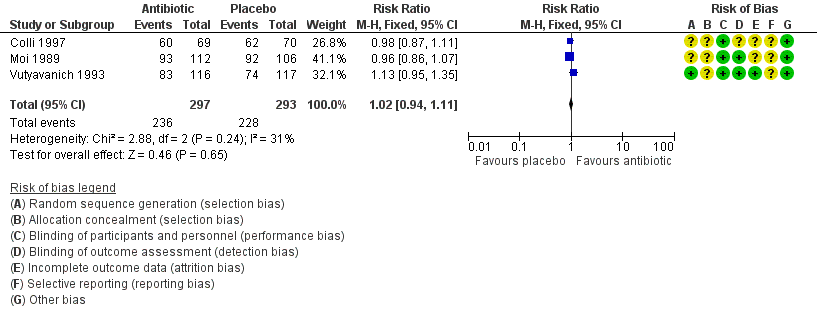
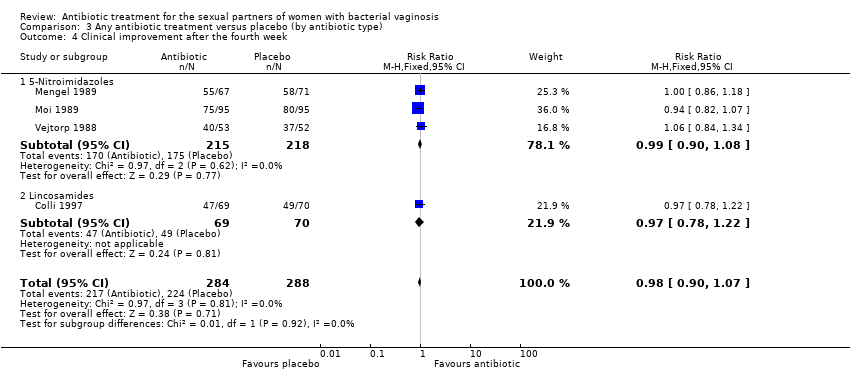
The results correspond to the meta‐analysis of four trials (Colli 1997; Moi 1989; Vejtorp 1988; Mengel 1989). There was no evidence of significant difference in clinical improvement after the fourth week (RR 0.98, 95% CI 0.90 to 1.07; 572 participants, four studies; I² statistic = 0%; Analysis 1.5; Figure 7). The quality of the evidence was high.
Forest plot of comparison: 1 Any antibiotic treatment versus placebo, outcome: 1.5 Clinical improvement after the fourth week.
1.6. Symptomatic improvement during the first week
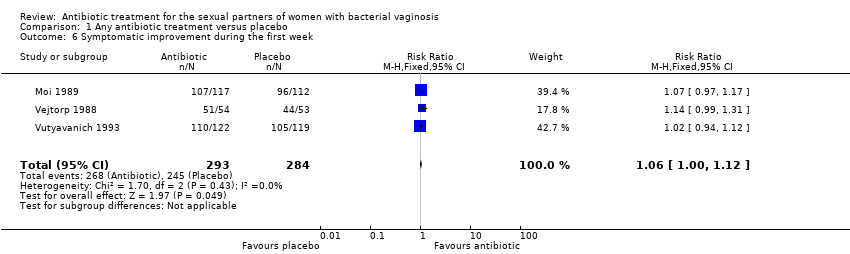
The results correspond to the meta‐analysis of three trials (Moi 1989; Vejtorp 1988; Vutyavanich 1993). Antibiotic treatment was not associated with a significant symptomatic improvement during the first week (RR 1.06, 95% CI 1.00 to 1.12; 577 participants, three studies; I² statistic = 0%; Analysis 1.6; Figure 8). The quality of the evidence was high.

Forest plot of comparison: 1 Any antibiotic treatment versus placebo, outcome: 1.6 Symptomatic improvement during the first week.
1.7. Symptomatic improvement between the first and fourth week
Two trials informed this outcome (Moi 1989; Vutyavanich 1993). There was no evidence of significant difference in this outcome (RR 0.93, 95% CI 0.84 to 1.03; 444 participants, two studies; I² statistic = 0%; Analysis 1.7). The quality of the evidence was high.
1.8. Symptomatic improvement after the fourth week
Two trials informed this outcome (Moi 1989; Vejtorp 1988). There was no evidence of significant difference in this outcome (RR 1.03, 95% CI 0.90 to 1.17; 296 participants, two studies; I² statistic = 0%; Analysis 1.8). The quality of the evidence was high.
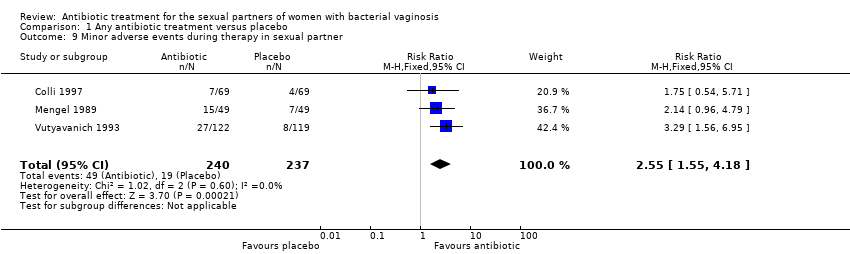
1.9. Minor adverse events during therapy in the sexual partner
The results correspond to the meta‐analysis of three trials (Colli 1997; Mengel 1989; Vutyavanich 1993). Antibiotic treatment was associated with a significant minor adverse events report during therapy in sexual partner (RR 2.55, 95% CI 1.55 to 4.18; 477 participants, three studies; I² statistic = 0%; Analysis 1.9; Figure 9). The quality of the evidence was low due to the limitations of imprecision.

Forest plot of comparison: 1 Any antibiotic treatment versus placebo, outcome: 1.9 Minor adverse events during therapy in sexual partner.
2. Any antibiotic treatment versus no intervention
Two trials including 172 participants compared the effectiveness of concurrent antibiotic treatment for the sexual partners with no intervention.
2.1. Recurrence of BV after the fourth week
One trial informed this outcome (Heikkinen 1989). There was no evidence of statistically significance difference in recurrence of BV after the fourth week (RR 1.71, 95% CI 0.65 to 4.55; 51 participants, one study; Analysis 2.1). The quality of the evidence was very low due to the limitations of imprecision, blinding and incomplete outcome data domains.
2.2. Clinical improvement between the first and fourth week
Two trials informed this outcome (Heikkinen 1989; Swedberg 1985) There was no evidence of statistically significance difference in this outcome (RR 0.93, 95% CI 0.70 to 1.25; 152 participants, two studies; I² statistic = 62%; Analysis 2.2). The quality of the evidence was very low due to the limitations of imprecision, substantial heterogeneity, blinding and incomplete outcome data domains.
2.3.Symptomatic improvement after the fourth week
One trial informed this outcome (Heikkinen 1989). There was no evidence of statistically significance difference in symptomatic improvement after the fourth week (RR 0.66, 95% CI 0.39 to 1.11; 70 participants, one study; Analysis 2.3). The quality of the evidence was very low due to the limitations of imprecision, blinding and incomplete outcome data domains.
Subgroup analysis and investigation of heterogeneity
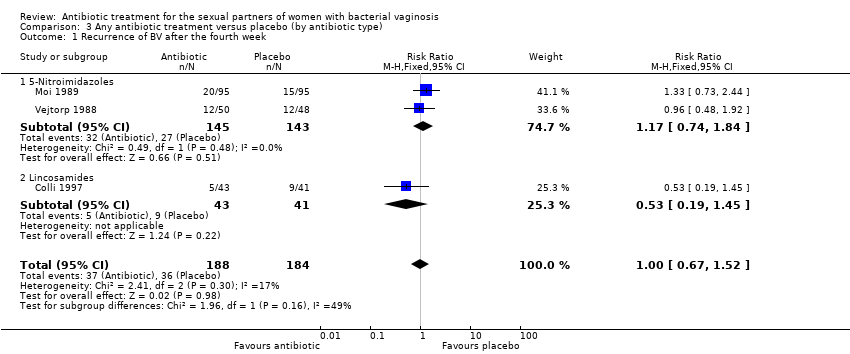
We performed subgroup analyses to explore the heterogeneity sources that we found in the analyses of "recurrence" for the comparison antibiotic versus placebo. For this analysis we explored whether differences by antibiotic type (5‐Nitroimidazoles versus Lincosamides) reduced the heterogeneity in the overall effect size. The tests for subgroup effect were not significantly different when we explored heterogeneity source by antibiotic type (assessed after the fourth week, P = 0.16, Analysis 3.1). We did not perform subgroup analysis by antibiotic doses (single versus multiple), because the included trials did not provide enough information for this outcome.
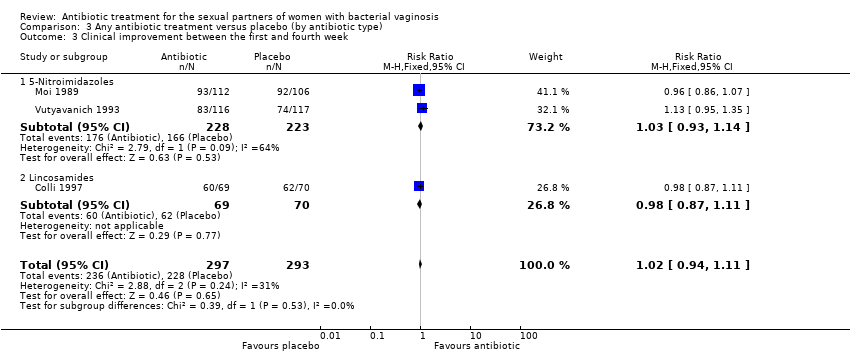
In the analyses of “clinical improvement” for the comparison antibiotic versus placebo, neither of the tests for subgroup effect showed evidence of statistically significant differences, analysing by antibiotic type (assessed during first week, P = 0.53, Analysis 3.2; between the first and fourth week, P = 0.53, Analysis 3.3; and after the fourth week, P = 0.92, Analysis 3.4) or by antibiotic doses (assessed during first week, P = 0.18, Analysis 4.1; between the first and fourth week, P = 0.12, Analysis 4.2; and after the fourth week, P = 0.76, Analysis 4.3). The effects of the intervention for these outcomes did not change according to the intervention characteristics.
In the analyses of “symptomatic improvement” for the comparison antibiotic versus placebo, neither of the tests for subgroup effect showed evidence of statistically significant differences, analysing by antibiotic doses (assessed during first week, P = 0.29, Analysis 4.4; and between the first and fourth week, P = 0.71, Analysis 4.5). We did not perform subgroup analysis by antibiotic type because the included trials did not provide the required information for these analyses. However, for the analyses "minor adverse events during therapy" for the same comparison, neither of the tests for subgroup effect showed evidence of statistically significant differences, analysing by antibiotic type (P = 0.49, Analysis 3.5) or by dose (P = 0.49, Analysis 4.6).
We did not perform the subgroup analysis according to kind of relationship, because not all of the included trials, provided enough information on these basal conditions. Finally we neither analysed by income classifications (low‐ versus high‐income) because all retrieved studies were performed in a high‐income country.
Sensitivity analysis
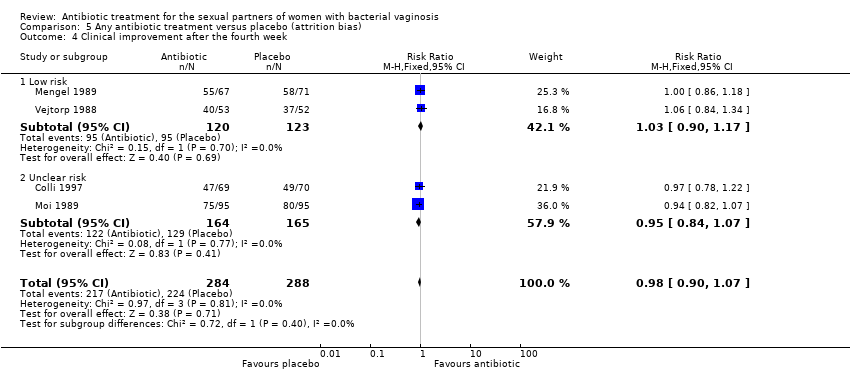
We explored the impact of including trials at high or unclear risk of bias for incomplete outcome data domain in the overall assessment of treatment effects. For the comparison antibiotic treatment versus placebo, neither of the test effects showed evidence of statistically significant differences regardless of the outcome assessed (recurrence, clinical or symptomatic improvement and minor adverse events) or the period of time during which it was measured (during the first, between the first and fourth or after the fourth week).
In this sense, we observed the following results for low risk studies.
-
Recurrence after the fourth week (RR 0.96, 95% CI 0.48 to 1.92; 98 participants, one study; Vejtorp 1988)
-
Clinical improvement during first week (RR 0.99, 95% CI 0.93 to 1.05; 242 participants, two studies; I² statistic = 66%; Vejtorp 1988; Vutyavanich 1993); between the first and fourth week (RR 1.13, 95% CI 0.95 to 1.35; 233 participants, one study; Vutyavanich 1993); and after the fourth week (RR 1.03, 95% CI 0.90 to 1.17; 243 participants, two studies; I² statistic = 0%; Mengel 1989; Vejtorp 1988)
-
Symptomatic improvement during first week (RR 1.06, 95% CI 0.98 to 1.14; 348 participants, two studies; I² statistic = 40%; Vejtorp 1988; Vutyavanich 1993); between the first and fourth week (RR 0.95, 95% CI 0.83 to 1.08; 232 participants, one study; Vutyavanich 1993); and after the fourth week (RR 1.03, 95% CI 0.83 to 1.29; 107 participants, one study; Vejtorp 1988 ).
-
Minor adverse events of the intervention during therapy (RR 2.76, 95% CI 1.60 to 4.77; 339 participants, two studies; I² statistic = 0%, Mengel 1989; Vutyavanich 1993).
We did not perform a sensitivity analysis for the comparison of antibiotic versus no intervention, because we assessed all of the included trials as at high risk of bias for incomplete outcome data domain.
Discusión
Resumen de los resultados principales
Siete ECA (1026 participantes) cumplieron con los criterios de inclusión de esta revisión, y la industria financió cuatro de estos ensayos. Cinco ensayos (854 pacientes) compararon cualquier tratamiento con antibióticos para el tratamiento de las parejas sexuales con placebo. Basado en pruebas de alta calidad, el tratamiento con antibióticos no aumenta la tasa de mejoría clínica o sintomática en las pacientes durante la primera semana (cociente de riesgos [CR] 0,99; intervalo de confianza [IC] del 95%: 0,96 a 1,03; 712 participantes, cuatro estudios; CR 1,06; IC del 95%: 1,00 a 1,12; 577 pacientes, tres estudios, respectivamente), entre la primera y la cuarta semana (CR 1,02; IC del 95%: 0,94 a 1,11; 590 participantes, tres estudios; CR 0,93; IC del 95%: 0,84 a 1,03; 444 participantes, dos estudios; respectivamente) o después de la cuarta semana (CR 0,98; IC del 95%: 0,90 a 1,07; 572 participantes, cuatro estudios; CR 1,03; IC del 95%: 0,90 a 1,17; 296 participantes, dos estudios; respectivamente). El tratamiento con antibióticos no da lugar a una tasa de recurrencia inferior durante la primera y la cuarta semana (CR 1,28; IC del 95%: 0,68 a 2,43; 218 participantes, un estudio; pruebas de baja calidad) o después de la cuarta semana de tratamiento (CR 1,00; IC del 95%: 0,67 a 1,52; 372 participantes, tres estudios; pruebas de baja calidad) en las pacientes, aunque aumenta la frecuencia de los eventos adversos (más frecuentemente los síntomas gastrointestinales) informados por las parejas sexuales (CR 2,55; IC del 95%: 1,55 a 4,18; 477 participantes, tres estudios; pruebas poco confiables) ver las tablas de "Resumen de hallazgos"; Resumen de los hallazgos para la comparación principal; Resumen de los hallazgos 2; Resumen de los hallazgos 3.
Dos ensayos (172 participantes) compararon cualquier tratamiento con antibióticos para las parejas sexuales con ninguna intervención. Cuando se lo comparó con ninguna intervención, los efectos del tratamiento con antibióticos en la tasa de recurrencia después de la cuarta semana (CR 1,71; IC del 95%: 0,65 a 4,55; 51 participantes, un estudio), la mejoría clínica entre la primera y la cuarta semana (CR 0,93; IC del 95%: 0,70 a 1,25; 152 participantes, dos estudios) y la mejoría sintomática después de la cuarta semana (CR 0,66; IC del 95%: 0,39 a 1,11; 70 participantes, un estudio) fueron imprecisos y no hubo diferencias entre los grupos. Se disminuyó la calificación de la calidad de las pruebas a baja o muy baja.
Compleción y aplicabilidad general de las pruebas
Se realizó una búsqueda exhaustiva para recuperar todos los ECA publicados y no publicados. Fue posible evaluar todos los resultados primarios excepto por los eventos adversos graves y el resultado secundario del costo‐eficacia de la intervención que no se informaron en ningún ensayo. La aplicabilidad de las pruebas a la población estudiada (las parejas sexuales de las pacientes con tratamiento para la vaginosis bacteriana [VB] no recurrente) es amplia debido a que los ensayos recuperados se realizaron en diferentes contextos clínicos. En este sentido, el resultado de esta revisión sistemática puede aplicarse a la práctica clínica de forma independiente del estado civil, la forma de relación (monógama o no), el uso concurrente de métodos anticonceptivos o la frecuencia del coito durante el tratamiento. Por otro lado, las intervenciones analizadas en la revisión abarcan escenarios clínicos múltiples que son frecuentes en la práctica actual: diversos regímenes de antibióticos que incluyen 5‐nitroimidazoles y lincosamidas con diferentes esquemas de dosis única, y tratamientos de dos a siete días.
Finalmente, debido a que los estudios incluidos sólo evaluaron la seguridad y la efectividad de la intervención para las relaciones heterosexuales, los resultados no deben extrapolarse a una población diferente.
Calidad de la evidencia
Se consideró que cinco de los siete ensayos incluidos presentaban un bajo riesgo de sesgo. Estos estudios correspondieron a la comparación de cualquier tratamiento con antibióticos versus placebo, y en consecuencia existe una confianza alta en el cálculo del efecto para la mayoría de los resultados. Sin embargo, para la comparación de cualquier tratamiento con antibióticos versus ninguna intervención, la confianza en el cálculo del efecto fue muy baja debido a las limitaciones de los ensayos (falta de cegamiento y datos de resultado incompletos), inconsistencia (variabilidad no explicada en algunos resultados) y algunos resultados imprecisos (pocos participantes y eventos de resultado con IC amplios). No fue posible evaluar el sesgo de publicación, debido a que hubo muy pocos ensayos incluidos en cada comparación (ver tablas 'Resumen de los hallazgos': Resumen de los hallazgos para la comparación principal; Resumen de los hallazgos 2; Resumen de los hallazgos 3).
Sesgos potenciales en el proceso de revisión
Esta revisión sistemática tiene muchas fortalezas con respecto al proceso de revisión: se respetaron los objetivos y los criterios de elegibilidad de estudios predefinidos; la búsqueda bibliográfica incluyó un rango apropiado de bases de datos y fuentes, incluidos los métodos relevantes adicionales para identificar informes relevantes y recuperar la mayor cantidad posible de estudios aptos; y todos los estudios se evaluaron de forma adecuada para el riesgo de sesgo. Dos autores de la revisión realizaron la extracción de datos de forma independiente. Sin embargo, se tiene cierta preocupación por el sesgo de publicación. El sesgo de publicación es una posibilidad debido a que los ensayos incluidos fueron financiados principalmente por la industria y debido al número limitado de ensayos para cada comparación.
Acuerdos y desacuerdos con otros estudios o revisiones
Se publicaron dos revisiones sistemáticas anteriores sobre este tema (Mehta 2012; Potter 1999). Esta revisión incluye un estudio que las dos revisiones anteriores no incluían (Heikkinen 1989). Los autores de dichas revisiones consideraron que no era posible realizar un metanálisis debido al riesgo significativo de sesgo en los estudios recuperados y debido a algunas limitaciones acerca de la heterogeneidad; sin embargo, dichas cuestiones no fueron un tema que limitara el metanálisis. Además, según se ha manifestado, los estudios incluidos (en particular para la comparación del tratamiento con antibióticos versus placebo) son de alta calidad, no hay ninguna heterogeneidad significativa y se han presentado los metanálisis.
Las conclusiones acerca de la falta de beneficio después del tratamiento de la pareja sexual están de acuerdo con la recomendación de algunas guías importantes en que el mismo no se recomienda (Workowski 2015; van Schalkwyk 2015). Sin embargo, estas recomendaciones no se basaron en un enfoque sistemático y explícito.

'Risk of bias' graph: review authors' judgements about each 'Risk of bias' item presented as percentages across all included studies.
'Risk of bias' summary: review authors' judgements about each 'Risk of bias' item for each included study.
Forest plot of comparison: 1 Any antibiotic treatment versus placebo, outcome: 1.2 Recurrence of BV after the fourth week.
Forest plot of comparison: 1 Any antibiotic treatment versus placebo, outcome: 1.3 Clinical improvement during the first week.
Forest plot of comparison: 1 Any antibiotic treatment versus placebo, outcome: 1.4 Clinical improvement between the first and fourth week.
Forest plot of comparison: 1 Any antibiotic treatment versus placebo, outcome: 1.5 Clinical improvement after the fourth week.
Forest plot of comparison: 1 Any antibiotic treatment versus placebo, outcome: 1.6 Symptomatic improvement during the first week.
Forest plot of comparison: 1 Any antibiotic treatment versus placebo, outcome: 1.9 Minor adverse events during therapy in sexual partner.
Comparison 1 Any antibiotic treatment versus placebo, Outcome 1 Recurrence of BV between the first and fourth week.
Comparison 1 Any antibiotic treatment versus placebo, Outcome 2 Recurrence of BV after the fourth week.

Comparison 1 Any antibiotic treatment versus placebo, Outcome 3 Clinical improvement during the first week.

Comparison 1 Any antibiotic treatment versus placebo, Outcome 4 Clinical improvement between the first and fourth week.

Comparison 1 Any antibiotic treatment versus placebo, Outcome 5 Clinical improvement after the fourth week.
Comparison 1 Any antibiotic treatment versus placebo, Outcome 6 Symptomatic improvement during the first week.

Comparison 1 Any antibiotic treatment versus placebo, Outcome 7 Symptomatic improvement between the first and fourth week.

Comparison 1 Any antibiotic treatment versus placebo, Outcome 8 Symptomatic improvement after the fourth week.
Comparison 1 Any antibiotic treatment versus placebo, Outcome 9 Minor adverse events during therapy in sexual partner.

Comparison 2 Any antibiotic treatment versus no intervention, Outcome 1 Recurrence of BV after the fourth week.

Comparison 2 Any antibiotic treatment versus no intervention, Outcome 2 Clinical improvement between the first and fourth week.

Comparison 2 Any antibiotic treatment versus no intervention, Outcome 3 Symptomatic improvement after the fourth week.
Comparison 3 Any antibiotic treatment versus placebo (by antibiotic type), Outcome 1 Recurrence of BV after the fourth week.

Comparison 3 Any antibiotic treatment versus placebo (by antibiotic type), Outcome 2 Clinical improvement during the first week.
Comparison 3 Any antibiotic treatment versus placebo (by antibiotic type), Outcome 3 Clinical improvement between the first and fourth week.
Comparison 3 Any antibiotic treatment versus placebo (by antibiotic type), Outcome 4 Clinical improvement after the fourth week.

Comparison 3 Any antibiotic treatment versus placebo (by antibiotic type), Outcome 5 Minor adverse events during therapy in sexual partner.
Comparison 4 Any antibiotic treatment versus placebo (by dose), Outcome 1 Clinical improvement during the first week.
Comparison 4 Any antibiotic treatment versus placebo (by dose), Outcome 2 Clinical improvement between the first and fourth week.

Comparison 4 Any antibiotic treatment versus placebo (by dose), Outcome 3 Clinical improvement after the fourth week.

Comparison 4 Any antibiotic treatment versus placebo (by dose), Outcome 4 Symptomatic improvement during the first week.

Comparison 4 Any antibiotic treatment versus placebo (by dose), Outcome 5 Symptomatic improvement between the first and fourth week.

Comparison 4 Any antibiotic treatment versus placebo (by dose), Outcome 6 Minor adverse events during therapy in sexual partner.

Comparison 5 Any antibiotic treatment versus placebo (attrition bias), Outcome 1 Recurrence of BV after the fourth week.

Comparison 5 Any antibiotic treatment versus placebo (attrition bias), Outcome 2 Clinical improvement during the first week.

Comparison 5 Any antibiotic treatment versus placebo (attrition bias), Outcome 3 Clinical improvement between the first and fourth week.
Comparison 5 Any antibiotic treatment versus placebo (attrition bias), Outcome 4 Clinical improvement after the fourth week.

Comparison 5 Any antibiotic treatment versus placebo (attrition bias), Outcome 5 Symptomatic improvement during the first week.

Comparison 5 Any antibiotic treatment versus placebo (attrition bias), Outcome 6 Symptomatic improvement between the first and fourth week.

Comparison 5 Any antibiotic treatment versus placebo (attrition bias), Outcome 7 Symptomatic improvement after the fourth week.

Comparison 5 Any antibiotic treatment versus placebo (attrition bias), Outcome 8 Minor adverse events during therapy in sexual partner.
| Any antibiotic treatment versus placebo for the sexual partners of woman with bacterial vaginosis | |||||
| Patient or population: sexual partners of women with bacterial vaginosis | |||||
| Outcomes | Anticipated absolute effects* (95% CI) | Relative effect | Number of participants | Quality of the evidence | |
| Risk with placebo | Risk with any antibiotic treatment | ||||
| Recurrence follow‐up 4 to 12 weeks | Study population | RR 1.00 | 372 | ⊕⊝⊝⊝ | |
| 196 per 1000 | 196 per 1000 | ||||
| Clinical improvement follow‐up 1 to 4 weeks | Study population | RR 1.02 | 590 | ⊕⊕⊕⊕ | |
| 778 per 1000 | 794 per 1000 | ||||
| Clinical improvement follow‐up 4 to 12 weeks | Study population | RR 0.98 | 572 | ⊕⊕⊕⊕ | |
| 778 per 1000 | 762 per 1000 | ||||
| Symptomatic improvement during the first week | Study population | RR 1.06 | 577 | ⊕⊕⊕⊕ | |
| 863 per 1000 | 914 per 1000 | ||||
| Symptomatic improvement follow‐up 1 to 4 weeks | Study population | RR 0.93 | 444 | ⊕⊕⊕⊕ | |
| 801 per 1000 | 745 per 1000 | ||||
| Symptomatic improvement follow‐up 4 to 12 weeks | Study population | RR 1.03 | 296 | ⊕⊕⊕⊕ | |
| 743 per 1000 | 766 per 1000 | ||||
| Minor adverse events in sexual partner | Study population | RR 2.55 | 477 | ⊕⊕⊝⊝ | |
| 80 per 1000 | 204 per 1000 | ||||
| *The risk in the intervention group (and its 95% CI) is based on the assumed risk in the comparison group and the relative effect of the intervention (and its 95% CI). | |||||
| GRADE Working Group grades of evidence | |||||
| 1Downgraded by 1 level for significant imprecision as the 95% CI was below 0.75 and over 1.25. | |||||
| Any antibiotic treatment versus no intervention | |||||
| Patient or population: sexual partners of women with bacterial vaginosis | |||||
| Outcomes | Anticipated absolute effects* (95% CI) | Relative effect | Number of participants | Quality of the evidence | |
| Risk with no intervention | Risk with any antibiotic treatment | ||||
| Recurrence follow‐up 4 to 12 weeks | Study population | RR 1.71 | 51 | ⊕⊝⊝⊝ | |
| 194 per 1000 | 333 per 1000 | ||||
| Clinical improvement follow‐up 1 to 4 weeks | Study population | RR 0.93 | 152 | ⊕⊝⊝⊝ | |
| 851 per 1000 | 792 per 1000 | ||||
| Symptomatic improvement follow‐up 4 to 12 weeks | Study population | RR 0.66 | 70 | ⊕⊝⊝⊝ | |
| 630 per 1000 | 416 per 1000 | ||||
| *The risk in the intervention group (and its 95% CI) is based on the assumed risk in the comparison group and the relative effect of the intervention (and its 95% CI). | |||||
| GRADE Working Group grades of evidence | |||||
| 1Downgraded by 2 levels due to imprecision as OIS was not achieved and the 95% CI crosses through 0.75 and 1.25. | |||||
| Any antibiotic treatment versus placebo | |||||
| Patient or population: sexual partners of women with bacterial vaginosis | |||||
| Outcomes | Anticipated absolute effects* (95% CI) | Relative effect | Number of participants | Quality of the evidence | |
| Risk with placebo | Risk with any antibiotic treatment | ||||
| Recurrence | Study population | RR 1.28 | 218 | ⊕⊕⊝⊝ | |
| 132 per 1000 | 169 per 1000 | ||||
| Clinical improvement during the first week | Study population | RR 0.99 | 712 | ⊕⊕⊕⊕ | |
| 951 per 1000 | 942 per 1000 | ||||
| *The risk in the intervention group (and its 95% CI) is based on the assumed risk in the comparison group and the relative effect of the intervention (and its 95% CI). | |||||
| GRADE Working Group grades of evidence | |||||
| 1Downgraded by 2 levels for imprecision as the 95% CI crosses through 0.75 and 1.25 and OIS is not achieved. | |||||
| Outcome or subgroup title | No. of studies | No. of participants | Statistical method | Effect size |
| 1 Recurrence of BV between the first and fourth week Show forest plot | 1 | 218 | Risk Ratio (M‐H, Fixed, 95% CI) | 1.28 [0.68, 2.43] |
| 2 Recurrence of BV after the fourth week Show forest plot | 3 | 372 | Risk Ratio (M‐H, Fixed, 95% CI) | 1.00 [0.67, 1.52] |
| 3 Clinical improvement during the first week Show forest plot | 4 | 712 | Risk Ratio (M‐H, Fixed, 95% CI) | 0.99 [0.96, 1.03] |
| 4 Clinical improvement between the first and fourth week Show forest plot | 3 | 590 | Risk Ratio (M‐H, Fixed, 95% CI) | 1.02 [0.94, 1.11] |
| 5 Clinical improvement after the fourth week Show forest plot | 4 | 572 | Risk Ratio (M‐H, Fixed, 95% CI) | 0.98 [0.90, 1.07] |
| 6 Symptomatic improvement during the first week Show forest plot | 3 | 577 | Risk Ratio (M‐H, Fixed, 95% CI) | 1.06 [1.00, 1.12] |
| 7 Symptomatic improvement between the first and fourth week Show forest plot | 2 | 444 | Risk Ratio (M‐H, Fixed, 95% CI) | 0.93 [0.84, 1.03] |
| 8 Symptomatic improvement after the fourth week Show forest plot | 2 | 296 | Risk Ratio (M‐H, Fixed, 95% CI) | 1.03 [0.90, 1.17] |
| 9 Minor adverse events during therapy in sexual partner Show forest plot | 3 | 477 | Risk Ratio (M‐H, Fixed, 95% CI) | 2.55 [1.55, 4.18] |
| Outcome or subgroup title | No. of studies | No. of participants | Statistical method | Effect size |
| 1 Recurrence of BV after the fourth week Show forest plot | 1 | 51 | Risk Ratio (M‐H, Fixed, 95% CI) | 1.71 [0.65, 4.55] |
| 2 Clinical improvement between the first and fourth week Show forest plot | 2 | 152 | Risk Ratio (M‐H, Random, 95% CI) | 0.93 [0.70, 1.25] |
| 3 Symptomatic improvement after the fourth week Show forest plot | 1 | 70 | Risk Ratio (M‐H, Fixed, 95% CI) | 0.66 [0.39, 1.11] |
| Outcome or subgroup title | No. of studies | No. of participants | Statistical method | Effect size |
| 1 Recurrence of BV after the fourth week Show forest plot | 3 | 372 | Risk Ratio (M‐H, Fixed, 95% CI) | 1.00 [0.67, 1.52] |
| 1.1 5‐Nitroimidazoles | 2 | 288 | Risk Ratio (M‐H, Fixed, 95% CI) | 1.17 [0.74, 1.84] |
| 1.2 Lincosamides | 1 | 84 | Risk Ratio (M‐H, Fixed, 95% CI) | 0.53 [0.19, 1.45] |
| 2 Clinical improvement during the first week Show forest plot | 4 | 712 | Risk Ratio (M‐H, Fixed, 95% CI) | 0.99 [0.96, 1.03] |
| 2.1 5‐Nitroimidazoles | 3 | 574 | Risk Ratio (M‐H, Fixed, 95% CI) | 0.99 [0.95, 1.03] |
| 2.2 Lincosamides | 1 | 138 | Risk Ratio (M‐H, Fixed, 95% CI) | 1.02 [0.94, 1.10] |
| 3 Clinical improvement between the first and fourth week Show forest plot | 3 | 590 | Risk Ratio (M‐H, Fixed, 95% CI) | 1.02 [0.94, 1.11] |
| 3.1 5‐Nitroimidazoles | 2 | 451 | Risk Ratio (M‐H, Fixed, 95% CI) | 1.03 [0.93, 1.14] |
| 3.2 Lincosamides | 1 | 139 | Risk Ratio (M‐H, Fixed, 95% CI) | 0.98 [0.87, 1.11] |
| 4 Clinical improvement after the fourth week Show forest plot | 4 | 572 | Risk Ratio (M‐H, Fixed, 95% CI) | 0.98 [0.90, 1.07] |
| 4.1 5‐Nitroimidazoles | 3 | 433 | Risk Ratio (M‐H, Fixed, 95% CI) | 0.99 [0.90, 1.08] |
| 4.2 Lincosamides | 1 | 139 | Risk Ratio (M‐H, Fixed, 95% CI) | 0.97 [0.78, 1.22] |
| 5 Minor adverse events during therapy in sexual partner Show forest plot | 3 | 477 | Risk Ratio (M‐H, Fixed, 95% CI) | 2.55 [1.55, 4.18] |
| 5.1 5‐Nitroimidazoles | 2 | 339 | Risk Ratio (M‐H, Fixed, 95% CI) | 2.76 [1.60, 4.77] |
| 5.2 Lincosamides | 1 | 138 | Risk Ratio (M‐H, Fixed, 95% CI) | 1.75 [0.54, 5.71] |
| Outcome or subgroup title | No. of studies | No. of participants | Statistical method | Effect size |
| 1 Clinical improvement during the first week Show forest plot | 4 | 712 | Risk Ratio (M‐H, Fixed, 95% CI) | 0.99 [0.96, 1.03] |
| 1.1 Single | 1 | 241 | Risk Ratio (M‐H, Fixed, 95% CI) | 0.96 [0.89, 1.03] |
| 1.2 Multiple dose | 3 | 471 | Risk Ratio (M‐H, Fixed, 95% CI) | 1.01 [0.97, 1.05] |
| 2 Clinical improvement between the first and fourth week Show forest plot | 3 | 590 | Risk Ratio (M‐H, Fixed, 95% CI) | 1.02 [0.94, 1.11] |
| 2.1 Single | 1 | 233 | Risk Ratio (M‐H, Fixed, 95% CI) | 1.13 [0.95, 1.35] |
| 2.2 Multiple dose | 2 | 357 | Risk Ratio (M‐H, Fixed, 95% CI) | 0.97 [0.89, 1.05] |
| 3 Clinical improvement after the fourth week Show forest plot | 4 | 572 | Risk Ratio (M‐H, Fixed, 95% CI) | 0.98 [0.90, 1.07] |
| 3.1 Single | 1 | 138 | Risk Ratio (M‐H, Fixed, 95% CI) | 1.00 [0.86, 1.18] |
| 3.2 Multiple dose | 3 | 434 | Risk Ratio (M‐H, Fixed, 95% CI) | 0.98 [0.88, 1.09] |
| 4 Symptomatic improvement during the first week Show forest plot | 3 | 577 | Risk Ratio (M‐H, Fixed, 95% CI) | 1.06 [1.00, 1.12] |
| 4.1 Single | 1 | 241 | Risk Ratio (M‐H, Fixed, 95% CI) | 1.02 [0.94, 1.12] |
| 4.2 Multiple dose | 2 | 336 | Risk Ratio (M‐H, Fixed, 95% CI) | 1.09 [1.01, 1.18] |
| 5 Symptomatic improvement between the first and fourth week Show forest plot | 2 | 444 | Risk Ratio (M‐H, Fixed, 95% CI) | 0.93 [0.84, 1.03] |
| 5.1 Single | 1 | 232 | Risk Ratio (M‐H, Fixed, 95% CI) | 0.95 [0.83, 1.08] |
| 5.2 Multiple dose | 1 | 212 | Risk Ratio (M‐H, Fixed, 95% CI) | 0.91 [0.78, 1.06] |
| 6 Minor adverse events during therapy in sexual partner Show forest plot | 3 | 477 | Risk Ratio (M‐H, Fixed, 95% CI) | 2.55 [1.55, 4.18] |
| 6.1 Single | 2 | 339 | Risk Ratio (M‐H, Fixed, 95% CI) | 2.76 [1.60, 4.77] |
| 6.2 Multiple dose | 1 | 138 | Risk Ratio (M‐H, Fixed, 95% CI) | 1.75 [0.54, 5.71] |
| Outcome or subgroup title | No. of studies | No. of participants | Statistical method | Effect size |
| 1 Recurrence of BV after the fourth week Show forest plot | 3 | 372 | Risk Ratio (M‐H, Fixed, 95% CI) | 1.00 [0.67, 1.52] |
| 1.1 Low risk | 1 | 98 | Risk Ratio (M‐H, Fixed, 95% CI) | 0.96 [0.48, 1.92] |
| 1.2 Unclear risk | 2 | 274 | Risk Ratio (M‐H, Fixed, 95% CI) | 1.03 [0.62, 1.71] |
| 2 Clinical improvement during the first week Show forest plot | 4 | 712 | Risk Ratio (M‐H, Fixed, 95% CI) | 0.99 [0.96, 1.03] |
| 2.1 Low risk | 2 | 342 | Risk Ratio (M‐H, Fixed, 95% CI) | 0.99 [0.93, 1.05] |
| 2.2 Unclear risk | 2 | 370 | Risk Ratio (M‐H, Fixed, 95% CI) | 1.00 [0.96, 1.03] |
| 3 Clinical improvement between the first and fourth week Show forest plot | 3 | 590 | Risk Ratio (M‐H, Fixed, 95% CI) | 1.02 [0.94, 1.11] |
| 3.1 Low risk | 1 | 233 | Risk Ratio (M‐H, Fixed, 95% CI) | 1.13 [0.95, 1.35] |
| 3.2 Unclear risk | 2 | 357 | Risk Ratio (M‐H, Fixed, 95% CI) | 0.97 [0.89, 1.05] |
| 4 Clinical improvement after the fourth week Show forest plot | 4 | 572 | Risk Ratio (M‐H, Fixed, 95% CI) | 0.98 [0.90, 1.07] |
| 4.1 Low risk | 2 | 243 | Risk Ratio (M‐H, Fixed, 95% CI) | 1.03 [0.90, 1.17] |
| 4.2 Unclear risk | 2 | 329 | Risk Ratio (M‐H, Fixed, 95% CI) | 0.95 [0.84, 1.07] |
| 5 Symptomatic improvement during the first week Show forest plot | 3 | 577 | Risk Ratio (M‐H, Fixed, 95% CI) | 1.06 [1.00, 1.12] |
| 5.1 Low risk | 2 | 348 | Risk Ratio (M‐H, Fixed, 95% CI) | 1.06 [0.98, 1.14] |
| 5.2 Unclear risk | 1 | 229 | Risk Ratio (M‐H, Fixed, 95% CI) | 1.07 [0.97, 1.17] |
| 6 Symptomatic improvement between the first and fourth week Show forest plot | 2 | 444 | Risk Ratio (M‐H, Fixed, 95% CI) | 0.93 [0.84, 1.03] |
| 6.1 Low risk | 1 | 232 | Risk Ratio (M‐H, Fixed, 95% CI) | 0.95 [0.83, 1.08] |
| 6.2 Unclear risk | 1 | 212 | Risk Ratio (M‐H, Fixed, 95% CI) | 0.91 [0.78, 1.06] |
| 7 Symptomatic improvement after the fourth week Show forest plot | 2 | 296 | Risk Ratio (M‐H, Fixed, 95% CI) | 1.03 [0.90, 1.17] |
| 7.1 Low risk | 1 | 107 | Risk Ratio (M‐H, Fixed, 95% CI) | 1.03 [0.83, 1.29] |
| 7.2 Unclear risk | 1 | 189 | Risk Ratio (M‐H, Fixed, 95% CI) | 1.02 [0.87, 1.20] |
| 8 Minor adverse events during therapy in sexual partner Show forest plot | 3 | 477 | Risk Ratio (M‐H, Fixed, 95% CI) | 2.55 [1.55, 4.18] |
| 8.1 Low risk | 2 | 339 | Risk Ratio (M‐H, Fixed, 95% CI) | 2.76 [1.60, 4.77] |
| 8.2 Unclear risk | 1 | 138 | Risk Ratio (M‐H, Fixed, 95% CI) | 1.75 [0.54, 5.71] |