Tratamiento con antibióticos para las parejas sexuales de las pacientes con vaginosis bacteriana
Appendices
Appendix 1. MEDLINE and CENTRAL search strategy
1 exp Vaginosis, Bacterial/
2 (vagin$ adj5 bacteri$).tw.
3 1 or 2
4 exp Bacterial Infections/
5 (bacteri$ adj5 infection$).tw.
6 4 or 5
7 exp Vaginitis/
8 vaginiti*.tw.
9 vaginosis.tw.
10 colpitis.tw.
11 kolpitis.tw.
12 or/7‐11
13 6 and 12
14 3 or 13
15 (antibacterial adj5 therapy).tw.
16 (antimicrobial adj5 treatment).tw.
17 (antimicrobial adj5 therapy).tw.
18 (antibacterial adj5 treatment).tw.
19 15 or 16 or 17 or 18
20 exp Anti‐Infective Agents/
21 (anti‐infective adj5 agent$).tw.
22 (antiinfective adj5 agent$).tw.
23 microbicide$.tw.
24 (anti‐microbial adj5 agent$).tw.
25 (antimicrobial adj5 agent$).tw.
26 exp Anti‐Bacterial Agents/
27 antibiotic$.tw.
28 (anti‐bacterial adj5 agent$).tw.
29 (antibacterial adj5 agent$).tw.
30 bacteriocid$.tw.
31 or/20‐30
32 exp Therapeutics/
33 therap$.tw.
34 treatment$.tw.
35 or/32‐34
36 31 and 35
37 19 or 36
38 exp Sexual Partners/
39 (sexual adj5 partner$).tw.
40 (multiple adj5 partners).tw.
41 38 or 39 or 40
42 randomized controlled trial.pt.
43 controlled clinical trial.pt.
44 randomized.ab.
45 placebo.ab.
46 clinical trials as topic.sh.
47 randomly.ab.
48 trial.ti.
49 OR/42‐48
50 exp animals/ not humans.sh.
51 59 not 50
52 37 and 41 and 51
Note: The CENTRAL strategy does not include items 42 to 51
Appendix 2. Embase search strategy
1 'vaginosis, bacterial'/exp
2 (vagin* NEAR/5 bacteri*):ab,ti
3 1 or 2
4 'bacterial infections'/exp
5 (bacteri* NEAR/5 infection*):ab,ti
6 4 or 5
7 'vaginitis'/exp
8 vaginiti*:ab,ti
9 vaginosis*:ab,ti
10 colpitis*:ab,ti
11 kolpitis*:ab,ti 56
12 or/7‐11
13 6 and 12
14 3 or 13
15 (antibacterial NEAR/5 therapy):ab,ti
16 (antibacterial NEAR/5 treatment):ab,ti
17 (antimicrobial NEAR/5 therapy):ab,ti
18 (antimicrobial NEAR/5 treatment):ab,ti
19 or/15‐18
20 'anti‐infective agents'/exp
21 ('anti infective' NEAR/5 agent*):ab,ti
22 (antiinfective NEAR/5 agent*):ab,ti
23 microbicide*:ab,ti
24 ('anti microbial' NEAR/5 agent*):ab,ti
25 (antimicrobial NEAR/5 agent*):ab,ti
26 'anti‐bacterial agents'/exp
27 antibiotic*:ab,ti
28 ('anti bacterial' NEAR/5 agent*):ab,ti
29 (antibacterial NEAR/5 agent*):ab,ti
30 bacteriocid*:ab,ti
31 or/20‐30
32 'therapeutics'/exp
33 therap*:ab,ti
34 treatment*:ab,ti
35 or/32‐34
36 31 and 35
37 19 OR 36
38 (sexual NEAR/5 partner*):ab,ti
39 (multiple NEAR/5 partners):ab,ti
40 38 or 39
41 'randomised controlled trial'/exp
42 'single blind procedure'/exp
43 'double blind procedure'/exp
44 'crossover procedure'/exp
45 or/41‐44
46 random*:ab,ti
47 placebo*:ab,ti
48 allocat*:ab,ti
49 crossover*:ab,ti
50 'cross over':ab,ti
51 trial:ti
52 (doubl* NEXT/1 blind*):ab,ti
53 or/46‐53
54 45 or 53
55 'animal'/de
56 'animal experiment'/de
57 'nonhuman'/de
58 or/55‐57
59 'human'/de
60 58 and 59
61 58 not 60
62 54 not 61
63 37 and 40 and 62
Appendix 3. LILACS search strategy
(mh:(vaginosis, bacterial)) OR (ti:(vaginosis)) OR (ab:(vaginosis)) AND db:("LILACS")
RCTs filter:
((PT:"ensayo clinico controlado aleatorio" OR PT:"ensayo clinico controlado" OR PT:"estudio multicéntrico" OR MH:"ensayos clinicos controlados aleatorios como asunto" OR MH:"ensayos clinicos controlados como asunto" OR MH:"estudios multicéntricos como asunto" OR MH:"distribución aleatoria" OR MH:"método doble ciego" OR MH:"metodo simple‐ciego") OR ((ensaio$ OR ensayo$ OR trial$) AND (azar OR acaso OR placebo OR control$ OR aleat$ OR random$ OR enmascarado$ OR simpleciego OR ((simple$ OR single OR duplo$ OR doble$ OR double$) AND (cego OR ciego OR blind OR mask))) AND clinic$)) AND NOT (MH:animales OR MH:conejos OR MH:ratones OR MH:ratas OR MH:primates OR MH:perros OR MH:gatos OR MH:porcinos OR PT:"in vitro")
Appendix 4. Web of Science search strategy
(TS=("vaginosis")) AND TS=(partner*) AND TI=(trial)
Appendix 5. ClinicalTrials.gov search strategy
vaginosis AND partner
Appendix 6. World Health Organization (WHO) International Clinical Trials Registry Platform (ICTRP) search strategy
vaginosis AND partner
Appendix 7. Cochrane Sexually Transmitted Infection Group's Specialized Register search strategy
1 (vaginosis:AB) AND (INREGISTER)
2 (vaginosis:TI) AND (INREGISTER)
3 (partner:AB) AND (INREGISTER)
4 (partner:TI) AND (INREGISTER)
5 (1 OR 2) AND ( 3 OR 4)


'Risk of bias' graph: review authors' judgements about each 'Risk of bias' item presented as percentages across all included studies.

'Risk of bias' summary: review authors' judgements about each 'Risk of bias' item for each included study.

Forest plot of comparison: 1 Any antibiotic treatment versus placebo, outcome: 1.2 Recurrence of BV after the fourth week.

Forest plot of comparison: 1 Any antibiotic treatment versus placebo, outcome: 1.3 Clinical improvement during the first week.
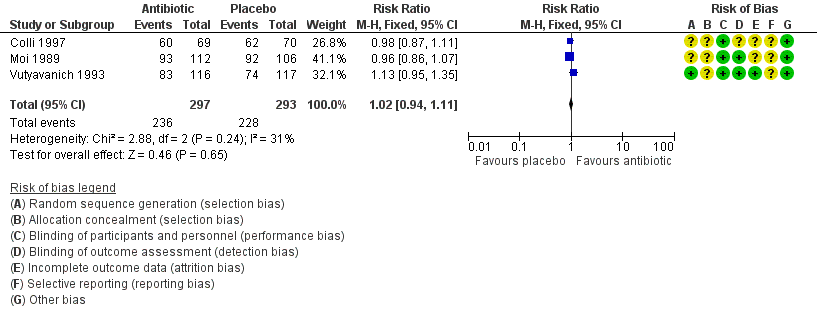
Forest plot of comparison: 1 Any antibiotic treatment versus placebo, outcome: 1.4 Clinical improvement between the first and fourth week.
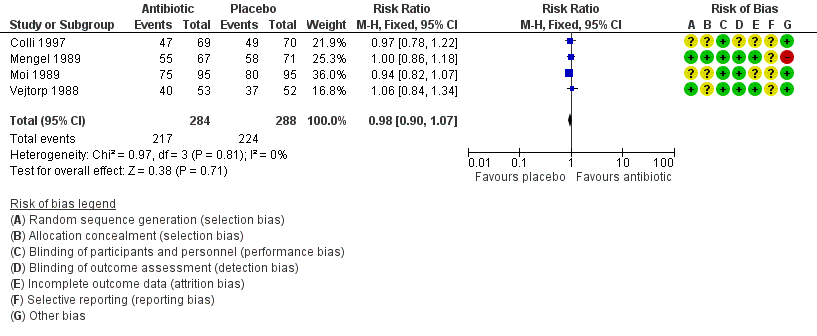
Forest plot of comparison: 1 Any antibiotic treatment versus placebo, outcome: 1.5 Clinical improvement after the fourth week.

Forest plot of comparison: 1 Any antibiotic treatment versus placebo, outcome: 1.6 Symptomatic improvement during the first week.

Forest plot of comparison: 1 Any antibiotic treatment versus placebo, outcome: 1.9 Minor adverse events during therapy in sexual partner.
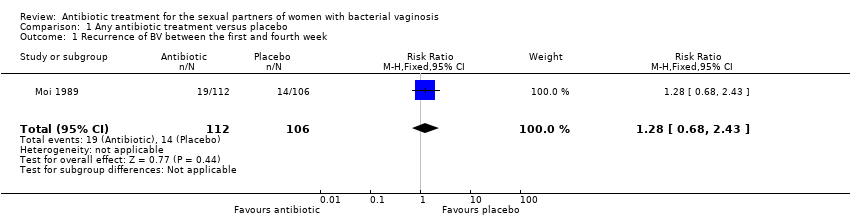
Comparison 1 Any antibiotic treatment versus placebo, Outcome 1 Recurrence of BV between the first and fourth week.
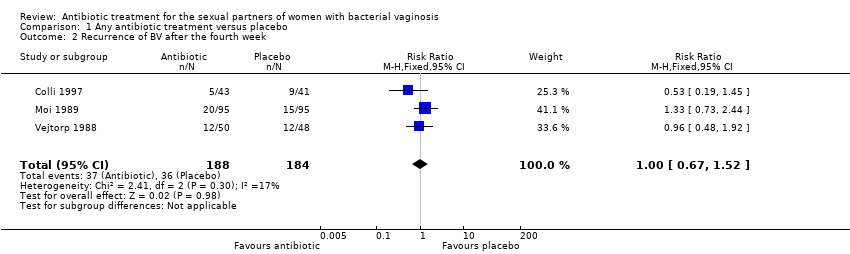
Comparison 1 Any antibiotic treatment versus placebo, Outcome 2 Recurrence of BV after the fourth week.

Comparison 1 Any antibiotic treatment versus placebo, Outcome 3 Clinical improvement during the first week.

Comparison 1 Any antibiotic treatment versus placebo, Outcome 4 Clinical improvement between the first and fourth week.

Comparison 1 Any antibiotic treatment versus placebo, Outcome 5 Clinical improvement after the fourth week.
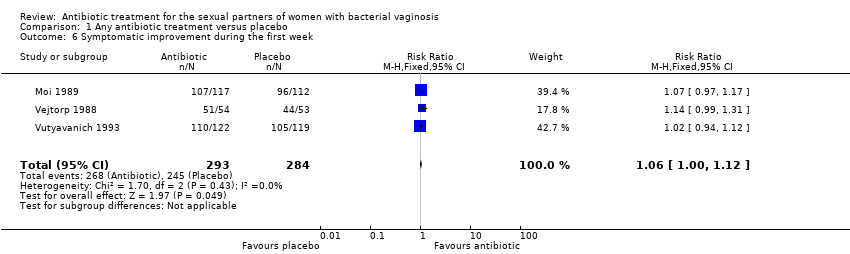
Comparison 1 Any antibiotic treatment versus placebo, Outcome 6 Symptomatic improvement during the first week.

Comparison 1 Any antibiotic treatment versus placebo, Outcome 7 Symptomatic improvement between the first and fourth week.

Comparison 1 Any antibiotic treatment versus placebo, Outcome 8 Symptomatic improvement after the fourth week.
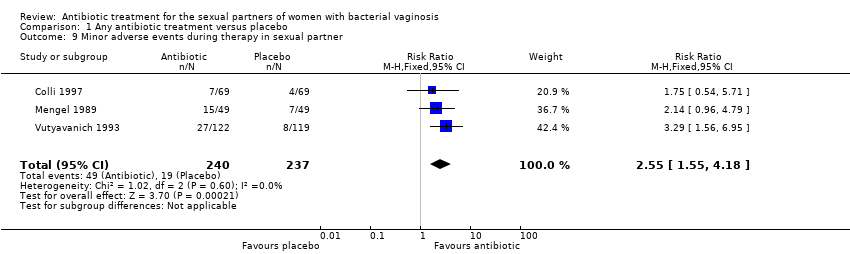
Comparison 1 Any antibiotic treatment versus placebo, Outcome 9 Minor adverse events during therapy in sexual partner.

Comparison 2 Any antibiotic treatment versus no intervention, Outcome 1 Recurrence of BV after the fourth week.

Comparison 2 Any antibiotic treatment versus no intervention, Outcome 2 Clinical improvement between the first and fourth week.

Comparison 2 Any antibiotic treatment versus no intervention, Outcome 3 Symptomatic improvement after the fourth week.
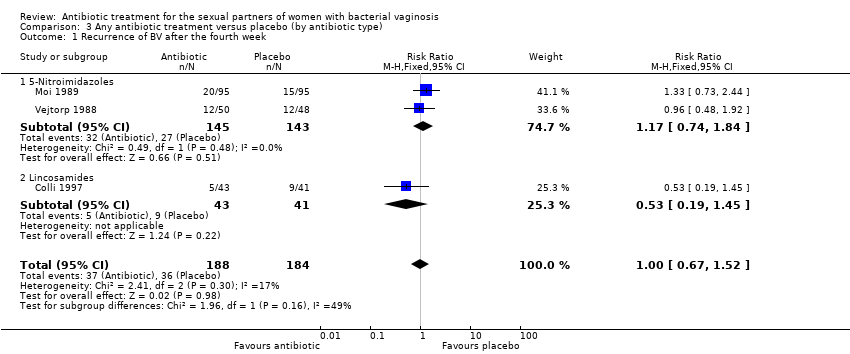
Comparison 3 Any antibiotic treatment versus placebo (by antibiotic type), Outcome 1 Recurrence of BV after the fourth week.

Comparison 3 Any antibiotic treatment versus placebo (by antibiotic type), Outcome 2 Clinical improvement during the first week.
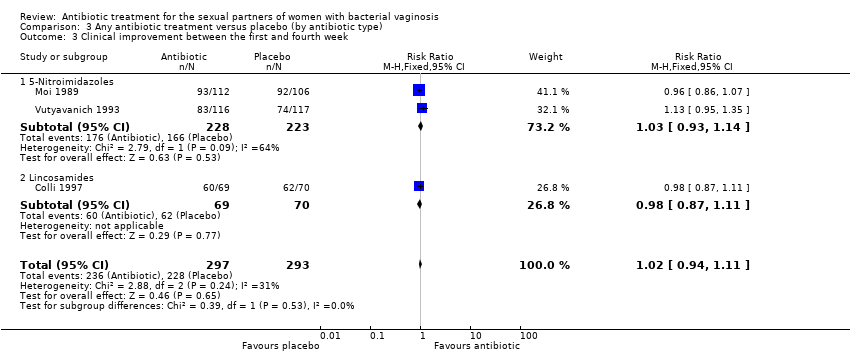
Comparison 3 Any antibiotic treatment versus placebo (by antibiotic type), Outcome 3 Clinical improvement between the first and fourth week.
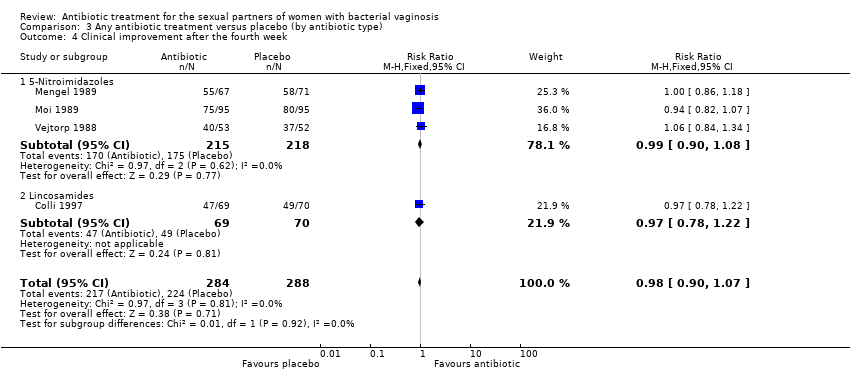
Comparison 3 Any antibiotic treatment versus placebo (by antibiotic type), Outcome 4 Clinical improvement after the fourth week.

Comparison 3 Any antibiotic treatment versus placebo (by antibiotic type), Outcome 5 Minor adverse events during therapy in sexual partner.
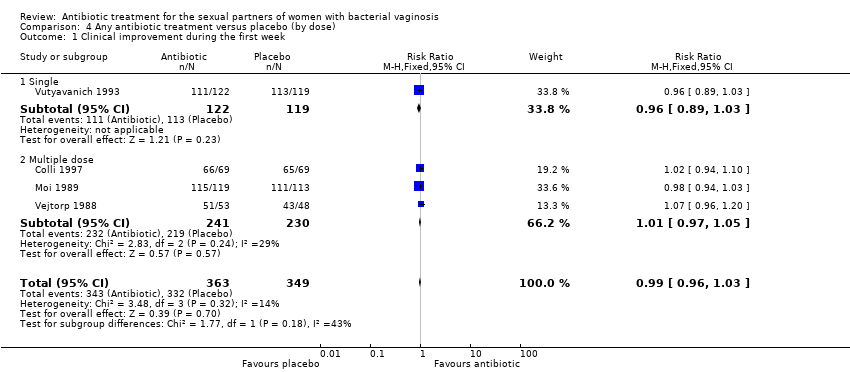
Comparison 4 Any antibiotic treatment versus placebo (by dose), Outcome 1 Clinical improvement during the first week.
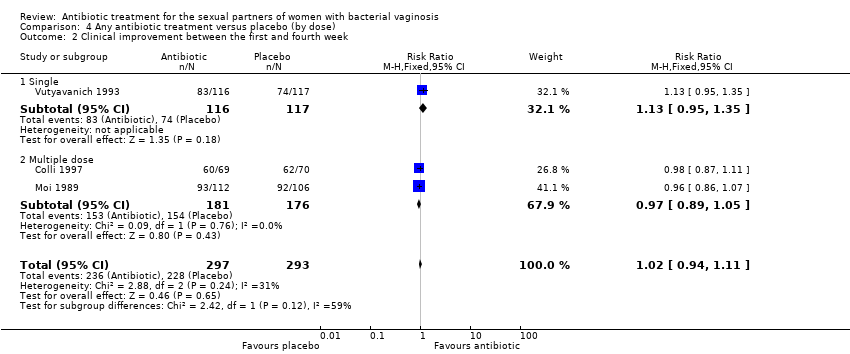
Comparison 4 Any antibiotic treatment versus placebo (by dose), Outcome 2 Clinical improvement between the first and fourth week.

Comparison 4 Any antibiotic treatment versus placebo (by dose), Outcome 3 Clinical improvement after the fourth week.

Comparison 4 Any antibiotic treatment versus placebo (by dose), Outcome 4 Symptomatic improvement during the first week.

Comparison 4 Any antibiotic treatment versus placebo (by dose), Outcome 5 Symptomatic improvement between the first and fourth week.

Comparison 4 Any antibiotic treatment versus placebo (by dose), Outcome 6 Minor adverse events during therapy in sexual partner.

Comparison 5 Any antibiotic treatment versus placebo (attrition bias), Outcome 1 Recurrence of BV after the fourth week.

Comparison 5 Any antibiotic treatment versus placebo (attrition bias), Outcome 2 Clinical improvement during the first week.

Comparison 5 Any antibiotic treatment versus placebo (attrition bias), Outcome 3 Clinical improvement between the first and fourth week.
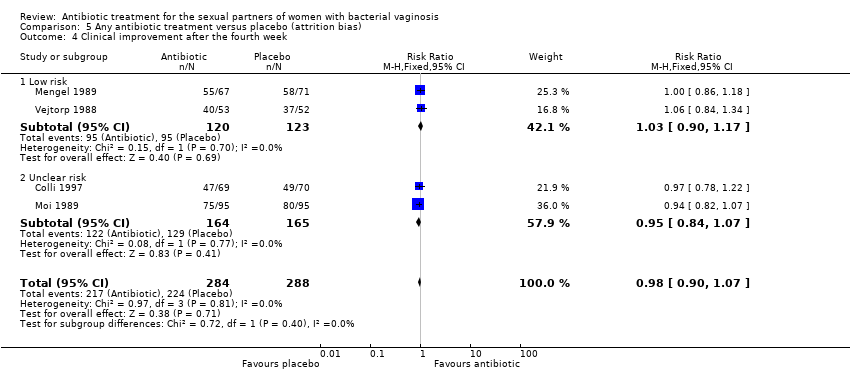
Comparison 5 Any antibiotic treatment versus placebo (attrition bias), Outcome 4 Clinical improvement after the fourth week.

Comparison 5 Any antibiotic treatment versus placebo (attrition bias), Outcome 5 Symptomatic improvement during the first week.

Comparison 5 Any antibiotic treatment versus placebo (attrition bias), Outcome 6 Symptomatic improvement between the first and fourth week.

Comparison 5 Any antibiotic treatment versus placebo (attrition bias), Outcome 7 Symptomatic improvement after the fourth week.

Comparison 5 Any antibiotic treatment versus placebo (attrition bias), Outcome 8 Minor adverse events during therapy in sexual partner.
| Any antibiotic treatment versus placebo for the sexual partners of woman with bacterial vaginosis | |||||
| Patient or population: sexual partners of women with bacterial vaginosis | |||||
| Outcomes | Anticipated absolute effects* (95% CI) | Relative effect | Number of participants | Quality of the evidence | |
| Risk with placebo | Risk with any antibiotic treatment | ||||
| Recurrence follow‐up 4 to 12 weeks | Study population | RR 1.00 | 372 | ⊕⊝⊝⊝ | |
| 196 per 1000 | 196 per 1000 | ||||
| Clinical improvement follow‐up 1 to 4 weeks | Study population | RR 1.02 | 590 | ⊕⊕⊕⊕ | |
| 778 per 1000 | 794 per 1000 | ||||
| Clinical improvement follow‐up 4 to 12 weeks | Study population | RR 0.98 | 572 | ⊕⊕⊕⊕ | |
| 778 per 1000 | 762 per 1000 | ||||
| Symptomatic improvement during the first week | Study population | RR 1.06 | 577 | ⊕⊕⊕⊕ | |
| 863 per 1000 | 914 per 1000 | ||||
| Symptomatic improvement follow‐up 1 to 4 weeks | Study population | RR 0.93 | 444 | ⊕⊕⊕⊕ | |
| 801 per 1000 | 745 per 1000 | ||||
| Symptomatic improvement follow‐up 4 to 12 weeks | Study population | RR 1.03 | 296 | ⊕⊕⊕⊕ | |
| 743 per 1000 | 766 per 1000 | ||||
| Minor adverse events in sexual partner | Study population | RR 2.55 | 477 | ⊕⊕⊝⊝ | |
| 80 per 1000 | 204 per 1000 | ||||
| *The risk in the intervention group (and its 95% CI) is based on the assumed risk in the comparison group and the relative effect of the intervention (and its 95% CI). | |||||
| GRADE Working Group grades of evidence | |||||
| 1Downgraded by 1 level for significant imprecision as the 95% CI was below 0.75 and over 1.25. | |||||
| Any antibiotic treatment versus no intervention | |||||
| Patient or population: sexual partners of women with bacterial vaginosis | |||||
| Outcomes | Anticipated absolute effects* (95% CI) | Relative effect | Number of participants | Quality of the evidence | |
| Risk with no intervention | Risk with any antibiotic treatment | ||||
| Recurrence follow‐up 4 to 12 weeks | Study population | RR 1.71 | 51 | ⊕⊝⊝⊝ | |
| 194 per 1000 | 333 per 1000 | ||||
| Clinical improvement follow‐up 1 to 4 weeks | Study population | RR 0.93 | 152 | ⊕⊝⊝⊝ | |
| 851 per 1000 | 792 per 1000 | ||||
| Symptomatic improvement follow‐up 4 to 12 weeks | Study population | RR 0.66 | 70 | ⊕⊝⊝⊝ | |
| 630 per 1000 | 416 per 1000 | ||||
| *The risk in the intervention group (and its 95% CI) is based on the assumed risk in the comparison group and the relative effect of the intervention (and its 95% CI). | |||||
| GRADE Working Group grades of evidence | |||||
| 1Downgraded by 2 levels due to imprecision as OIS was not achieved and the 95% CI crosses through 0.75 and 1.25. | |||||
| Any antibiotic treatment versus placebo | |||||
| Patient or population: sexual partners of women with bacterial vaginosis | |||||
| Outcomes | Anticipated absolute effects* (95% CI) | Relative effect | Number of participants | Quality of the evidence | |
| Risk with placebo | Risk with any antibiotic treatment | ||||
| Recurrence | Study population | RR 1.28 | 218 | ⊕⊕⊝⊝ | |
| 132 per 1000 | 169 per 1000 | ||||
| Clinical improvement during the first week | Study population | RR 0.99 | 712 | ⊕⊕⊕⊕ | |
| 951 per 1000 | 942 per 1000 | ||||
| *The risk in the intervention group (and its 95% CI) is based on the assumed risk in the comparison group and the relative effect of the intervention (and its 95% CI). | |||||
| GRADE Working Group grades of evidence | |||||
| 1Downgraded by 2 levels for imprecision as the 95% CI crosses through 0.75 and 1.25 and OIS is not achieved. | |||||
| Outcome or subgroup title | No. of studies | No. of participants | Statistical method | Effect size |
| 1 Recurrence of BV between the first and fourth week Show forest plot | 1 | 218 | Risk Ratio (M‐H, Fixed, 95% CI) | 1.28 [0.68, 2.43] |
| 2 Recurrence of BV after the fourth week Show forest plot | 3 | 372 | Risk Ratio (M‐H, Fixed, 95% CI) | 1.00 [0.67, 1.52] |
| 3 Clinical improvement during the first week Show forest plot | 4 | 712 | Risk Ratio (M‐H, Fixed, 95% CI) | 0.99 [0.96, 1.03] |
| 4 Clinical improvement between the first and fourth week Show forest plot | 3 | 590 | Risk Ratio (M‐H, Fixed, 95% CI) | 1.02 [0.94, 1.11] |
| 5 Clinical improvement after the fourth week Show forest plot | 4 | 572 | Risk Ratio (M‐H, Fixed, 95% CI) | 0.98 [0.90, 1.07] |
| 6 Symptomatic improvement during the first week Show forest plot | 3 | 577 | Risk Ratio (M‐H, Fixed, 95% CI) | 1.06 [1.00, 1.12] |
| 7 Symptomatic improvement between the first and fourth week Show forest plot | 2 | 444 | Risk Ratio (M‐H, Fixed, 95% CI) | 0.93 [0.84, 1.03] |
| 8 Symptomatic improvement after the fourth week Show forest plot | 2 | 296 | Risk Ratio (M‐H, Fixed, 95% CI) | 1.03 [0.90, 1.17] |
| 9 Minor adverse events during therapy in sexual partner Show forest plot | 3 | 477 | Risk Ratio (M‐H, Fixed, 95% CI) | 2.55 [1.55, 4.18] |
| Outcome or subgroup title | No. of studies | No. of participants | Statistical method | Effect size |
| 1 Recurrence of BV after the fourth week Show forest plot | 1 | 51 | Risk Ratio (M‐H, Fixed, 95% CI) | 1.71 [0.65, 4.55] |
| 2 Clinical improvement between the first and fourth week Show forest plot | 2 | 152 | Risk Ratio (M‐H, Random, 95% CI) | 0.93 [0.70, 1.25] |
| 3 Symptomatic improvement after the fourth week Show forest plot | 1 | 70 | Risk Ratio (M‐H, Fixed, 95% CI) | 0.66 [0.39, 1.11] |
| Outcome or subgroup title | No. of studies | No. of participants | Statistical method | Effect size |
| 1 Recurrence of BV after the fourth week Show forest plot | 3 | 372 | Risk Ratio (M‐H, Fixed, 95% CI) | 1.00 [0.67, 1.52] |
| 1.1 5‐Nitroimidazoles | 2 | 288 | Risk Ratio (M‐H, Fixed, 95% CI) | 1.17 [0.74, 1.84] |
| 1.2 Lincosamides | 1 | 84 | Risk Ratio (M‐H, Fixed, 95% CI) | 0.53 [0.19, 1.45] |
| 2 Clinical improvement during the first week Show forest plot | 4 | 712 | Risk Ratio (M‐H, Fixed, 95% CI) | 0.99 [0.96, 1.03] |
| 2.1 5‐Nitroimidazoles | 3 | 574 | Risk Ratio (M‐H, Fixed, 95% CI) | 0.99 [0.95, 1.03] |
| 2.2 Lincosamides | 1 | 138 | Risk Ratio (M‐H, Fixed, 95% CI) | 1.02 [0.94, 1.10] |
| 3 Clinical improvement between the first and fourth week Show forest plot | 3 | 590 | Risk Ratio (M‐H, Fixed, 95% CI) | 1.02 [0.94, 1.11] |
| 3.1 5‐Nitroimidazoles | 2 | 451 | Risk Ratio (M‐H, Fixed, 95% CI) | 1.03 [0.93, 1.14] |
| 3.2 Lincosamides | 1 | 139 | Risk Ratio (M‐H, Fixed, 95% CI) | 0.98 [0.87, 1.11] |
| 4 Clinical improvement after the fourth week Show forest plot | 4 | 572 | Risk Ratio (M‐H, Fixed, 95% CI) | 0.98 [0.90, 1.07] |
| 4.1 5‐Nitroimidazoles | 3 | 433 | Risk Ratio (M‐H, Fixed, 95% CI) | 0.99 [0.90, 1.08] |
| 4.2 Lincosamides | 1 | 139 | Risk Ratio (M‐H, Fixed, 95% CI) | 0.97 [0.78, 1.22] |
| 5 Minor adverse events during therapy in sexual partner Show forest plot | 3 | 477 | Risk Ratio (M‐H, Fixed, 95% CI) | 2.55 [1.55, 4.18] |
| 5.1 5‐Nitroimidazoles | 2 | 339 | Risk Ratio (M‐H, Fixed, 95% CI) | 2.76 [1.60, 4.77] |
| 5.2 Lincosamides | 1 | 138 | Risk Ratio (M‐H, Fixed, 95% CI) | 1.75 [0.54, 5.71] |
| Outcome or subgroup title | No. of studies | No. of participants | Statistical method | Effect size |
| 1 Clinical improvement during the first week Show forest plot | 4 | 712 | Risk Ratio (M‐H, Fixed, 95% CI) | 0.99 [0.96, 1.03] |
| 1.1 Single | 1 | 241 | Risk Ratio (M‐H, Fixed, 95% CI) | 0.96 [0.89, 1.03] |
| 1.2 Multiple dose | 3 | 471 | Risk Ratio (M‐H, Fixed, 95% CI) | 1.01 [0.97, 1.05] |
| 2 Clinical improvement between the first and fourth week Show forest plot | 3 | 590 | Risk Ratio (M‐H, Fixed, 95% CI) | 1.02 [0.94, 1.11] |
| 2.1 Single | 1 | 233 | Risk Ratio (M‐H, Fixed, 95% CI) | 1.13 [0.95, 1.35] |
| 2.2 Multiple dose | 2 | 357 | Risk Ratio (M‐H, Fixed, 95% CI) | 0.97 [0.89, 1.05] |
| 3 Clinical improvement after the fourth week Show forest plot | 4 | 572 | Risk Ratio (M‐H, Fixed, 95% CI) | 0.98 [0.90, 1.07] |
| 3.1 Single | 1 | 138 | Risk Ratio (M‐H, Fixed, 95% CI) | 1.00 [0.86, 1.18] |
| 3.2 Multiple dose | 3 | 434 | Risk Ratio (M‐H, Fixed, 95% CI) | 0.98 [0.88, 1.09] |
| 4 Symptomatic improvement during the first week Show forest plot | 3 | 577 | Risk Ratio (M‐H, Fixed, 95% CI) | 1.06 [1.00, 1.12] |
| 4.1 Single | 1 | 241 | Risk Ratio (M‐H, Fixed, 95% CI) | 1.02 [0.94, 1.12] |
| 4.2 Multiple dose | 2 | 336 | Risk Ratio (M‐H, Fixed, 95% CI) | 1.09 [1.01, 1.18] |
| 5 Symptomatic improvement between the first and fourth week Show forest plot | 2 | 444 | Risk Ratio (M‐H, Fixed, 95% CI) | 0.93 [0.84, 1.03] |
| 5.1 Single | 1 | 232 | Risk Ratio (M‐H, Fixed, 95% CI) | 0.95 [0.83, 1.08] |
| 5.2 Multiple dose | 1 | 212 | Risk Ratio (M‐H, Fixed, 95% CI) | 0.91 [0.78, 1.06] |
| 6 Minor adverse events during therapy in sexual partner Show forest plot | 3 | 477 | Risk Ratio (M‐H, Fixed, 95% CI) | 2.55 [1.55, 4.18] |
| 6.1 Single | 2 | 339 | Risk Ratio (M‐H, Fixed, 95% CI) | 2.76 [1.60, 4.77] |
| 6.2 Multiple dose | 1 | 138 | Risk Ratio (M‐H, Fixed, 95% CI) | 1.75 [0.54, 5.71] |
| Outcome or subgroup title | No. of studies | No. of participants | Statistical method | Effect size |
| 1 Recurrence of BV after the fourth week Show forest plot | 3 | 372 | Risk Ratio (M‐H, Fixed, 95% CI) | 1.00 [0.67, 1.52] |
| 1.1 Low risk | 1 | 98 | Risk Ratio (M‐H, Fixed, 95% CI) | 0.96 [0.48, 1.92] |
| 1.2 Unclear risk | 2 | 274 | Risk Ratio (M‐H, Fixed, 95% CI) | 1.03 [0.62, 1.71] |
| 2 Clinical improvement during the first week Show forest plot | 4 | 712 | Risk Ratio (M‐H, Fixed, 95% CI) | 0.99 [0.96, 1.03] |
| 2.1 Low risk | 2 | 342 | Risk Ratio (M‐H, Fixed, 95% CI) | 0.99 [0.93, 1.05] |
| 2.2 Unclear risk | 2 | 370 | Risk Ratio (M‐H, Fixed, 95% CI) | 1.00 [0.96, 1.03] |
| 3 Clinical improvement between the first and fourth week Show forest plot | 3 | 590 | Risk Ratio (M‐H, Fixed, 95% CI) | 1.02 [0.94, 1.11] |
| 3.1 Low risk | 1 | 233 | Risk Ratio (M‐H, Fixed, 95% CI) | 1.13 [0.95, 1.35] |
| 3.2 Unclear risk | 2 | 357 | Risk Ratio (M‐H, Fixed, 95% CI) | 0.97 [0.89, 1.05] |
| 4 Clinical improvement after the fourth week Show forest plot | 4 | 572 | Risk Ratio (M‐H, Fixed, 95% CI) | 0.98 [0.90, 1.07] |
| 4.1 Low risk | 2 | 243 | Risk Ratio (M‐H, Fixed, 95% CI) | 1.03 [0.90, 1.17] |
| 4.2 Unclear risk | 2 | 329 | Risk Ratio (M‐H, Fixed, 95% CI) | 0.95 [0.84, 1.07] |
| 5 Symptomatic improvement during the first week Show forest plot | 3 | 577 | Risk Ratio (M‐H, Fixed, 95% CI) | 1.06 [1.00, 1.12] |
| 5.1 Low risk | 2 | 348 | Risk Ratio (M‐H, Fixed, 95% CI) | 1.06 [0.98, 1.14] |
| 5.2 Unclear risk | 1 | 229 | Risk Ratio (M‐H, Fixed, 95% CI) | 1.07 [0.97, 1.17] |
| 6 Symptomatic improvement between the first and fourth week Show forest plot | 2 | 444 | Risk Ratio (M‐H, Fixed, 95% CI) | 0.93 [0.84, 1.03] |
| 6.1 Low risk | 1 | 232 | Risk Ratio (M‐H, Fixed, 95% CI) | 0.95 [0.83, 1.08] |
| 6.2 Unclear risk | 1 | 212 | Risk Ratio (M‐H, Fixed, 95% CI) | 0.91 [0.78, 1.06] |
| 7 Symptomatic improvement after the fourth week Show forest plot | 2 | 296 | Risk Ratio (M‐H, Fixed, 95% CI) | 1.03 [0.90, 1.17] |
| 7.1 Low risk | 1 | 107 | Risk Ratio (M‐H, Fixed, 95% CI) | 1.03 [0.83, 1.29] |
| 7.2 Unclear risk | 1 | 189 | Risk Ratio (M‐H, Fixed, 95% CI) | 1.02 [0.87, 1.20] |
| 8 Minor adverse events during therapy in sexual partner Show forest plot | 3 | 477 | Risk Ratio (M‐H, Fixed, 95% CI) | 2.55 [1.55, 4.18] |
| 8.1 Low risk | 2 | 339 | Risk Ratio (M‐H, Fixed, 95% CI) | 2.76 [1.60, 4.77] |
| 8.2 Unclear risk | 1 | 138 | Risk Ratio (M‐H, Fixed, 95% CI) | 1.75 [0.54, 5.71] |