Scolaris Content Display Scolaris Content Display

Flow diagram.
Figuras y tablas -
Figure 1

Flow diagram.

'Risk of bias' graph: review authors' judgements about each risk of bias item presented as percentages across all included studies.
Figuras y tablas -
Figure 2

'Risk of bias' graph: review authors' judgements about each risk of bias item presented as percentages across all included studies.

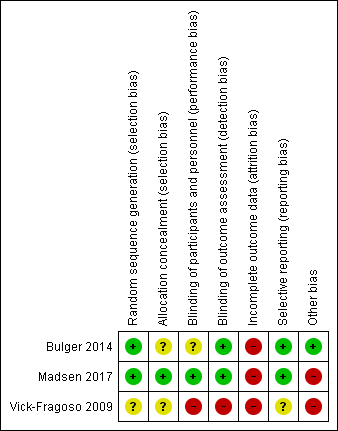
'Risk of bias' summary: review authors' judgements about each risk of bias item for each included study.
Figuras y tablas -
Figure 3

'Risk of bias' summary: review authors' judgements about each risk of bias item for each included study.

Comparison 1 Moxifloxacin versus amoxicillin‐clavulanate, Outcome 1 Mortality within 30 days.
Figuras y tablas -
Analysis 1.1

Comparison 1 Moxifloxacin versus amoxicillin‐clavulanate, Outcome 1 Mortality within 30 days.

Comparison 1 Moxifloxacin versus amoxicillin‐clavulanate, Outcome 2 Proportion of patients who experienced serious adverse events.
Figuras y tablas -
Analysis 1.2

Comparison 1 Moxifloxacin versus amoxicillin‐clavulanate, Outcome 2 Proportion of patients who experienced serious adverse events.

Comparison 2 AB 103 versus placebo, Outcome 1 Mortality within 30 days.
Figuras y tablas -
Analysis 2.1

Comparison 2 AB 103 versus placebo, Outcome 1 Mortality within 30 days.

Comparison 2 AB 103 versus placebo, Outcome 2 Proportion of patients who experienced serious adverse events.
Figuras y tablas -
Analysis 2.2

Comparison 2 AB 103 versus placebo, Outcome 2 Proportion of patients who experienced serious adverse events.

Comparison 3 IGIV versus placebo, Outcome 1 Mortality within 30 days.
Figuras y tablas -
Analysis 3.1

Comparison 3 IGIV versus placebo, Outcome 1 Mortality within 30 days.

Comparison 3 IGIV versus placebo, Outcome 2 Proportion of patients who experienced serious adverse events.
Figuras y tablas -
Analysis 3.2

Comparison 3 IGIV versus placebo, Outcome 2 Proportion of patients who experienced serious adverse events.

Summary of findings for the main comparison. Moxifloxacin compared to amoxicillin‐clavulanate for NSTI

Moxifloxacin compared to amoxicillin‐clavulanate for NSTI

Patient or population: NSTI
Setting: hospital
Intervention: moxifloxacin
Comparison: amoxicillin‐clavulanate

Outcomes

Anticipated absolute effects* (95% CI)

Relative effect
(95% CI)

№ of participants
(studies)

Quality/certainty of the evidence
(GRADE)

Comments

Risk with Amoxicillin‐clavulanate

Risk with Moxifloxacin

Mortality
follow‐up: 30 days

Study population

RR 3.00
(0.39 to 23.07)

54
(1 RCT)

⊕⊝⊝⊝
Very lowa

Data from a larger trial including several types of soft tissue infections; total number of included patients N = 804

6 per 100

17 per 100
(2 to 100)

Serious adverse events (SAE)
follow‐up: 28 days

Study population

RR 0.63
(0.30 to 1.31)

54
(1 RCT)

⊕⊝⊝⊝
Very lowa

Description of nature of serious adverse events was not available

44 per 100

28 per 100
(13 to 58)

Survival time

54
(1 RCT)

⊕⊝⊝⊝
Very lowa

The median time of death after start of antibiotic treatment was shorter in the moxifloxacin group than in the amoxicillin‐clavulanate group (10.5 days versus 42 days) (not possible to calculate hazard ratio with the data provided)

Assessment of long‐term morbidity

Not reported

*The risk in the intervention group (and its 95% confidence interval) is based on the assumed risk in the comparison group and the relative effect of the intervention (and its 95% CI). Assumed risk for mortality was based on data of the literature (Audureau 2017; May 2009). For serious adverse effects it was based on the results of the trial.

CI: Confidence interval; RR: Risk ratio

GRADE Working Group grades of evidence
High quality/certainty: We are very confident that the true effect lies close to that of the estimate of the effect
Moderate quality/certainty: We are moderately confident in the effect estimate: The true effect is likely to be close to the estimate of the effect, but there is a possibility that it is substantially different
Low quality/certainty: Our confidence in the effect estimate is limited: The true effect may be substantially different from the estimate of the effect
Very low quality/certainty: We have very little confidence in the effect estimate: The true effect is likely to be substantially different from the estimate of effect

aDowngraded by five levels to very low certainty of evidence. We downgraded two levels because of high risk of bias regarding blinding (open label trial) and high risk for attrition bias because of a high rate of withdrawal (20%). We downgraded one level for serious imprecision because of small sample size (and CI of RR included 1, where reported). We downgraded a further two levels because no clear criteria for clinical diagnosis of necrotizing fasciitis were provided and because antibiotic used as comparator is not relevant (indirectness)

Figuras y tablas -
Summary of findings for the main comparison. Moxifloxacin compared to amoxicillin‐clavulanate for NSTI
Summary of findings 2. AB103 compared to placebo for NSTI

AB103 compared to Placebo for NSTI

Patient or population: NSTI
Setting: hospital
Intervention: AB103
Comparison: placebo

Outcomes

Anticipated absolute effects* (95% CI)

Relative effect
(95% CI)

№ of participants
(studies)

Quality/certainty of the evidence
(GRADE)

Comments

Risk with Placebo

Risk with AB103

Mortality
follow‐up: 30 days

Study population

RR 0.34
(0.05 to 2.16)

43
(1 RCT)

⊕⊝⊝⊝
Very lowa

23 per 100*

6 per 100
(1 to 39)

Serious adverse events (SAE)
follow‐up: 28 days

Study population

RR 1.49
(0.52 to 4.27)

43
(1 RCT)

⊕⊝⊝⊝
Very lowa

There were no data about the nature of serious adverse events reported

27 per 100

41 per 100
(14 to 100)

Survival time

Not reported

Assessment of long‐term morbidity

Not reported

*The risk in the intervention group (and its 95% confidence interval) is based on the assumed risk in the comparison group and the relative effect of the intervention (and its 95% CI). Assumed risk for mortality was based on data of the literature (Audureau 2017; May 2009). For serious adverse effects it was based on the results of the trial.

CI: Confidence interval; RR: Risk ratio

GRADE Working Group grades of evidence
High quality/certainty: We are very confident that the true effect lies close to that of the estimate of the effect
Moderate quality/certainty: We are moderately confident in the effect estimate: The true effect is likely to be close to the estimate of the effect, but there is a possibility that it is substantially different
Low quality/certainty: Our confidence in the effect estimate is limited: The true effect may be substantially different from the estimate of the effect
Very low quality/certainty: We have very little confidence in the effect estimate: The true effect is likely to be substantially different from the estimate of effect

aDowngraded by three levels: one level for high risk of attrition bias, one level for no clear clinical definition of criteria for necrotizing fasciitis diagnosis at inclusion (indirectness), and one level for serious imprecision because of small sample size and CI included no difference

Figuras y tablas -
Summary of findings 2. AB103 compared to placebo for NSTI
Summary of findings 3. Intravenous immunoglobulin compared to placebo for NSTI

Intravenous immunoglobulin compared to placebo for NSTI

Patient or population: NSTI
Setting: intensive care unit
Intervention: intravenous immunoglobulin
Comparison: placebo

Outcomes

Anticipated absolute effects* (95% CI)

Relative effect
(95% CI)

№ of participants
(studies)

Quality/Certainty of the evidence
(GRADE)

Comments

Risk with placebo

Risk with Intravenous immunoglobulin

Mortality
follow‐up: 30 days

Study population

RR 1.17
(0.42 to 3.23)

100
(1 RCT)

⊕⊕⊝⊝
Lowa

0 per 100

0 per 100
(0 to 0)

Moderate

23 per* 100

21 per 100
(8 to 58)

Serious adverse events (SAE)
follow‐up: unclear

Study population

RR 0.73
(0.32 to 1.65)

100
(1 RCT)

⊕⊕⊝⊝
Lowa

Serious adverse reactions included acute kidney injury, allergic reactions, aseptic meningitis syndrome, haemolytic anaemia, thrombi, and transmissible agents

22 per 100

16 per 100
(7 to 36)

Survival time

100
(1 RCT)

⊕⊕⊝⊝
Lowa

The median time of death was shorter in the IVIG group than in the placebo group (25 days versus 49 days) (not possible to calculate hazard ratio with the data provided)

Assessment of long‐term morbidity

Not reported

*The risk in the intervention group (and its 95% confidence interval) is based on the assumed risk in the comparison group and the relative effect of the intervention (and its 95% CI). Assumed risk for mortality was based on data of the literature (Audureau 2017; May 2009). For serious adverse effects it was based on the results of the trial.
CI: Confidence interval; RR: Risk ratio

GRADE Working Group grades of evidence
High quality/certainty: We are very confident that the true effect lies close to that of the estimate of the effect
Moderate quality/certainty: We are moderately confident in the effect estimate: The true effect is likely to be close to the estimate of the effect, but there is a possibility that it is substantially different
Low quality/certainty: Our confidence in the effect estimate is limited: The true effect may be substantially different from the estimate of the effect
Very low quality/certainty: We have very little confidence in the effect estimate: The true effect is likely to be substantially different from the estimate of effect

aDowngraded by two levels: one level for high risk of attrition bias (38% lost of follow‐up); other bias: imbalance at baseline for one dose 25 IVIG received before randomisation (40% in placebo group vs 16% IVIG group). One level for indirectness as a minority of patients have an infection linked to bacteria producing toxins

Figuras y tablas -
Summary of findings 3. Intravenous immunoglobulin compared to placebo for NSTI
Table 1. Glossary of terms used

Term used

Explanation

Adjuvant treatment

Treatment that is given in addition to the primary or initial therapy to improve its effectiveness

Empiric antimicrobial therapy

Antimicrobial therapy given before the specific bacteria causing an infection is known

Aseptic meningitis

Serious inflammation of the linings of the brain not caused by pyogenic bacteria

Empiric antibiotic therapy

Antibiotics that acts against a wide range of bacteria

Bullae

Blisters on the skin usually more than 5 mm in diameters

Cirrhosis

Advanced liver disease

Crepitus

Clinical signs characterised by a peculiar sound under the skin

Debridement

Surgery excision of necrotic tissues (medical removal of dead, damaged, or infected tissue)

Endotoxin

A toxin contained in bacteria that is released only when the bacteria are broken down

Exotoxin

A toxin that is secreted by bacteria into the surrounding medium

Fascia

A fibrous connective tissue that surrounds muscle and other soft tissue. Fasciae are classified according to their distinct layers and their anatomical location: superficial fascia and deep (muscle) fascia

Fulminant inflammatory response

Systemic inflammatory response

Gram‐negative bacteria

Class of bacteria gram‐negative staining

Haemolytic anaemia

Decrease in the total amount of red blood cells due to the abnormal breakdown of red blood cells

Hyperbaric oxygen therapy

Medical use of oxygen at a level higher than atmospheric pressure. This helps fight bacteria and infection

Hypoxia

Insufficient levels of oxygen in blood or tissue

Intravenous immunoglobulin (IVIG)

Administration of antibodies through the veins

Motricity

Strength in upper and lower extremities after disease

Morbidity

Disability or degree that the health condition affects the patient

Mortality

Death rate

MRSA

Methicillin‐resistant Staphylococcus aureus

Myonecrosis

The destruction or death of muscle tissue

Necrosis

Death of body tissue

Obliterating endarteritis

Severe proliferating endarteritis (inflammation of the inner lining of an artery) that results in an occlusion of the lumen (the space inside a tubular structure) of the smaller vessels

Person‐years

Unit of measurement used to estimate rate of a disease during a defined period of observation

Polymicrobial

Polymicrobial infection is caused by several species of micro‐organisms

Subcutaneous tissue

Layer of tissue below the epidermis and the dermis of the skin. It is also called the hypodermis

Synergistic combination

Additive effects of bacterial agents

Synergistic gangrenes

Necrotizing soft tissue infection caused by a mix of bacteria (usually a mix of anaerobic and aerobic micro‐organisms)

Systemic

Affecting the entire body

Third‐generation quinolones

The quinolones are a family of synthetic broad‐spectrum antibiotic drugs

Thrombi

A blood clot inside a blood vessel

Transmissible agents

Infectious pathogens that can be transmitted

Vasopressors

Any medication that induces vasoconstriction of blood vessels to raise reduced blood pressure

Vimentin

A protein, the expression of which is increased after skeletal muscle injury

Figuras y tablas -
Table 1. Glossary of terms used
Table 2. Incidence of necrotizing fasciitis

Incidence of necrotizing fasciitis

Authors

Period of study

Country

Pathology

Incidence

Kaul R et al (Kaul 1997)

1991

Canada

GAS NF

0.085 per 100,000 p‐y

1995

0.4 per 100,000 p‐y

Ellis Simonsen et al (Ellis Simonsen 2006)

January 1997 to December 2002

United States

NF

0.04 per 1000 p‐y

O'Grady et al (O'Grady 2007)

March 2002 to August 2004

Australia

IGAS

2.7 per 100,000 p‐y (10.9% of NF)

Lamagni et al (Lamagni 2008)

January 2003 to December 2004

Europe

IGAS

2.37 per 100,000 p‐y (8% of NF)

Lepoutre et al (Lepoutre 2011)

November 2006 to November 2007

France

IGAS

3.1 per 100,000 p‐y (18% of NF)

GAS NF:group A streptococcal necrotizing fasciitis; IGAS: invasive group A streptococcal disease; NF: necrotizing fasciitis; p‐y: person‐years

Figuras y tablas -
Table 2. Incidence of necrotizing fasciitis
Table 3. Details of contacting authors

Study

Contact

Requested information

Contacted

Reply (last check 23 April 2017)

Darenberg 2003 (awaiting classification study)

Dr Norrby‐Teglund

Outcomes in the specific subgroup of patients with NSTI:

‐Mortality at day 30,

‐Proportion of patients with serious adverse events

‐Survival time

‐Patients with alteration of 25% of Functional Impairment Scale (%)

July 28, 2015

September 07, 2015

No response

Tally 1986 (awaiting classification study)

Dr Kellum

Outcomes in the specific subgroup of patients with NSTI:

‐Mortality at day 30,

‐Proportion of patients with serious adverse events

‐Survival time

‐Patients with alteration of 25% of Functional Impairment Scale (%)

July 24, 2015

September 07, 2015

No response

Vick‐Fragoso 2009 (included study)

Dr Bogner, Dr Petri

Outcomes in the specific subgroup of patients with NSTI:

‐Mortality at day 30,

‐Proportion of patients with serious adverse events

‐Survival time

‐Patients with alteration of 25% of Functional Impairment Scale (%)

September 07, 2015

Additional data to the publication provided for mortality, proportion of patients with serious adverse events and survival time.

Outcome data for assessment of long term morbidity not provide

Bulger 2014 (included study)

Dr Bulger

Outcomes:

‐Survival time

‐Patients with alteration of 25% of Functional Impairment Scale (%)

September 07, 2015

September 09, 2015

Outcome data not provided

Figuras y tablas -
Table 3. Details of contacting authors
Comparison 1. Moxifloxacin versus amoxicillin‐clavulanate

Outcome or subgroup title

No. of studies

No. of participants

Statistical method

Effect size

1 Mortality within 30 days Show forest plot

1

54

Risk Ratio (M‐H, Random, 95% CI)

3.0 [0.39, 23.07]

2 Proportion of patients who experienced serious adverse events Show forest plot

1

54

Risk Ratio (M‐H, Random, 95% CI)

0.63 [0.30, 1.31]

Figuras y tablas -
Comparison 1. Moxifloxacin versus amoxicillin‐clavulanate
Comparison 2. AB 103 versus placebo

Outcome or subgroup title

No. of studies

No. of participants

Statistical method

Effect size

1 Mortality within 30 days Show forest plot

1

43

Risk Ratio (M‐H, Random, 95% CI)

0.34 [0.05, 2.16]

2 Proportion of patients who experienced serious adverse events Show forest plot

1

43

Risk Ratio (M‐H, Random, 95% CI)

1.49 [0.52, 4.27]

Figuras y tablas -
Comparison 2. AB 103 versus placebo
Comparison 3. IGIV versus placebo

Outcome or subgroup title

No. of studies

No. of participants

Statistical method

Effect size

1 Mortality within 30 days Show forest plot

1

100

Risk Ratio (M‐H, Random, 95% CI)

1.17 [0.42, 3.23]

2 Proportion of patients who experienced serious adverse events Show forest plot

1

100

Risk Ratio (M‐H, Random, 95% CI)

0.73 [0.32, 1.65]

Figuras y tablas -
Comparison 3. IGIV versus placebo