نقش اترولیزوماب (etrolizumab) برای القای بهبودی در کولیت اولسراتیو
چکیده
پیشینه
اترولیزوماب (rhuMAb beta7) یک آنتیاینتگرین است که به طور انتخابی زیر‐واحد β7 را از اینتگرینهای α4β7 و αEβ7 که در پاتوژنژ کولیت اولسراتیو (ulcerative colitis) نقش دارند، هدف میگیرد.
اهداف
اهداف این مرور، سنجش اثربخشی و بیخطری (safety) اترولیزوماب برای القای بهبود در کولیت اولسراتیو است.
روشهای جستوجو
ما PubMed؛ MEDLINE؛ EMBASE و کتابخانه کاکرین (CENTRAL) را از آغاز تا 12 مارچ 2015 جستوجو کردیم. منابع و چکیده مقالات کنفرانسها نیز برای شناسایی مطالعات بیشتر جستوجو شدند.
معیارهای انتخاب
کارآزماییهای تصادفیسازی و کنترل شده (randomised controlled trials; RCTs) که در آنها اترولیزوماب با دارونما (placebo) یا هر مقایسه کننده فعال دیگر در بیماران مبتلا به کولیت اولسراتیو مقایسه شده بود، در این مرور گنجانده شدند.
گردآوری و تجزیهوتحلیل دادهها
دو نویسنده بهطور مستقل از هم مطالعات را برای گنجانده شدن در مرور غربالگری کردند و کیفیت روششناسی را ارزیابی و دادهها را استخراج کردند. کیفیت روششناسی را با استفاده از ابزار خطر سوگیری (bias) کاکرین ارزیابی کردیم. پیامد اولیه، شکست در القای بهبودی بالینی بود (آن گونه که در مطالعات اولیه تعریف شده). پیامد ثانویه عبارت بودند از ناتوانی در القای بهبود بالینی (آن گونه که توسط مطالعات اولیه تعریف شده)، ناتوانی در القای بهبودی آندوسکوپیک (آن گونه که توسط مطالعات اولیه تعریف شده)، عوارض جانبی، عوارض جانبی جدی، انصراف از حضور در مطالعه به علت عوارض جانبی و کیفیت زندگی مرتبط با سلامت (آن گونه که توسط مطالعات اولیه تعریف شده). کیفیت کلی شواهد را با استفاده از معیارهای درجهبندی توصیه، ارزیابی، توسعه و ارزشیابی (GRADE) ارزیابی کردیم. خطر نسبی (RR) و 95% فاصله اطمینان (CI) متناظر را برای هر پیامد دو‐حالتی محاسبه کردیم.
نتایج اصلی
دو RCT با 172 شرکتکننده مبتلا به کولیت اولسراتیو متوسط تا شدید که به درمانهای معمول پاسخ نداده بودند، معیارهای گنجانده شدن در این مرور را داشتند. هر دو مطالعه در معرض خطر پائین سوگیری ارزیابی شدند. دادههای مربوط به اثربخشی حاصل از دو مطالعه وارد شده را به دلیل تفاوت در دوز و شیوه تجویز، تجمیع نکردیم. فاز I مطالعه کوچک، تفاوتهایی با اهمیت آماری بین اترولیزوماب و دارونما (placebo) در نسبت بیمارانی که وارد دوره بهبودی میشدند (RR: 1.04؛ 95% CI؛ 1.04 تا 1.69؛ 23 شرکتکننده) یا در هفته 10 به درمان پاسخ میدادند (RR: 1.67؛ 95% CI؛ 0.26 تا 10.82؛ 23 شرکتکننده)، نشان نداد. فاز II مطالعه، گزارشی از ناکامی در ورود به بهبودی بالینی در هفتههای 6 و 10 ارائه کرد. %91 از بیماران (71/78) گروه اترولیزوماب و 95% از بیماران گروه دارونما (39/41) نتوانستند در هفته 6 بهبودی را تجربه کنند (RR: 0.96؛ 95% CI؛ 0.87 تا 1.06). تجزیهوتحلیل زیر‐گروه، تفاوتهایی با اهمیت آماری بین دوزهای مختلف نشان نداد. در هفته 10 درمان، تفاوتی با اهمیت آماری به نفع اترولیزوماب در مقایسه با دارونما در نرخ بهبودی بالینی دیده شد. میان افرادی که اترولیزوماب دریافت کرده بودند، 85% (66/78) نتوانستند بهبودی را در هفته 10 تجربه کنند که در گروه دارونما این میزان 100% (41/41) بود (RR: 0.86؛ 95% CI؛ 0.77 تا 0.95). تجزیهوتحلیل زیر‐گروه در مورد دوز، تفاوتی با اهمیت آماری را به نفع تجویز 100 میلیگرم اترولیزوماب در برابر دارونما در نرخ بهبودی بالینی نشان داد (RR: 0.81؛ 95% CI؛ 0.68 تا 0.96)، اما در دوز 300 میلیگرم اترولیزوماب در برابر دارونما این اتفاق نیفتاد (RR: 0.91؛ 95% CI؛ 0.80 تا 1.03). ناهمگونی معناداری در این مقایسه دیده نشد (0.28 = P؛ I2 = 13.5%). تجزیهوتحلیل GRADE نشان داد کیفیت کلی شواهد در مورد پیامدهای بهبودی بالینی در سطح متوسط بود که ناشی از دادههای پراکنده و اندک در این زمینه بودند. هر دو مطالعه وارد شده، بیخطری (safety) دارو را گزارش داده بودند. پیامد عوارض جانبی در ابتدا تجمیع شد، اما در نهایت این تجزیهوتحلیل به دلیل ناهمگونی بالا حذف شد (I2 = 88%). فاز یک مطالعه، تفاوتهایی با اهمیت آماری بین اترولیزوماب و دارونما در نسبت بیمارانی که حداقل یک عارضه جانبی داشتند، نشان نداد. نودوپنج درصد (36/38) از بیماران دریافت کننده اترولیزوماب در مقایسه با 100% (10/10) از بیماران گروه دارونما حداقل دچار یک عارضه جانبی شده بودند (RR: 0.98؛ 95% CI؛ 0.84 تا 1.14). عوارض جانبی شایع گزارش شده در فاز یک مطالعه شامل تشدید UC، سردرد، خستگی، درد شکم، سرگیجه، نازوفارنژیت، تهوع، درد مفاصل و عفونت مجاری ادراری (UTI) بود. تفاوتی با اهمیت آماری بین نسبت بیمارانی که با مصرف اترولیزوماب و مصرف دارونما دچار حداقل یک عارضه جانبی شدند، وجود داشت. پنجاهوشش درصد (44/78) از بیماران تحت درمان با اترولیزوماب در مقایسه با 79% از بیماران دریافت کننده دارونما، حداقل یک عارضه جانبی را تجربه کردند (RR: 0.71؛ 95% CI؛ 0.55 تا 0.91). تجزیهوتحلیل GRADE نشان میدهد کیفیت کلی شواهد برای این پیامد با توجه به دادههای پراکنده، در سطح متوسط بود. عوارض جانبی شایع گزارش شده در فاز دوم مطالعه شامل بدتر شدن UC، نازوفارنژیت، اختلالات سیستم عصبی، سردرد و درد مفاصل بودند. تجزیهوتحلیل تجمعی دو مطالعه تفاوتی با اهمیت آماری را در نسبت بیمارانی که عوارض جانبی جدی داشتند، نشان نداد. دوازده درصد (14/116) از بیماران گروه اترولیزوماب در مقایسه با 12% از بیماران گروه دارونما (6/49) دچار یک عارضه جانبی جدی شدند (RR: 0.92؛ 95% CI؛ 0.36 تا 2.34). تجزیهوتحلیل GRADE کیفیت کلی شواهد را برای این پیامد با توجه به دادههای بسیار پراکنده (20 حادثه)، در سطح پائین نشان داد. عوارض جانبی جدی شایع شامل بدتر شدن UC، اختلال در بهبود زخم و پریتونیت باکتریایی بود.
نتیجهگیریهای نویسندگان
شواهد با کیفیت متوسط نشان داد که اترولیزوماب ممکن است یک درمان القایی موثر برای برخی از بیماران مبتلا به کولیت اولسراتیو متوسط تا شدید باشد که درمان متداول در آنها شکست خورده است. با توجه به تعداد کم بیماران در زیر‐گروههای دوزهای مختلف، دوز مناسب اترولیزوماب مشخص نیست. با توجه به دادههای پراکنده، در مورد خطر عوارض جانبی و عوارض جانبی جدی نامطمئن هستیم. مطالعات بیشتری برای تعیین اثربخشی و بیخطری اترولیزوماب در این گروه بیماران مورد نیاز است. فاز III پنج کارآزمایی اترولیزوماب در حال انجام و دو مطالعه برچسب‐باز (open‐label) در حال انجام وجود دارد که اطلاعات جدید و مهمی در مورد اثربخشی، بیخطری و دوز مناسب این دارو برای درمان UC فراهم میکنند.
PICO
خلاصه به زبان ساده
اترولیزوماب برای درمان کولیت اولسراتیو فعال
کولیت اولسراتیو (ulcerative colitis) چیست؟
کولیت اولسراتیو یک بیماری التهابی طولانی‐مدت (مزمن) روده است. نشانههای آن شامل درد (کرامپ شکمی)، نیاز مکرر به اجابت مزاج (فوریت دفع مدفوع) و اسهال خونی است. هنگامی که افراد مبتلا دچار نشانههای این بیماری میشوند، به آن حالت «فعال» گفته میشود و زمانی که نشانهها وجود ندارد حالت «بهبودی» نامیده میشود.
اترولیزوماب (etrolizumab) چیست؟
اترولیزوماب یک داروی بیولوژیک است. این دارو با استفاده از یک سرنگ یا به زیر پوست یا به داخل ورید تزریق میشود (داخل وریدی). داروی بیولوژیک سیستم ایمنی را سرکوب میکند و باعث کاهش التهاب همراه با کولیت اولسراتیو میشود.
پژوهشگران چه موضوعی را بررسی کردند؟
پژوهشگران به این نکته پرداختند که اترولیزوماب میتواند نشانههای کولیت اولسراتیو را در افراد مبتلا به بیماری فعال متوقف کند، و این که این دارو سبب ایجاد آسیبی (عوارض جانبی) میشود یا خیر. محققان کلیه منابع علمی پزشکی را تا 12 مارچ 2015 جستوجو کردند.
پژوهشگران به چه نتایجی دست یافتند؟
پژوهشگران دو مطالعه را شناسایی کردند که در مجموع شامل 172 شرکتکننده مبتلا به کولیت اولسراتیو متوسط تا حاد بوده و در درمان با داروهای ساپرس کننده ایمنی (به عنوان مثال استروئیدها) یا دیگر داروهای بیولوژیک شکست خورده بودند. هر دو مطالعه اترولیزوماب را با دارونما (placebo) (یک داروی ساختگی) مقایسه کرده بودند. هر دو مطالعه دارای کیفیت بالایی بودند. مطالعه کوچکتر (48 شرکتکننده) هیچ تفاوتی در نرخ بهبودی بین اترولیزوماب و دارونما در 10 هفته نشان نداد. مطالعه بزرگتر (124 شرکتکننده) هیچ تفاوتی بین اترولیزوماب و دارونما در نسبت شرکتکنندگانی که بهبودی در هفته 6 را تجربه کرده بودند، نشان نداد. با این حال تفاوتی با اهمیت آماری در نرخ بهبودی در هفته 10 در گروه اترولیزوماب نسبت به دارونما دیده شد. در مطالعه بزرگتر (124 شرکتکننده) افراد گروه دارونما نسبت به افراد گروه اترولیزوماب بیشتر احتمال داشت که حداقل یک عارضه جانبی را نشان دهند. عوارض جانبی شایع در این مطالعه شامل بدتر شدن کولیت اولسراتیو، نازوفارنژیت (سرماخوردگی)، اختلالات سیستم عصبی، سردرد و آرتالژی (درد مفاصل) بود. در مطالعه دیگر (48 شرکتکننده) تفاوتی در نرخ عوارض جانبی بین گروههای دارونما و اترولیزوماب وجود نداشت. عوارض جانبی شایع در این مطالعه شامل بدتر شدن کولیت اولسراتیو، سردرد، خستگی (احساس خستگی)، درد شکم، سرگیجه، نازوفارنژیت (سرماخوردگی)، تهوع، آرتالژی (درد مفاصل) و عفونت مجاری ادراری (UTI) بود. هیچ تفاوت معنیداری در نسبت بیمارانی که دچار عوارض جانبی جدی شده بودند، در گروههای اترولیزوماب و دارونما وجود نداشت. عوارض جانبی جدی شامل بدتر شدن کولیت اولسراتیو و عفونت بود.
ممکن است اترولیزوماب برای القای بهبودی در افراد مبتلا به فرم متوسط تا شدید کولیت اولسراتیو که در درمانهای دیگر شکست خوردهاند، بهتر از دارونما باشد. دوزهای مختلف اترولیزوماب بررسی شد اما مشخص نشد که چه دوزی موثرترین است. مطالعات بیشتر برای تعیین اثربخشی و بیخطری اترولیزوماب در بیماران مبتلا به فرم متوسط تا شدید کولیت اولسراتیو مورد نیاز است. در حال حاضر هفت مطالعه در حال انجام در مورد تاثیر اترولیزوماب در درمان کولیت اولسراتیو وجود دارد. این مطالعات اطلاعات جدید و مهمی در مورد اثربخشی، بیخطری و دوز ایدهآل اترولیزوماب برای درمان افراد مبتلا به فرم متوسط تا شدید کولیت اولسراتیو را فراهم میکند.
Authors' conclusions
Summary of findings
| Etrolizumab versus placebo for induction of remission in ulcerative colitis | ||||||
| Patient or population: patients with induction of remission in ulcerative colitis | ||||||
| Outcomes | Illustrative comparative risks* (95% CI) | Relative effect | No of Participants | Quality of the evidence | Comments | |
| Assumed risk | Corresponding risk | |||||
| Control | Etrolizumab versus placebo | |||||
| Failure to enter clinical remission at week 10 | 1000 per 10001 | 860 per 1000 | RR 0.86 | 119 | ⊕⊕⊕⊝ | |
| Failure to enter clinical remission at week 10 ‐ 100 mg | 1000 per 10001 | 810 per 1000 | RR 0.81 | 59 | ⊕⊕⊕⊝ | |
| Failure to respond at week 10 | 707 per 10001 | 679 per 1000 | RR 0.96 | 119 | ⊕⊕⊕⊝ | |
| Failure to enter endoscopic remission at week 6 | 976 per 10001 | 956 per 1000 | RR 0.98 | 119 | ⊕⊕⊕⊝ | |
| Failure to enter endoscopic remission at week 10 | 1000 per 10001 | 920 per 1000 | RR 0.92 | 119 | ⊕⊕⊕⊝ | |
| Adverse events | 721 per 10001 | 541 per 1000 | RR 0.75 | 124 | ⊕⊕⊕⊝ | |
| Serious adverse events | 122 per 10001 | 113 per 1000 | RR 0.92 | 165 | ⊕⊕⊝⊝ | |
| *The basis for the assumed risk (e.g. the median control group risk across studies) is provided in footnotes. The corresponding risk (and its 95% confidence interval) is based on the assumed risk in the comparison group and the relative effect of the intervention (and its 95% CI). | ||||||
| GRADE Working Group grades of evidence | ||||||
| 1 Control group risk estimates come from control arm of meta‐analysis, based on included trials. 2 Downgraded one level due to sparse data (107 events). 3 Downgraded one level due to sparse data (51 events). 4 Downgraded one level due to sparse data (82 events). 5 Downgraded one level due to sparse data (114 events). 6 Downgraded one level due to sparse data (112 events). 7Downgraded one level due to sparse data (75 events). 8 Downgraded two levels due to very sparse data (20 events). | ||||||
Background
Description of the condition
Ulcerative colitis (UC) is a chronic inflammatory disease of unknown etiology characterized by bloody diarrhoea, abdominal pain, and fecal urgency. Worldwide incidence rates of UC range between 1.25 to 20.3 new cases per 100,000 persons per year, with approximately 10 to 12 new cases per 100,000 persons per year in North America and Europe (Danese 2011; Fedorak 2010; Molodecky 2012). In the United States it is estimated that the direct and indirect costs associated with the disease range between 8.1 billion USD and 14.9 billion USD per annum (Cohen 2010). Evidence suggests that UC is caused by an inappropriate immune response that is triggered by a combination of environmental, genetic and immunological factors (Bouma 2003).
UC is treated with broad‐spectrum anti‐inflammatory drugs including corticosteroids, 5‐aminosalicylic acid (5‐ASA) products, immunosuppressive therapies (e.g. azathioprine, 6‐mercaptopurine and methotrexate) and biologics such as tumor necrosis factor alpha (TNF‐α) antagonists (e.g. infliximab (Remicade®), adalimumab (Humira®), certolizumab pegol (Cimzia®) and golimumab (Simponi®)) and alpha4beta7 (α4β7) inhibitors (e.g. vedolizumab) (Bickston 2014; Feagan 2012a; Feagan 2012b; Ford 2011a; Ford 2011b; Kornbluth 2010; Lawson 2006; Timmer 2012). These medications are effective to varying degrees, however patients often do not respond, become corticosteroid dependent, fail therapy or experience significant drug‐related adverse events (Faubion 2001; Gisbert 2015).
Aminosalicylates are effective for mild to moderate disease (Feagan 2012a; Feagan 2012b; Ford 2011a), while corticosteroids are often required for those who fail to respond to 5‐ASAs (Ford 2011b; Turner 2007). Corticosteroids are highly effective for induction of remission, but are not useful for maintenance of remission and carry significant adverse effects, including osteoporosis, glucose intolerance, and increased risk of infection (Bjarnason 1997; Dignass 2010; Lichtenstein 2006). Immunosuppressives, including 6‐mercaptopurine and azathioprine, play a limited role in maintenance of remission in UC (Podolsky 2002; Timmer 2012). Furthermore, these drugs may increase the risk of lymphoma and non‐melanoma skin cancer in people with inflammatory bowel disease (IBD) (Ariyaratnam 2014; Smith 2010). TNF‐α antagonists are useful for both induction and maintenance of remission in UC (Reinisch 2011; Sandborn 2012; Sandborn 2014), however their use has been associated with a number of serious adverse events involving both hypersensitivity and opportunistic infection (Ford 2013). Patients who fail therapy, develop toxic megacolon or have severe attacks of ulcerative colitis require colectomy, which frequently results in post‐operative complications including infection, pouchitis, fistula formation, and bowel obstruction (Loftus 2008). New pharmaceutical agents, particularly those specific to the intestinal tract, may be more effective than conventional therapies and reduce the need for surgery.
Description of the intervention
Anti‐adhesion molecules such as natalizumab and vedolizumab represent a novel biologic option for the treatment of UC. Natalizumab was shown to be effective in patients with Crohn's disease, however its use has been associated with immunosuppression of the central nervous system and the development of progressive multifocal leukoencephalopathy (PML) (Van Assche 2005). Conversely, vedolizumab has proven to be effective for induction and maintenance of remission in UC and well‐tolerated by patients (Bickston 2014; Feagan 2013). While natalizumab regulates leukocyte trafficking by blocking both the alpha4beta1 (α4β1) and alpha4beta7 (α4β7) integrins, vedolizumab selectively targets the latter, thereby exclusively inhibiting T‐cell homing to the gut. Etrolizumab is a novel anti‐integrin that selectively targets the β7 subunits of the α4β7 and αEβ7 integrins that regulate trafficking and retention of T‐cell subset lymphocytes in the intestinal mucosa.
How the intervention might work
Etrolizumab binds with high affinity to α4β7 (Holzmann 1989; Hu 1992), and αEβ7 (Cepek 1993). By this mechanism, it blocks the homing and retention of leukocyte subpopulations in the intestinal mucosa, which occur via binding with the cell adhesion molecules (MAdCAM‐1) and E‐cadherin, respectively. Since these cell adhesion molecules are found mostly in the intestinal mucosa, etrolizumab is felt to be gut specific. In a mouse model, etrolizumab selectively blocks lymphocyte homing to the gastrointestinal tract, with no apparent effect on lymphocyte trafficking to the central nervous system or non‐mucosal tissues (Stefanich 2011).
Why it is important to do this review
There is a need for targeted UC treatment options capable of achieving and sustaining remission, decreasing steroid dependence and maintaining immunocompetence while simultaneously avoiding the risk of serious adverse events. The aim of this systematic review is to summarize the currently available evidence regarding the efficacy and safety of etrolizumab for induction of clinical remission and response in patients with moderate to severe UC.
Objectives
The primary objectives were to assess the efficacy and safety of etrolizumab for induction of remission in ulcerative colitis.
Methods
Criteria for considering studies for this review
Types of studies
Randomized controlled trials (RCTs) were considered for inclusion. There were no restrictions based on publication status or language of publication.
Types of participants
Adult patients (> 18 years of age) with active UC defined by a combination of clinical, radiological, endoscopic and histological criteria (at screening visit) were included.
Types of interventions
RCTs comparing etrolizumab to placebo or active comparator were considered for inclusion.
Types of outcome measures
Primary outcomes
The primary outcome measure was the proportion of patients achieving clinical remission as defined by the primary studies and expressed as a percentage of the number of patients randomized (intention‐to‐treat analysis).
Secondary outcomes
Secondary outcome measures included:
a) Clinical improvement (as defined by the primary studies);
b) Endoscopic remission (as defined by the primary studies);
c) Adverse events;
d) Serious adverse events;
e) Withdrawal due to adverse events; and
f) Health‐related quality of life (as defined by the primary studies).
Search methods for identification of studies
Electronic searches
We identified trials through systematic searches of the following bibliographic databases:
a) Ovid MEDLINE (1946 ‐ current date);
b) EMBASE (1974 ‐ current date);
c) Cochrane Central Register of Controlled Trials (CENTRAL) on The Cochrane Library, Wiley; and
d) The Cochrane IBD Group Specialized Register.
The search strategies for each database are reported in Appendix 1.
Searching other resources
We searched for ongoing studies using:
a) Clinicaltrials.gov http://clinicaltrials.gov; and
b) ICTRP http://www.who.int/ictrp/en/.
The first authors of included studies were contacted for missing data and unpublished or on‐going studies. The reference lists of all identified studies were scanned for additional applicable studies. We hand searched conference abstracts including Digestive Disease Week (DDW), United European Gastroenterology Week (UEGW) and the European Crohn's and Colitis Organisation (ECCO) from 1999 to 12 March, 2015 to identify studies published as abstracts.
Data collection and analysis
Selection of studies
Two authors (CEP and JKM) independently screened titles and abstracts to identify potentially eligible studies based on the inclusion criteria specified above. The same two authors (CEP and JKM) independently screened studies selected for full text review. Disagreements at either stage were resolved by discussion and consensus. If consensus was not reached, a third author (GR) acted as the arbitrator. The study selection process is reported in a PRISMA flow diagram (see Figure 1) .

Study flow diagram.
Data extraction and management
A data extraction form was developed and used to extract data from the included studies. Two authors (CEP and JKM) independently extracted data. Disagreements were resolved by consensus. If consensus was not reached, a third author (GR) acted as the arbitrator.
Assessment of risk of bias in included studies
Two authors (CEP and JKM) independently assessed the methodological quality of the included studies using the Cochrane risk of bias tool (Higgins 2011a). Trials were rated as high, low or unclear risk of bias for each of the following criteria:
a) Random sequence generation;
b) Allocation concealment;
c) Blinding;
d) Incomplete outcome data;
e) Selective reporting; and
f) Other sources of bias.
We used the GRADE approach to assess the overall quality of evidence supporting the primary outcome and selected secondary outcomes (Guyatt 2008; Schünemann 2011). Outcome data were rated as high, moderate, low or very low quality evidence. Data from RCTs begin as high quality but can be downgraded based on the following criteria:
a) Risk of bias in the included trials;
b) Indirect evidence;
c) Inconsistency (i.e. unexplained heterogeneity);
d) Imprecision (i.e. sparse data or wide confidence interval or both); and
e) Publication bias.
The different quality ratings are interpreted as the likelihood that future research would affect the estimate of effect. An estimate of effect based on high quality evidence is unlikely to change with further research. If the overall evidence is of moderate quality further research may have an impact on our confidence in the estimate and may change the estimate. Low quality evidence is likely to have an impact on the effect estimate. Very low quality research indicates that the finding is very uncertain (Guyatt 2008; Schünemann 2011). The results of the GRADE analysis were reported in the summary of findings Table for the main comparison.
Measures of treatment effect
Review Manager (Revman 5.3.5) was used to analyse the data. Analyses were performed on an intention‐to‐treat (ITT) basis whereby all drop outs were assumed to be treatment failures. We calculated the risk ratio (RR) and corresponding 95% confidence interval (95% CI) for dichotomous outcomes. For continuous outcomes, we planned to calculate the mean difference (MD) and corresponding 95% CI.
Unit of analysis issues
When included studies reported multiple observations for the same outcome, the outcomes were combined for fixed intervals of follow‐up (e.g., clinical remission at eight weeks). Cross‐over trials were included if data was available from the first phase of the study (i.e. before any cross‐over). Separate analyses were planned for comparisons between etrolizumab versus placebo as well as etrolizumab versus active comparator. Where studies allocated patients to more than one etrolizumab treatment arm, these groups were pooled for the primary analysis. When possible, additional subgroup analyses were performed to compare efficacy and safety among different doses of etrolizumab. Although some studies reported more than one efficacy or safety event per patient, the primary analysis considered the proportion of patients who experienced at least one event.
Dealing with missing data
We analyzed data on an ITT basis (i.e. we attempted to include all participants randomized to each group in the analyses regardless of whether they withdrew from the trial or received the allocated intervention). If there was a discrepancy between the number randomized and the number analyzed in each treatment group, we calculated the percentage lost to follow‐up in each group and considered these participants to be treatment failures.
In the case of missing data, we directly contacted the first author of the study in an attempt to obtain missing information. If we were unable to obtain missing continuous data we planned to estimate the standard deviations using other available data (e.g. standard errors) or impute the standard deviations based on the methods suggested by Higgins 2011b. We planned to perform sensitivity analyses by calculating the effect of including and excluding imputed data to determine whether this altered the effect estimates. When it was not possible to obtain or impute missing data, we planned to record this in the data extraction form and report in the 'Risk of bias' table (see Figure 2).

Risk of bias summary: review authors' judgements about each risk of bias item for each included study.
Assessment of heterogeneity
Statistical heterogeneity was assessed using the Chi2 test and I2 statistic. Heterogeneity was considered statistically significant when P < 0.10 for Chi2. The ranges for I2 are:
a) 0% to 40%: might not be important;
b) 30% to 60%: may represent moderate heterogeneity;
c) 50% to 90%: may represent substantial heterogeneity; and
d) 75% to 100%: considerable heterogeneity.
Assessment of reporting biases
We compared available protocols to assess potential reporting bias. When protocols were unavailable we compared outcomes listed in the methods section of published manuscripts to those reported in the results section. If there were a sufficient number of studies included in the pooled analysis (e.g. > 10), we planned to investigate potential publication bias using funnel plots (Egger 1997).
Data synthesis
Data were pooled for meta‐analysis when the interventions, patient groups, outcome measures and timing of outcome assessment were sufficiently similar (to be determined among authors by consensus). The pooled RR and corresponding 95% CI were calculated for dichotomous outcomes. A P value of < 0.05 was considered statistically significant. For continuous outcomes, we planned to calculate the pooled MD and corresponding 95% CI.
Data were not pooled for analysis when I2 > 75%. If significant heterogeneity was detected (i.e. P < 0.10) we explored possible explanations using sensitivity analysis. In the absence of statistically significant heterogeneity a fixed‐effect model was applied. Otherwise, a random‐effects model was utilized (i.e. I2 > 50%).
Subgroup analysis and investigation of heterogeneity
If possible, we performed the following subgroup analyses for the primary and secondary efficacy outcomes:
a) disease activity (e.g. mild, moderate, or severe)
b) disease location (e.g. proctitis, left‐sided, pancolitis);
c) dose of intervention;
e) previous exposure to corticosteroids; and
f) previous exposure to biologics.
Sensitivity analysis
Where possible, we conducted sensitivity analyses by replicating the meta‐analysis with new data sets that exclude lower quality studies and incorporate specific assumptions in place of missing data. We conducted sensitivity analyses where appropriate to explore potential explanations for heterogeneity.
Results
Description of studies
Results of the search
The literature search conducted on 12 March 2015 identified 97 records. After duplicates were removed, a total of 74 records were screened for inclusion. Of these, 10 studies were selected for full text review. Four studies were excluded (see Characteristics of excluded studies), leaving 6 reports of 2 studies (N = 172) that met the pre‐defined inclusion criteria (see Figure 1).
Included studies
Rutgeerts 2013 was a randomized phase I study (N = 48) consisting of one single ascending dose (SAD) stage and one multiple dose (MD) stage. This study evaluated the safety and pharmacology of etrolizumab in patients with moderate to severe UC. Efficacy outcomes included clinical response (a decrease in Mayo Clinical Score of 3 points plus a 30% reduction from baseline and a ≥ 1 point decrease in rectal bleeding or absolute bleeding score of 0 or 1) and clinical remission at week 10 (defined as the proportion of patients with a Mayo Clinical Score < 2 with no individual subscore > 1). In the SAD stage, patients received placebo (n = 5) or one of the following doses of intravenous (IV) etrolizumab: 0.3 mg/kg (n = 4), 1.0 mg/kg (n = 4), 3.0 mg/kg (n = 4), 10.0 mg/kg (n = 4), or 3.0 mg/kg subcutaneously (n = 4). In the MD stage patients received placebo (n = 5), or one of the following subcutaneous (SC) doses of etrolizumab: 0.5 mg/kg (n = 4), 1.5 mg/kg (n = 5), 3.0 mg/kg (n = 4) or 4.0 mg/kg intravenously (n = 5) every four weeks for three cycles at days 1, 29 and 57. See Characteristics of included studies for further details.
Vermeire 2014 was a double‐blind, placebo‐controlled, randomized, phase II study in which patients with moderate to severe UC who had not responded to conventional therapy were treated with SC etrolizumab at doses of 100 mg (n = 41), or 300 mg plus a loading dose (n = 40) or matched placebo (n = 43). Patients in the 100 mg etrolizumab group received injections at weeks 0, 2, 4 and 8. Patients assigned to the 300 mg dose received an initial injection of 420 mg etrolizumab at week 0, followed by 300 mg at weeks 2, 4 and 8. The primary outcome was achievement of clinical remission at week 10 (defined as the proportion of patients with a Mayo Clinical Score < 2 with no individual subscore > 1). Secondary outcomes included clinical remission at week 6, clinical response, and the achievement of an endoscopic subscore of 0 and a rectal bleeding subscore of 0 at weeks 6 and 10. See Characteristics of included studies for further details.
Excluded studies
Armuzzi 2014, Fiorino 2014, Kreutzkamp 2014 and Lin 2014 were excluded because they were not RCTs.
Ongoing studies
We identified seven ongoing studies (NCT02163759; NCT02171429; NCT02136069; NCT02165215; NCT02118584; NCT02100696; NCT01461317). Five of the ongoing studies are phase III, randomized, double‐blind, placebo‐controlled trials (NCT02163759; NCT02171429; NCT02136069; NCT02165215; NCT02100696). Two of these studies compare the efficacy and safety of etrolizumab to adalimumab in patients with moderate to severe UC who are naive to TNF‐α antagonists (NCT02163759; NCT02171429). One study compares the efficacy and safety of etrolizumab to infliximab in patients who moderate to severe UC who are naive to TNF‐α antagonists. One study compares the efficacy and safety of etrolizumab to placebo for maintenance of UC in patients who are naive to TNF‐α antagonists (NCT02165215). NCT02100696 compares the efficacy and safety of etrolizumab in UC patients who are refractory or intolerant to TNF‐α antagonists. The remaining two ongoing trials are open‐label extension studies for patients with UC who participated in etrolizumab phase III studies (NCT02118584; NCT01461317). See Characteristics of ongoing studies for further details.
Risk of bias in included studies
The risk of bias assessment is summarized in Figure 2. The two included studies were of high methodological quality. Both studies used an interactive voice response system to conduct sequence generation. Both included studies utilized a centralized randomization technique and were rated as low risk of bias for allocation concealment. Although both studies were double‐blind, Rutgeerts 2013 failed to explicitly note whether all patients, assessors and personnel were masked to treatment assignment. As a result, this study was rated as unclear risk of bias for performance and detection bias. The studies used adequate methods to deal with missing data and were rated as low risk of bias for incomplete outcome data. The studies reported results for all a priori outcomes are were both rated as low risk of bias for selective reporting. Both studies were rated as low risk of bias for other sources of bias.
Effects of interventions
Etrolizumab versus placebo
The Rutgeerts 2013 study reported efficacy data for the MD stage. The MD stage involved four different dose groups and both SC and IV dosing. However, Rutgeerts 2013 only reported efficacy results for all etrolizumab dose groups combined. Thus we did not pool efficacy data from the two included studies due to differences in dose and route of administration.
Failure to enter clinical remission at week 6:
Data from one randomized trial were available for this outcome (Vermeire 2014). There was no statistically significant difference in the proportion of patients who failed to enter remission at week six. Ninety‐one per cent (71/78) of patients in the etrolizumab group failed to enter clinical remission compared to 95% (39/41) of placebo patients (RR 0.96, 95% CI 0.87 to 1.06). A subgroup analysis by dose found no statistically significant difference in clinical remission rates between patients treated with 100 mg (RR=0.94, 95% CI 0.82 to 1.09) or 300 mg etrolizumab versus placebo (RR 0.97, 95% CI 0.85 to 1.11). No significant heterogeneity was detected for this comparison (P = 0.80, I2 = 0%).
Failure to enter clinical remission at week 10:
Rutgeerts 2013 reported on clinical remission rates at week 10 among patients in the MD cohort. There was no statistically significant difference in the proportion of patients who failed to enter remission at week 10, Eight‐three per cent (15/18) of etrolizumab patients failed to enter remission compared to 80% (4/5) of placebo patients (RR 1.04, 95% CI 0.64 to 1.69).
Vermeire 2014 also reported on clinical remission rates at week 10. There was a statistically significant difference in clinical remission rates favouring etrolizumab over placebo. After 10 weeks of treatment 85% (66/78) of patients treated with etrolizumab failed to achieve clinical remission compared to 100% (41/41) of patients in the placebo group (RR 0.86, 95% CI 0.77 to 0.95). A GRADE analysis indicated that the overall quality of evidence for this outcome was moderate due to sparse data (107 events, see summary of findings Table for the main comparison). A subgroup analysis by dose found a statistically significant difference in clinical remission rates favoring 100 mg etrolizumab over placebo (RR 0.81 CI 95% 0.68 to 0.96), but not 300 mg etrolizumab over placebo (RR 0.91, 95% CI 0.80 to 1.03). No significant heterogeneity was detected for this comparison (P = 0.28, I2 = 13.5%).
Failure to improve clinically at week 6:
There was no statistically significant difference in clinical response at week 6 (Vermeire 2014). Fifty‐six per cent (44/78) of patients in the etrolizumab group failed to respond at week 6 compared to 66% (27/41) of placebo patients (RR 0.86, 95% CI 0.64 to 1.15). A subgroup analysis by dose did not demonstrate a statistically significant difference in clinical response rates between patients treated with 100 mg (RR 0.79, 95% CI 0.51 to 1.23) or 300 mg etrolizumab versus placebo (RR 0.92, 95% CI 0.62 to 1.36). No significant heterogeneity was detected for this comparison (P = 0.60, I2 = 0%).
Failure to improve clinically at week 10:
Rutgeerts 2013 reported on clinical response rates at week 10 among patients in the MD cohort. There was no statistically significant difference in the proportion of patients who failed to respond at week 10. Thirty‐three per cent (6/18) of etrolizumab patients failed to have a clinical response at week 10 compared to 20% (1/5) of placebo patients (RR 1.67, 95% CI 0.26 to 10.82).
Vermeire 2014 also reported on clinical response rates at week 10. There was no statistically significant difference in clinical response at week 10. Sixty‐eight per cent (53/78) of patients in the etrolizumab group failed to respond at week 10 compared to 71% (29/41) of placebo patients (RR 0.96, 95% CI 0.75 to 1.23). A GRADE analysis indicated that the overall quality of evidence for this outcome was moderate due to sparse data (82 events, see summary of findings Table for the main comparison). A subgroup analysis by dose found no statistically significant difference in clinical response rates between patients treated with 100 mg (RR 0.95, 95% CI 0.66 to 1.37) or 300 mg etrolizumab versus placebo (RR 0.97, 95% CI 0.69 to 1.36). No significant heterogeneity was detected for this comparison (P = 0.95, I2 = 0%).
Failure to enter endoscopic remission at week 6:
There was no statistically significant difference in endoscopic remission rates at week 6 (Vermeire 2014). Ninety‐five per cent (74/78) of patients in the etrolizumab group failed to enter endoscopic remission at week 6 compared to 98% (40/41) of placebo patients (RR 0.98, 95% CI 0.90 to 1.06). A GRADE analysis indicated that the overall quality of evidence for this outcome was moderate due to sparse data (114 events, see summary of findings Table for the main comparison). A subgroup analysis by dose found no statistically significant difference in endoscopic remission rates for patients treated with 100 mg (RR 0.93, 95% CI 0.83 to 1.05) or 300 mg etrolizumab versus placebo (RR 1.02, 95% CI 0.92 to 1.14). No significant heterogeneity was detected for this comparison (P = 0.27, I2 = 18.9%).
Failure to enter endoscopic remission at week 10:
There was no statistically significant difference in endoscopic remission rates at week 10 (Vermeire 2014). Ninety‐one per cent (71/78) of patients in the etrolizumab group failed to enter endoscopic remission at week 10 compared to 100% (41/41) of placebo patients (RR 0.92, 95% CI 0.85 to 1.00). A GRADE analysis indicated that the overall quality of evidence for this outcome was moderate due to sparse data (112 events, see summary of findings Table for the main comparison). A subgroup analysis by dose found no statistically significant difference in endoscopic remission rates for patients treated with 100 mg (RR 0.91, 95% CI 0.80 to 1.03) or 300 mg etrolizumab versus placebo (RR 0.93, 95% CI 0.83 to 1.05). No significant heterogeneity was detected for this comparison (P = 0.76, I2 = 0%).
Adverse Events
Vermeire 2014 and Rutgeerts 2013 reported on the total number of patients who experienced at least one adverse event, the total number of patients who experienced at least one serious adverse event, and the number of patients that withdrew due to adverse events. Initially, we pooled the outcome adverse events, however we decided not to pool this outcome due to high heterogeneity (I2 = 82%). There was no statistically significant difference in the proportion of patients who experienced at least one adverse event in the Rutgeerts 2013 study. Ninety‐five per cent (36/38) of etrolizumab patients had at least one adverse event compared to 100% (10/10) of patients in the placebo group (RR 0.98, 95% CI 0.84 to 1.14). There was a statistically significant difference in the proportion of patients who experienced at least one adverse event in the Vermeire 2014 study. Fifty‐four per cent (44/81) of etrolizumab patients had at least one adverse event compared to 72% per cent (31/43) of patients in the placebo group (RR 0.75, 95% CI 0.57 to 0.99). A GRADE analysis indicated that the overall quality of evidence for this outcome was moderate due to sparse data (75 events, See summary of findings Table for the main comparison). Common adverse events reported in the Rutgeerts 2013 study included exacerbation of UC, headache, fatigue, abdominal pain, dizziness, nasopharyngitis, nausea, arthralgia and urinary tract infection. Common adverse events reported in the Vermeire 2014 study included worsening UC, nasopharyngitis, nervous system disorders, headache and arthralgia.
A pooled analysis of data from Vermeire 2014 and Rutgeerts 2013 (n = 165) indicates that there was no statistically significant difference in the proportion of patients who experienced a serious adverse event. Twelve per cent (14/116) of patients receiving etrolizumab had a serious adverse event compared to 12% (6/49) of patients who received placebo (RR 0.92, 95% CI 0.36 to 2.34). Serious adverse events included exacerbation of UC, impaired wound healing and bacterial peritonitis.
A pooled analysis of data from Vermeire 2014 and Rutgeerts 2013 (n = 165) also indicates that there was no statistically significant difference in the proportion of patients who withdrew due to adverse events. Five per cent (6/116) of etrolizumab patients withdrew due to an adverse event compared to 4% (2/49) of placebo patients (RR 1.09, 95% CI 0.26 to 4.62).
Health‐related quality of life
Neither of the included studies reported on health‐related quality of life as an outcome.
Discussion
Summary of main results
Etrolizumab is a humanized monoclonal antibody that selectively binds to the β7 subunit of the α4β7 and αEβ7 integrins, which prevents these transmembrane receptors from interacting with MAdCAM‐1 and E‐cadherin ligands, respectively. This process blocks leukocyte migration and retention specifically within the intestinal mucosa. Two randomized controlled trials have studied etrolizumab for the induction of remission in UC patients with moderate to severe disease who have failed conventional therapy. Efficacy and safety data were available for both studies (Rutgeerts 2013; Vermeire 2014). We did not pool efficacy data from the two included studies due to differences in dose and route of administration.
Rutgeerts 2013 reported on clinical remission rates in the multidose cohort at 10 weeks and found no statistically significant differences in efficacy between etrolizumab and placebo. However, this phase I study was not adequately powered to detect a difference in efficacy should one exist. Vermeire 2014 reported on clinical remission rates at week 6 and 10. There was no statistically significant difference in failure to achieve clinical remission at week 6 between the etrolizumab and placebo groups. Vermeire 2014 found a statistically significant difference in remission rates at 10 weeks favouring etrolizumab over placebo. GRADE analyses indicated that the overall quality of evidence supporting this outcome was moderate due to sparse data (107 events). Subgroup analysis revealed that there was a statistically significant difference in clinical remission rates at week 10 favouring 100 mg etrolizumab over placebo, however there was no statistically significant difference between the 300 mg etrolizumab group and placebo for this outcome. This suggests that a dose of 100 mg may be effective for induction of remission in these patients. A GRADE analysis indicated that the overall quality of evidence supporting this outcome was moderate due to sparse data (51 events). More research is needed to determine the optimal dose of etrolizumab. With regard to clinical response, Vermeire 2014 reported on clinical response rates at weeks 6 and 10 and Rutgeerts 2013 reported on response rates at week 10. There was no statistically significant difference in response rates between the etrolizumab and placebo groups at week 6. Rutgeerts 2013 found no difference in clinical response rates at week 10. Likewise, Vermeire 2014 found no statistically significant difference in clinical response at week 10 between patients treated with etrolizumab versus placebo. A GRADE analysis indicated that the overall quality of evidence supporting this outcome was moderate due to sparse data (107 events).
Rutgeerts 2013 found no statistically significant difference between etrolizumab and placebo in the proportion of patients who experienced at least one adverse event. However, Vermeire 2014 found that patients in the placebo group were significantly more likely than etrolizumab patients to experience at least one adverse event. GRADE analyses indicated that the overall quality of evidence supporting this outcome was moderate due to sparse data (121 events). Common adverse events reported by Rutgeerts 2013 included exacerbation of UC, headache, fatigue, abdominal pain, dizziness, nasopharyngitis, nausea, arthralgia and urinary tract infection. Common adverse events reported by Vermeire 2014 included worsening UC, nasopharyngitis, nervous system disorders, headache and arthralgia. While etrolizumab demonstrated an acceptable safety profile in the two included studies, the number of patients investigated did not allow for the assessment of rare adverse events. Both Rutgeerts 2013 and Vermeire 2014 found no statistically significant difference in the number of withdrawals due to adverse events or the number of serious adverse events experienced by patients in the etrolizumab and placebo groups. GRADE analyses indicated that the overall quality of the evidence supporting these outcomes was low due to very sparse data (8 events and 20 events respectively). Serious adverse events reported in the studies included exacerbation of UC, impaired wound healing and bacterial peritonitis.
Overall completeness and applicability of evidence
The results of this review are applicable to patients with moderate to severe UC who have failed conventional therapy. Moderate quality evidence suggests that etrolizumab may be effective for treating moderate to severe UC in patients who have failed conventional therapy. However, both of the included studies were relatively small in size and as a result, event numbers for outcomes were low. Further research is necessary to confirm the efficacy, safety and optimal dose of etrolizumab in these patients. Etrolizumab could offer an out‐of‐class option for patients who fail TNF‐α antagonists. Currently, there are five phase III etrolizumab trials that include patients who are refractory or intolerant to TNF‐α antagonist therapy (NCT02100696; NCT02136069; NCT02163759; NCT02165215; NCT02171429), and two open‐label extension studies investigating the long‐term safety of etrolizumab (NCT01461317; NCT02118584). Although, greater evidence is required, etrolizumab could have the potential to significantly impact the treatment of UC particularly among patients who are non‐responsive to TNF‐α antagonist therapy.
Quality of the evidence
Both of the included studies were judged to be of low risk of bias. Rutgeerts 2013 was rated as unclear risk of bias for blinding and performance bias. GRADE analyses indicated that the overall quality of the evidence supporting the primary outcomes were rated as moderate quality due to sparse data (i.e. < 400 events). The secondary outcomes clinical response and endoscopic remission were also rated as moderate quality due to sparse data. Safety outcomes were rated as low quality due to sparse data and heterogeneity.
Potential biases in the review process
A comprehensive literature search was performed to reduce potential bias and identify all eligible studies. Two review authors independently assessed studies for inclusion, extracted data and rated study quality. There are several limitations to this review. The studies that investigated etrolizumab were small, and as a result they were only able to detect large effects and frequent adverse events. Also, not all groups could be pooled for analysis since one of the two included trials was a dose finding study, which decreases statistical power. The ongoing studies on etrolizumab for UC will likely provide more information on the safety and efficacy of this drug (see Characteristics of ongoing studies).
Agreements and disagreements with other studies or reviews
Etrolizumab is a relatively new therapeutic agent for ulcerative colitis. To our knowledge, there are no other systematic reviews assessing the efficacy and safety of this agent.

Study flow diagram.
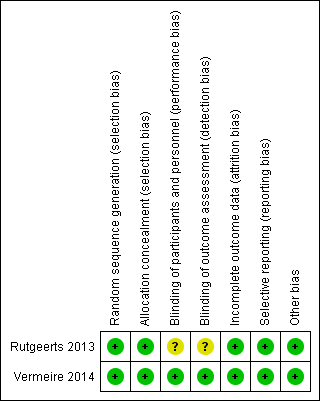
Risk of bias summary: review authors' judgements about each risk of bias item for each included study.

Comparison 1 Etrolizumab versus placebo, Outcome 1 Failure to enter clinical remission at week 6.
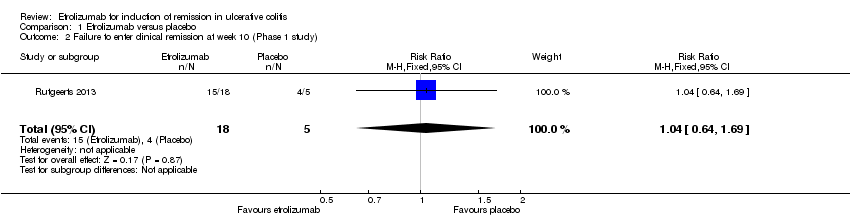
Comparison 1 Etrolizumab versus placebo, Outcome 2 Failure to enter clinical remission at week 10 (Phase 1 study).
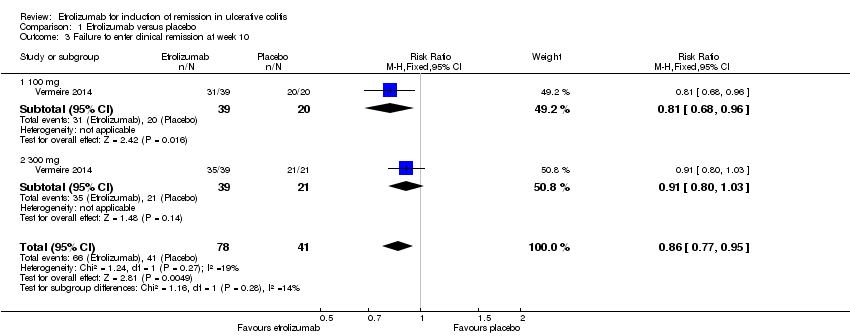
Comparison 1 Etrolizumab versus placebo, Outcome 3 Failure to enter clinical remission at week 10.
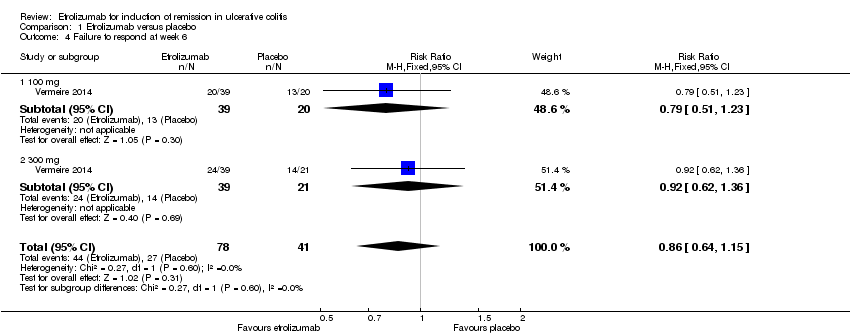
Comparison 1 Etrolizumab versus placebo, Outcome 4 Failure to respond at week 6.

Comparison 1 Etrolizumab versus placebo, Outcome 5 Failure to respond at week 10 (Phase 1 study).

Comparison 1 Etrolizumab versus placebo, Outcome 6 Failure to respond at week 10.
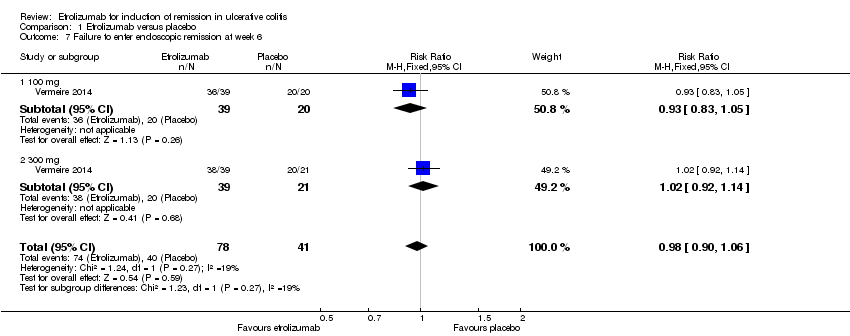
Comparison 1 Etrolizumab versus placebo, Outcome 7 Failure to enter endoscopic remission at week 6.
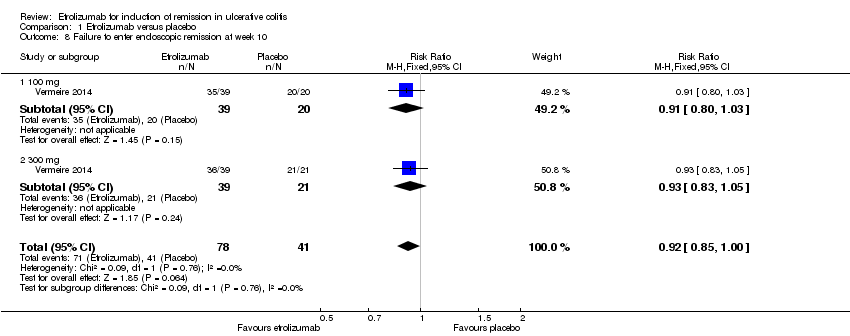
Comparison 1 Etrolizumab versus placebo, Outcome 8 Failure to enter endoscopic remission at week 10.

Comparison 1 Etrolizumab versus placebo, Outcome 9 Adverse events.
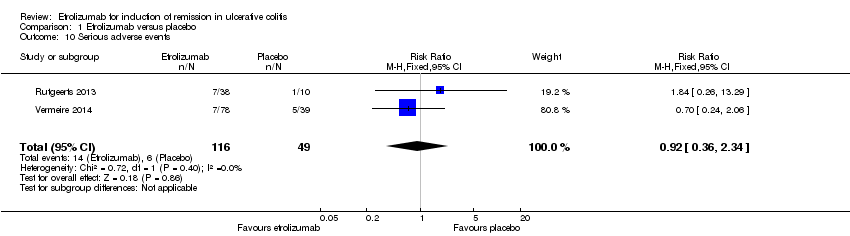
Comparison 1 Etrolizumab versus placebo, Outcome 10 Serious adverse events.

Comparison 1 Etrolizumab versus placebo, Outcome 11 Withdrawal due to adverse events.
| Etrolizumab versus placebo for induction of remission in ulcerative colitis | ||||||
| Patient or population: patients with induction of remission in ulcerative colitis | ||||||
| Outcomes | Illustrative comparative risks* (95% CI) | Relative effect | No of Participants | Quality of the evidence | Comments | |
| Assumed risk | Corresponding risk | |||||
| Control | Etrolizumab versus placebo | |||||
| Failure to enter clinical remission at week 10 | 1000 per 10001 | 860 per 1000 | RR 0.86 | 119 | ⊕⊕⊕⊝ | |
| Failure to enter clinical remission at week 10 ‐ 100 mg | 1000 per 10001 | 810 per 1000 | RR 0.81 | 59 | ⊕⊕⊕⊝ | |
| Failure to respond at week 10 | 707 per 10001 | 679 per 1000 | RR 0.96 | 119 | ⊕⊕⊕⊝ | |
| Failure to enter endoscopic remission at week 6 | 976 per 10001 | 956 per 1000 | RR 0.98 | 119 | ⊕⊕⊕⊝ | |
| Failure to enter endoscopic remission at week 10 | 1000 per 10001 | 920 per 1000 | RR 0.92 | 119 | ⊕⊕⊕⊝ | |
| Adverse events | 721 per 10001 | 541 per 1000 | RR 0.75 | 124 | ⊕⊕⊕⊝ | |
| Serious adverse events | 122 per 10001 | 113 per 1000 | RR 0.92 | 165 | ⊕⊕⊝⊝ | |
| *The basis for the assumed risk (e.g. the median control group risk across studies) is provided in footnotes. The corresponding risk (and its 95% confidence interval) is based on the assumed risk in the comparison group and the relative effect of the intervention (and its 95% CI). | ||||||
| GRADE Working Group grades of evidence | ||||||
| 1 Control group risk estimates come from control arm of meta‐analysis, based on included trials. 2 Downgraded one level due to sparse data (107 events). 3 Downgraded one level due to sparse data (51 events). 4 Downgraded one level due to sparse data (82 events). 5 Downgraded one level due to sparse data (114 events). 6 Downgraded one level due to sparse data (112 events). 7Downgraded one level due to sparse data (75 events). 8 Downgraded two levels due to very sparse data (20 events). | ||||||
| Outcome or subgroup title | No. of studies | No. of participants | Statistical method | Effect size |
| 1 Failure to enter clinical remission at week 6 Show forest plot | 1 | 119 | Risk Ratio (M‐H, Fixed, 95% CI) | 0.96 [0.87, 1.06] |
| 1.1 100 mg | 1 | 59 | Risk Ratio (M‐H, Fixed, 95% CI) | 0.94 [0.82, 1.09] |
| 1.2 300 mg | 1 | 60 | Risk Ratio (M‐H, Fixed, 95% CI) | 0.97 [0.85, 1.11] |
| 2 Failure to enter clinical remission at week 10 (Phase 1 study) Show forest plot | 1 | 23 | Risk Ratio (M‐H, Fixed, 95% CI) | 1.04 [0.64, 1.69] |
| 3 Failure to enter clinical remission at week 10 Show forest plot | 1 | 119 | Risk Ratio (M‐H, Fixed, 95% CI) | 0.86 [0.77, 0.95] |
| 3.1 100 mg | 1 | 59 | Risk Ratio (M‐H, Fixed, 95% CI) | 0.81 [0.68, 0.96] |
| 3.2 300 mg | 1 | 60 | Risk Ratio (M‐H, Fixed, 95% CI) | 0.91 [0.80, 1.03] |
| 4 Failure to respond at week 6 Show forest plot | 1 | 119 | Risk Ratio (M‐H, Fixed, 95% CI) | 0.86 [0.64, 1.15] |
| 4.1 100 mg | 1 | 59 | Risk Ratio (M‐H, Fixed, 95% CI) | 0.79 [0.51, 1.23] |
| 4.2 300 mg | 1 | 60 | Risk Ratio (M‐H, Fixed, 95% CI) | 0.92 [0.62, 1.36] |
| 5 Failure to respond at week 10 (Phase 1 study) Show forest plot | 1 | 23 | Risk Ratio (M‐H, Fixed, 95% CI) | 1.67 [0.26, 10.82] |
| 6 Failure to respond at week 10 Show forest plot | 1 | 119 | Risk Ratio (M‐H, Fixed, 95% CI) | 0.96 [0.75, 1.23] |
| 6.1 100 mg | 1 | 59 | Risk Ratio (M‐H, Fixed, 95% CI) | 0.95 [0.66, 1.37] |
| 6.2 300 mg | 1 | 60 | Risk Ratio (M‐H, Fixed, 95% CI) | 0.97 [0.69, 1.36] |
| 7 Failure to enter endoscopic remission at week 6 Show forest plot | 1 | 119 | Risk Ratio (M‐H, Fixed, 95% CI) | 0.98 [0.90, 1.06] |
| 7.1 100 mg | 1 | 59 | Risk Ratio (M‐H, Fixed, 95% CI) | 0.93 [0.83, 1.05] |
| 7.2 300 mg | 1 | 60 | Risk Ratio (M‐H, Fixed, 95% CI) | 1.02 [0.92, 1.14] |
| 8 Failure to enter endoscopic remission at week 10 Show forest plot | 1 | 119 | Risk Ratio (M‐H, Fixed, 95% CI) | 0.92 [0.85, 1.00] |
| 8.1 100 mg | 1 | 59 | Risk Ratio (M‐H, Fixed, 95% CI) | 0.91 [0.80, 1.03] |
| 8.2 300 mg | 1 | 60 | Risk Ratio (M‐H, Fixed, 95% CI) | 0.93 [0.83, 1.05] |
| 9 Adverse events Show forest plot | 2 | Risk Ratio (M‐H, Fixed, 95% CI) | Totals not selected | |
| 10 Serious adverse events Show forest plot | 2 | 165 | Risk Ratio (M‐H, Fixed, 95% CI) | 0.92 [0.36, 2.34] |
| 11 Withdrawal due to adverse events Show forest plot | 2 | 165 | Risk Ratio (M‐H, Fixed, 95% CI) | 1.09 [0.26, 4.62] |