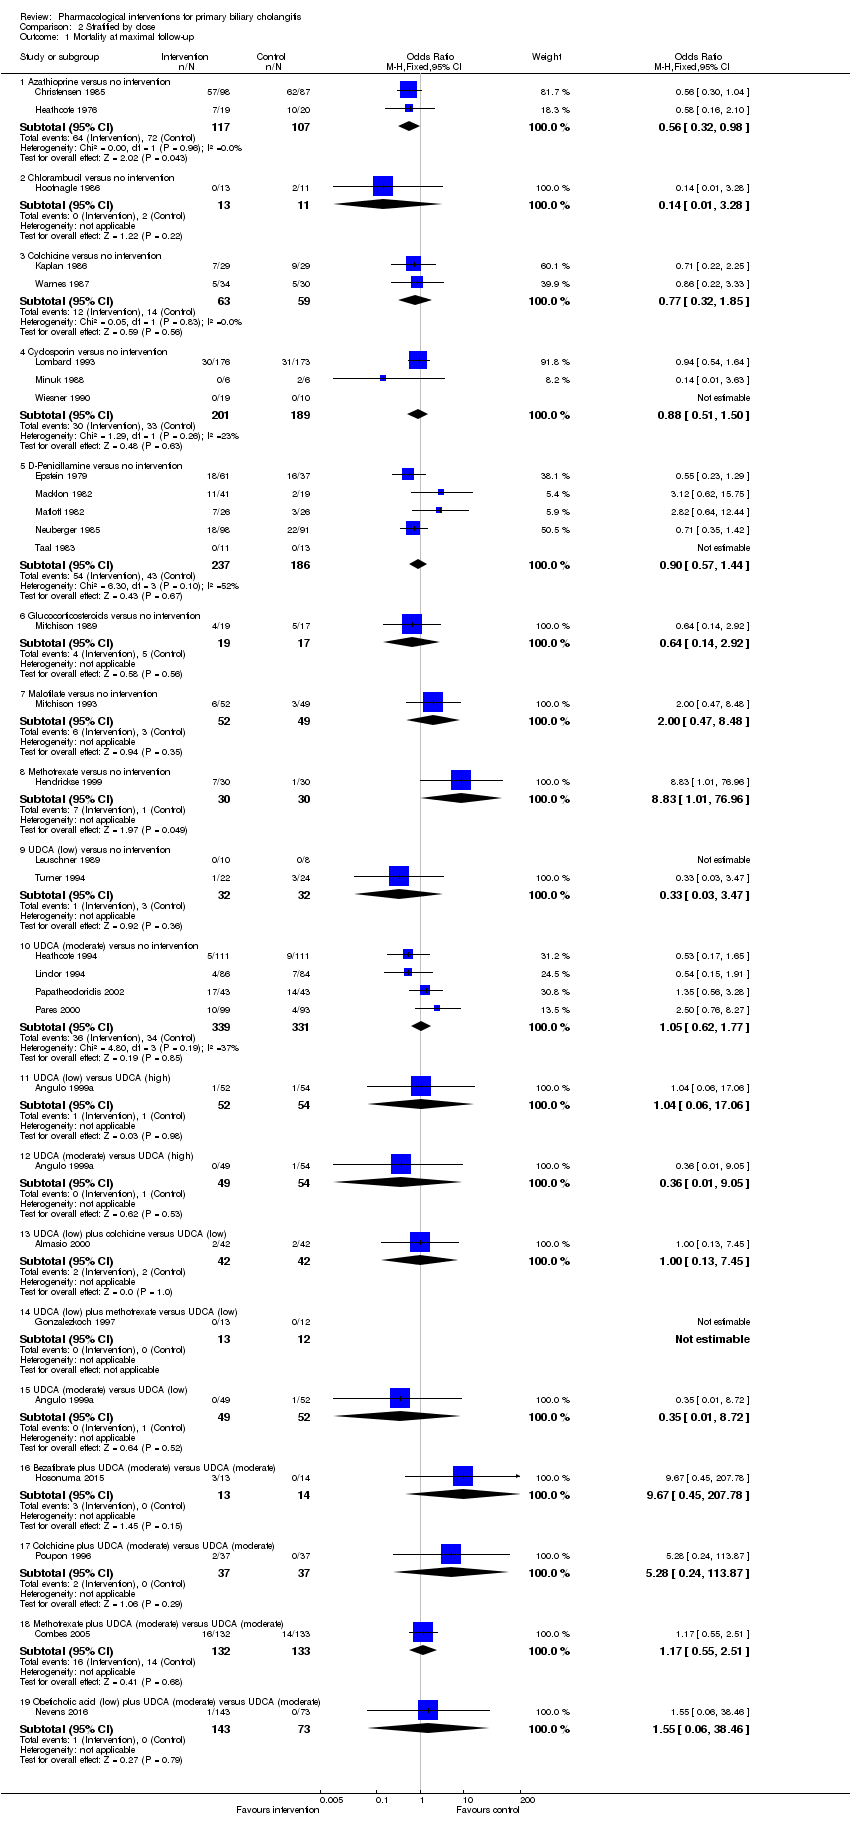
| 1 Mortality at maximal follow‐up Show forest plot | 29 | | Odds Ratio (M‐H, Fixed, 95% CI) | Subtotals only |
|
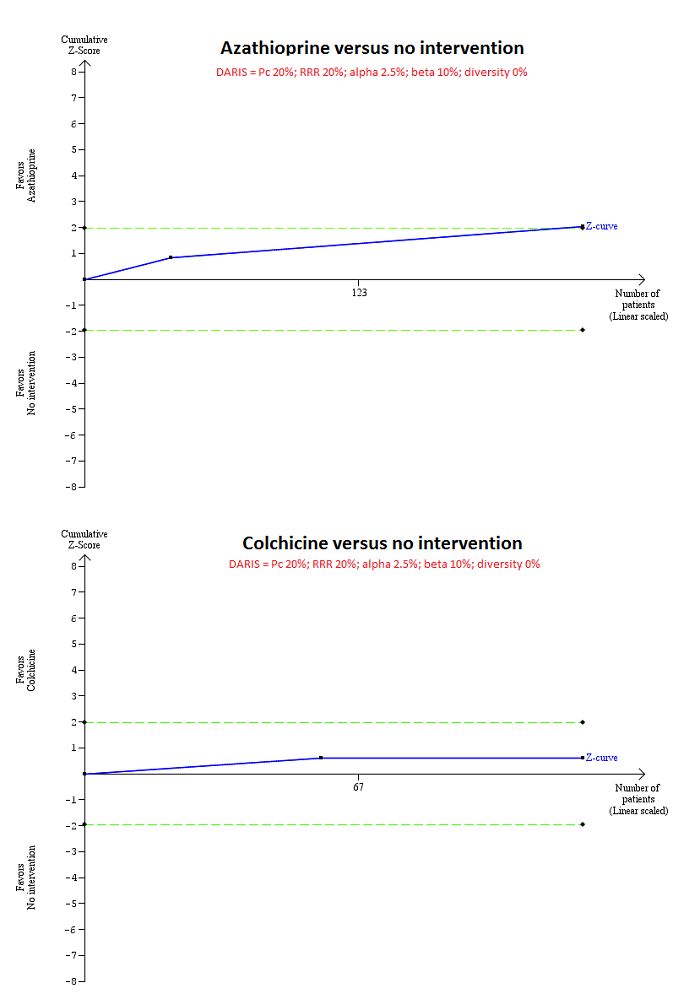
| 1.1 Azathioprine versus no intervention | 2 | 224 | Odds Ratio (M‐H, Fixed, 95% CI) | 0.56 [0.32, 0.98] |
| 1.2 Chlorambucil versus no intervention | 1 | 24 | Odds Ratio (M‐H, Fixed, 95% CI) | 0.14 [0.01, 3.28] |
| 1.3 Colchicine versus no intervention | 2 | 122 | Odds Ratio (M‐H, Fixed, 95% CI) | 0.77 [0.32, 1.85] |
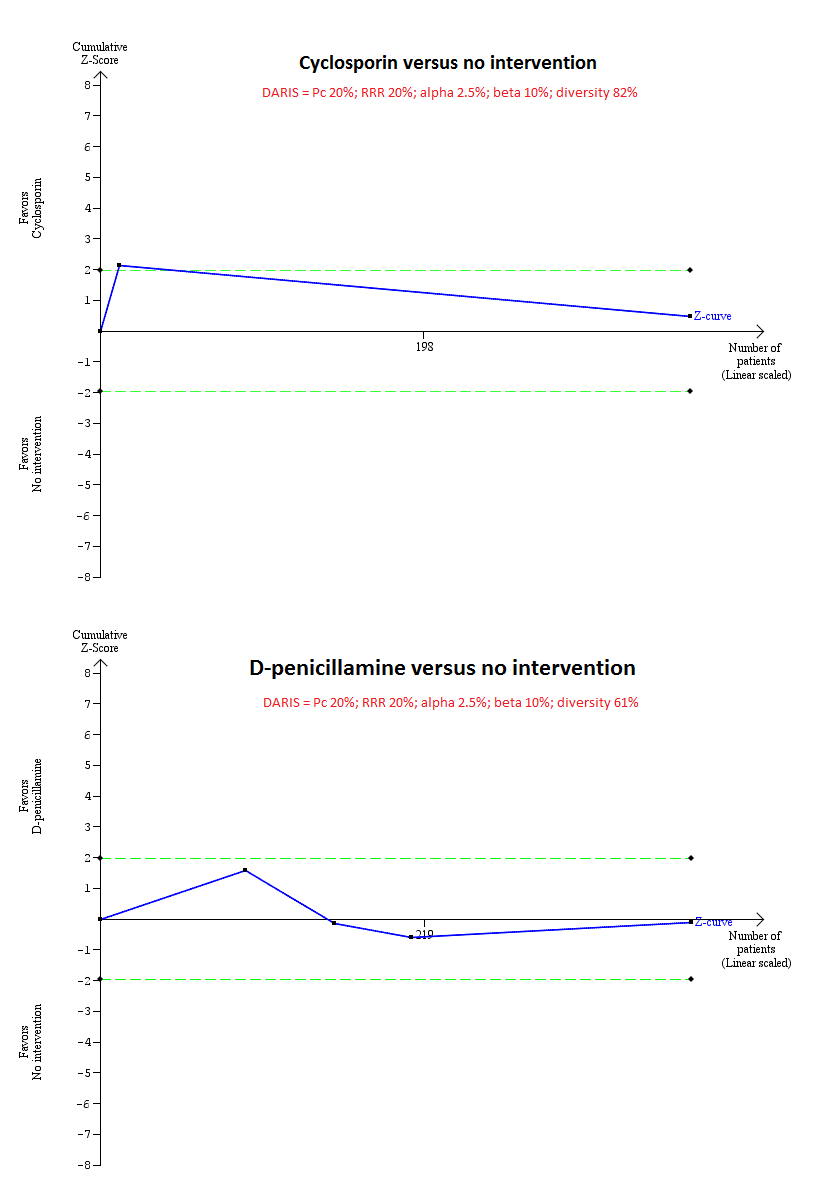
| 1.4 Cyclosporin versus no intervention | 3 | 390 | Odds Ratio (M‐H, Fixed, 95% CI) | 0.88 [0.51, 1.50] |
| 1.5 D‐Penicillamine versus no intervention | 5 | 423 | Odds Ratio (M‐H, Fixed, 95% CI) | 0.90 [0.57, 1.44] |
| 1.6 Glucocorticosteroids versus no intervention | 1 | 36 | Odds Ratio (M‐H, Fixed, 95% CI) | 0.64 [0.14, 2.92] |
| 1.7 Malotilate versus no intervention | 1 | 101 | Odds Ratio (M‐H, Fixed, 95% CI) | 2.0 [0.47, 8.48] |
| 1.8 Methotrexate versus no intervention | 1 | 60 | Odds Ratio (M‐H, Fixed, 95% CI) | 8.83 [1.01, 76.96] |
| 1.9 UDCA (low) versus no intervention | 2 | 64 | Odds Ratio (M‐H, Fixed, 95% CI) | 0.33 [0.03, 3.47] |
| 1.10 UDCA (moderate) versus no intervention | 4 | 670 | Odds Ratio (M‐H, Fixed, 95% CI) | 1.05 [0.62, 1.77] |
| 1.11 UDCA (low) versus UDCA (high) | 1 | 106 | Odds Ratio (M‐H, Fixed, 95% CI) | 1.04 [0.06, 17.06] |
| 1.12 UDCA (moderate) versus UDCA (high) | 1 | 103 | Odds Ratio (M‐H, Fixed, 95% CI) | 0.36 [0.01, 9.05] |
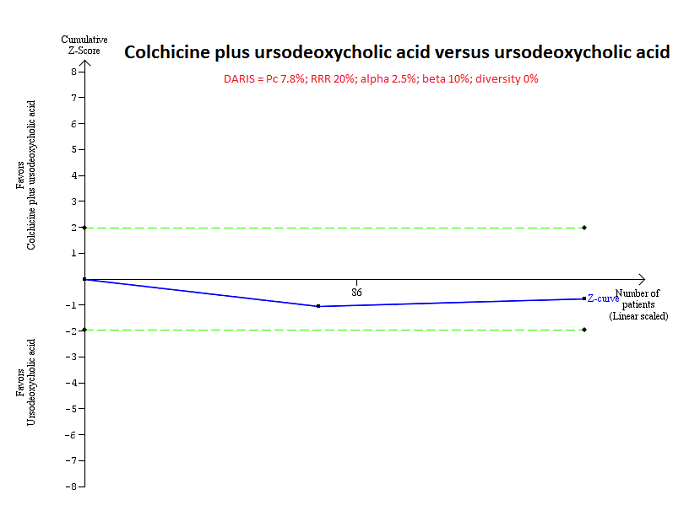
| 1.13 UDCA (low) plus colchicine versus UDCA (low) | 1 | 84 | Odds Ratio (M‐H, Fixed, 95% CI) | 1.0 [0.13, 7.45] |
| 1.14 UDCA (low) plus methotrexate versus UDCA (low) | 1 | 25 | Odds Ratio (M‐H, Fixed, 95% CI) | 0.0 [0.0, 0.0] |
| 1.15 UDCA (moderate) versus UDCA (low) | 1 | 101 | Odds Ratio (M‐H, Fixed, 95% CI) | 0.35 [0.01, 8.72] |
| 1.16 Bezafibrate plus UDCA (moderate) versus UDCA (moderate) | 1 | 27 | Odds Ratio (M‐H, Fixed, 95% CI) | 9.67 [0.45, 207.78] |
| 1.17 Colchicine plus UDCA (moderate) versus UDCA (moderate) | 1 | 74 | Odds Ratio (M‐H, Fixed, 95% CI) | 5.28 [0.24, 113.87] |
| 1.18 Methotrexate plus UDCA (moderate) versus UDCA (moderate) | 1 | 265 | Odds Ratio (M‐H, Fixed, 95% CI) | 1.17 [0.55, 2.51] |
| 1.19 Obeticholic acid (low) plus UDCA (moderate) versus UDCA (moderate) | 1 | 216 | Odds Ratio (M‐H, Fixed, 95% CI) | 1.55 [0.06, 38.46] |
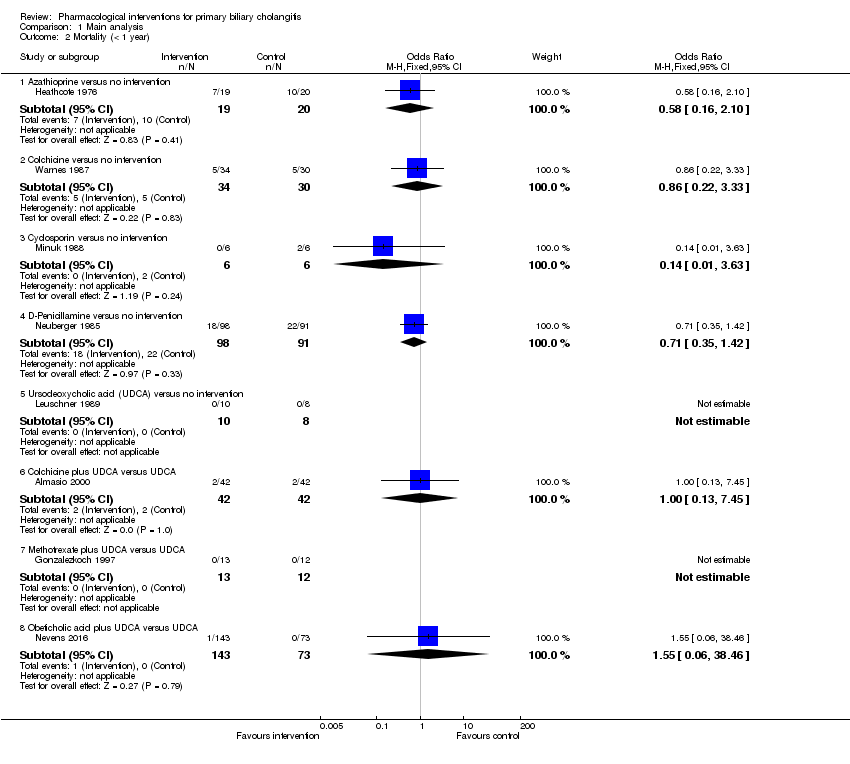
| 2 Mortality (< 1 year) Show forest plot | 9 | | Odds Ratio (M‐H, Fixed, 95% CI) | Subtotals only |
|
| 2.1 Azathioprine versus no intervention | 1 | 39 | Odds Ratio (M‐H, Fixed, 95% CI) | 0.58 [0.16, 2.10] |
| 2.2 Colchicine versus no intervention | 1 | 64 | Odds Ratio (M‐H, Fixed, 95% CI) | 0.86 [0.22, 3.33] |
| 2.3 Cyclosporin versus no intervention | 1 | 12 | Odds Ratio (M‐H, Fixed, 95% CI) | 0.14 [0.01, 3.63] |
| 2.4 D‐Penicillamine versus no intervention | 1 | 189 | Odds Ratio (M‐H, Fixed, 95% CI) | 0.71 [0.35, 1.42] |
| 2.5 UDCA (low) versus no intervention | 1 | 18 | Odds Ratio (M‐H, Fixed, 95% CI) | 0.0 [0.0, 0.0] |
| 2.6 UDCA (low) versus UDCA (high) | 1 | 106 | Odds Ratio (M‐H, Fixed, 95% CI) | 1.04 [0.06, 17.06] |
| 2.7 UDCA (moderate) versus UDCA (high) | 1 | 103 | Odds Ratio (M‐H, Fixed, 95% CI) | 0.36 [0.01, 9.05] |
| 2.8 Obeticholic acid (low) plus UDCA (moderate) versus UDCA (moderate) | 1 | 216 | Odds Ratio (M‐H, Fixed, 95% CI) | 1.55 [0.06, 38.46] |
| 2.9 UDCA (low) plus colchicine versus UDCA (low) | 1 | 84 | Odds Ratio (M‐H, Fixed, 95% CI) | 1.0 [0.13, 7.45] |
| 2.10 UDCA (low) plus methotrexate versus UDCA (low) | 1 | 25 | Odds Ratio (M‐H, Fixed, 95% CI) | 0.0 [0.0, 0.0] |
| 2.11 UDCA (moderate) versus UDCA (low) | 1 | 101 | Odds Ratio (M‐H, Fixed, 95% CI) | 0.35 [0.01, 8.72] |
| 3 Mortality (1 to 5 years) Show forest plot | 20 | | Odds Ratio (M‐H, Fixed, 95% CI) | Subtotals only |
|
| 3.1 Azathioprine versus no intervention | 1 | 185 | Odds Ratio (M‐H, Fixed, 95% CI) | 0.56 [0.30, 1.04] |
| 3.2 Chlorambucil versus no intervention | 1 | 24 | Odds Ratio (M‐H, Fixed, 95% CI) | 0.14 [0.01, 3.28] |
| 3.3 Colchicine versus no intervention | 1 | 58 | Odds Ratio (M‐H, Fixed, 95% CI) | 0.71 [0.22, 2.25] |
| 3.4 Cyclosporin versus no intervention | 2 | 378 | Odds Ratio (M‐H, Fixed, 95% CI) | 0.94 [0.54, 1.64] |
| 3.5 D‐Penicillamine versus no intervention | 4 | 234 | Odds Ratio (M‐H, Fixed, 95% CI) | 1.10 [0.59, 2.08] |
| 3.6 Glucocorticosteroids versus no intervention | 1 | 36 | Odds Ratio (M‐H, Fixed, 95% CI) | 0.64 [0.14, 2.92] |
| 3.7 Malotilate versus no intervention | 1 | 101 | Odds Ratio (M‐H, Fixed, 95% CI) | 2.0 [0.47, 8.48] |
| 3.8 Methotrexate versus no intervention | 1 | 60 | Odds Ratio (M‐H, Fixed, 95% CI) | 8.83 [1.01, 76.96] |
| 3.9 UDCA (low) versus no intervention | 1 | 46 | Odds Ratio (M‐H, Fixed, 95% CI) | 0.33 [0.03, 3.47] |
| 3.10 UDCA (moderate) versus no intervention | 4 | 670 | Odds Ratio (M‐H, Fixed, 95% CI) | 1.05 [0.62, 1.77] |
| 3.11 Bezafibrate plus UDCA (moderate) versus UDCA (moderate) | 1 | 27 | Odds Ratio (M‐H, Fixed, 95% CI) | 9.67 [0.45, 207.78] |
| 3.12 Colchicine plus UDCA (moderate) versus UDCA (moderate) | 1 | 74 | Odds Ratio (M‐H, Fixed, 95% CI) | 5.28 [0.24, 113.87] |
| 3.13 Methotrexate plus UDCA (moderate) versus UDCA (moderate) | 1 | 265 | Odds Ratio (M‐H, Fixed, 95% CI) | 1.17 [0.55, 2.51] |
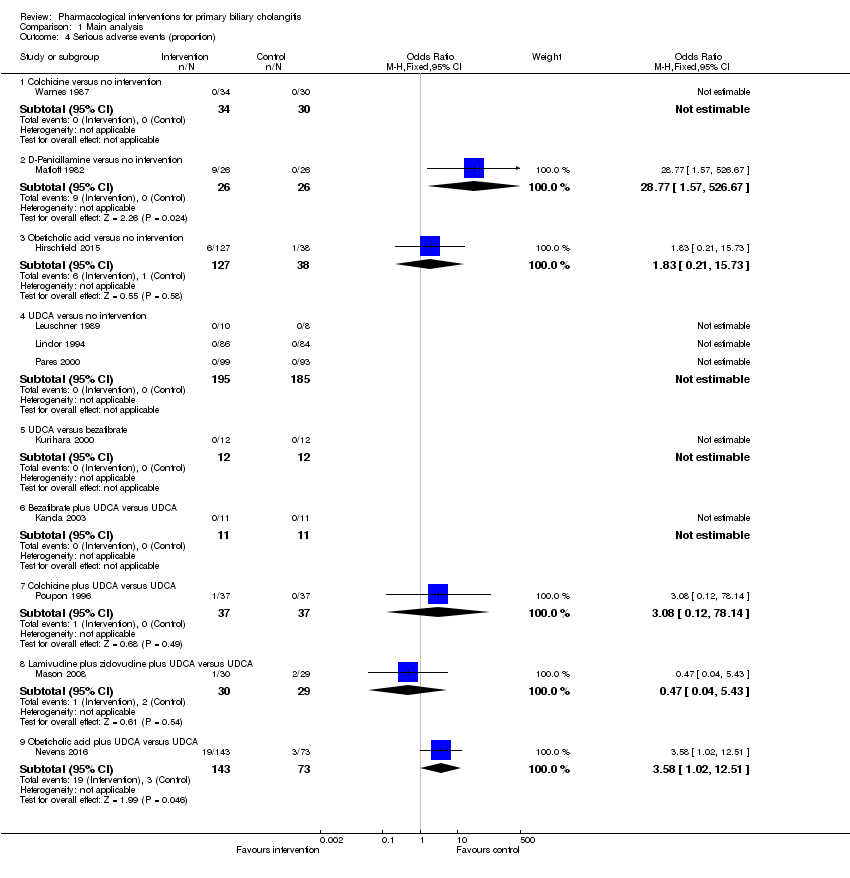
| 4 Serious adverse events (proportion) Show forest plot | 12 | | Odds Ratio (M‐H, Fixed, 95% CI) | Subtotals only |
|
| 4.1 Colchicine versus no intervention | 1 | 64 | Odds Ratio (M‐H, Fixed, 95% CI) | 0.0 [0.0, 0.0] |
| 4.2 D‐Penicillamine versus no intervention | 1 | 52 | Odds Ratio (M‐H, Fixed, 95% CI) | 28.77 [1.57, 526.67] |
| 4.3 Obeticholic acid (high) versus no intervention | 1 | 79 | Odds Ratio (M‐H, Fixed, 95% CI) | 5.14 [0.57, 46.17] |
| 4.4 Obeticholic acid (low) versus no intervention | 1 | 76 | Odds Ratio (M‐H, Fixed, 95% CI) | 0.32 [0.01, 8.22] |
| 4.5 Obeticholic acid (moderate) versus no intervention | 1 | 86 | Odds Ratio (M‐H, Fixed, 95% CI) | 0.79 [0.05, 13.01] |
| 4.6 UDCA (low) versus no intervention | 1 | 18 | Odds Ratio (M‐H, Fixed, 95% CI) | 0.0 [0.0, 0.0] |
| 4.7 UDCA (moderate) versus no intervention | 2 | 362 | Odds Ratio (M‐H, Fixed, 95% CI) | 0.0 [0.0, 0.0] |
| 4.8 UDCA (low) versus bezafibrate | 1 | 24 | Odds Ratio (M‐H, Fixed, 95% CI) | 0.0 [0.0, 0.0] |
| 4.9 Obeticholic acid (low) versus obeticholic acid (high) | 1 | 79 | Odds Ratio (M‐H, Fixed, 95% CI) | 0.09 [0.00, 1.61] |
| 4.10 Obeticholic acid (moderate) versus obeticholic acid (high) | 1 | 89 | Odds Ratio (M‐H, Fixed, 95% CI) | 0.15 [0.02, 1.37] |
| 4.11 Obeticholic acid (moderate) versus obeticholic acid (low) | 1 | 86 | Odds Ratio (M‐H, Fixed, 95% CI) | 2.43 [0.10, 61.39] |
| 4.12 Lamivudine plus zidovudine plus UDCA (moderate) versus UDCA (moderate) | 1 | 59 | Odds Ratio (M‐H, Fixed, 95% CI) | 0.47 [0.04, 5.43] |
| 4.13 UDCA (moderate) versus obeticholic acid (low) plus UDCA (moderate) | 1 | 216 | Odds Ratio (M‐H, Fixed, 95% CI) | 0.28 [0.08, 0.98] |
| 4.14 Bezafibrate plus UDCA (low) versus UDCA (low) | 1 | 22 | Odds Ratio (M‐H, Fixed, 95% CI) | 0.0 [0.0, 0.0] |
| 4.15 UDCA (moderate) versus UDCA (low) | 1 | 59 | Odds Ratio (M‐H, Fixed, 95% CI) | 0.0 [0.0, 0.0] |
| 4.16 Colchicine plus UDCA (moderate) versus UDCA (moderate) | 1 | 74 | Odds Ratio (M‐H, Fixed, 95% CI) | 3.08 [0.12, 78.14] |
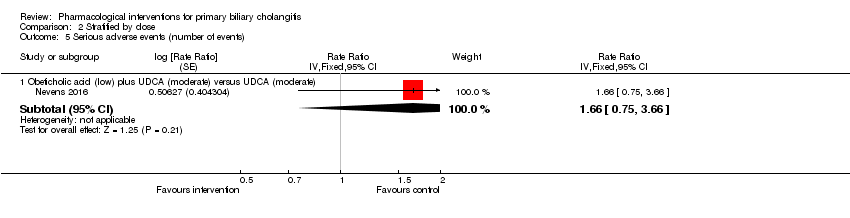
| 5 Serious adverse events (number of events) Show forest plot | 1 | | Rate Ratio (Fixed, 95% CI) | Subtotals only |
|
| 5.1 Obeticholic acid (low) plus UDCA (moderate) versus UDCA (moderate) | 1 | | Rate Ratio (Fixed, 95% CI) | 1.66 [0.75, 3.66] |
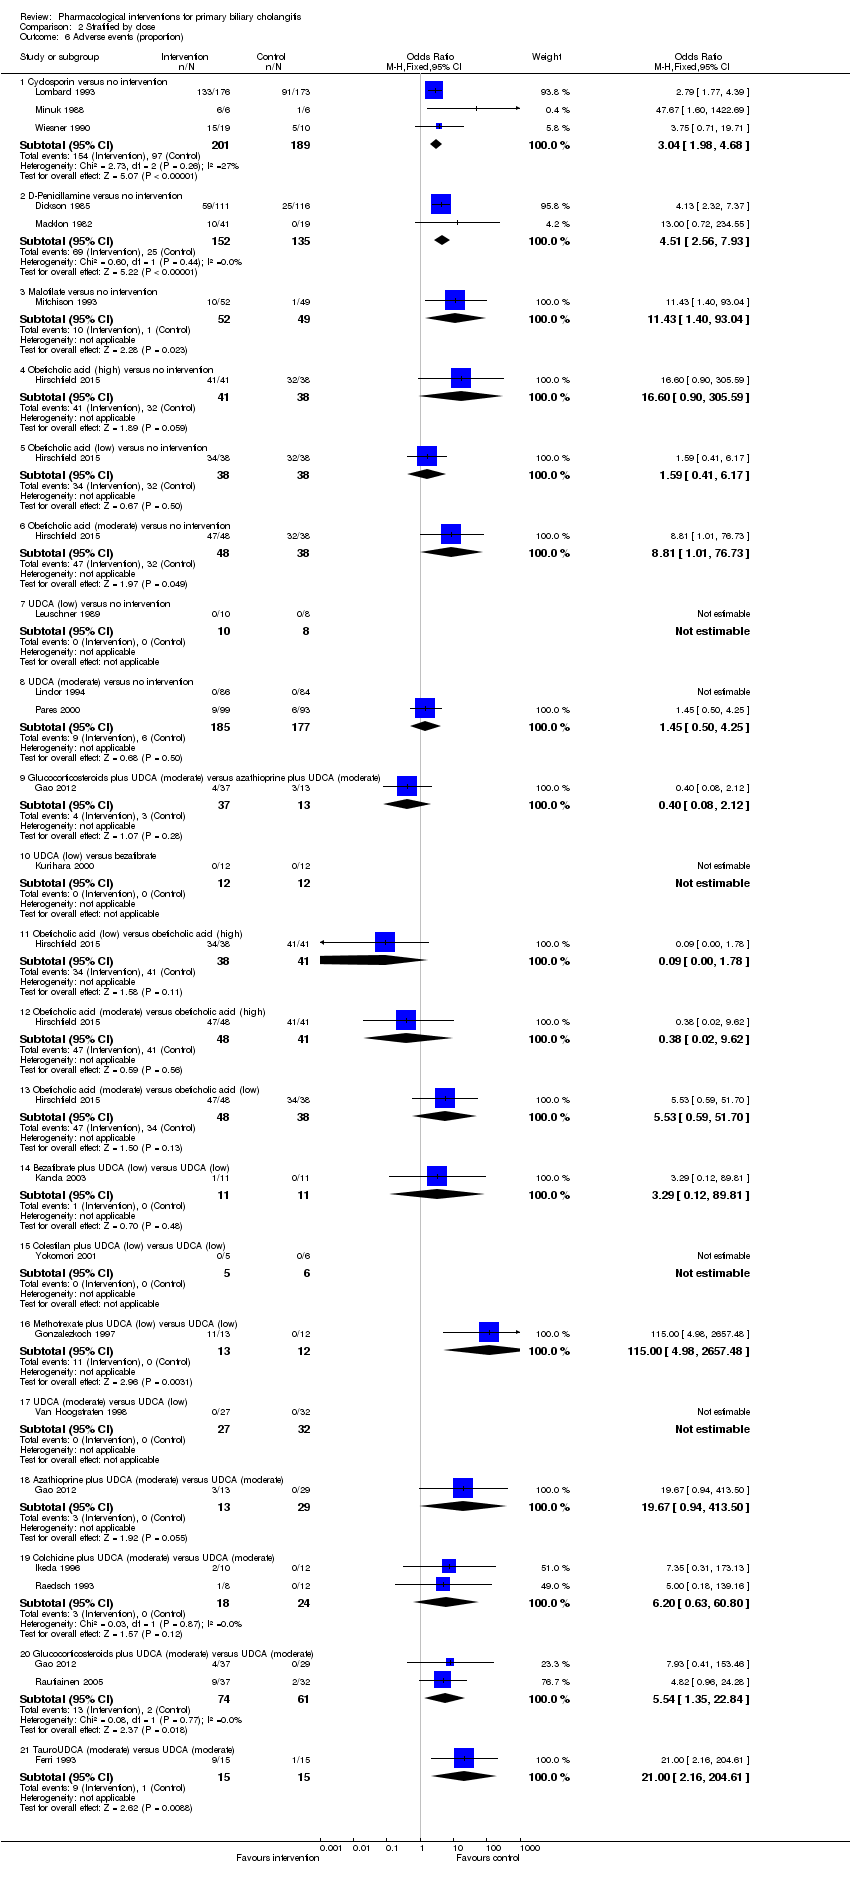
| 6 Adverse events (proportion) Show forest plot | 20 | | Odds Ratio (M‐H, Fixed, 95% CI) | Subtotals only |
|
| 6.1 Cyclosporin versus no intervention | 3 | 390 | Odds Ratio (M‐H, Fixed, 95% CI) | 3.04 [1.98, 4.68] |
| 6.2 D‐Penicillamine versus no intervention | 2 | 287 | Odds Ratio (M‐H, Fixed, 95% CI) | 4.51 [2.56, 7.93] |
| 6.3 Malotilate versus no intervention | 1 | 101 | Odds Ratio (M‐H, Fixed, 95% CI) | 11.43 [1.40, 93.04] |
| 6.4 Obeticholic acid (high) versus no intervention | 1 | 79 | Odds Ratio (M‐H, Fixed, 95% CI) | 16.6 [0.90, 305.59] |
| 6.5 Obeticholic acid (low) versus no intervention | 1 | 76 | Odds Ratio (M‐H, Fixed, 95% CI) | 1.59 [0.41, 6.17] |
| 6.6 Obeticholic acid (moderate) versus no intervention | 1 | 86 | Odds Ratio (M‐H, Fixed, 95% CI) | 8.81 [1.01, 76.73] |
| 6.7 UDCA (low) versus no intervention | 1 | 18 | Odds Ratio (M‐H, Fixed, 95% CI) | 0.0 [0.0, 0.0] |
| 6.8 UDCA (moderate) versus no intervention | 2 | 362 | Odds Ratio (M‐H, Fixed, 95% CI) | 1.45 [0.50, 4.25] |
| 6.9 Glucocorticosteroids plus UDCA (moderate) versus azathioprine plus UDCA (moderate) | 1 | 50 | Odds Ratio (M‐H, Fixed, 95% CI) | 0.40 [0.08, 2.12] |
| 6.10 UDCA (low) versus bezafibrate | 1 | 24 | Odds Ratio (M‐H, Fixed, 95% CI) | 0.0 [0.0, 0.0] |
| 6.11 Obeticholic acid (low) versus obeticholic acid (high) | 1 | 79 | Odds Ratio (M‐H, Fixed, 95% CI) | 0.09 [0.00, 1.78] |
| 6.12 Obeticholic acid (moderate) versus obeticholic acid (high) | 1 | 89 | Odds Ratio (M‐H, Fixed, 95% CI) | 0.38 [0.02, 9.62] |
| 6.13 Obeticholic acid (moderate) versus obeticholic acid (low) | 1 | 86 | Odds Ratio (M‐H, Fixed, 95% CI) | 5.53 [0.59, 51.70] |
| 6.14 Bezafibrate plus UDCA (low) versus UDCA (low) | 1 | 22 | Odds Ratio (M‐H, Fixed, 95% CI) | 3.29 [0.12, 89.81] |
| 6.15 Colestilan plus UDCA (low) versus UDCA (low) | 1 | 11 | Odds Ratio (M‐H, Fixed, 95% CI) | 0.0 [0.0, 0.0] |
| 6.16 Methotrexate plus UDCA (low) versus UDCA (low) | 1 | 25 | Odds Ratio (M‐H, Fixed, 95% CI) | 115.0 [4.98, 2657.48] |
| 6.17 UDCA (moderate) versus UDCA (low) | 1 | 59 | Odds Ratio (M‐H, Fixed, 95% CI) | 0.0 [0.0, 0.0] |
| 6.18 Azathioprine plus UDCA (moderate) versus UDCA (moderate) | 1 | 42 | Odds Ratio (M‐H, Fixed, 95% CI) | 19.67 [0.94, 413.50] |
| 6.19 Colchicine plus UDCA (moderate) versus UDCA (moderate) | 2 | 42 | Odds Ratio (M‐H, Fixed, 95% CI) | 6.20 [0.63, 60.80] |
| 6.20 Glucocorticosteroids plus UDCA (moderate) versus UDCA (moderate) | 2 | 135 | Odds Ratio (M‐H, Fixed, 95% CI) | 5.54 [1.35, 22.84] |
| 6.21 TauroUDCA (moderate) versus UDCA (moderate) | 1 | 30 | Odds Ratio (M‐H, Fixed, 95% CI) | 21.0 [2.16, 204.61] |
| 7 Adverse events (number) Show forest plot | 15 | | Rate Ratio (Fixed, 95% CI) | Subtotals only |
|
| 7.1 Chlorambucil versus no intervention | 1 | | Rate Ratio (Fixed, 95% CI) | 3.67 [1.04, 12.87] |
| 7.2 Cyclosporin versus no intervention | 3 | | Rate Ratio (Fixed, 95% CI) | 1.87 [1.51, 2.32] |
| 7.3 D‐Penicillamine versus no intervention | 3 | | Rate Ratio (Fixed, 95% CI) | 2.64 [1.78, 3.91] |
| 7.4 Malotilate versus no intervention | 1 | | Rate Ratio (Fixed, 95% CI) | 6.13 [1.38, 27.14] |
| 7.5 Obeticholic acid (high) versus no intervention | 1 | | Rate Ratio (Fixed, 95% CI) | 1.91 [1.50, 2.44] |
| 7.6 Obeticholic acid (low) versus no intervention | 1 | | Rate Ratio (Fixed, 95% CI) | 1.05 [0.80, 1.39] |
| 7.7 Obeticholic acid (moderate) versus no intervention | 1 | | Rate Ratio (Fixed, 95% CI) | 1.25 [0.97, 1.62] |
| 7.8 Obeticholic acid (low) versus obeticholic acid (high) | 1 | | Rate Ratio (Fixed, 95% CI) | 0.55 [0.43, 0.70] |
| 7.9 Obeticholic acid (moderate) versus obeticholic acid (high) | 1 | | Rate Ratio (Fixed, 95% CI) | 0.66 [0.53, 0.81] |
| 7.10 Obeticholic acid (moderate) versus obeticholic acid (low) | 1 | | Rate Ratio (Fixed, 95% CI) | 1.19 [0.93, 1.53] |
| 7.11 UDCA (low) versus UDCA (high) | 1 | | Rate Ratio (Fixed, 95% CI) | 2.08 [0.78, 5.53] |
| 7.12 UDCA (moderate) versus UDCA (high) | 1 | | Rate Ratio (Fixed, 95% CI) | 0.73 [0.21, 2.60] |
| 7.13 UDCA (low) plus methotrexate versus UDCA (low) | 1 | | Rate Ratio (Fixed, 95% CI) | 30.64 [1.84, 510.76] |
| 7.14 UDCA (moderate) versus UDCA (low) | 1 | | Rate Ratio (Fixed, 95% CI) | 0.35 [0.11, 1.10] |
| 7.15 Azathioprine plus glucocorticosteroids plus UDCA (moderate) versus UDCA (moderate) | 1 | | Rate Ratio (Fixed, 95% CI) | 1.32 [0.88, 1.97] |
| 7.16 Bezafibrate plus UDCA (moderate) versus UDCA (moderate) | 1 | | Rate Ratio (Fixed, 95% CI) | 11.79 [0.65, 213.14] |
| 7.17 Colchicine plus UDCA (moderate) versus UDCA (moderate) | 1 | | Rate Ratio (Fixed, 95% CI) | 5.91 [0.28, 123.08] |
| 7.18 TauroUDCA (moderate) versus UDCA (moderate) | 1 | | Rate Ratio (Fixed, 95% CI) | 1.17 [0.81, 1.71] |
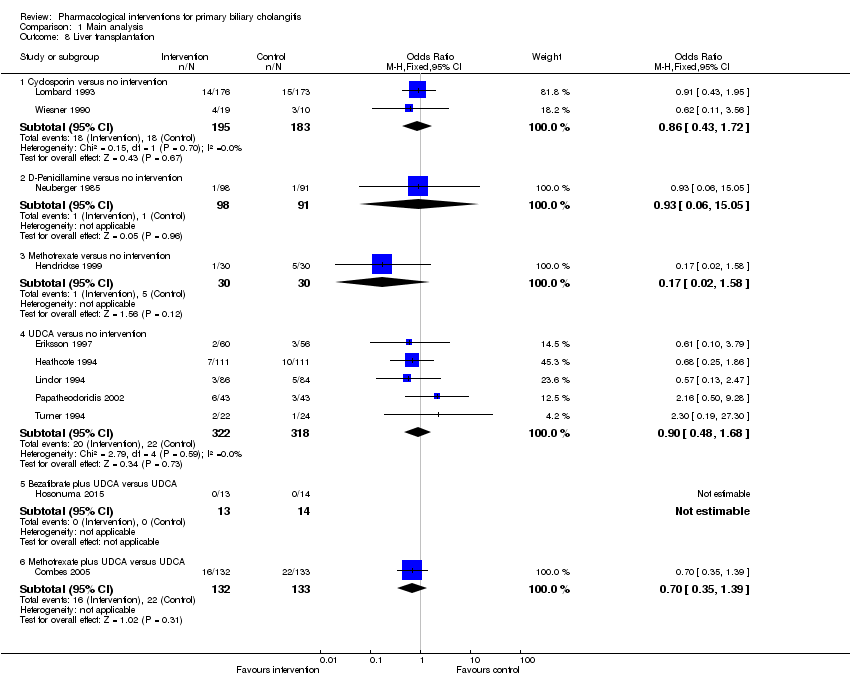
| 8 Liver transplantation Show forest plot | 12 | | Odds Ratio (M‐H, Fixed, 95% CI) | Subtotals only |
|
| 8.1 Cyclosporin versus no intervention | 2 | 378 | Odds Ratio (M‐H, Fixed, 95% CI) | 0.86 [0.43, 1.72] |
| 8.2 D‐Penicillamine versus no intervention | 1 | 189 | Odds Ratio (M‐H, Fixed, 95% CI) | 0.93 [0.06, 15.05] |
| 8.3 Methotrexate versus no intervention | 1 | 60 | Odds Ratio (M‐H, Fixed, 95% CI) | 0.17 [0.02, 1.58] |
| 8.4 UDCA (low) versus no intervention | 2 | 162 | Odds Ratio (M‐H, Fixed, 95% CI) | 0.99 [0.24, 4.06] |
| 8.5 UDCA (moderate) versus no intervention | 3 | 478 | Odds Ratio (M‐H, Fixed, 95% CI) | 0.88 [0.44, 1.76] |
| 8.6 UDCA (low) versus UDCA (high) | 1 | 106 | Odds Ratio (M‐H, Fixed, 95% CI) | 3.17 [0.13, 79.71] |
| 8.7 UDCA (moderate) versus UDCA (high) | 1 | 103 | Odds Ratio (M‐H, Fixed, 95% CI) | 3.37 [0.13, 84.70] |
| 8.8 UDCA (moderate) versus UDCA (low) | 1 | 101 | Odds Ratio (M‐H, Fixed, 95% CI) | 1.06 [0.06, 17.47] |
| 8.9 Bezafibrate plus UDCA (moderate) versus UDCA (moderate) | 1 | 27 | Odds Ratio (M‐H, Fixed, 95% CI) | 0.0 [0.0, 0.0] |
| 8.10 Methotrexate plus UDCA (moderate) versus UDCA (moderate) | 1 | 265 | Odds Ratio (M‐H, Fixed, 95% CI) | 0.70 [0.35, 1.39] |
| 9 Decompensated liver disease Show forest plot | 7 | | Odds Ratio (M‐H, Fixed, 95% CI) | Subtotals only |
|
| 9.1 D‐Penicillamine versus no intervention | 1 | 24 | Odds Ratio (M‐H, Fixed, 95% CI) | 0.0 [0.0, 0.0] |
| 9.2 UDCA (moderate) versus no intervention | 2 | 351 | Odds Ratio (M‐H, Fixed, 95% CI) | 1.33 [0.84, 2.12] |
| 9.3 Obeticholic acid (low) plus UDCA (moderate) versus UDCA (moderate) | 1 | 216 | Odds Ratio (M‐H, Fixed, 95% CI) | 1.55 [0.06, 38.46] |
| 9.4 UDCA (low) plus colchicine versus UDCA (low) | 1 | 84 | Odds Ratio (M‐H, Fixed, 95% CI) | 0.21 [0.04, 1.07] |
| 9.5 Azathioprine plus UDCA (moderate) versus UDCA (moderate) | 1 | 42 | Odds Ratio (M‐H, Fixed, 95% CI) | 0.52 [0.05, 5.18] |
| 9.6 Glucocorticosteroids plus UDCA (moderate) versus UDCA (moderate) | 1 | 66 | Odds Ratio (M‐H, Fixed, 95% CI) | 0.55 [0.11, 2.69] |
| 9.7 Methotrexate plus UDCA (moderate) versus UDCA (moderate) | 1 | 151 | Odds Ratio (M‐H, Fixed, 95% CI) | 2.00 [0.79, 5.04] |
| 9.8 Glucocorticosteroids plus UDCA (moderate) versus azathioprine plus UDCA (moderate) | 1 | 50 | Odds Ratio (M‐H, Fixed, 95% CI) | 1.06 [0.10, 11.18] |
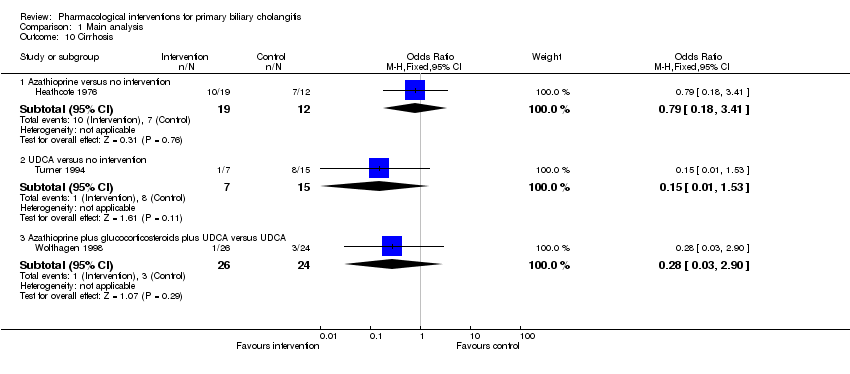
| 10 Cirrhosis Show forest plot | 3 | | Odds Ratio (M‐H, Fixed, 95% CI) | Subtotals only |
|
| 10.1 Azathioprine versus no intervention | 1 | 31 | Odds Ratio (M‐H, Fixed, 95% CI) | 0.79 [0.18, 3.41] |
| 10.2 UDCA (low) versus no intervention | 1 | 22 | Odds Ratio (M‐H, Fixed, 95% CI) | 0.15 [0.01, 1.53] |
| 10.3 Azathioprine plus glucocorticosteroids plus UDCA (moderate) versus UDCA (moderate) | 1 | 50 | Odds Ratio (M‐H, Fixed, 95% CI) | 0.28 [0.03, 2.90] |