Intervenciones farmacológicas para la infección aguda por el virus de la hepatitis C un intento de metanálisis en red
Información
- DOI:
- https://doi.org/10.1002/14651858.CD011644.pub2Copiar DOI

- Base de datos:
-
- Cochrane Database of Systematic Reviews
- Versión publicada:
-
- 12 marzo 2017see what's new
- Tipo:
-
- Intervention
- Etapa:
-
- Review
- Grupo Editorial Cochrane:
-
Grupo Cochrane de Hepatobiliar
- Copyright:
-
- Copyright © 2017 The Cochrane Collaboration. Published by John Wiley & Sons, Ltd.
Cifras del artículo
Altmetric:
Citado por:
Autores
Contributions of authors
MK and EB extracted data and provided them in a format that could be analysed.
DT, ET, and BD critically commented on the review.
KG wrote the review.
All review authors agreed on this version before publication.
Sources of support
Internal sources
-
University College London, UK.
External sources
-
National Institute for Health Research, UK.
This project was supported by the National Institute for Health Research (NIHR), via Cochrane Infrastructure, Cochrane Programme Grant, or Cochrane Incentive funding to the Cochrane Hepato‐Biliary and Upper Gastrointestinal and Pancreatic Diseases Groups. The views and opinions expressed therein are those of the review authors and do not necessarily reflect those of the Systematic Reviews Programme, NIHR, the National Health Service, or the Department of Health. The funding covered salary, equipment, and other resources to complete this review.
Declarations of interest
This report is independent research funded by the National Institute for Health Research (NIHR Cochrane Programme Grants, 13/89/03 ‐ evidence‐based diagnosis and management of upper digestive, hepato‐biliary, and pancreatic disorders). The views expressed in this publication are those of the review authors and not necessarily those of the National Health Service (NHS), the NIHR, or the Department of Health.
MK: no financial disclosures.
EB: no financial disclosures.
DT: Astellas funded Douglas Thorburn for his attendance at the International Liver Transplantation Society meeting in 2014. Douglas Thorburn has also received GBP 25,000 from Boston Scientific to fund a clinical research fellow in 2013. There are no other financial disclosures to report.
BD: no financial disclosures.
ET: no financial disclosures.
KG: no financial disclosures.
Acknowledgements
We thank the Cochrane Comparing of Multiple Interventions Methods Group and the Cochrane Hepato‐Biliary Group for their support and advice. We thank the copy editors for their support.
Cochrane Review Group funding acknowledgement: the Danish State is the largest single funder of the Cochrane Hepato‐Biliary Group through its investment in The Copenhagen Trial Unit, Centre for Clinical Intervention Research, Rigshospitalet, Copenhagen University Hospital, Denmark.
Disclaimer: the views and opinions expressed in this review are those of the review authors and do not necessarily reflect those of the Danish State or The Copenhagen Trial Unit.
Peer reviewers of review: Goran Poropat, Croatia; Karl Heinz Weiss, Germany.
Contact editor: Janus Christian Jakobsen, Denmark.
Sign‐off editor: Christian Gluud, Denmark.
Version history
| Published | Title | Stage | Authors | Version |
| 2018 Dec 03 | Pharmacological interventions for acute hepatitis C infection | Review | Maria Kalafateli, Elena Buzzetti, Douglas Thorburn, Brian R Davidson, Emmanuel Tsochatzis, Kurinchi Selvan Gurusamy | |
| 2017 Mar 12 | Pharmacological interventions for acute hepatitis C infection | Review | Maria Kalafateli, Elena Buzzetti, Douglas Thorburn, Brian R Davidson, Emmanuel Tsochatzis, Kurinchi Selvan Gurusamy | |
| 2015 Apr 14 | Pharmacological treatments for acute hepatitis C infection: a network meta‐analysis | Protocol | Kurinchi Selvan Gurusamy, Douglas Thorburn, Emmanuel Tsochatzis, Brian R Davidson | |
Differences between protocol and review
-
It was not possible to assess whether the potential effect modifiers were similar across different comparisons. Therefore, we did not perform the network meta‐analysis, and we assessed the comparative benefits and harms of different interventions using standard Cochrane methodology. The methodology that we plan to use if we conduct a network meta‐analysis in the future is available in Appendix 1.
-
We performed Trial Sequential Analysis in addition to conventional methods of assessing the risk of random errors using P values.
Notes
Considerable overlap is evident in the 'Methods' sections of this review and those of several other reviews written by the same group of authors.
Keywords
MeSH
Medical Subject Headings (MeSH) Keywords
- Acute Disease;
- Antiviral Agents [adverse effects, *therapeutic use];
- Hepatitis C [*drug therapy, mortality];
- Interferon-alpha [adverse effects, *therapeutic use];
- Interferon-beta [adverse effects, *therapeutic use];
- Network Meta-Analysis;
- Randomized Controlled Trials as Topic;
- Ribavirin [adverse effects, *therapeutic use];
- Viral Hepatitis Vaccines [*therapeutic use];
Medical Subject Headings Check Words
Humans;
PICO
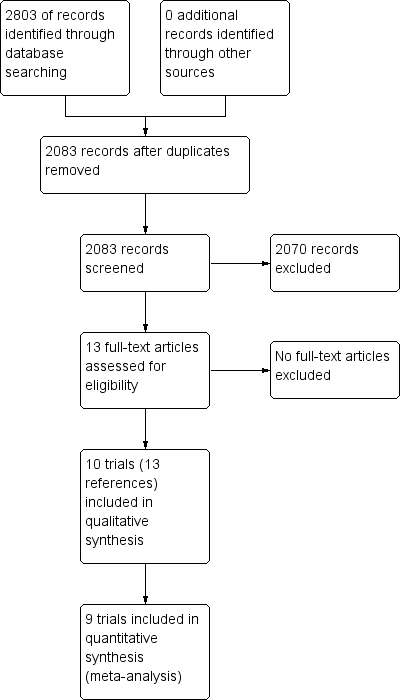
Study flow diagram.
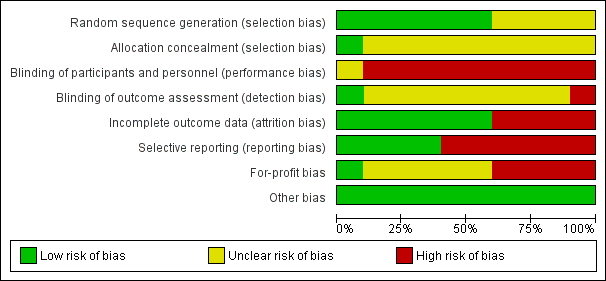
Risk of bias graph: review authors' judgements about each risk of bias item presented as percentages across all included studies.
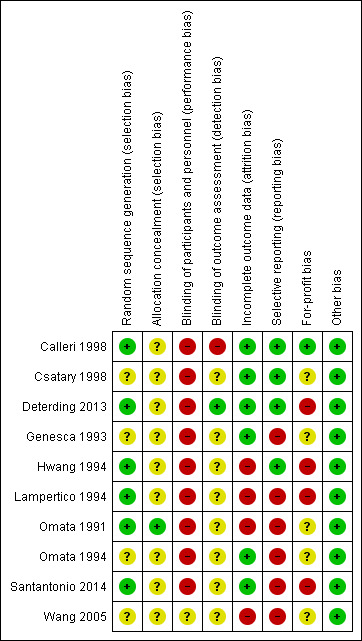
Risk of bias summary: review authors' judgements about each risk of bias item for each included study.
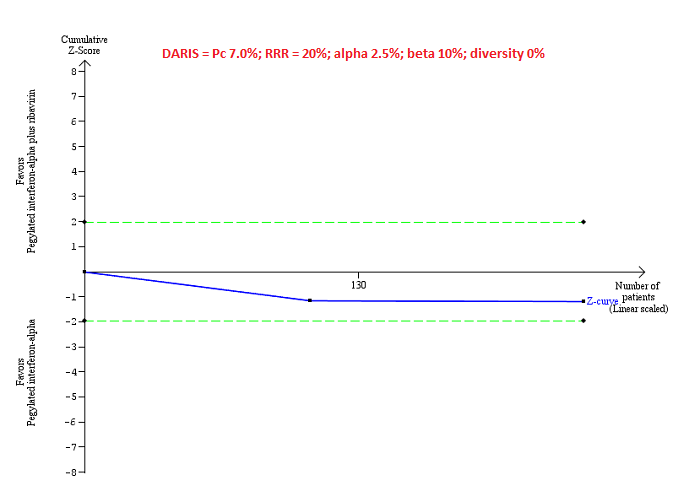
Trial Sequential Analysis of serious adverse events (proportion) for pegylated interferon‐alpha plus ribavirin versus pegylated interferon‐alpha performed using an alpha error of 2.5%, power of 90% (beta error of 10%), relative risk reduction (RRR) of 20%, control group proportion observed in trials (Pc = 7%), and observed heterogeneity in the trials (0%) shows that the accrued sample size was only a small fraction of the diversity‐adjusted required information size (DARIS); so the trial sequential monitoring boundaries were not drawn. The Z‐curve (blue line) does not cross the conventional boundaries (dotted green line). There was a high risk of random errors.

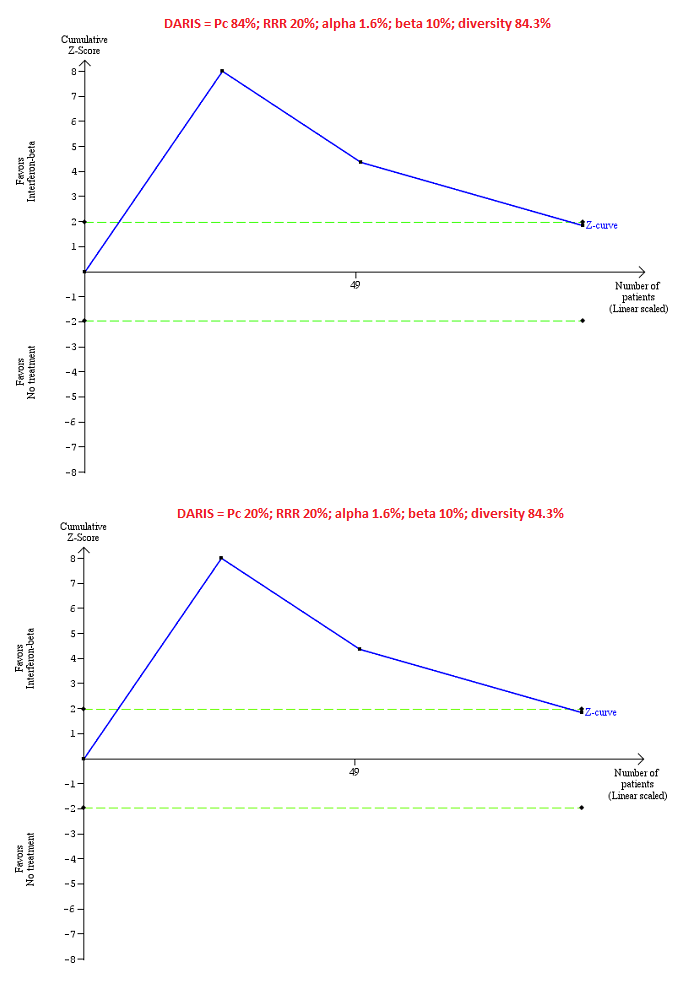
Trial Sequential Analysis of chronic hepatitis C virus for interferon‐alpha versus no intervention was performed using an alpha error of 1.6%, power of 90% (beta error of 10%), relative risk reduction (RRR) of 20%, control group proportion observed in trials (Pc = 84%; upper figure) and Pc = 20% (lower figure), and observed diversity in the trials (0%). The upper figure with Pc = 84% shows that the accrued sample size was only a small fraction of the diversity‐adjusted required information size (DARIS). The Z‐curve (blue line) crosses the conventional boundaries (dotted green line), but it does not cross any of the trial sequential monitoring boundaries (dotted red lines). The lower figure with Pc = 20% shows that the accrued sample size was so small that trial sequential monitoring boundaries were not drawn. There is a high risk of random errors.
Trial Sequential Analysis of chronic hepatitis C virus for interferon‐beta versus no intervention performed using an alpha error of 1.6%, power of 90% (beta error of 10%), relative risk reduction (RRR) of 20%, control group proportion observed in the trials (Pc = 84%; upper figure) and a Pc of 20% (lower figure), and observed heterogeneity in the trials (84%) shows that the accrued sample size was only a small fraction of the diversity‐adjusted required information size (DARIS); so the trial sequential monitoring boundaries were not drawn. The Z‐curve (blue line) crosses the conventional boundaries (dotted green line). There is a high risk of random errors.

Trial Sequential Analysis of chronic hepatitis C virus infection for pegylated interferon‐alpha plus ribavirin versus pegylated interferon‐alpha performed using an alpha error of 1.6%, power of 90% (beta error of 10%), relative risk reduction (RRR) of 20% (top figure and bottom figure) and 10% (middle figure), control group proportion observed in the trials (Pc = 84%; top figure and middle figure) and Pc = 20% (bottom figure), and observed heterogeneity in the trials (0%) shows that the Z‐curve (blue line) has reached the zone of futility for a RRR of 20% (top figure). However, when a RRR of 10% or when a Pc = 20% was used, the accrued sample size was only a small fraction of the diversity adjusted required information size (DARIS); the Z‐curve (blue line) does not cross the conventional boundaries (dotted green line) or trial sequential monitoring boundaries (dotted red line) (middle figure). For a Pc = 20%, the accrued sample size was so small that the trial sequential monitoring boundaries were not drawn. There is a high risk of random errors.

Comparison 1 Intervention versus control, Outcome 1 Serious adverse events (proportion).

Comparison 1 Intervention versus control, Outcome 2 Serious adverse events (number).

Comparison 1 Intervention versus control, Outcome 3 Adverse events (proportion).
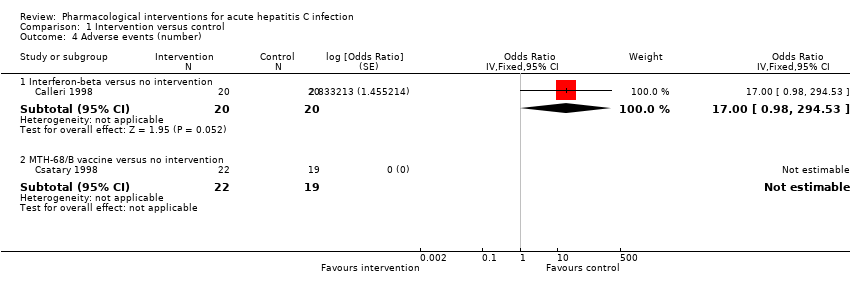
Comparison 1 Intervention versus control, Outcome 4 Adverse events (number).
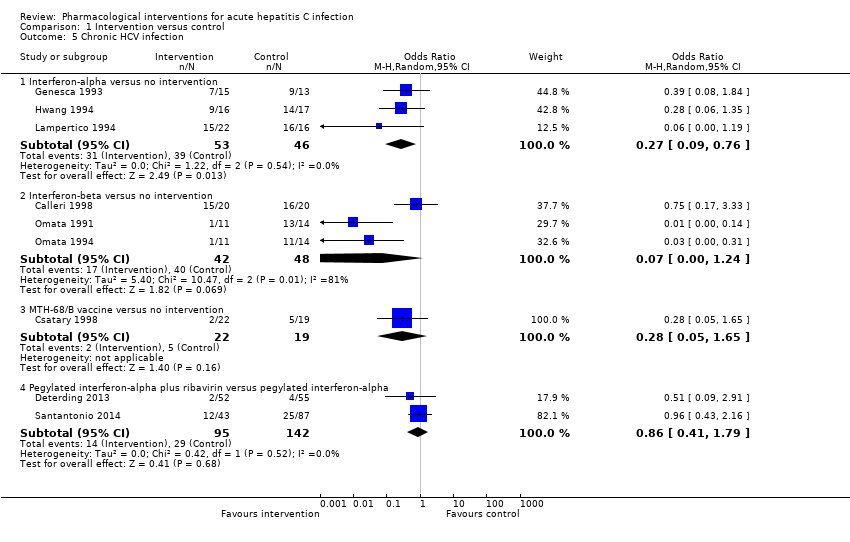
Comparison 1 Intervention versus control, Outcome 5 Chronic HCV infection.
| Intervention versus no intervention or control intervention (control) for acute hepatitis C infection: primary outcomes | |||||
| Patient or population: people with acute hepatitis C infection Intervention: multiple Control: multiple Settings: secondary or tertiary care | |||||
| Outcomes | Illustrative comparative risks* (95% CI) | Relative effect | No of participants | Quality of the evidence | |
| Assumed risk | Corresponding risk | ||||
| Control | Intervention | ||||
| Mortality: there was 1 mortality within 6 months (in the pegylated interferon‐alpha group (1/95 = 1.1%). There was no mortality in the remaining groups. There was no further mortality in the trials which reported mortality until maximal follow‐up. | |||||
| Serious adverse events: there were no serious adverse events in either group in the comparisons interferon‐beta versus control and MH‐68/B vaccine versus control. Trials in interferon‐alpha versus control did not report serious adverse events. | |||||
| Serious adverse events (proportion) ‐ pegylated interferon‐alpha plus ribavirin versus pegylated interferon‐alpha | 70 per 1000 | 115 per 1000 | OR 1.72 | 237 | ⊕⊝⊝⊝ |
| Serious adverse events (number) ‐ pegylated interferon‐alpha plus ribavirin versus pegylated interferon‐alpha | 92 per 1000 | 251 per 1000 | Rate ratio 2.74 | 237 | ⊕⊝⊝⊝ |
| Adverse events (proportion) ‐ interferon‐alpha versus no intervention | 10 per 1000 | 672 per 1000 | OR 203 | 33 | ⊕⊝⊝⊝ |
| Adverse events (proportion) ‐ interferon‐beta versus no intervention | 10 per 1000 | 220 per 1000 | OR 27.88 | 40 | ⊕⊝⊝⊝ |
| Adverse events: there were no adverse events in the comparison MTH‐68/B vaccine versus control. The number of adverse events was not reported for the comparison interferon‐alpha versus control. The proportion of people with adverse events and number of adverse events was not reported for the comparison pegylated interferon‐alpha plus ribavirin versus pegylated interferon‐alpha. | |||||
| Adverse events (number) ‐ interferon‐beta versus no intervention | 10 per 1000 | 147 per 1000 | OR 17 | 40 | ⊕⊝⊝⊝ |
| Health‐related quality of life | None of the trials reported this outcome. | ||||
| None of the trials reported health‐related quality of life, cirrhosis, decompensated liver disease, liver transplantation, or hepatocellular carcinoma. | |||||
| *The basis for the assumed risk is the mean control group proportion (or control group rate) unless there were no events in the control group when the control group proportion (or control group rate) was considered as 1%. The corresponding risk (and its 95% confidence interval) is based on the assumed risk in the comparison group and the relative effect of the intervention (and its 95% CI). CI: confidence interval; OR: odds ratio; RCT: randomised clinical trial. | |||||
| GRADE Working Group grades of evidence | |||||
| 1 Downgraded 2 levels for high risk of bias. | |||||
| Intervention versus no intervention or control intervention (control) for acute hepatitis C infection: secondary outcomes | |||||
| Patient or population: people with acute hepatitis C infection Intervention: multiple (see below) Control: multiple (see below) Settings: secondary or tertiary care | |||||
| Outcomes | Illustrative comparative risks* (95% CI) | Relative effect | No of participants | Quality of the evidence | |
| Assumed risk | Corresponding risk | ||||
| Control | Intervention | ||||
| Liver transplantation | None of the trials reported this outcome. | ||||
| Decompensated liver disease | None of the trials reported this outcome. | ||||
| Cirrhosis | None of the trials reported this outcome. | ||||
| Hepatocellular carcinoma | None of the trials reported this outcome. | ||||
| Chronic HCV infection†‐ interferon‐alpha versus no intervention | 848 per 1000 | 601 per 1000 | OR 0.27 | 99 | ⊕⊝⊝⊝ |
| Chronic HCV infection†‐ interferon‐beta versus no intervention | 833 per 1000 | 259 per 1000 | OR 0.07 | 90 | ⊕⊝⊝⊝ |
| Chronic HCV infection†‐ MTH‐68/B vaccine versus no intervention | 263 per 1000 | 91 per 1000 | OR 0.28 | 41 | ⊕⊝⊝⊝ |
| Chronic HCV infection†‐ pegylated interferon‐alpha plus ribavirin versus pegylated interferon‐alpha | 204 per 1000 | 181 per 1000 | OR 0.86 | 237 | ⊕⊝⊝⊝ |
| *The basis for the assumed risk is the mean control group proportion. The corresponding risk (and its 95% confidence interval) is based on the assumed risk in the comparison group and the relative effect of the intervention (and its 95% CI). †Chronic HCV infection was measured by absence of sustained virological response (i.e. the presence of circulating virus at least 6 months after cessation of treatment). CI: confidence interval; HCV: hepatitis C virus; OR: odds ratio; RCT: randomised clinical trial. | |||||
| GRADE Working Group grades of evidence | |||||
| 1 Downgraded 2 levels for high risk of bias (i.e. within study risk of bias). | |||||
| Study name | Intervention | Control | Period of follow‐up (months) | Randomisation | Blinding of participants and healthcare professionals | Blinding of outcome assessors | Missing outcome bias | Selective outcome reporting bias | For‐profit bias |
| Interferon‐alpha | No intervention | 12 | Unclear | High | Unclear | Low | High | Unclear | |
| Interferon‐alpha | No intervention | 12 | Unclear | High | Unclear | High | Low | High | |
| Interferon‐alpha | No intervention | 18 | Unclear | High | Unclear | High | High | High | |
| Interferon‐beta | No intervention | 36 | Low | High | Unclear | High | High | Unclear | |
| Interferon‐beta | No intervention | 36 | Unclear | High | Unclear | Low | High | Unclear | |
| Interferon‐beta | No intervention | 22.5 | Unclear | High | High | Low | Low | Low | |
| MTH‐68/B vaccine | No intervention | 12 | Unclear | High | Unclear | Low | Low | Unclear | |
| Pegylated interferon‐alpha | No intervention | 6 | Unclear | Unclear | Unclear | High | High | Unclear | |
| Pegylated interferon‐alpha | Pegylated interferon‐alpha plus ribavirin | 6 | Unclear | High | Low | High | Low | High | |
| Pegylated interferon‐alpha | Pegylated interferon‐alpha plus ribavirin | 12 | Unclear | High | Unclear | Low | High | High |
| Outcome or subgroup title | No. of studies | No. of participants | Statistical method | Effect size |
| 1 Serious adverse events (proportion) Show forest plot | 4 | Odds Ratio (M‐H, Fixed, 95% CI) | Subtotals only | |
| 1.1 Interferon‐beta versus no intervention | 1 | 40 | Odds Ratio (M‐H, Fixed, 95% CI) | 0.0 [0.0, 0.0] |
| 1.2 MTH‐68/B vaccine versus no intervention | 1 | 41 | Odds Ratio (M‐H, Fixed, 95% CI) | 0.0 [0.0, 0.0] |
| 1.3 Pegylated interferon‐alpha plus ribavirin versus pegylated interferon‐alpha | 2 | 237 | Odds Ratio (M‐H, Fixed, 95% CI) | 1.72 [0.70, 4.21] |
| 2 Serious adverse events (number) Show forest plot | 4 | Rate Ratio (Fixed, 95% CI) | Subtotals only | |
| 2.1 Interferon‐beta versus no intervention | 1 | 40 | Rate Ratio (Fixed, 95% CI) | 0.0 [0.0, 0.0] |
| 2.2 MTH‐68/B vaccine versus no intervention | 1 | 41 | Rate Ratio (Fixed, 95% CI) | 0.0 [0.0, 0.0] |
| 2.3 Pegylated interferon‐alpha plus ribavirin versus pegylated interferon‐alpha | 2 | 237 | Rate Ratio (Fixed, 95% CI) | 2.74 [1.40, 5.33] |
| 3 Adverse events (proportion) Show forest plot | 3 | Odds Ratio (M‐H, Fixed, 95% CI) | Subtotals only | |
| 3.1 Interferon‐alpha versus no intervention | 1 | 33 | Odds Ratio (M‐H, Fixed, 95% CI) | 203.0 [9.01, 4574.81] |
| 3.2 Interferon‐beta versus no intervention | 1 | 40 | Odds Ratio (M‐H, Fixed, 95% CI) | 27.88 [1.48, 526.12] |
| 3.3 MTH‐68/B vaccine versus no intervention | 1 | 41 | Odds Ratio (M‐H, Fixed, 95% CI) | 0.0 [0.0, 0.0] |
| 4 Adverse events (number) Show forest plot | 2 | Odds Ratio (Fixed, 95% CI) | Subtotals only | |
| 4.1 Interferon‐beta versus no intervention | 1 | 40 | Odds Ratio (Fixed, 95% CI) | 17.00 [0.98, 294.53] |
| 4.2 MTH‐68/B vaccine versus no intervention | 1 | 41 | Odds Ratio (Fixed, 95% CI) | 0.0 [0.0, 0.0] |
| 5 Chronic HCV infection Show forest plot | 9 | Odds Ratio (M‐H, Random, 95% CI) | Subtotals only | |
| 5.1 Interferon‐alpha versus no intervention | 3 | 99 | Odds Ratio (M‐H, Random, 95% CI) | 0.27 [0.09, 0.76] |
| 5.2 Interferon‐beta versus no intervention | 3 | 90 | Odds Ratio (M‐H, Random, 95% CI) | 0.07 [0.00, 1.24] |
| 5.3 MTH‐68/B vaccine versus no intervention | 1 | 41 | Odds Ratio (M‐H, Random, 95% CI) | 0.28 [0.05, 1.65] |
| 5.4 Pegylated interferon‐alpha plus ribavirin versus pegylated interferon‐alpha | 2 | 237 | Odds Ratio (M‐H, Random, 95% CI) | 0.86 [0.41, 1.79] |