Intervenciones farmacológicas para la infección aguda por el virus de la hepatitis C
Resumen
Antecedentes
El virus de la hepatitis C (HCV, por sus siglas en inglés) es un virus de ARN (ácido ribonucleico) de una sola cadena que tiene el potencial de causar la inflamación del hígado. La definición tradicional de infección aguda por el HCV es el período de los primeros seis meses después de la infección por el virus. Otra definición usada comúnmente de infección aguda por el HCV es la ausencia del anticuerpo del HCV y la seroconversión posterior (presencia de anticuerpo del HCV en un paciente que previamente era negativo para el anticuerpo del HCV). Aproximadamente un 40% a un 95% de los pacientes con infección aguda por el HCV desarrolla infección crónica por el HCV, o sea, presenta ARN del HCV persistente en la sangre. Se calcula que en 2010; 160 000 000 de personas en todo el mundo (2% a 3% de la población del mundo) presentaba infección crónica por el HCV. El tratamiento farmacológico óptimo de la infección aguda por el VHC sigue siendo controvertido. La infección crónica por el HCV puede dañar el hígado.
Objetivos
Evaluar los efectos beneficiosos y perjudiciales comparativos de diferentes intervenciones farmacológicas en el tratamiento de la infección aguda por el HCV mediante un metanálisis en red y generar jerarquizaciones de los tratamientos farmacológicos disponibles según su seguridad y eficacia. Sin embargo, no fue posible evaluar si los posibles modificadores del efecto fueron similares en las diferentes comparaciones. Por lo tanto, no se realizó el metanálisis en red, y en cambio, se evaluaron los efectos beneficiosos y perjudiciales comparativos de diferentes intervenciones comparadas entre sí o versus ninguna intervención mediante la metodología Cochrane estándar.
Métodos de búsqueda
Se realizaron búsquedas en el Registro Cochrane Central de Ensayos Controlados (Cochrane Central Register of Controlled Trials, CENTRAL), MEDLINE, Embase, Science Citation Index Expanded, World Health Organization International Clinical Trials Registry Platform y en los registros de ensayos controlados aleatorizados hasta abril de 2016 para identificar ensayos clínicos aleatorizados sobre intervenciones farmacológicas para la infección aguda por el VHC.
Criterios de selección
Se incluyeron sólo ensayos clínicos aleatorizados (de forma independiente del idioma, el cegamiento, o el estado de publicación) en participantes con infección aguda por el HCV. Se excluyeron los ensayos que incluían a participantes con trasplante previo de hígado y los que presentaban otras enfermedades virales coexistentes. Se consideró cualquiera de las diversas intervenciones farmacológicas comparadas con placebo o entre sí.
Obtención y análisis de los datos
Se utilizaron los procedimientos metodológicos estándar previstos por Cochrane. Se calculó el odds ratio (OR) y el cociente de tasas con intervalos de confianza (IC) del 95% mediante modelos tanto de efectos fijos como de efectos aleatorios basado en el análisis de participantes disponibles con Review Manager 5. Se evaluó el riesgo de sesgo según Cochrane, se controló el riesgo de errores aleatorios con el Análisis Secuencial de Ensayos y se evaluó la calidad de la evidencia con la metodología GRADE.
Resultados principales
Se identificaron 10 ensayos clínicos aleatorizados con 488 participantes asignados al azar que cumplieron con los criterios de inclusión. El riesgo de sesgo de los ensayos fue alto en uno o más dominios. En términos generales, la evidencia para todos los resultados fue de calidad muy baja. Nueve ensayos (467 participantes) proporcionaron información para uno o más resultados. Tres ensayos (99 participantes) compararon interferón alfa versus ninguna intervención. Tres ensayos (90 participantes) compararon interferón beta versus ninguna intervención. Un ensayo (21 participantes) comparó interferón alfa pegilado versus ninguna intervención, aunque no proporcionó datos para el análisis. Un ensayo (41 participantes) comparó la vacuna MTH‐68/B versus ninguna intervención. Dos ensayos (237 participantes) compararon interferón alfa pegilado versus interferón alfa pegilado más ribavirina. Ninguno de los ensayos comparó antivirales de acción directa versus placebo u otras intervenciones. La media o mediana de período de seguimiento en los ensayos varió de seis a 36 meses.
No hubo mortalidad a corto plazo (menos de un año) en ningún grupo de ningún ensayo, excepto en un ensayo en el que un participante murió en el grupo de interferón alfa pegilado más ribavirina (1/95: 1.1%). En los ensayos que informaron el seguimiento más allá de un año, no hubo muertes adicionales. El número de eventos adversos graves fue mayor con el interferón alfa pegilado más ribavirina que con el interferón alfa pegilado (cociente de tasas 2,74; IC del 95%: 1,40 a 5,33; participantes = 237; ensayos = 2; I2 = 0%). La proporción de personas con cualquier evento adverso fue mayor con el interferón alfa y el interferón beta en comparación con ninguna intervención (OR 203,00; IC del 95%: 9,01 a 4574,81; participantes = 33; ensayos = 1 y OR 27,88; IC del 95%: 1,48 a 526,12; participantes = 40; ensayos = 1). Ninguno de los ensayos informó la calidad de vida relacionada con la salud, el trasplante hepático, las enfermedades hepáticas descompensadas, la cirrosis ni el carcinoma hepatocelular. La proporción de personas con infección crónica por el VHC indicada por la falta de respuesta virológica sostenida fue menor en el grupo de interferón‐alfa versus ninguna intervención (OR 0,27, IC del 95%: 0,09 a 0,76; participantes = 99; ensayos = 3; I2 = 0%). Las diferencias entre los grupos fueron imprecisas o no estimables (debido a que ningún grupo tuvo eventos) para todas las comparaciones restantes.
Cuatro de los 10 ensayos (40%) recibieron ayuda económica o de otro tipo de las empresas farmacéuticas que se beneficiarían de los resultados de la investigación; la fuente de financiación no estaba disponible en cinco ensayos (50%), y un ensayo (10%) fue financiado por un hospital.
Conclusiones de los autores
La evidencia de calidad muy baja sugiere que el interferón alfa puede reducir la incidencia de infección crónica por el HCV según lo medido de acuerdo a la respuesta virológica sostenida. Sin embargo, no se informó el impacto clínico como la mejoría en la calidad de vida relacionada con la salud, la reducción de la cirrosis, la enfermedad hepática descompensada ni el trasplante hepático. Tampoco está claro si este resultado es aplicable en el contexto clínico actual dominado por la administración de interferones pegilados y antivirales de acción directa, aunque no se halló evidencia que apoyara que los interferones pegilados o la ribavirina o ambos fuesen efectivos para los pacientes con infección aguda por el HCV. No fue posible encontrar ningún ensayo aleatorizado que comparara los antivirales de acción directa con placebo u otras intervenciones para la infección aguda por el HCV. Hay dudas significativas en cuanto a los efectos beneficiosos y perjudiciales de las intervenciones, y se necesitan ensayos clínicos aleatorizados de alta calidad.
PICO
Resumen en términos sencillos
Tratamiento médico de la infección aguda por el virus de la hepatitis C
Antecedentes
El virus de la hepatitis C (HCV) es un virus que afecta al hígado. En general es transmitido por el abuso de drogas inyectables, la transfusión de sangre infectada, las prácticas de tatuaje no higiénicas, el contacto con sangre infectada por el HCV y las relaciones sexuales sin protección. La infección aguda por el HCV es el período que cubre el plazo de seis meses de infección. Aunque en algunos pacientes el virus se elimina después de la infección aguda por el HCV, en otros el virus permanece. Esta afección se denomina infección crónica por el HCV y puede causar problemas de salud importantes como cansancio excesivo e insuficiencia hepática que da lugar a vómitos de sangre, confusión y la muerte. En términos generales, hay 160 000 000 de personas en todo el mundo (2% a 3% de la población del mundo) que presentan infección crónica por el HCV. Se han utilizado varios tratamientos médicos para la infección aguda por el HCV. No se conoce la mejor forma para tratar la infección aguda por el HCV. Se intentó resolver este problema mediante la búsqueda de los estudios existentes sobre el tema. Se incluyeron todos los ensayos clínicos aleatorizados (estudios clínicos en que los participantes son asignados al azar a uno de dos o más grupos de tratamiento) cuyos resultados se presentaron hasta abril de 2016. Se incluyeron sólo los ensayos en los cuales los participantes no habían sido sometidos al trasplante hepático de forma previa y en los que los mismos no tenían enfermedades hepáticas debido a otras infecciones virales. Además de usar los métodos Cochrane estándar que permiten la comparación de sólo dos intervenciones a la vez (comparación directa), se planificó el uso de un método avanzado que permite la comparación de las muchas intervenciones diferentes de forma individual comparadas en los ensayos (metanálisis en red). Sin embargo, debido a la naturaleza de la información disponible, no fue posible determinar si los resultados del metanálisis de redes eran confiables. Por lo tanto, se utilizó la metodología Cochrane estándar.
Características de los estudios
Se identificaron 10 ensayos clínicos aleatorizados que fueron elegibles para la revisión. Nueve ensayos clínicos aleatorizados (467 participantes) proporcionaron información para una o más medidas (resultados). Las intervenciones principales comparadas incluyeron diferentes formas de interferón (proteína secretada en respuesta a la infección viral), a saber, interferón alfa solo, interferón beta solo, interferón alfa pegilado solo, interferón alfa pegilado más ribavirina (otro fármaco antiviral), una vacuna llamada MTH‐68/B fabricada a partir de un virus diferente, versus ninguna intervención. Ninguno de los ensayos comparó los antivirales de acción directa (la última opción para tratar la infección por el HCV) versus placebo u otras intervenciones. El período de seguimiento promedio en los ensayos varió de seis meses a tres años.
Fuente de financiación
Cuatro de los 10 ensayos (40%) recibieron ayuda económica o de otro tipo de las empresas farmacéuticas que se beneficiarían de los resultados de la investigación; la fuente de financiación no estaba disponible en cinco ensayos (50%), y un ensayo (10%) fue financiado por un hospital.
Calidad de la evidencia
Todos los ensayos estuvieron en alto riesgo de sesgo, y la calidad general de la evidencia fue muy baja. Este hecho significa que existe la posibilidad de establecer conclusiones equivocadas que sobrestimen los beneficios o que subestimen los efectos perjudiciales de una u otra intervención debido a la forma en que se realizaron los ensayos.
Resultados clave
No se produjeron muertes en ningún grupo de ningún ensayo en menos de un año después del tratamiento, excepto en un ensayo en el que un participante murió en el grupo de interferón alfa pegilado más ribavirina (1/95: 1.1%). En los ensayos en los cuales se realizó el seguimiento de los participantes más allá de un año, no hubo muertes adicionales. El número de complicaciones graves fue mayor con interferón alfa pegilado más ribavirina que con interferón alfa pegilado. El porcentaje de pacientes con complicaciones fue mayor con interferón alfa e interferón beta que con ninguna intervención. Ninguno de los ensayos informó la calidad de vida relacionada con la salud, el trasplante hepático, la insuficiencia hepática, el daño hepático grave ni el cáncer de hígado. El porcentaje de pacientes en los que se observó la presencia del virus en la sangre seis meses después del final del tratamiento fue inferior en el grupo de interferón alfa que en el de ninguna intervención. No hubo evidencia de diferencias entre los grupos para todas las comparaciones restantes. Hay dudas significativas acerca del tamaño y la dirección de los resultados y se necesitan ensayos clínicos aleatorizados de alta calidad.
Authors' conclusions
Summary of findings
| Intervention versus no intervention or control intervention (control) for acute hepatitis C infection: primary outcomes | |||||
| Patient or population: people with acute hepatitis C infection Intervention: multiple Control: multiple Settings: secondary or tertiary care | |||||
| Outcomes | Illustrative comparative risks* (95% CI) | Relative effect | No of participants | Quality of the evidence | |
| Assumed risk | Corresponding risk | ||||
| Control | Intervention | ||||
| Mortality: there was 1 mortality within 6 months (in the pegylated interferon‐alpha group (1/95 = 1.1%). There was no mortality in the remaining groups. There was no further mortality in the trials which reported mortality until maximal follow‐up. | |||||
| Serious adverse events: there were no serious adverse events in either group in the comparisons interferon‐beta versus control and MH‐68/B vaccine versus control. Trials in interferon‐alpha versus control did not report serious adverse events. | |||||
| Serious adverse events (proportion) ‐ pegylated interferon‐alpha plus ribavirin versus pegylated interferon‐alpha | 70 per 1000 | 115 per 1000 | OR 1.72 | 237 | ⊕⊝⊝⊝ |
| Serious adverse events (number) ‐ pegylated interferon‐alpha plus ribavirin versus pegylated interferon‐alpha | 92 per 1000 | 251 per 1000 | Rate ratio 2.74 | 237 | ⊕⊝⊝⊝ |
| Adverse events (proportion) ‐ interferon‐alpha versus no intervention | 10 per 1000 | 672 per 1000 | OR 203 | 33 | ⊕⊝⊝⊝ |
| Adverse events (proportion) ‐ interferon‐beta versus no intervention | 10 per 1000 | 220 per 1000 | OR 27.88 | 40 | ⊕⊝⊝⊝ |
| Adverse events: there were no adverse events in the comparison MTH‐68/B vaccine versus control. The number of adverse events was not reported for the comparison interferon‐alpha versus control. The proportion of people with adverse events and number of adverse events was not reported for the comparison pegylated interferon‐alpha plus ribavirin versus pegylated interferon‐alpha. | |||||
| Adverse events (number) ‐ interferon‐beta versus no intervention | 10 per 1000 | 147 per 1000 | OR 17 | 40 | ⊕⊝⊝⊝ |
| Health‐related quality of life | None of the trials reported this outcome. | ||||
| None of the trials reported health‐related quality of life, cirrhosis, decompensated liver disease, liver transplantation, or hepatocellular carcinoma. | |||||
| *The basis for the assumed risk is the mean control group proportion (or control group rate) unless there were no events in the control group when the control group proportion (or control group rate) was considered as 1%. The corresponding risk (and its 95% confidence interval) is based on the assumed risk in the comparison group and the relative effect of the intervention (and its 95% CI). CI: confidence interval; OR: odds ratio; RCT: randomised clinical trial. | |||||
| GRADE Working Group grades of evidence | |||||
| 1 Downgraded 2 levels for high risk of bias. | |||||
| Intervention versus no intervention or control intervention (control) for acute hepatitis C infection: secondary outcomes | |||||
| Patient or population: people with acute hepatitis C infection Intervention: multiple (see below) Control: multiple (see below) Settings: secondary or tertiary care | |||||
| Outcomes | Illustrative comparative risks* (95% CI) | Relative effect | No of participants | Quality of the evidence | |
| Assumed risk | Corresponding risk | ||||
| Control | Intervention | ||||
| Liver transplantation | None of the trials reported this outcome. | ||||
| Decompensated liver disease | None of the trials reported this outcome. | ||||
| Cirrhosis | None of the trials reported this outcome. | ||||
| Hepatocellular carcinoma | None of the trials reported this outcome. | ||||
| Chronic HCV infection†‐ interferon‐alpha versus no intervention | 848 per 1000 | 601 per 1000 | OR 0.27 | 99 | ⊕⊝⊝⊝ |
| Chronic HCV infection†‐ interferon‐beta versus no intervention | 833 per 1000 | 259 per 1000 | OR 0.07 | 90 | ⊕⊝⊝⊝ |
| Chronic HCV infection†‐ MTH‐68/B vaccine versus no intervention | 263 per 1000 | 91 per 1000 | OR 0.28 | 41 | ⊕⊝⊝⊝ |
| Chronic HCV infection†‐ pegylated interferon‐alpha plus ribavirin versus pegylated interferon‐alpha | 204 per 1000 | 181 per 1000 | OR 0.86 | 237 | ⊕⊝⊝⊝ |
| *The basis for the assumed risk is the mean control group proportion. The corresponding risk (and its 95% confidence interval) is based on the assumed risk in the comparison group and the relative effect of the intervention (and its 95% CI). †Chronic HCV infection was measured by absence of sustained virological response (i.e. the presence of circulating virus at least 6 months after cessation of treatment). CI: confidence interval; HCV: hepatitis C virus; OR: odds ratio; RCT: randomised clinical trial. | |||||
| GRADE Working Group grades of evidence | |||||
| 1 Downgraded 2 levels for high risk of bias (i.e. within study risk of bias). | |||||
Background
Description of the condition
Hepatitis C virus (HCV) is a single‐stranded RNA (ribonucleic acid) virus that has the potential to cause inflammation of the liver (NCBI 2014a). There is some variation in the RNA sequence of HCV and currently, seven genotypes (genotypes 1 to 7) are recognised (Smith 2014). The major mode of transmission of HCV is by parenteral routes, which includes parenteral drug abuse, transfusion of infected blood, unhygienic tattooing practices, and occupational exposure to the blood of HCV‐infected people (Beltrami 2000; Xia 2008; Kleinman 2009; Jafari 2010; Loomba 2011; Bunchorntavakul 2015). The other modes of transmission include sexual intercourse with infected people and perinatal transmission from mother to child (Syriopoulou 2005; Tohme 2010). Acute HCV infection is defined in different ways (Hajarizadeh 2012). The traditional definition of acute HCV infection is the first six months following exposure to viral infection (Grebely 2011). However, as most people are asymptomatic after acute HCV infection (Kamal 2008; Grebely 2011), it is difficult to identify the exact duration of infection (Hajarizadeh 2012). The absence of the HCV antibody and subsequent seroconversion (presence of HCV antibody in a person who was previously negative for HCV antibody) is the most common definition used in studies related to acute HCV infection (Hajarizadeh 2012). Other criteria that have been used to assess treatment effects include alanine transaminase elevation and HCV RNA detection (Hajarizadeh 2012). Presence of HCV RNA in the absence of HCV antibody in the serum and subsequent seroconversion accurately diagnoses very recent acute HCV infection, but it is uncommon in clinical practice (Hajarizadeh 2012). While HCV RNA can be detected in the circulation about one to two weeks after exposure to infection, seroconversion may be evident only two to six months after the exposure to infection (Kamal 2008).
Approximately 10% to 30% of people with acute HCV develop symptoms (Kamal 2008; Maheshwari 2008). The symptoms and signs related to acute HCV infection include jaundice, fatigue, muscle pain, influenza‐like illness, low‐grade fever, nausea, vomiting, and right upper abdominal pain (Kamal 2008; Maheshwari 2008). Acute HCV is rarely fulminant (Kamal 2008; Maheshwari 2008). Symptoms usually occur within six to eight weeks after exposure and last for about three to 12 weeks (Kamal 2008). Approximately 40% to 95% of people with acute HCV infection develop chronic HCV infection, that is, have persistent HCV RNA in their blood (Lehmann 2004; Wawrzynowicz‐Syczewska 2004; Kamal 2008; Maheshwari 2008; Beinhardt 2012; Bunchorntavakul 2015), depending upon the genotype of the HCV (Lehmann 2004). Various factors that can predict the development of chronic HCV infection have been proposed but none are sufficiently reliable to guide management (Maheshwari 2008; EASL 2014). Presence of jaundice, HCV genotypes 1 and 3, favourable interleukin‐28B genotype, female sex, being white by ethnic origin, having a low peak viral load, and having a rapid decline in viral load within the first four weeks of diagnosis are all associated with spontaneous clearance of the HCV infection (Maheshwari 2008; Grebely 2014). However, being of Afro‐Caribbean ethnic origin and having a coexistent HIV infection is associated with increased risk of chronic HCV infection (Maheshwari 2008).
Chronic HCV infection is a slowly progressive disease. Approximately 1% to 39% of people who develop chronic HCV infection develop liver cirrhosis (advanced liver fibrosis) after a period of seven to 30 years due to damage to the liver by HCV (Poynard 1997; Kenny‐Walsh 1999; Rodger 2000; Wiese 2005; Seeff 2009). Cirrhosis has two phases, an asymptomatic 'compensated cirrhosis' phase and a 'decompensated cirrhosis' phase, characterised by clinical symptoms such as upper gastrointestinal bleeding from varices, ascites, encephalopathy, jaundice, or renal failure (D'Amico 2006). Liver‐related complications such as cirrhosis, hepatocellular carcinoma, decompensated liver disease, and mortality usually occur 15 to 20 years after the initial infection in a proportion of people (Wiese 2005). Every year, 1% to 4% of people referred to the hospital with HCV‐related cirrhosis die (4%); develop liver failure manifested as ascites (3%); or develop jaundice (2%), gastrointestinal bleeding (1%), or hepatocellular carcinoma (4%) (Sangiovanni 2006). The median survival after compensated liver disease is more than 10 years while that of decompensated liver disease is less than two years (D'Amico 2006). The only definitive treatment for decompensated liver cirrhosis is liver transplantation. The median survival after liver transplantation for chronic HCV infection is between six and eight years (Uemura 2012; Singal 2013). There is also improvement in the quality of life of people with chronic liver disease after liver transplantation (Yang 2014). In 2010, an estimated 160 million people worldwide (2% to 3% of the world's population) had chronic HCV infection (Lavanchy 2011). There is a global variation in the prevalence of chronic HCV infection with highest prevalence in Africa and the Eastern Mediterranean region (Global Burden of Hepatitis C Working Group 2004). In 2010, on average, approximately USD 400 were spent on each person each year with chronic HCV infection without complications (El Khoury 2012). Once people develop complications, the healthcare costs increase exponentially. The annual healthcare costs associated with compensated HCV cirrhosis are USD 1080 per person; annual healthcare costs associated with decompensated HCV cirrhosis are USD 17,070 per person; and annual healthcare costs associated with liver transplantation associated with HCV cirrhosis are USD 146,960 per person (El Khoury 2012).
Description of the intervention
Various drugs such as interferon, direct‐acting antivirals (ribavirin; protease inhibitors such as telaprevir), or a combination of these have been used with the aim of eradicating acute HCV infection, thereby preventing progression to chronic HCV infection and subsequent complications related to chronic HCV infection (Maheshwari 2008; Grebely 2011; Fierer 2014). Interferons are proteins secreted by cells in response to a wide range of inducers that confer resistance against viruses and cancer cells (NCBI 2014b). The major types of interferon include interferon‐alpha, interferon‐beta, interferon‐omega, interferon‐lambda, and interferon‐gamma (Feld 2005; NCBI 2014b). Interferon‐alpha is the most common interferon used to treat acute HCV infection (Myers 2001; Maheshwari 2008; Grebely 2011), and interferon‐beta has also been evaluated (Myers 2001). Interferon is usually manufactured by recombinant technology where a sequence of human DNA is combined with the DNA of bacteria such as Escherichia coli so that large‐scale quantities of interferon are produced by Escherichia coli (Anonymous 1981). A variation of interferon‐alpha is pegylated interferon‐alpha where the structure of interferon is modified to make it long acting (Bailon 2001). Interferon‐alpha is usually administered by subcutaneous or intramuscular injections (Martindale 2011). Ribavirin is a guanosine analogue (Feld 2005). It is usually administered orally (Martindale 2011). Telaprevir, boceprevir, danoprevir, and ABT‐450 are called direct‐acting antiviral agents as they inhibit viral proteins (Lewis 2012; Welsch 2012; Poordad 2014). Of these, telaprevir and boceprevir are first‐generation direct‐acting antiviral agents as these were the first direct‐acting antiviral agents licensed for use in chronic HCV infections (Lewis 2012). The remaining antiviral agents are second‐generation direct‐acting antiviral agents (Lewis 2012). The direct‐acting antiviral agents are usually administered orally (Martindale 2011). It should be noted that these treatments have significant complications including mortality, severe infections, severe liver decompensation, refractory anaemia, neutropenia, thrombocytopenia, and neuropsychiatric disorders (homicidal and suicidal ideation) with different treatments having different safety profiles (Martindale 2011; Perry 2012; Furusyo 2013; Hezode 2013; Coilly 2014).
How the intervention might work
Interferon is one of the natural defence mechanisms of the body against viruses (Feld 2005; NCBI 2014b). Interferons induce interferon‐stimulated genes, which creates an antiviral state within the cells (Feld 2005). Ribavirin may act by inhibiting the HCV RNA polymerase (which plays a significant role in viral replication), inducing mutations in the virus and making them less infective, and by modifying the immune response (immunomodulation), which promotes clearance of virus from cells (Feld 2005). Direct‐acting antiviral agents inhibit viral proteins involved in the HCV life cycle and so inhibit replication of the virus (Welsch 2012).
Why it is important to do this review
There is significant controversy as to whether any intervention is beneficial in acute HCV infection. Currently, the European Association for the Study of the Liver (EASL) and the American Association for the Study of Liver Diseases (AASLD) have no recommendations for treatment directed at acute HCV infection (AASLD 2014; EASL 2014). However, some investigators recommend pegylated interferon for people with acute HCV infection, usually started three months after diagnosis after repeat serum testing to allow three months for spontaneous resolution (Maheshwari 2008; Grebely 2011). Thus, the treatment of acute HCV is controversial. In addition, several treatment combinations are available for the treatment of acute HCV infection, and the relative ranking of different treatments in terms of clinical effectiveness and harms is unknown.
Network meta‐analysis allows combination of the direct evidence and indirect evidence, and allows ranking of different treatments in terms of the different outcomes (Salanti 2011; Salanti 2012). There has been no network meta‐analysis on this topic although there has been one head‐to‐head comparison Cochrane systematic review comparing interferon versus placebo or no intervention in people with acute HCV infection (Myers 2001). The present systematic review and attempted network meta‐analysis intended to provide the best level of evidence for the role of different pharmacological interventions in the treatment of people with acute HCV infection.
Objectives
To assess the comparative benefits and harms of different pharmacological interventions in the treatment of acute HCV infection through a network meta‐analysis and to generate rankings of the available pharmacological treatments according to their safety and efficacy. However, it was not possible to assess whether the potential effect modifiers were similar across different comparisons. Therefore, we did not perform the network meta‐analysis, and instead, we assessed the comparative benefits and harms of different interventions versus each other or versus no intervention using standard Cochrane methodology.
When more trials become available with adequate description of potential effect modifiers, we will attempt to conduct network meta‐analysis to generate rankings of the available treatments according to their safety and efficacy. This is why we have retained the planned methodology for network meta‐analysis in our Appendix 1. Once data appear allowing for the conduct of network meta‐analysis, this Appendix 1 will be moved back into the Methods section.
Methods
Criteria for considering studies for this review
Types of studies
We considered only randomised clinical trials for the meta‐analysis irrespective of language, publication status, or date of publication. We excluded studies of other design because of the risk of bias in such studies. We are all aware that such exclusions make us focus much more on potential benefits and not fully assess the risks of serious adverse events as well as risks of adverse events.
Types of participants
We included randomised clinical trials with participants with acute HCV infection (absence of HCV antibody and subsequent seroconversion (presence of HCV antibody in a person who was previously negative for HCV antibody or less than six months of HCV infection)), irrespective of the method of diagnosis of seroconversion or HCV genotype. We excluded randomised clinical trials in which participants had undergone liver transplantation previously. We also excluded randomised clinical trials in which participants had other coexisting viral diseases such as HIV or hepatitis B virus coinfections.
Types of interventions
We included any of the following pharmacological interventions that are possible treatments for acute HCV infection, either alone or in combination and could be compared versus each other or versus placebo or no intervention.
The interventions that we considered a priori were:
-
interferon‐alpha;
-
pegylated interferon‐alpha;
-
interferon‐beta;
-
ribavirin;
-
first‐generation direct‐acting antiviral agents (boceprevir and telaprevir);
-
second‐generation direct‐acting antiviral agents (other direct‐acting antiviral agents).
The above list of interventions was not an exhaustive list. If we identified any other pharmacological interventions that we were not aware of (e.g. we included MTH‐68/B), we considered them eligible and included them in the review if they were used primarily for the treatment of acute HCV infection.
Types of outcome measures
We planned to assess the comparative benefits and harms of available pharmacological interventions aimed at treating people with acute HCV infection for the following outcomes.
Primary outcomes
-
Mortality at maximal follow‐up (time to death).
-
Mortality:
-
short‐term mortality (up to one year);
-
medium‐term mortality (one to five years).
-
-
Adverse events (within three months of cessation of treatment). We extracted adverse events and serious adverse events as reported in the studies. In general, we defined a non‐serious adverse event as any untoward medical occurrence not necessarily having a causal relationship with the treatment but resulting in a dose reduction or discontinuation of treatment (any time after commencement of treatment) (ICH‐GCP 1997), and defined a serious adverse event as any event that would increase mortality; was life threatening; required hospitalisation; resulted in persistent or significant disability; was a congenital anomaly/birth defect; or any important medical event that might jeopardise the person or require intervention to prevent it.
-
Proportion of participants with serious adverse events.
-
Number of serious adverse events.
-
Proportion of participants with any type of adverse event.
-
Number of any type of adverse event.
-
-
Health‐related quality of life as defined in the included trials using a validated scale such as EQ‐5D or 36‐item Short Form (SF‐36) (EuroQol 2014; Ware 2014):
-
short‐term (up to one year);
-
medium‐term (one to five years);
-
long‐term (beyond five years).
-
We planned to consider short‐term quality of life to be more important than medium‐term or long‐term quality of life, although medium‐term and long‐term quality of life are also important primary outcomes.
Secondary outcomes
-
Liver transplantation (maximal follow‐up):
-
proportion of participants with liver transplantation;
-
time to liver transplantation.
-
-
Decompensated liver disease (presence of one or more of bleeding varices, ascites, encephalopathy, jaundice) (maximal follow‐up):
-
proportion of participants with decompensated liver disease;
-
time to liver decompensation.
-
-
Cirrhosis (scarring of the liver caused by continuous, long‐term liver damage or stage IV fibrosis) (maximal follow‐up):
-
proportion of participants with cirrhosis;
-
time to cirrhosis.
-
-
Proportion of participants with hepatocellular carcinoma (maximal follow‐up).
-
Proportion of participants with chronic HCV infection (however defined by trial authors).
Search methods for identification of studies
Electronic searches
We searched the Cochrane Central Register of Controlled Trials (CENTRAL), MEDLINE, Embase, and Science Citation Index Expanded (which includes Conference Proceedings) (Royle 2003) from inception to 16 April 2016 for randomised clinical trials comparing two or more of the above interventions. We searched for all possible comparisons formed by the interventions of interest. To identify further ongoing or completed trials, we also searched the World Health Organization International Clinical Trials Registry Platform Search Portal (apps.who.int/trialsearch/), which searches various trial registers, including ISRCTN and ClinicalTrials.gov on 16 April 2016. Appendix 2 shows the search strategies we used.
Searching other resources
We searched the references of the identified trials and the existing Cochrane Reviews on acute HCV infection to identify additional trials for inclusion.
Data collection and analysis
Selection of studies
Two review authors (MK and EB) independently identified the trials for inclusion by screening the titles and abstracts. We sought full‐text articles for any references that at least one of the review authors identified for potential inclusion. We selected the trials for inclusion based on the full‐text articles. We planned to list the excluded full‐text references with reasons for their exclusion in the Characteristics of excluded studies table. We also planned to list any ongoing trials identified primarily through the search of the clinical trial registers for further follow‐up. We resolved discrepancies through discussion and by arbitration with KG, DT, and ET.
Data extraction and management
Two review authors (MK and EB) independently extracted the following data.
-
Outcome data (for each outcome and for each treatment arm whenever applicable):
-
number of participants randomised;
-
number of participants included for the analysis;
-
number of participants with events for binary outcomes, mean and standard deviation for continuous outcomes, number of events for count outcomes, and the number of participants with events and the mean follow‐up period for time‐to‐event outcomes;
-
definition of outcomes or scale used if appropriate.
-
-
Data on potential effect modifiers:
-
participant characteristics such as age, sex, comorbidities, proportion of participants with different HCV genotypes, and severity of acute HCV infection, however defined by trial authors;
-
details of the intervention and control (including dose, frequency, and duration);
-
risk of bias (assessment of risk of bias in included studies).
-
-
Other data:
-
year and language of publication;
-
country in which the participants were recruited;
-
year(s) in which the trial was conducted;
-
inclusion and exclusion criteria;
-
follow‐up time points of the outcome.
-
If available, we planned to obtain the data separately for different genotypes from the report. We sought unclear or missing information by attempting to contact the trial authors. If there was any doubt whether trials shared the same participants, completely or partially (by identifying common authors and centres), we planned to contact the trial authors to clarify whether the trial report was duplicated. We resolved any differences in opinion through discussion.
Assessment of risk of bias in included studies
We followed the guidance given in the Cochrane Handbook for Systematic Reviews of Interventions (Higgins 2011) and in the Cochrane Hepato‐Biliary Module (Gluud 2015) to assess the risk of bias in included studies. Specifically, we assessed the risk of bias in included trials for the following domains, using the methods below (Schulz 1995; Moher 1998; Kjaergard 2001; Wood 2008; Savović 2012a; Savović 2012b; Lundh 2017).
Allocation sequence generation
-
Low risk of bias: the study authors performed sequence generation using computer random number generation or a random number table. Drawing lots, tossing a coin, shuffling cards, and throwing dice were adequate if an independent person not otherwise involved in the study performed them.
-
Unclear risk of bias: the study authors did not specify the method of sequence generation.
-
High risk of bias: the sequence generation method was not random.
Allocation concealment
-
Low risk of bias: the participant allocations could not have been foreseen in advance of, or during, enrolment. Allocation was controlled by a central and independent randomisation unit. The investigators were unaware of the allocation sequence (e.g. if the allocation sequence was hidden in sequentially numbered, opaque, and sealed envelopes).
-
Unclear risk of bias: the study authors did not describe the method used to conceal the allocation so the intervention allocations may have been foreseen before, or during, enrolment.
-
High risk of bias: it is likely that the investigators who assigned the participants knew the allocation sequence.
Blinding of participants and personnel
-
Low risk of bias: any of the following: no blinding or incomplete blinding, but we judged that the outcome was not likely to be influenced by lack of blinding; or blinding of participants and key study personnel ensured, and it was unlikely that the blinding could have been broken.
-
Unclear risk of bias: any of the following: insufficient information to permit judgement of 'low risk' or 'high risk'; or the trial did not address this outcome.
-
High risk of bias: any of the following: no blinding or incomplete blinding, and the outcome was likely to be influenced by lack of blinding; or blinding of key study participants and personnel attempted, but likely that the blinding could have been broken, and the outcome was likely to be influenced by lack of blinding.
Blinding of outcome assessors
-
Low risk of bias: any of the following: no blinding of outcome assessment, but we judged that the outcome measurement was not likely to be influenced by lack of blinding; or blinding of outcome assessment ensured, and unlikely that the blinding could have been broken.
-
Unclear risk of bias: any of the following: insufficient information to permit judgement of 'low risk' or 'high risk'; or the trial did not address this outcome.
-
High risk of bias: any of the following: no blinding of outcome assessment, and the outcome measurement was likely to be influenced by lack of blinding; or blinding of outcome assessment, but likely that the blinding could have been broken, and the outcome measurement was likely to be influenced by lack of blinding.
Incomplete outcome data
-
Low risk of bias: missing data were unlikely to make treatment effects depart from plausible values. The study used sufficient methods, such as multiple imputation, to handle missing data.
-
Unclear risk of bias: there was insufficient information to assess whether missing data in combination with the method used to handle missing data were likely to induce bias on the results.
-
High risk of bias: the results were likely to be biased due to missing data.
Selective outcome reporting
-
Low risk of bias: the trial reported the following predefined outcomes: long‐term outcomes related to the disease process (namely, mortality or decompensated liver disease, or requirement for transplantation along with treatment‐related adverse events). If the original trial protocol was available, the outcomes should have been those called for in that protocol. If the trial protocol was obtained from a trial registry (e.g. www.clinicaltrials.gov), the outcomes sought should have been those enumerated in the original protocol if the trial protocol was registered before or at the time that the trial was begun. If the trial protocol was registered after the trial was begun, those outcomes were not considered to be reliable.
-
Unclear risk of bias: not all predefined outcomes were reported fully, or it was unclear whether data on these outcomes were recorded or not.
-
High risk of bias: one or more predefined outcomes were not reported.
For‐profit bias
-
Low risk of bias: the trial appeared to be free of industry sponsorship or other type of for‐profit support that may manipulate the trial design, conductance, or results of the trial.
-
Unclear risk of bias: the trial may or may not have been free of for‐profit bias as no information on clinical trial support or sponsorship was provided.
-
High risk of bias: the trial was sponsored by industry or received other type of for‐profit support.
Other bias
-
Low risk of bias: the trial appeared to be free of other components (e.g. inappropriate control or dose or administration of control) that could put it at risk of bias.
-
Unclear risk of bias: the trial may or may not have been free of other components that could have put it at risk of bias.
-
High risk of bias: there were other factors in the trial that could have put it at risk of bias (e.g. inappropriate control or dose or administration of control).
We considered a trial at low risk of bias if we assessed the trial as at low risk of bias across all domains. Otherwise, we considered the trials at high risk of bias regarding one or more domains as at high risk of bias.
Measures of treatment effect
For dichotomous variables (e.g. short‐term and medium‐term mortality or liver transplantation, proportion of participants with adverse events, decompensated liver disease, cirrhosis, hepatocellular carcinoma, or sustained virological response), we calculated the odds ratio (OR) with 95% confidence intervals (CI). For continuous variables (e.g. quality of life reported on the same scale), we planned to calculate the mean difference with 95% CI. We planned to use standardised mean difference values with 95% CI for quality of life if included trials used different scales. For count outcomes (e.g. number of adverse events), we calculated the rate ratio with 95% CI. For time‐to‐event data (e.g. mortality at maximal follow‐up or requirement for liver transplantation, time to liver decompensation, and time to cirrhosis), we planned to use the hazard ratio (HR) with 95% CIs. We also calculated Trial Sequential Analysis‐adjusted CI to control random errors (Thorlund 2011).
Unit of analysis issues
The unit of analysis was people with acute HCV infection according to the intervention group to which they were randomly assigned.
Cluster randomised clinical trials
As expected, we found no cluster randomised clinical trials. If we had found them, we planned to include them provided that the effect estimate adjusted for cluster correlation was available.
Cross‐over randomised clinical trials
As expected, we found no cross‐over randomised clinical trials. If we had identified any, we planned to only include the outcomes after the period of first treatment because acute HCV infection may resolve before the cross‐over period.
Trials with multiple intervention groups
We collected data for all trial intervention groups that met the inclusion criteria.
Dealing with missing data
We performed an intention‐to‐treat analysis whenever possible (Newell 1992). Otherwise, we used the data that were available to us (e.g. a trial might have reported only per‐protocol analysis results). As such 'per‐protocol' analyses may be biased, we planned to conduct best‐worst case scenario analyses (good outcome in intervention group and bad outcome in control group) and worst‐best case scenario analyses (bad outcome in intervention group and good outcome in control group) as sensitivity analyses whenever possible but because of lack of the required information for such analyses, we did not perform them.
For continuous outcomes, we planned to impute the standard deviation from P values according to guidance given in the Cochrane Handbook for Systematic Reviews of Interventions (Higgins 2011). If the data were likely to be normally distributed, we planned to use the median for meta‐analysis when the mean was not available. If it was not possible to calculate the standard deviation from the P value or the CIs, we planned to impute the standard deviation using the largest standard deviation in other trials for that outcome. This form of imputation may decrease the weight of the study for calculation of mean differences and may bias the effect estimate to no effect for calculation of standardised mean differences (Higgins 2011).
Assessment of heterogeneity
We assessed clinical and methodological heterogeneity by carefully examining the characteristics and design of included trials. We planned to assess the presence of clinical heterogeneity by comparing effect estimates in the different HCV genotypes and the different regimens (e.g. different agents, different doses, and different durations) of the pharmacological treatments. Different study designs and risk of bias may contribute to methodological heterogeneity. We used the I2 test and Chi2 test for heterogeneity, and overlapping of CIs to assess heterogeneity.
Assessment of reporting biases
We planned to use visual asymmetry on a funnel plot to explore reporting bias in the presence of at least 10 trials that could be included for a direct comparison (Egger 1997; Macaskill 2001). In the presence of heterogeneity that could be explained by subgroup analysis, we planned to produce a funnel plot for each subgroup in the presence of an adequate number of trials. We planned to use the linear regression approach described by Egger 1997 to determine funnel plot asymmetry.
We also considered selective reporting as evidence of reporting bias.
Data synthesis
We performed the meta‐analyses according to Cochrane recommendations (Higgins 2011), using the software package Review Manager 5 (RevMan 2014). We used a random‐effects model (DerSimonian 1986) and a fixed‐effect model (Demets 1987). In the case of a discrepancy between the two models, we have reported both results; otherwise, we reported only the results from the fixed‐effect model.
Calculation of required information size and Trial Sequential Analysis
For calculation of the required information size, see Appendix 3. We performed Trial Sequential Analysis to control the risks of random errors when there were at least two trials included in the meta‐analysis (Wetterslev 2008; Thorlund 2011; TSA 2011). We used an alpha error as per guidance of Jakobsen 2014, power of 90% (beta error of 10%), a relative risk reduction of 20%, a control group proportion observed in the trials, and the diversity observed in the meta‐analysis.
Subgroup analysis and investigation of heterogeneity
We planned to assess the differences in the effect estimates between the following subgroups.
-
Trials with low risk of bias compared to trials with high risk of bias.
-
Different HCV genotypes.
-
Different regimens of pharmacological treatments. For example, boceprevir compared to telaprevir, different doses, and different durations.
However, we could not conduct these subgroup analyses.
We planned to use the Chi2 test for subgroup differences to identify subgroup differences.
Sensitivity analysis
If a trial reported only per‐protocol analysis results, we planned to re‐analyse the results using the best‐worst case scenario and worst‐best case scenario analyses as sensitivity analyses whenever possible. However, we did not perform these analyses because of insufficient information in the trials.
Presentation of results and GRADE assessments
We reported all outcomes in a 'Summary of findings' table format, downgrading the quality of evidence for risk of bias, inconsistency, indirectness, imprecision, and publication bias using GRADE (Guyatt 2011).
Results
Description of studies
Results of the search
We identified 2803 references through electronic searches of CENTRAL (n = 257), MEDLINE (n = 1681), Embase (n = 323), Science Citation Index Expanded (n = 514), World Health Organization International Clinical Trials Registry Platform (n = 8), and randomised controlled trials registers (n = 20). After the removal of 720 duplicates, we obtained 2083 references. We then excluded 2070 clearly irrelevant references through screening titles and reading abstracts. We retrieved 13 references for further assessment. No references were identified through scanning reference lists of the identified randomised trials. We included all 13 references (10 trials) that met the inclusion criteria (Omata 1991; Genesca 1993; Hwang 1994; Lampertico 1994; Omata 1994; Calleri 1998; Csatary 1998; Wang 2005; Deterding 2013; Santantonio 2014). The reference flow is summarised in the study flow diagram (Figure 1).

Study flow diagram.
Included studies
The 10 randomised clinical trials included 488 participants (Omata 1991; Genesca 1993; Hwang 1994; Lampertico 1994; Omata 1994; Calleri 1998; Csatary 1998; Wang 2005; Deterding 2013; Santantonio 2014). Nine trials (467 participants) provided information for one or more outcomes (Omata 1991; Genesca 1993; Hwang 1994; Lampertico 1994; Omata 1994; Calleri 1998; Csatary 1998; Deterding 2013; Santantonio 2014). One trial was a three‐armed trial which compared two different doses of pegylated interferon versus pegylated interferon plus ribavirin (Santantonio 2014). The remaining nine trials were two‐armed trials (Omata 1991; Genesca 1993; Hwang 1994; Lampertico 1994; Omata 1994; Calleri 1998; Csatary 1998; Wang 2005; Deterding 2013). Table 1 summarises the details of the intervention, control, the period of follow‐up, and the risk of bias in the trials arranged according to intervention and control. Three trials (99 participants) compared interferon‐alpha versus no intervention (Genesca 1993; Hwang 1994; Lampertico 1994). Three trials (90 participants) compared interferon‐beta versus no intervention (Omata 1991; Omata 1994; Calleri 1998). One trial (41 participants) compared MTH‐68/B vaccine versus no intervention (Csatary 1998). One trial (21 participants) compared pegylated interferon‐alpha versus no intervention, but it did not provide any data for the analysis (Wang 2005). Two trials (237 participants) compared pegylated interferon‐alpha versus pegylated interferon‐alpha plus ribavirin (Deterding 2013; Santantonio 2014). None of the trials compared direct‐acting antivirals versus other interventions. The mean or median follow‐up period in the trials ranged from six to 36 months.
| Study name | Intervention | Control | Period of follow‐up (months) | Randomisation | Blinding of participants and healthcare professionals | Blinding of outcome assessors | Missing outcome bias | Selective outcome reporting bias | For‐profit bias |
| Interferon‐alpha | No intervention | 12 | Unclear | High | Unclear | Low | High | Unclear | |
| Interferon‐alpha | No intervention | 12 | Unclear | High | Unclear | High | Low | High | |
| Interferon‐alpha | No intervention | 18 | Unclear | High | Unclear | High | High | High | |
| Interferon‐beta | No intervention | 36 | Low | High | Unclear | High | High | Unclear | |
| Interferon‐beta | No intervention | 36 | Unclear | High | Unclear | Low | High | Unclear | |
| Interferon‐beta | No intervention | 22.5 | Unclear | High | High | Low | Low | Low | |
| MTH‐68/B vaccine | No intervention | 12 | Unclear | High | Unclear | Low | Low | Unclear | |
| Pegylated interferon‐alpha | No intervention | 6 | Unclear | Unclear | Unclear | High | High | Unclear | |
| Pegylated interferon‐alpha | Pegylated interferon‐alpha plus ribavirin | 6 | Unclear | High | Low | High | Low | High | |
| Pegylated interferon‐alpha | Pegylated interferon‐alpha plus ribavirin | 12 | Unclear | High | Unclear | Low | High | High |
The mean or median age in the trials that reported this information ranged from 29 to 54 years. The proportion of females in the trials that reported this information ranged from 15% to 56%. Three trials reported the proportion of participants with HCV genotype 1, which were 61.9% (Wang 2005); 68.2% (Deterding 2013); and 61.6% (Santantonio 2014). Two trials reported the proportion of participants with genotype 3, which were 16.8% (Deterding 2013); and 37,2% (Santantonio 2014). None of the trials provided information separately for the different genotypes.
Source of funding: four trials received financial or other assistance from pharmaceutical companies who would benefit from the findings of the research (Hwang 1994; Lampertico 1994; Deterding 2013; Santantonio 2014); one trial was funded by a hospital (Calleri 1998); the source of funding was not available in the remaining trials (Omata 1991; Genesca 1993; Omata 1994; Csatary 1998; Wang 2005).
Risk of bias in included studies
The risk of bias in the included trials is summarised in Figure 2 and Figure 3. The trials were at high risk of bias in one or more domains, so all trials were assessed at overall high risk of bias.
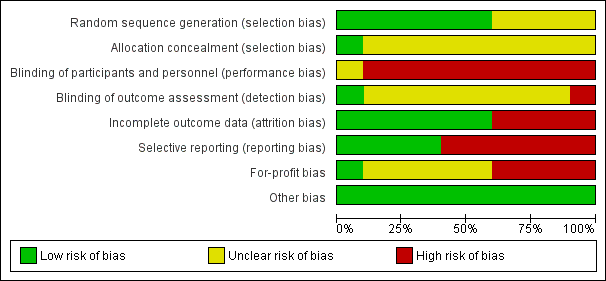
Risk of bias graph: review authors' judgements about each risk of bias item presented as percentages across all included studies.

Risk of bias summary: review authors' judgements about each risk of bias item for each included study.
Allocation
Six trials were at low risk of random sequence generation bias (Omata 1991; Hwang 1994; Lampertico 1994; Calleri 1998; Deterding 2013; Santantonio 2014). One trial was at low risk of allocation concealment bias (Omata 1991).
Blinding
None of the trials reported blinding of participants and healthcare providers. One trial was at low risk of bias due to blinding of outcome assessors (Deterding 2013).
Incomplete outcome data
Six trials were at low risk of attrition bias (Genesca 1993; Omata 1994; Calleri 1998; Csatary 1998; Deterding 2013; Santantonio 2014).
Selective reporting
Four trials were at low risk of selecting outcome reporting bias (Hwang 1994; Calleri 1998; Csatary 1998; Deterding 2013).
Other potential sources of bias
One trial was at low risk of for‐profit bias (Calleri 1998). All the trials were at low risk of other bias.
Effects of interventions
See: Summary of findings for the main comparison Intervention versus no intervention or control intervention (control) for acute hepatitis C infection: primary outcomes; Summary of findings 2 Intervention versus no intervention or control intervention (control) for acute hepatitis C infection: secondary outcomes
Mortality
Mortality at maximal follow‐up
Eight trials (337 participants) reported mortality at maximal follow‐up (Omata 1991; Genesca 1993; Hwang 1994; Lampertico 1994; Omata 1994; Calleri 1998; Csatary 1998; Deterding 2013). The period of follow‐up ranged from six to 36 months. There were no deaths reported in any of these trials.
Short‐term mortality
Nine trials reported short‐term mortality (less than one year) (Omata 1991; Genesca 1993; Hwang 1994; Lampertico 1994; Omata 1994; Calleri 1998; Csatary 1998; Deterding 2013; Santantonio 2014). There was no short‐term mortality in any group in any trial except for one trial where one participant died (Santantonio 2014). The unadjusted rates of mortality (short‐term) were 0% in all intervention groups except pegylated interferon‐alpha plus ribavirin in which the mortality was 1.1% (1/95 participants).
Medium‐term mortality
Three trials (90 participants) reported medium‐term mortality (one to five years) (Omata 1991; Omata 1994; Calleri 1998). All three trials compared interferon‐beta versus no intervention. There was no mortality in either group after a follow‐up of two to three years.
Adverse events
Proportion of people with serious adverse events
Four trials (318 participants) reported the proportion of people with serious adverse events (Calleri 1998; Csatary 1998; Deterding 2013; Santantonio 2014). In two trials (one comparing interferon‐beta versus no intervention (Calleri 1998) and one comparing MTH‐68/B vaccine versus no intervention (Csatary 1998)), there were no serious adverse events in either group. In the remaining two trials, the proportion of people with serious adverse events in the pegylated interferon‐alpha plus ribavirin group was adjusted proportion: 11.5% and in pegylated interferon‐alpha group was 10/142 (7.0%). There was no evidence of difference between pegylated interferon‐alpha plus ribavirin versus pegylated interferon‐alpha (OR 1.72, 95% CI 0.70 to 4.21; participants = 237; trials = 2; I2 = 0%; Analysis 1.1).
Number of serious adverse events
Four trials (318 participants) reported the number of people with serious adverse events (Calleri 1998; Csatary 1998; Deterding 2013; Santantonio 2014). In two trials (one comparing interferon‐beta versus no intervention (Calleri 1998) and one comparing MTH‐68/B vaccine versus no intervention (Csatary 1998)), there were no serious adverse events in either group. In the remaining two trials, the rates for number of serious adverse events in the pegylated interferon‐alpha plus ribavirin group were 25.1 per 100 participants and in the pegylated interferon‐alpha group were 9.2 per 100 participants. The number of serious adverse events was significantly higher with pegylated interferon‐alpha plus ribavirin than with pegylated interferon‐alpha interventions (rate ratio 2.74, 95% CI 1.40 to 5.33; participants = 237; trials = 2; I2 = 0%; Analysis 1.2).
Proportion of people with any type of adverse events
Three trials (114 participants) reported the proportion of people with any adverse events (Hwang 1994; Calleri 1998; Csatary 1998). There were no adverse events in people receiving MTH‐68/B vaccine versus no intervention. The proportions of people with adverse events in the interferon‐alpha group was 87.5% (14/16) and in the interferon‐beta group was 40% (8/20). Compared to the no intervention group the proportion of people with any adverse events was higher in the interferon‐alpha and the interferon‐beta group (interferon‐alpha: OR 203.00, 95% CI 9.01 to 4574.81; participants = 33; trials = 1; interferon‐beta: OR 27.88, 95% CI 1.48 to 526.12; participants = 40; trials = 1; Analysis 1.3). The difference in the proportion of people with adverse events was not estimable in the comparison between MTH‐68/B vaccine versus no intervention group as there were no adverse events in either group.
Number of any type of adverse events
Two trials (81 participants) reported number of adverse events (Calleri 1998; Csatary 1998). There were no adverse events in the MTH‐68/B vaccine or no intervention groups. There were eight adverse events reported in 20 participants in the interferon‐beta group (adverse event rate: 14.7 per 100 participants). There was no statistically significant difference in the number of adverse events between the interferon‐beta group and the no intervention group (OR 17.00, 95% CI 0.98 to 294.53; participants = 40; trials = 1; Analysis 1.4).
Health‐related quality of life
None of the trials reported health‐related quality of life at any time point.
Liver transplantation
None of the trials reported liver transplantation.
Decompensated liver disease
None of the trials reported decompensated liver disease.
Cirrhosis
None of the trials reported cirrhosis.
Proportion of participants with hepatocellular carcinoma
None of the trials reported hepatocellular carcinoma.
Proportion of participants with chronic HCV infection
Nine trials (467 participants) reported chronic HCV infection as measured by absence of sustained virological response (i.e. the presence of circulating virus at least six months after cessation of treatment) (Omata 1991; Genesca 1993; Hwang 1994; Lampertico 1994; Omata 1994; Calleri 1998; Csatary 1998; Deterding 2013; Santantonio 2014) (Analysis 1.5). The proportion of people with chronic HCV infection was lower in the interferon‐alpha and interferon‐beta groups than in the no intervention group using the fixed‐effect model (interferon‐alpha: OR 0.27, 95% CI 0.09 to 0.76; participants = 99; trials = 3; I2 = 0%; interferon‐beta: OR 0.07, 95% CI 0.00 to 1.24; participants = 90; trials = 3; I2 = 81%). Using the random‐effects model, there was no change in the results from the interferon‐alpha versus the no intervention group (OR 0.27, 95% CI 0.09 to 0.76). However, there was no evidence of a difference between the interferon‐beta versus the no intervention groups on using the random‐effects model (OR 0.07, 95% CI 0.00 to 1.24). There was no evidence of difference in the proportion of participants with chronic HCV in the comparison between the MTH‐68/B vaccine versus the no intervention groups (OR 0.28, 95% CI 0.05 to 1.65; participants = 41; trials = 1) and that between the pegylated interferon‐alpha plus ribavirin versus the pegylated interferon‐alpha groups (OR 0.86, 95% CI 0.41 to 1.79; participants = 237; trials = 2; I2 = 0%).
Subgroup analysis
We did not perform any of the subgroup analyses as none of the trials were at low risk of bias, the trials did not report the data for different genotypes separately, and because there were few trials for performing a meaningful subgroup analysis based on dosage.
Reporting bias
We did not explore reporting bias using funnel plots because of the few trials included in the review.
Trial Sequential Analysis
Four comparisons had more than one trial and were eligible for Trial Sequential Analysis. The Z‐curves did not cross the trial sequential monitoring boundaries for any of the comparisons except for chronic HCV in pegylated interferon‐alpha plus ribavirin versus pegylated interferon‐alpha, where it has reached the futility zone (Figure 4; Figure 5; Figure 6; Figure 7); when a relative risk reduction of 10% was used, the Z‐curve did not cross any of the trial sequential monitoring boundaries for chronic HCV in pegylated interferon‐alpha plus ribavirin versus pegylated interferon‐alpha as well (Figure 7). The Trial Sequential Analysis‐adjusted CIs were as follows.

Trial Sequential Analysis of serious adverse events (proportion) for pegylated interferon‐alpha plus ribavirin versus pegylated interferon‐alpha performed using an alpha error of 2.5%, power of 90% (beta error of 10%), relative risk reduction (RRR) of 20%, control group proportion observed in trials (Pc = 7%), and observed heterogeneity in the trials (0%) shows that the accrued sample size was only a small fraction of the diversity‐adjusted required information size (DARIS); so the trial sequential monitoring boundaries were not drawn. The Z‐curve (blue line) does not cross the conventional boundaries (dotted green line). There was a high risk of random errors.

Trial Sequential Analysis of chronic hepatitis C virus for interferon‐alpha versus no intervention was performed using an alpha error of 1.6%, power of 90% (beta error of 10%), relative risk reduction (RRR) of 20%, control group proportion observed in trials (Pc = 84%; upper figure) and Pc = 20% (lower figure), and observed diversity in the trials (0%). The upper figure with Pc = 84% shows that the accrued sample size was only a small fraction of the diversity‐adjusted required information size (DARIS). The Z‐curve (blue line) crosses the conventional boundaries (dotted green line), but it does not cross any of the trial sequential monitoring boundaries (dotted red lines). The lower figure with Pc = 20% shows that the accrued sample size was so small that trial sequential monitoring boundaries were not drawn. There is a high risk of random errors.

Trial Sequential Analysis of chronic hepatitis C virus for interferon‐beta versus no intervention performed using an alpha error of 1.6%, power of 90% (beta error of 10%), relative risk reduction (RRR) of 20%, control group proportion observed in the trials (Pc = 84%; upper figure) and a Pc of 20% (lower figure), and observed heterogeneity in the trials (84%) shows that the accrued sample size was only a small fraction of the diversity‐adjusted required information size (DARIS); so the trial sequential monitoring boundaries were not drawn. The Z‐curve (blue line) crosses the conventional boundaries (dotted green line). There is a high risk of random errors.
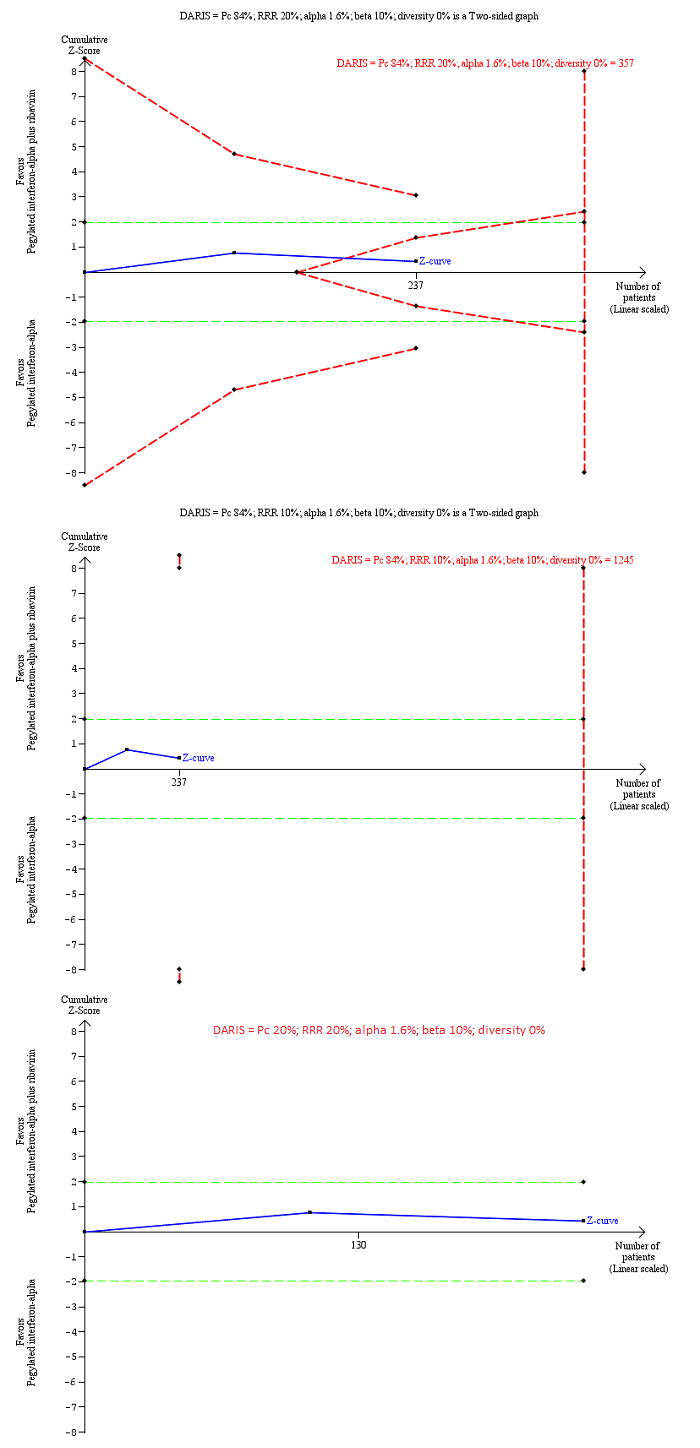
Trial Sequential Analysis of chronic hepatitis C virus infection for pegylated interferon‐alpha plus ribavirin versus pegylated interferon‐alpha performed using an alpha error of 1.6%, power of 90% (beta error of 10%), relative risk reduction (RRR) of 20% (top figure and bottom figure) and 10% (middle figure), control group proportion observed in the trials (Pc = 84%; top figure and middle figure) and Pc = 20% (bottom figure), and observed heterogeneity in the trials (0%) shows that the Z‐curve (blue line) has reached the zone of futility for a RRR of 20% (top figure). However, when a RRR of 10% or when a Pc = 20% was used, the accrued sample size was only a small fraction of the diversity adjusted required information size (DARIS); the Z‐curve (blue line) does not cross the conventional boundaries (dotted green line) or trial sequential monitoring boundaries (dotted red line) (middle figure). For a Pc = 20%, the accrued sample size was so small that the trial sequential monitoring boundaries were not drawn. There is a high risk of random errors.
-
Serious adverse events: pegylated interferon‐alpha plus ribavirin versus pegylated interferon‐alpha: could not be calculated because of too little information.
-
Chronic HCV: alpha interferon versus no intervention: 0.23 (95% CI 0.02 to 2.19).
-
Chronic HCV: alpha interferon versus no intervention: could not be calculated because of too little information.
-
Chronic HCV: pegylated interferon‐alpha plus ribavirin versus pegylated interferon‐alpha: 0.85 (95% CI 0.31 to 2.34) and relative risk reduction of 10%: 0.85% (95% CI 0.04 to 17.00).
In addition, as a post hoc sensitivity analysis, we used a control group proportion of 20% because the control group proportion observed in the trials was higher than the expected proportion of progression of acute HCV to chronic HCV. This revealed that the accrued sample was so small that none of the trial sequential monitoring boundaries were drawn.
Quality of evidence
None of the trials was at low risk of bias in all the domains. As a result, the quality of evidence was downgraded two levels for risk of bias in the trials in all the comparisons. In addition, the quality of evidence was downgraded one level for imprecision because of the small sample size for all the comparisons. The quality of evidence was downgraded by one more level for imprecision because of wide CIs for all comparisons and one more level for inconsistency because of substantial heterogeneity in magnitude of effect for some comparisons. Overall, the quality of evidence was very low for all comparisons (summary of findings Table for the main comparison; summary of findings Table 2).
Discussion
Summary of main results
A total of 488 participants in 10 trials were included in this review. A total of 467 participants in nine trials contributed to one or more outcomes. A total of six interventions were evaluated in the nine trials that contributed with analysis data to the review. The interventions included interferon‐alpha, interferon‐beta, MTH‐68/B vaccine, pegylated interferon‐alpha, pegylated interferon‐alpha plus ribavirin, all versus no intervention in the control groups (except pegylated interferon‐alpha plus ribavirin, which was compared with pegylated interferon‐alpha). None of the trials compared direct‐acting antivirals versus placebo or other interventions.
Overall, the mortality at six months to one year following treatment in people with acute HCV infection was very low. Only one of the participants died during this period. There was no evidence of differences in proportion of people with serious adverse events or number of serious adverse events in any of the comparisons. However, it should be noted that 7.0% of the people receiving pegylated interferon‐alpha and 11.5% of the people receiving pegylated interferon‐alpha plus ribavirin developed serious adverse events. The proportion of people with adverse events was higher in the interferon‐alpha and interferon‐beta groups with 87.5% (14/16) and 40% (8/20) of people developing one or more adverse events.
The proportion of people with acute HCV who developed chronic HCV as measured by lack of sustained virological response was approximately 84% in the no intervention group. This appears very high in relation to the conventional wisdom that only about 20% of people develop chronic HCV. This may be due to the definition used for chronic HCV, that is, presence of circulating virus after six months, rather than the presence of active hepatitis, which involves some measure of inflammation such as abnormal transaminases or biopsy which demonstrates inflammation. Only a proportion of people with circulating HCV virus develop chronic inflammation. This may be the reason for the difference in the chronic HCV proportions observed in this review and the conventional wisdom. The proportion of people who developed chronic HCV infection as measured by lack of sustained virological response was less in the interferon‐alpha versus the no intervention groups. However, the Trial Sequential Analysis showed that the Z‐curve did not cross the trial sequential monitoring boundaries indicating that further trials are required to confirm this finding. Long‐term follow‐up and assessment of clinical outcomes such as cirrhosis, decompensated cirrhosis, and requirement for liver transplantation are necessary to confirm that this translates into clinical benefit. However, none of the trials reported these outcomes. So, we are unable to conclude that interferon‐alpha is clinically beneficial.
None of the trials reported health‐related quality of life, and so, we were unable to determine the impact of these drugs on health‐related quality of life.
Overall completeness and applicability of evidence
We have included all the major treatments used for treating acute HCV infection in this review. We found no trials comparing pegylated interferon or direct acting antivirals versus placebo or any other intervention. While we found trials comparing different second‐generation antivirals with each other, we did not find any trials comparing second‐generation antivirals with first‐generation antivirals or any form of interferons, that is, none of the trials comparing different second‐generation antivirals were eligible for this review. One possible reason is the difficulty in distinguishing between acute HCV infection and chronic HCV infection. As most people are asymptomatic after acute HCV infection (Hajarizadeh 2012), the only definitive way of diagnosis of acute HCV infection is to have a baseline sample with absent HCV antibody and HCV RNA followed by presence of HCV antibody or HCV RNA, but it is uncommon in clinical practice (Hajarizadeh 2012). So, the clinicians might consider that the person has chronic HCV infection and treat them accordingly. Another possible reason is that clinicians may feel that the effectiveness of a treatment may not be dependent on whether someone has infection for less than six months (acute HCV infection) or more than six months (chronic HCV infection). So, the clinicians may use the same treatment as for chronic HCV infection. Both these reasons (difficulty in establishing a diagnosis of acute HCV infection and the belief that the treatment effect in people with less than six months of duration of HCV infection is probably the same as that in more than six months of HCV infection) contribute to the very few trials conducted in this field. So, it is not clear whether the findings of this review are applicable in the current clinical setting. If they are applicable, they are applicable only in people who have not undergone liver transplantation and those who do not have other coexisting viral diseases as we excluded such trials.
Quality of the evidence
The overall quality of evidence was very low for all the outcomes. All the trials were at high risk of bias for at least one of the domains, mainly because blinding of participants and healthcare providers was not performed in any of the trials and due to risk of industry bias (Lundh 2017). There were risks of bias in other domains also as shown in Figure 1 and Figure 2. The sample size was small for all the comparisons. There were also wide CIs (the CIs overlapped 20% increase or decrease and no effect) for many of the comparisons. In general, there was no evidence of heterogeneity in most comparisons with the exception of the chronic HCV infection in the comparison interferon‐beta versus no intervention.
Potential biases in the review process
We followed the guidance of the Cochrane Handbook for Systematic Reviews of Interventions (Higgins 2011) with two review authors independently selecting trials and extracting data. We performed a thorough search of literature. However, the search period included the premandatory trial registration era and it is possible that some trials on treatments that were not effective or were harmful were not reported at all.
We only included randomised clinical trials which are known to focus mostly on benefits and do not collect and report harms in a detailed manner. According to our choice of studies (i.e. only randomised clinical trials), we might have missed a large number of studies that addressed reporting of harms. Accordingly, this review is biased towards benefits ignoring harms.
We did not search for interventions and trials registered at regulatory authorities (e.g. US Food and Drug Administration, European Medicines Agency, etc.). This may have overlooked trials and as such trials usually are unpublished, the lack of inclusion of such trials may make our comparisons look more advantageous than they really are. However, this is of academic interest only because there is no evidence of benefit of any treatment in people with acute HCV infection, that is, there is no reason to suggest that any of the treatments should be used in routine clinical practice regardless of the adverse event profile of the treatment.
We planned to perform a network meta‐analysis. However, it was not possible to assess whether the potential effect modifiers were similar across different comparisons. Performing a network meta‐analysis in this scenario can be misleading. Therefore, we did not perform the network meta‐analysis, and assessed the comparative benefits and harms of different interventions using standard Cochrane methodology.
Agreements and disagreements with other studies or reviews
We agree with the Cochrane systematic review on interferon therapy of acute HCV that interferons may improve the sustained virological response, but the clinical effects of the interferons are not known (Myers 2001).
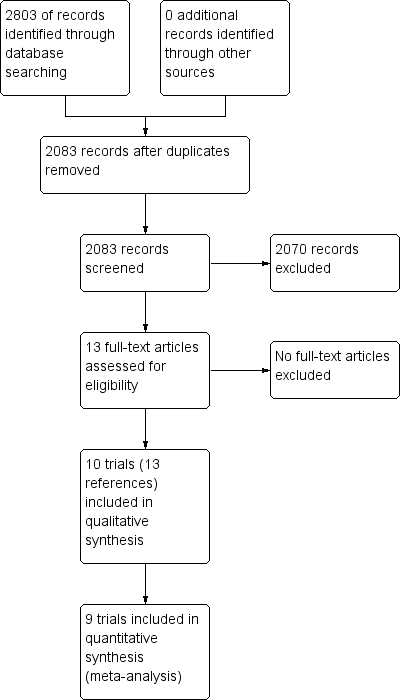
Study flow diagram.

Risk of bias graph: review authors' judgements about each risk of bias item presented as percentages across all included studies.
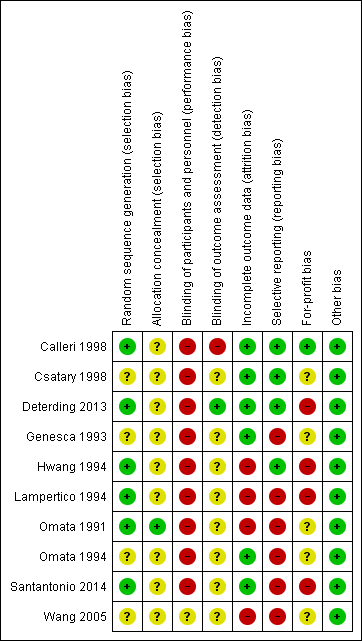
Risk of bias summary: review authors' judgements about each risk of bias item for each included study.
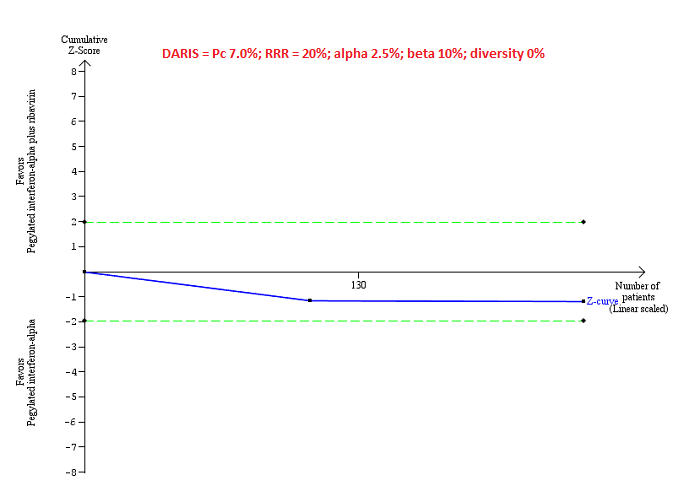
Trial Sequential Analysis of serious adverse events (proportion) for pegylated interferon‐alpha plus ribavirin versus pegylated interferon‐alpha performed using an alpha error of 2.5%, power of 90% (beta error of 10%), relative risk reduction (RRR) of 20%, control group proportion observed in trials (Pc = 7%), and observed heterogeneity in the trials (0%) shows that the accrued sample size was only a small fraction of the diversity‐adjusted required information size (DARIS); so the trial sequential monitoring boundaries were not drawn. The Z‐curve (blue line) does not cross the conventional boundaries (dotted green line). There was a high risk of random errors.
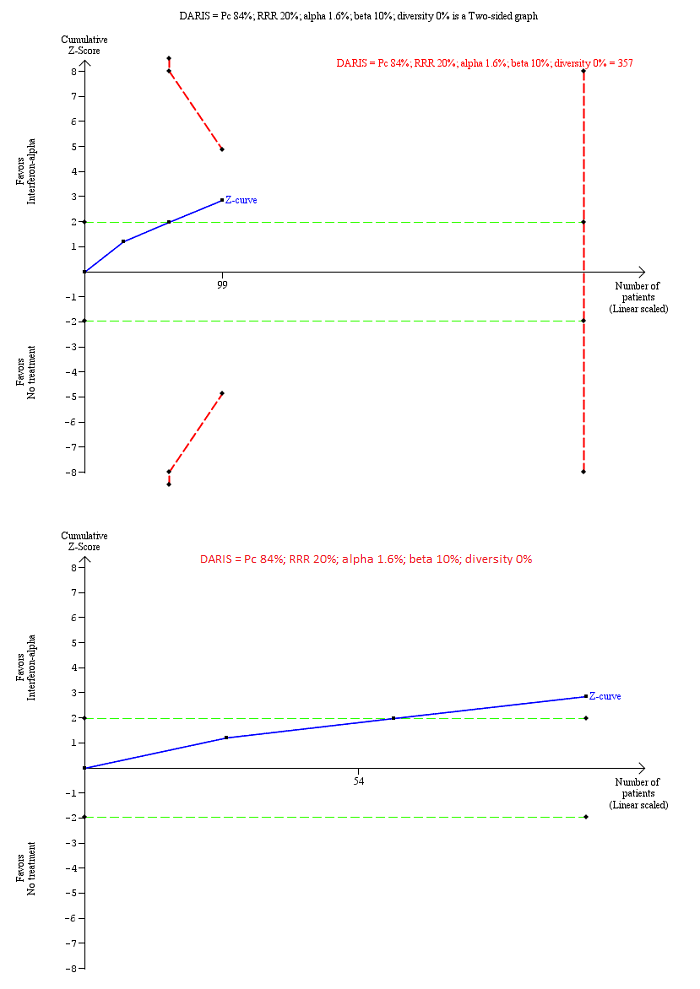
Trial Sequential Analysis of chronic hepatitis C virus for interferon‐alpha versus no intervention was performed using an alpha error of 1.6%, power of 90% (beta error of 10%), relative risk reduction (RRR) of 20%, control group proportion observed in trials (Pc = 84%; upper figure) and Pc = 20% (lower figure), and observed diversity in the trials (0%). The upper figure with Pc = 84% shows that the accrued sample size was only a small fraction of the diversity‐adjusted required information size (DARIS). The Z‐curve (blue line) crosses the conventional boundaries (dotted green line), but it does not cross any of the trial sequential monitoring boundaries (dotted red lines). The lower figure with Pc = 20% shows that the accrued sample size was so small that trial sequential monitoring boundaries were not drawn. There is a high risk of random errors.
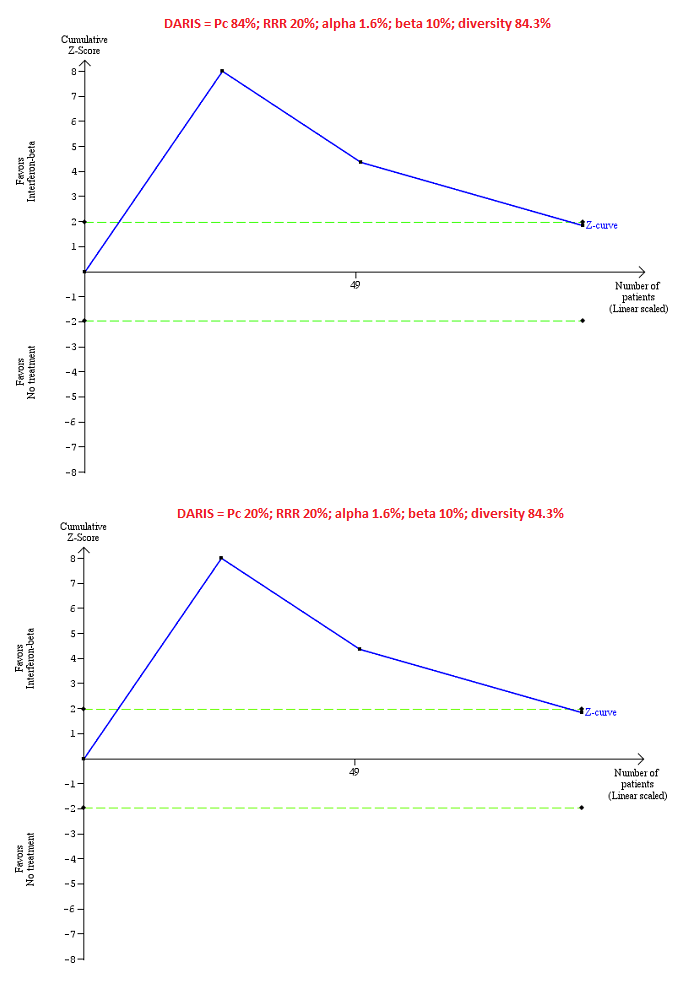
Trial Sequential Analysis of chronic hepatitis C virus for interferon‐beta versus no intervention performed using an alpha error of 1.6%, power of 90% (beta error of 10%), relative risk reduction (RRR) of 20%, control group proportion observed in the trials (Pc = 84%; upper figure) and a Pc of 20% (lower figure), and observed heterogeneity in the trials (84%) shows that the accrued sample size was only a small fraction of the diversity‐adjusted required information size (DARIS); so the trial sequential monitoring boundaries were not drawn. The Z‐curve (blue line) crosses the conventional boundaries (dotted green line). There is a high risk of random errors.

Trial Sequential Analysis of chronic hepatitis C virus infection for pegylated interferon‐alpha plus ribavirin versus pegylated interferon‐alpha performed using an alpha error of 1.6%, power of 90% (beta error of 10%), relative risk reduction (RRR) of 20% (top figure and bottom figure) and 10% (middle figure), control group proportion observed in the trials (Pc = 84%; top figure and middle figure) and Pc = 20% (bottom figure), and observed heterogeneity in the trials (0%) shows that the Z‐curve (blue line) has reached the zone of futility for a RRR of 20% (top figure). However, when a RRR of 10% or when a Pc = 20% was used, the accrued sample size was only a small fraction of the diversity adjusted required information size (DARIS); the Z‐curve (blue line) does not cross the conventional boundaries (dotted green line) or trial sequential monitoring boundaries (dotted red line) (middle figure). For a Pc = 20%, the accrued sample size was so small that the trial sequential monitoring boundaries were not drawn. There is a high risk of random errors.

Comparison 1 Intervention versus control, Outcome 1 Serious adverse events (proportion).

Comparison 1 Intervention versus control, Outcome 2 Serious adverse events (number).
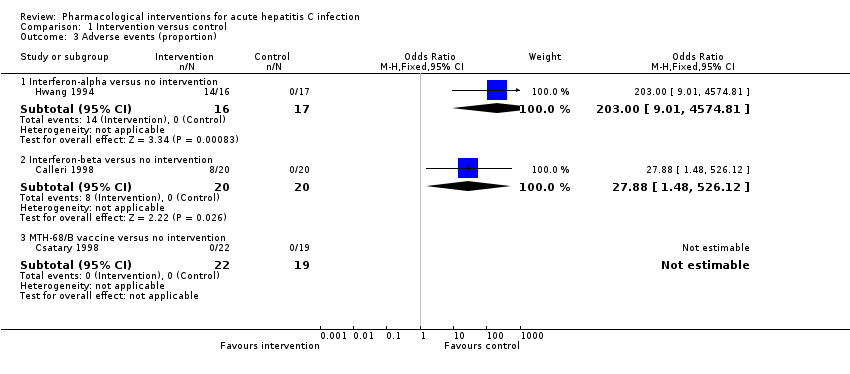
Comparison 1 Intervention versus control, Outcome 3 Adverse events (proportion).

Comparison 1 Intervention versus control, Outcome 4 Adverse events (number).
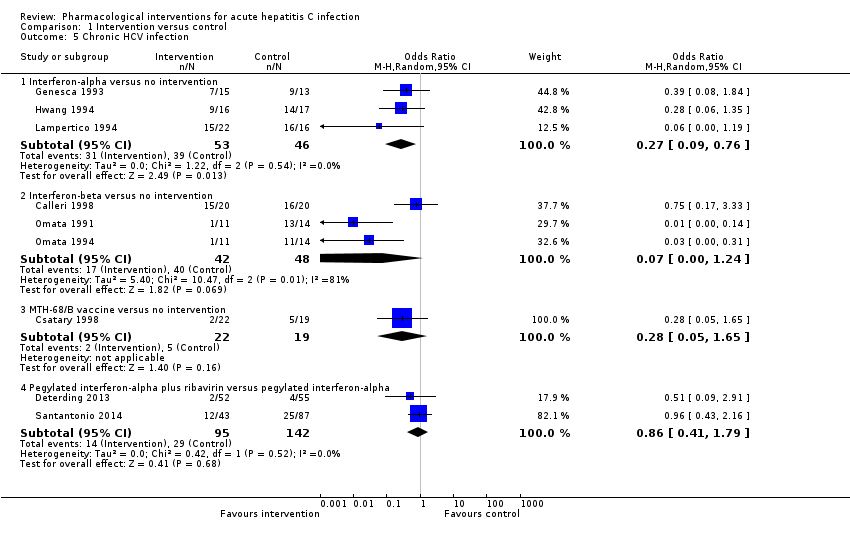
Comparison 1 Intervention versus control, Outcome 5 Chronic HCV infection.
| Intervention versus no intervention or control intervention (control) for acute hepatitis C infection: primary outcomes | |||||
| Patient or population: people with acute hepatitis C infection Intervention: multiple Control: multiple Settings: secondary or tertiary care | |||||
| Outcomes | Illustrative comparative risks* (95% CI) | Relative effect | No of participants | Quality of the evidence | |
| Assumed risk | Corresponding risk | ||||
| Control | Intervention | ||||
| Mortality: there was 1 mortality within 6 months (in the pegylated interferon‐alpha group (1/95 = 1.1%). There was no mortality in the remaining groups. There was no further mortality in the trials which reported mortality until maximal follow‐up. | |||||
| Serious adverse events: there were no serious adverse events in either group in the comparisons interferon‐beta versus control and MH‐68/B vaccine versus control. Trials in interferon‐alpha versus control did not report serious adverse events. | |||||
| Serious adverse events (proportion) ‐ pegylated interferon‐alpha plus ribavirin versus pegylated interferon‐alpha | 70 per 1000 | 115 per 1000 | OR 1.72 | 237 | ⊕⊝⊝⊝ |
| Serious adverse events (number) ‐ pegylated interferon‐alpha plus ribavirin versus pegylated interferon‐alpha | 92 per 1000 | 251 per 1000 | Rate ratio 2.74 | 237 | ⊕⊝⊝⊝ |
| Adverse events (proportion) ‐ interferon‐alpha versus no intervention | 10 per 1000 | 672 per 1000 | OR 203 | 33 | ⊕⊝⊝⊝ |
| Adverse events (proportion) ‐ interferon‐beta versus no intervention | 10 per 1000 | 220 per 1000 | OR 27.88 | 40 | ⊕⊝⊝⊝ |
| Adverse events: there were no adverse events in the comparison MTH‐68/B vaccine versus control. The number of adverse events was not reported for the comparison interferon‐alpha versus control. The proportion of people with adverse events and number of adverse events was not reported for the comparison pegylated interferon‐alpha plus ribavirin versus pegylated interferon‐alpha. | |||||
| Adverse events (number) ‐ interferon‐beta versus no intervention | 10 per 1000 | 147 per 1000 | OR 17 | 40 | ⊕⊝⊝⊝ |
| Health‐related quality of life | None of the trials reported this outcome. | ||||
| None of the trials reported health‐related quality of life, cirrhosis, decompensated liver disease, liver transplantation, or hepatocellular carcinoma. | |||||
| *The basis for the assumed risk is the mean control group proportion (or control group rate) unless there were no events in the control group when the control group proportion (or control group rate) was considered as 1%. The corresponding risk (and its 95% confidence interval) is based on the assumed risk in the comparison group and the relative effect of the intervention (and its 95% CI). CI: confidence interval; OR: odds ratio; RCT: randomised clinical trial. | |||||
| GRADE Working Group grades of evidence | |||||
| 1 Downgraded 2 levels for high risk of bias. | |||||
| Intervention versus no intervention or control intervention (control) for acute hepatitis C infection: secondary outcomes | |||||
| Patient or population: people with acute hepatitis C infection Intervention: multiple (see below) Control: multiple (see below) Settings: secondary or tertiary care | |||||
| Outcomes | Illustrative comparative risks* (95% CI) | Relative effect | No of participants | Quality of the evidence | |
| Assumed risk | Corresponding risk | ||||
| Control | Intervention | ||||
| Liver transplantation | None of the trials reported this outcome. | ||||
| Decompensated liver disease | None of the trials reported this outcome. | ||||
| Cirrhosis | None of the trials reported this outcome. | ||||
| Hepatocellular carcinoma | None of the trials reported this outcome. | ||||
| Chronic HCV infection†‐ interferon‐alpha versus no intervention | 848 per 1000 | 601 per 1000 | OR 0.27 | 99 | ⊕⊝⊝⊝ |
| Chronic HCV infection†‐ interferon‐beta versus no intervention | 833 per 1000 | 259 per 1000 | OR 0.07 | 90 | ⊕⊝⊝⊝ |
| Chronic HCV infection†‐ MTH‐68/B vaccine versus no intervention | 263 per 1000 | 91 per 1000 | OR 0.28 | 41 | ⊕⊝⊝⊝ |
| Chronic HCV infection†‐ pegylated interferon‐alpha plus ribavirin versus pegylated interferon‐alpha | 204 per 1000 | 181 per 1000 | OR 0.86 | 237 | ⊕⊝⊝⊝ |
| *The basis for the assumed risk is the mean control group proportion. The corresponding risk (and its 95% confidence interval) is based on the assumed risk in the comparison group and the relative effect of the intervention (and its 95% CI). †Chronic HCV infection was measured by absence of sustained virological response (i.e. the presence of circulating virus at least 6 months after cessation of treatment). CI: confidence interval; HCV: hepatitis C virus; OR: odds ratio; RCT: randomised clinical trial. | |||||
| GRADE Working Group grades of evidence | |||||
| 1 Downgraded 2 levels for high risk of bias (i.e. within study risk of bias). | |||||
| Study name | Intervention | Control | Period of follow‐up (months) | Randomisation | Blinding of participants and healthcare professionals | Blinding of outcome assessors | Missing outcome bias | Selective outcome reporting bias | For‐profit bias |
| Interferon‐alpha | No intervention | 12 | Unclear | High | Unclear | Low | High | Unclear | |
| Interferon‐alpha | No intervention | 12 | Unclear | High | Unclear | High | Low | High | |
| Interferon‐alpha | No intervention | 18 | Unclear | High | Unclear | High | High | High | |
| Interferon‐beta | No intervention | 36 | Low | High | Unclear | High | High | Unclear | |
| Interferon‐beta | No intervention | 36 | Unclear | High | Unclear | Low | High | Unclear | |
| Interferon‐beta | No intervention | 22.5 | Unclear | High | High | Low | Low | Low | |
| MTH‐68/B vaccine | No intervention | 12 | Unclear | High | Unclear | Low | Low | Unclear | |
| Pegylated interferon‐alpha | No intervention | 6 | Unclear | Unclear | Unclear | High | High | Unclear | |
| Pegylated interferon‐alpha | Pegylated interferon‐alpha plus ribavirin | 6 | Unclear | High | Low | High | Low | High | |
| Pegylated interferon‐alpha | Pegylated interferon‐alpha plus ribavirin | 12 | Unclear | High | Unclear | Low | High | High |
| Outcome or subgroup title | No. of studies | No. of participants | Statistical method | Effect size |
| 1 Serious adverse events (proportion) Show forest plot | 4 | Odds Ratio (M‐H, Fixed, 95% CI) | Subtotals only | |
| 1.1 Interferon‐beta versus no intervention | 1 | 40 | Odds Ratio (M‐H, Fixed, 95% CI) | 0.0 [0.0, 0.0] |
| 1.2 MTH‐68/B vaccine versus no intervention | 1 | 41 | Odds Ratio (M‐H, Fixed, 95% CI) | 0.0 [0.0, 0.0] |
| 1.3 Pegylated interferon‐alpha plus ribavirin versus pegylated interferon‐alpha | 2 | 237 | Odds Ratio (M‐H, Fixed, 95% CI) | 1.72 [0.70, 4.21] |
| 2 Serious adverse events (number) Show forest plot | 4 | Rate Ratio (Fixed, 95% CI) | Subtotals only | |
| 2.1 Interferon‐beta versus no intervention | 1 | 40 | Rate Ratio (Fixed, 95% CI) | 0.0 [0.0, 0.0] |
| 2.2 MTH‐68/B vaccine versus no intervention | 1 | 41 | Rate Ratio (Fixed, 95% CI) | 0.0 [0.0, 0.0] |
| 2.3 Pegylated interferon‐alpha plus ribavirin versus pegylated interferon‐alpha | 2 | 237 | Rate Ratio (Fixed, 95% CI) | 2.74 [1.40, 5.33] |
| 3 Adverse events (proportion) Show forest plot | 3 | Odds Ratio (M‐H, Fixed, 95% CI) | Subtotals only | |
| 3.1 Interferon‐alpha versus no intervention | 1 | 33 | Odds Ratio (M‐H, Fixed, 95% CI) | 203.0 [9.01, 4574.81] |
| 3.2 Interferon‐beta versus no intervention | 1 | 40 | Odds Ratio (M‐H, Fixed, 95% CI) | 27.88 [1.48, 526.12] |
| 3.3 MTH‐68/B vaccine versus no intervention | 1 | 41 | Odds Ratio (M‐H, Fixed, 95% CI) | 0.0 [0.0, 0.0] |
| 4 Adverse events (number) Show forest plot | 2 | Odds Ratio (Fixed, 95% CI) | Subtotals only | |
| 4.1 Interferon‐beta versus no intervention | 1 | 40 | Odds Ratio (Fixed, 95% CI) | 17.00 [0.98, 294.53] |
| 4.2 MTH‐68/B vaccine versus no intervention | 1 | 41 | Odds Ratio (Fixed, 95% CI) | 0.0 [0.0, 0.0] |
| 5 Chronic HCV infection Show forest plot | 9 | Odds Ratio (M‐H, Random, 95% CI) | Subtotals only | |
| 5.1 Interferon‐alpha versus no intervention | 3 | 99 | Odds Ratio (M‐H, Random, 95% CI) | 0.27 [0.09, 0.76] |
| 5.2 Interferon‐beta versus no intervention | 3 | 90 | Odds Ratio (M‐H, Random, 95% CI) | 0.07 [0.00, 1.24] |
| 5.3 MTH‐68/B vaccine versus no intervention | 1 | 41 | Odds Ratio (M‐H, Random, 95% CI) | 0.28 [0.05, 1.65] |
| 5.4 Pegylated interferon‐alpha plus ribavirin versus pegylated interferon‐alpha | 2 | 237 | Odds Ratio (M‐H, Random, 95% CI) | 0.86 [0.41, 1.79] |