Intervenciones farmacológicas para la infección aguda por el virus de la hepatitis C
Referencias
References to studies included in this review
Ir a:
Additional references
Ir a:
Characteristics of studies
Characteristics of included studies [ordered by study ID]
| Methods | Randomised clinical trial. | |
| Participants | Country: Italy. Number randomised: 40. Post‐randomisation dropouts: 0 (0%). Revised sample size: 40. Mean age: 29 years. Females: 6 (15%). Genotype 1: not stated. Genotype 3: not stated. Other genotypes: not stated. Mean follow‐up period in months (for all groups): 22.5. Inclusion criteria
Exclusion criteria
| |
| Interventions | Participants were randomly assigned to 2 groups. Group 1: interferon‐beta (n = 20). Further details: interferon‐beta 3 MU IM once daily for 5 days then 3 times per day for 3 more weeks. Group 2: no intervention (n = 20). Duration of treatment: 1 month. | |
| Outcomes | Sustained virological response. Biochemical response. Severity and frequency of adverse events. | |
| Notes | 6 participants were not randomised for logistical issues and they were allocated to the immediate treatment. | |
| Risk of bias | ||
| Bias | Authors' judgement | Support for judgement |
| Random sequence generation (selection bias) | Low risk | Quote: "Randomized, computer generated according to the author's reply." |
| Allocation concealment (selection bias) | Unclear risk | Comment: information not available. |
| Blinding of participants and personnel (performance bias) | High risk | Comment: "different treatments" (author replies). |
| Blinding of outcome assessment (detection bias) | High risk | Comment: "different treatments" (author replies). |
| Incomplete outcome data (attrition bias) | Low risk | Comment: no post‐randomisation dropouts. |
| Selective reporting (reporting bias) | Low risk | Comment: all important outcomes were reported. |
| For‐profit bias | Low risk | Quote: "Italian NHS". Comment: according to the author's reply. |
| Other bias | Low risk | Comment: no other risk of bias. |
| Methods | Randomised clinical trial. | |
| Participants | Country: Hungary, USA. Number randomised: 41. Post‐randomisation dropouts: 0 (0%). Revised sample size: 41. Mean age: not stated. Females: not stated. Genotype 1: not stated. Genotype 3: not stated. Other genotypes: not stated. Mean follow‐up period in months (for all groups): 12. Inclusion criteria
Exclusion criteria
| |
| Interventions | Participants were randomly assigned to 2 groups. Group 1: MTH‐68/B (n = 22). Further details: MTH‐68/B (live attenuated infectious bursal disease virus (IBDV)) 4000 U/day for 1 week, then 3 times per week for 2 weeks, then once monthly for 6 months. Group 2: no intervention (n = 19). Duration of treatment: 6 months | |
| Outcomes | Sustained virological response. Frequency of adverse events. | |
| Notes | ||
| Risk of bias | ||
| Bias | Authors' judgement | Support for judgement |
| Random sequence generation (selection bias) | Unclear risk | Quote: "Patients were randomly allocated to two groups." Comment: further details not available. |
| Allocation concealment (selection bias) | Unclear risk | Comment: information not available. |
| Blinding of participants and personnel (performance bias) | High risk | Comment: no use of placebo. |
| Blinding of outcome assessment (detection bias) | Unclear risk | Comment: information not available. |
| Incomplete outcome data (attrition bias) | Low risk | Comment: no post‐randomisation dropouts. |
| Selective reporting (reporting bias) | Low risk | Comment: all important outcomes were reported. |
| For‐profit bias | Unclear risk | Comment: information not available. |
| Other bias | Low risk | Comment: no other bias. |
| Methods | Randomised clinical trial. | |
| Participants | Country: Germany. Number randomised: 107. Post‐randomisation dropouts: 0 (0%). Revised sample size: 107. Mean age: 39 years. Females: 46 (43%). Genotype 1: 73 (68.2%). Genotype 3: 18 (16.8%). Other genotypes: 10 (9.3%). Mean follow‐up period in months (for all groups): 6. Inclusion criteria
Exclusion criteria
| |
| Interventions | Participants were randomly assigned to 2 groups. Group 1: immediate pegylated interferon‐alpha‐2b (n = 55). Further details: immediate pegylated interferon‐alfa‐2b 1.5 μg/kg. Group 2: delayed pegylated interferon‐alfa‐2b (n = 52). Further details: delayed pegylated interferon‐alfa‐2b 1.5 μg/kg + ribavirin > 10.6 mg/kg. Duration of treatment: 6 months. | |
| Outcomes | Sustained virological response. Biochemical response. Severity and frequency of adverse events. Analysis of responses to the respective treatment approaches according to severity of symptoms. | |
| Notes | ||
| Risk of bias | ||
| Bias | Authors' judgement | Support for judgement |
| Random sequence generation (selection bias) | Low risk | Quote: "Patients were randomised via a web‐based randomisation service provided by the Hep‐Net Study House." |
| Allocation concealment (selection bias) | Unclear risk | Quote: "We used stratified block randomisation with block sizes of eight, independent across strata." |
| Blinding of participants and personnel (performance bias) | High risk | Quote: "This investigator‐initiated study was designed as an open‐label, phase 3, multicentre study." |
| Blinding of outcome assessment (detection bias) | Low risk | Comment: outcome assessors blind according to the author reply. |
| Incomplete outcome data (attrition bias) | Low risk | Comment: no post‐randomisation dropouts. |
| Selective reporting (reporting bias) | Low risk | Comment: all important outcomes were reported. |
| For‐profit bias | High risk | Quote: "The study was supported by the German Network of Competence on Viral Hepatitis (Hep‐Net, funded by the Federal Ministry of Education and Research). The study was also supported by a research grant from Essex Pharma, Schering‐Plough, and MSD. MSD provided study drugs and financial support." |
| Other bias | Low risk | Comment: no other bias. |
| Methods | Randomised clinical trial. | |
| Participants | Country: Spain. Number randomised: 28. Post‐randomisation dropouts: 0 (0%). Revised sample size: 28. Mean age: not stated. Females: not stated. Genotype 1: not stated. Genotype 3: not stated. Other genotypes: not stated. Mean follow‐up period in months (for all groups): 12 months. Inclusion criteria
| |
| Interventions | Participants were randomly assigned to 2 groups. Group 1: interferon‐alpha‐2b (n = 15). Further details: interferon‐alpha‐2b 3 MU 3 times per week. Group 2: no treatment (n = 13). Duration of treatment: 3 months. | |
| Outcomes | Sustained virological response. Biochemical response. | |
| Notes | ||
| Risk of bias | ||
| Bias | Authors' judgement | Support for judgement |
| Random sequence generation (selection bias) | Unclear risk | Quote: "A randomised, controlled trial was undertaken." Comment: further details not available. |
| Allocation concealment (selection bias) | Unclear risk | Comment: information not available. |
| Blinding of participants and personnel (performance bias) | High risk | Quote: "Twenty eight patients with acute HCV (15 treated and 13 controls) were included in the trial." Comment: placebo not used. |
| Blinding of outcome assessment (detection bias) | Unclear risk | Comment: information not available. |
| Incomplete outcome data (attrition bias) | Low risk | Comment: no post‐randomisation dropouts. |
| Selective reporting (reporting bias) | High risk | Comment: some important outcomes which would generally be assessed were not reported. |
| For‐profit bias | Unclear risk | Comment: information not available. |
| Other bias | Low risk | Comment: no other bias. |
| Methods | Randomised clinical trial. | |
| Participants | Country: China. Number randomised: 33. Post‐randomisation dropouts: 0 (0%). Revised sample size: 33. Mean age: 54 years. Females: 9 (27.3%). Genotype 1: not stated. Genotype 3: not stated. Other genotypes: not stated. Mean follow‐up period in months (for all groups): 12. Inclusion criteria
Exclusion criteria
| |
| Interventions | Participants were randomly assigned to 2 groups. Group 1: interferon‐alpha‐2b (n = 16). Further details: interferon‐alpha‐2b 3 MU 3 times per week. Group 2: no treatment (n = 17). Duration of treatment: 3 months. | |
| Outcomes | Sustained virological response. Frequency of adverse events. | |
| Notes | ||
| Risk of bias | ||
| Bias | Authors' judgement | Support for judgement |
| Random sequence generation (selection bias) | Low risk | Quote: "These patients were randomly allocated to either the IFN‐treated group or the control group by a random number table." |
| Allocation concealment (selection bias) | Unclear risk | Comment: information not available. |
| Blinding of participants and personnel (performance bias) | High risk | Quote: "Seventeen patients in the control group received no specific treatment." Comment: placebo not used. |
| Blinding of outcome assessment (detection bias) | Unclear risk | Comment: information not available. |
| Incomplete outcome data (attrition bias) | High risk | Quote: "Only one patient in the control group was unwilling to continue and withdrew from the study after 6 months of follow up." Comment: there were post‐randomisation dropouts. |
| Selective reporting (reporting bias) | Low risk | Comment: all important outcomes were reported. |
| For‐profit bias | High risk | Quote: "This study was supported by grants from the National Science Council (NSC82‐0419‐B075‐092) and National Health Research Institutes (DOH‐83‐HR‐208), Republic of China. Drug supplied by pharm. company." |
| Other bias | Low risk | Comment: no other bias. |
| Methods | Randomised clinical trial. | |
| Participants | Country: Italy. Number randomised: 41. Post‐randomisation dropouts: 3 (7.3%). Revised sample size: 38. Mean age: 47 years. Females: 19 (50%). Genotype 1: not stated. Genotype 3: not stated. Other genotypes: not stated. Mean follow‐up period in months (for all groups): 18. Inclusion criteria
Exclusion criteria
| |
| Interventions | Participants were randomly assigned to 2 groups. Group 1: interferon‐alpha‐2b (n = 22). Further details: interferon‐alpha‐2b 3 MU IM 3 times per week. Group 2: no treatment (n = 16). Duration of treatment: 3 months. | |
| Outcomes | Sustained virological response. Biochemical response. Mortality at the end of follow‐up (18 months). | |
| Notes | Reasons for post‐randomisation dropouts: of the 48 participants enrolled in the study, 1 refused therapy and 2 untreated people were lost to follow‐up during month 1. 7 participants (16% of total) were thought to have been infected with a non‐A, non‐B, non‐C agent. | |
| Risk of bias | ||
| Bias | Authors' judgement | Support for judgement |
| Random sequence generation (selection bias) | Low risk | Comment: randomisation was computerised according to the author's reply. |
| Allocation concealment (selection bias) | Unclear risk | Comment: information not available. |
| Blinding of participants and personnel (performance bias) | High risk | Comment: multicentre, prospective, open, randomised study comparing interferon treatment and no treatment. |
| Blinding of outcome assessment (detection bias) | Unclear risk | Comment: information not available. |
| Incomplete outcome data (attrition bias) | High risk | Comment: there were post‐randomisation dropouts. |
| Selective reporting (reporting bias) | High risk | Comment: some important outcomes which would generally be assessed were not reported. |
| For‐profit bias | High risk | Quote: "We thank Dr. Paola Mazzanti and Dr. Cristina Pintus (Schering‐Plough) for their assistance." |
| Other bias | Low risk | Comment: there was no other bias. |
| Methods | Randomised clinical trial. | |
| Participants | Country: Japan. Number randomised: 27. Post‐randomisation dropouts: 2 (7.4%). Revised sample size: 25. Mean age: 40 years. Females: 14 (56%). Genotype 1: not stated. Genotype 3: not stated. Other genotypes: not stated. Mean follow‐up period in months (for all groups): 36. Inclusion criteria
| |
| Interventions | Participants were randomly assigned to 2 groups. Group 1: interferon‐beta (n = 11). Further details: interferon‐beta, 3 MU IV for 5 consecutive days in the first week, and then 3 times per week for the next 3 weeks. Group 2: no treatment (n = 14). Duration of treatment: 1 month. | |
| Outcomes | Sustained virological response. | |
| Notes | ||
| Risk of bias | ||
| Bias | Authors' judgement | Support for judgement |
| Random sequence generation (selection bias) | Low risk | Quote: "25 patients with acute non‐A, non‐B hepatitis drew lots for allocation to treatment with interferon." |
| Allocation concealment (selection bias) | Low risk | Quote: "25 patients with acute non‐A, non‐B hepatitis drew lots for allocation to treatment with interferon." |
| Blinding of participants and personnel (performance bias) | High risk | Comment: placebo not used. |
| Blinding of outcome assessment (detection bias) | Unclear risk | Comment: information not available. |
| Incomplete outcome data (attrition bias) | High risk | Quote: "2 patients in the untreated group were lost to follow‐up." Comment: there were post‐randomisation dropouts. |
| Selective reporting (reporting bias) | High risk | Comment: some important outcomes which would generally be assessed were not reported. |
| For‐profit bias | Unclear risk | Comment: this information was not available. |
| Other bias | Low risk | Comment: there was no other bias. |
| Methods | Randomised clinical trial. | |
| Participants | Country: Japan. Number randomised: 25. Post‐randomisation dropouts: 0 (0%). Revised sample size: 25. Mean age: 39 years. Females: 14 (56%). Genotype 1: not stated. Genotype 3: not stated. Other genotypes: not stated. Mean follow‐up period in months (for all groups): 36. Inclusion criteria
Exclusion criteria
| |
| Interventions | Participants were randomly assigned to 2 groups. Group 1: interferon‐beta (n = 11). Further details: interferon‐beta 3 MU IV for 5 days, then 3 times per week for 3 weeks. Group 2: no treatment (n = 14). Duration of treatment: 1 month. | |
| Outcomes | Sustained virological response. Fluctuation of ALT concentrations. | |
| Notes | ||
| Risk of bias | ||
| Bias | Authors' judgement | Support for judgement |
| Random sequence generation (selection bias) | Unclear risk | Quote: "25 patients randomly assigned to." Comment: further details not available. |
| Allocation concealment (selection bias) | Unclear risk | Comment: information not available. |
| Blinding of participants and personnel (performance bias) | High risk | Comment: no use of placebo. |
| Blinding of outcome assessment (detection bias) | Unclear risk | Comment: information not available. |
| Incomplete outcome data (attrition bias) | Low risk | Comment: there were no post‐randomisation dropouts. |
| Selective reporting (reporting bias) | High risk | Comment: some important outcomes which would generally be assessed were not reported. |
| For‐profit bias | Unclear risk | Comment: information not available. |
| Other bias | Low risk | Comment: there was no other bias. |
| Methods | Randomised clinical trial. | |
| Participants | Country: Italy. Number randomised: 130. Post‐randomisation dropouts: 0 (0%). Revised sample size: 130. Mean age: 34 years. Females: 41 (31.5%). Genotype 1: 53 (40.8%). Genotype 3: 32 (24.6%). Other genotypes: 45 (34.6%). Mean follow‐up period in months (for all groups): 12. Inclusion criteria
Exclusion criteria
| |
| Interventions | Participants were randomly assigned to 3 groups. Group 1: pegylated interferon‐alpha‐2b (n = 44). Further details: pegylated interferon‐alpha‐2b 1.5 µg/kg/week (24 weeks). Group 2: pegylated interferon‐alpha‐2b (n = 43). Further details: pegylated interferon‐alpha‐2b 1.5 µg/kg/week (12 weeks). Group 3: pegylated interferon‐alpha‐2b plus ribavirin (n = 43). Further details: pegylated interferon‐alpha‐2b 1.5 µg/kg/week + ribavirin 10.6 mg/kg/day orally (12 weeks). Duration of treatment: 12 to 24 weeks (see above). | |
| Outcomes | Sustained virological response. Virological responses after 2 weeks of treatment (very rapid virological response), after 4 weeks of treatment (rapid virological response), at the end of treatment (end‐of‐treatment virological response), and at 12 months' post‐treatment follow‐up (long‐term virological response). ALT level normalisation at the end of treatment and at 6 and 12 months' post‐treatment follow‐up. Safety (adverse events). | |
| Notes | ||
| Risk of bias | ||
| Bias | Authors' judgement | Support for judgement |
| Random sequence generation (selection bias) | Low risk | Quote: "The randomization list was generated centrally by an independent biostatistician using the Proc Plan of the SAS system (version 9.2; SAS Institute Inc., Cary, NC) and consisted of a computer‐generated treatment allocation list in blocks of 9 patients each." |
| Allocation concealment (selection bias) | Unclear risk | Comment: information not available. |
| Blinding of participants and personnel (performance bias) | High risk | Comment: different treatments, no placebo. |
| Blinding of outcome assessment (detection bias) | Unclear risk | Comment: information not available. |
| Incomplete outcome data (attrition bias) | Low risk | Quote: "ITT analysis, Patients who discontinued the study for any reason before the 6‐month follow‐up visit were considered as nonresponders." Comment: low for sustained virological response, high for 1‐year mortality because there were post‐randomisation dropouts. |
| Selective reporting (reporting bias) | High risk | Comment: adverse events not clearly reported. |
| For‐profit bias | High risk | Quote: "The study sponsor for drug supply and financial support was Schering‐Plough (now Merck) SpA, Milan, Italy." |
| Other bias | Low risk | Comment: there was no other bias. |
| Methods | Randomised clinical trial. | |
| Participants | Country: USA. Number randomised: 21. Post‐randomisation dropouts: 0 (0%). Revised sample size: 21. Mean age: not stated. Females: not stated. Genotype 1: 13 (61.9%). Genotype 3: not stated. Other genotypes: not stated. Mean follow‐up period in months (for all groups): 6. Inclusion criteria
| |
| Interventions | Participants were randomly assigned to 2 groups. Group 1: pegylated interferon‐alpha (n = 9). Further details: pegylated interferon‐alpha (no further details of treatment regimen). Group 2: no treatment (n = 12). Duration of treatment: 6 months. | |
| Outcomes | Sustained virological response was reported but was not reported in sufficient details to include for analysis. | |
| Notes | ||
| Risk of bias | ||
| Bias | Authors' judgement | Support for judgement |
| Random sequence generation (selection bias) | Unclear risk | Comment: information not available. |
| Allocation concealment (selection bias) | Unclear risk | Comment: information not available. |
| Blinding of participants and personnel (performance bias) | Unclear risk | Comment: information not available. |
| Blinding of outcome assessment (detection bias) | Unclear risk | Comment: information not available. |
| Incomplete outcome data (attrition bias) | High risk | Comment: there were post‐randomisation dropouts. |
| Selective reporting (reporting bias) | High risk | Comment: some important outcomes which would generally be assessed were not reported. |
| For‐profit bias | Unclear risk | Comment: information not available. |
| Other bias | Low risk | Comment: there was no other bias. |
ALT: alanine transaminase; DNA: deoxy ribonucleic acid; HAV: hepatitis A virus; HBV: hepatitis B virus; HCV: hepatitis C virus; HCV‐RNA: hepatitis C virus ribonucleic acid; IM: intramuscular; ITT: intention‐to‐treat analysis; IU: international units; IV: intravenous; MU: million units.
Data and analyses
| Outcome or subgroup title | No. of studies | No. of participants | Statistical method | Effect size |
| 1 Serious adverse events (proportion) Show forest plot | 4 | Odds Ratio (M‐H, Fixed, 95% CI) | Subtotals only | |
| Analysis 1.1  Comparison 1 Intervention versus control, Outcome 1 Serious adverse events (proportion). | ||||
| 1.1 Interferon‐beta versus no intervention | 1 | 40 | Odds Ratio (M‐H, Fixed, 95% CI) | 0.0 [0.0, 0.0] |
| 1.2 MTH‐68/B vaccine versus no intervention | 1 | 41 | Odds Ratio (M‐H, Fixed, 95% CI) | 0.0 [0.0, 0.0] |
| 1.3 Pegylated interferon‐alpha plus ribavirin versus pegylated interferon‐alpha | 2 | 237 | Odds Ratio (M‐H, Fixed, 95% CI) | 1.72 [0.70, 4.21] |
| 2 Serious adverse events (number) Show forest plot | 4 | Rate Ratio (Fixed, 95% CI) | Subtotals only | |
| Analysis 1.2  Comparison 1 Intervention versus control, Outcome 2 Serious adverse events (number). | ||||
| 2.1 Interferon‐beta versus no intervention | 1 | 40 | Rate Ratio (Fixed, 95% CI) | 0.0 [0.0, 0.0] |
| 2.2 MTH‐68/B vaccine versus no intervention | 1 | 41 | Rate Ratio (Fixed, 95% CI) | 0.0 [0.0, 0.0] |
| 2.3 Pegylated interferon‐alpha plus ribavirin versus pegylated interferon‐alpha | 2 | 237 | Rate Ratio (Fixed, 95% CI) | 2.74 [1.40, 5.33] |
| 3 Adverse events (proportion) Show forest plot | 3 | Odds Ratio (M‐H, Fixed, 95% CI) | Subtotals only | |
| Analysis 1.3  Comparison 1 Intervention versus control, Outcome 3 Adverse events (proportion). | ||||
| 3.1 Interferon‐alpha versus no intervention | 1 | 33 | Odds Ratio (M‐H, Fixed, 95% CI) | 203.0 [9.01, 4574.81] |
| 3.2 Interferon‐beta versus no intervention | 1 | 40 | Odds Ratio (M‐H, Fixed, 95% CI) | 27.88 [1.48, 526.12] |
| 3.3 MTH‐68/B vaccine versus no intervention | 1 | 41 | Odds Ratio (M‐H, Fixed, 95% CI) | 0.0 [0.0, 0.0] |
| 4 Adverse events (number) Show forest plot | 2 | Odds Ratio (Fixed, 95% CI) | Subtotals only | |
| Analysis 1.4  Comparison 1 Intervention versus control, Outcome 4 Adverse events (number). | ||||
| 4.1 Interferon‐beta versus no intervention | 1 | 40 | Odds Ratio (Fixed, 95% CI) | 17.00 [0.98, 294.53] |
| 4.2 MTH‐68/B vaccine versus no intervention | 1 | 41 | Odds Ratio (Fixed, 95% CI) | 0.0 [0.0, 0.0] |
| 5 Chronic HCV infection Show forest plot | 9 | Odds Ratio (M‐H, Random, 95% CI) | Subtotals only | |
| Analysis 1.5  Comparison 1 Intervention versus control, Outcome 5 Chronic HCV infection. | ||||
| 5.1 Interferon‐alpha versus no intervention | 3 | 99 | Odds Ratio (M‐H, Random, 95% CI) | 0.27 [0.09, 0.76] |
| 5.2 Interferon‐beta versus no intervention | 3 | 90 | Odds Ratio (M‐H, Random, 95% CI) | 0.07 [0.00, 1.24] |
| 5.3 MTH‐68/B vaccine versus no intervention | 1 | 41 | Odds Ratio (M‐H, Random, 95% CI) | 0.28 [0.05, 1.65] |
| 5.4 Pegylated interferon‐alpha plus ribavirin versus pegylated interferon‐alpha | 2 | 237 | Odds Ratio (M‐H, Random, 95% CI) | 0.86 [0.41, 1.79] |
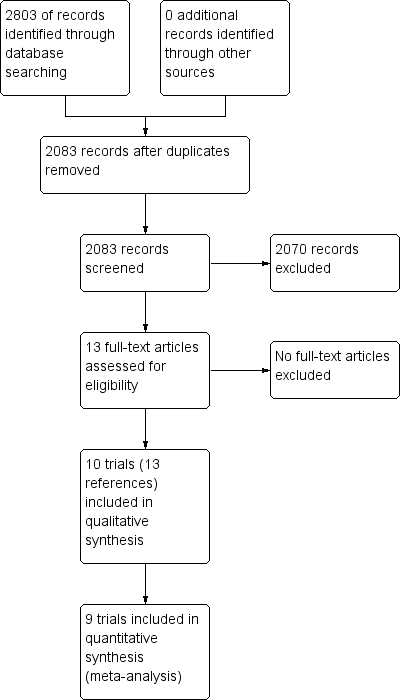
Study flow diagram.

Risk of bias graph: review authors' judgements about each risk of bias item presented as percentages across all included studies.
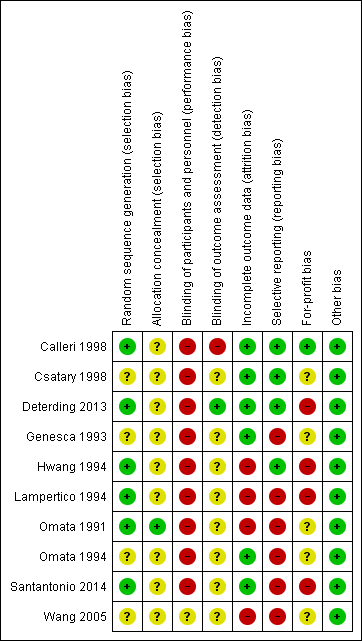
Risk of bias summary: review authors' judgements about each risk of bias item for each included study.
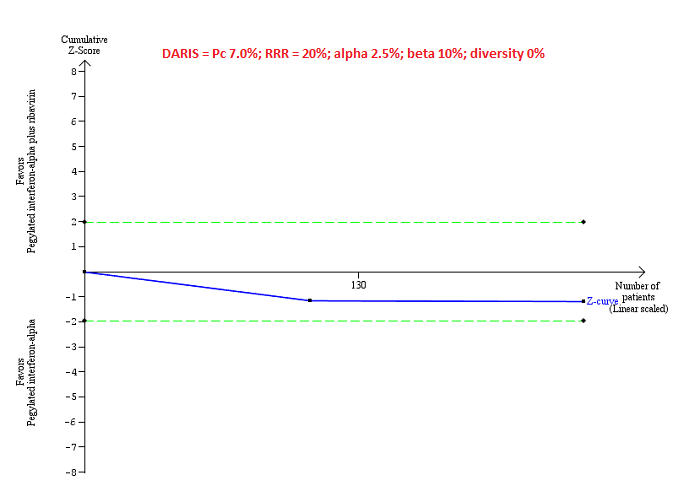
Trial Sequential Analysis of serious adverse events (proportion) for pegylated interferon‐alpha plus ribavirin versus pegylated interferon‐alpha performed using an alpha error of 2.5%, power of 90% (beta error of 10%), relative risk reduction (RRR) of 20%, control group proportion observed in trials (Pc = 7%), and observed heterogeneity in the trials (0%) shows that the accrued sample size was only a small fraction of the diversity‐adjusted required information size (DARIS); so the trial sequential monitoring boundaries were not drawn. The Z‐curve (blue line) does not cross the conventional boundaries (dotted green line). There was a high risk of random errors.
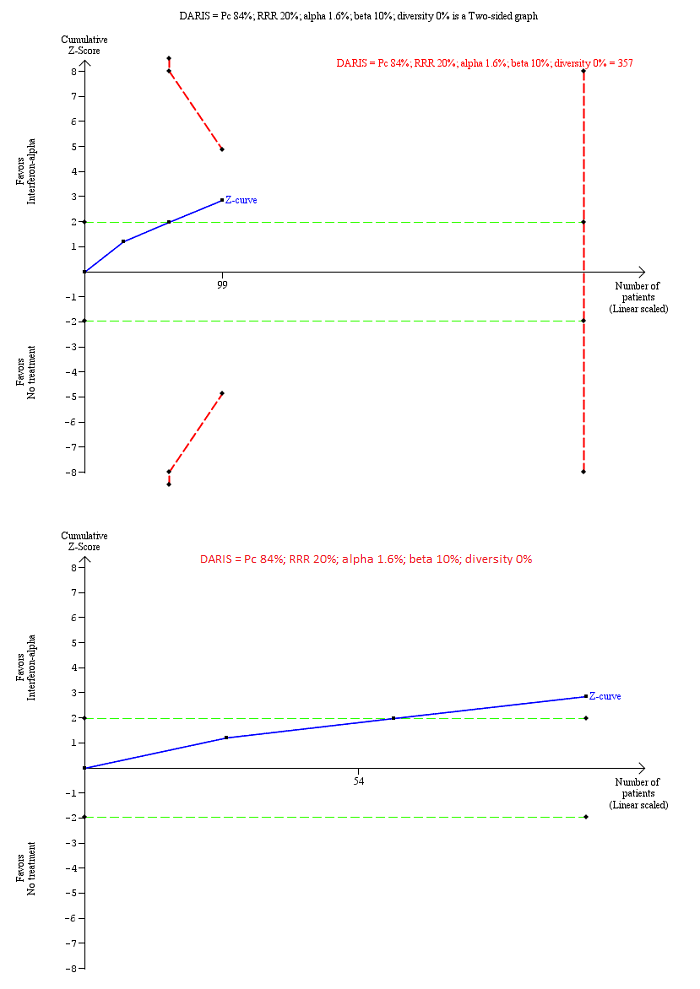
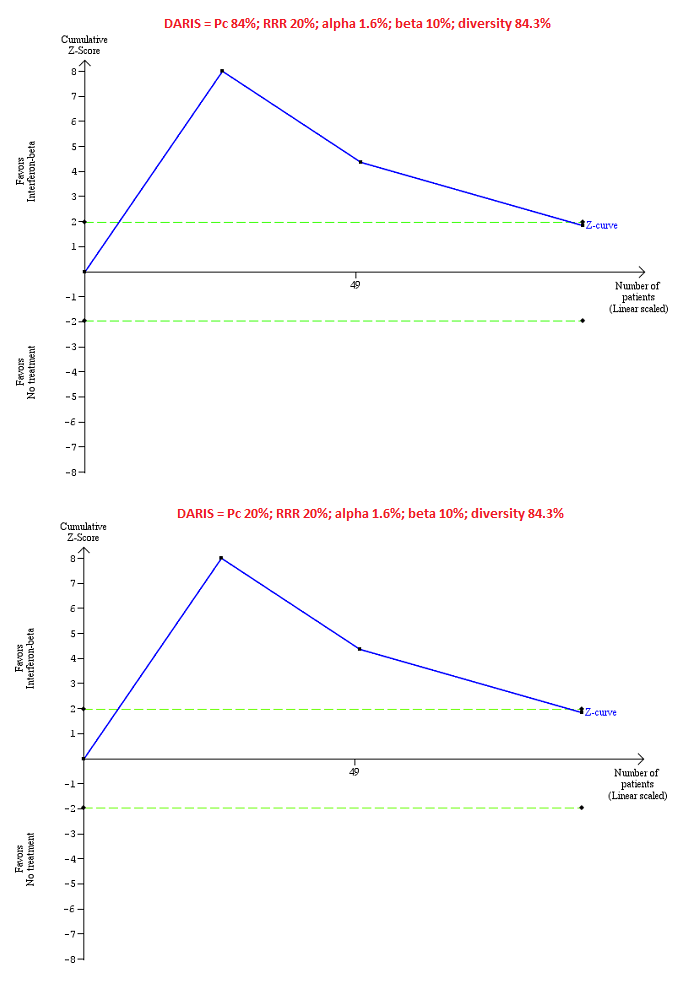
Trial Sequential Analysis of chronic hepatitis C virus for interferon‐alpha versus no intervention was performed using an alpha error of 1.6%, power of 90% (beta error of 10%), relative risk reduction (RRR) of 20%, control group proportion observed in trials (Pc = 84%; upper figure) and Pc = 20% (lower figure), and observed diversity in the trials (0%). The upper figure with Pc = 84% shows that the accrued sample size was only a small fraction of the diversity‐adjusted required information size (DARIS). The Z‐curve (blue line) crosses the conventional boundaries (dotted green line), but it does not cross any of the trial sequential monitoring boundaries (dotted red lines). The lower figure with Pc = 20% shows that the accrued sample size was so small that trial sequential monitoring boundaries were not drawn. There is a high risk of random errors.
Trial Sequential Analysis of chronic hepatitis C virus for interferon‐beta versus no intervention performed using an alpha error of 1.6%, power of 90% (beta error of 10%), relative risk reduction (RRR) of 20%, control group proportion observed in the trials (Pc = 84%; upper figure) and a Pc of 20% (lower figure), and observed heterogeneity in the trials (84%) shows that the accrued sample size was only a small fraction of the diversity‐adjusted required information size (DARIS); so the trial sequential monitoring boundaries were not drawn. The Z‐curve (blue line) crosses the conventional boundaries (dotted green line). There is a high risk of random errors.

Trial Sequential Analysis of chronic hepatitis C virus infection for pegylated interferon‐alpha plus ribavirin versus pegylated interferon‐alpha performed using an alpha error of 1.6%, power of 90% (beta error of 10%), relative risk reduction (RRR) of 20% (top figure and bottom figure) and 10% (middle figure), control group proportion observed in the trials (Pc = 84%; top figure and middle figure) and Pc = 20% (bottom figure), and observed heterogeneity in the trials (0%) shows that the Z‐curve (blue line) has reached the zone of futility for a RRR of 20% (top figure). However, when a RRR of 10% or when a Pc = 20% was used, the accrued sample size was only a small fraction of the diversity adjusted required information size (DARIS); the Z‐curve (blue line) does not cross the conventional boundaries (dotted green line) or trial sequential monitoring boundaries (dotted red line) (middle figure). For a Pc = 20%, the accrued sample size was so small that the trial sequential monitoring boundaries were not drawn. There is a high risk of random errors.

Comparison 1 Intervention versus control, Outcome 1 Serious adverse events (proportion).

Comparison 1 Intervention versus control, Outcome 2 Serious adverse events (number).
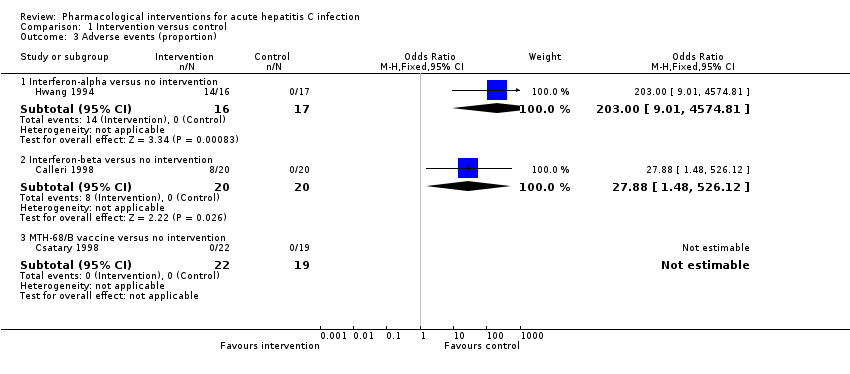
Comparison 1 Intervention versus control, Outcome 3 Adverse events (proportion).

Comparison 1 Intervention versus control, Outcome 4 Adverse events (number).
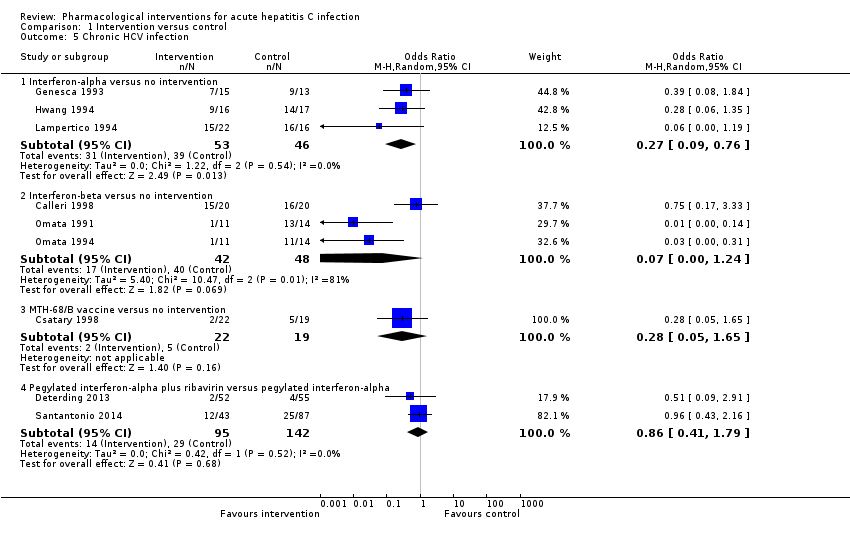
Comparison 1 Intervention versus control, Outcome 5 Chronic HCV infection.
| Intervention versus no intervention or control intervention (control) for acute hepatitis C infection: primary outcomes | |||||
| Patient or population: people with acute hepatitis C infection Intervention: multiple Control: multiple Settings: secondary or tertiary care | |||||
| Outcomes | Illustrative comparative risks* (95% CI) | Relative effect | No of participants | Quality of the evidence | |
| Assumed risk | Corresponding risk | ||||
| Control | Intervention | ||||
| Mortality: there was 1 mortality within 6 months (in the pegylated interferon‐alpha group (1/95 = 1.1%). There was no mortality in the remaining groups. There was no further mortality in the trials which reported mortality until maximal follow‐up. | |||||
| Serious adverse events: there were no serious adverse events in either group in the comparisons interferon‐beta versus control and MH‐68/B vaccine versus control. Trials in interferon‐alpha versus control did not report serious adverse events. | |||||
| Serious adverse events (proportion) ‐ pegylated interferon‐alpha plus ribavirin versus pegylated interferon‐alpha | 70 per 1000 | 115 per 1000 | OR 1.72 | 237 | ⊕⊝⊝⊝ |
| Serious adverse events (number) ‐ pegylated interferon‐alpha plus ribavirin versus pegylated interferon‐alpha | 92 per 1000 | 251 per 1000 | Rate ratio 2.74 | 237 | ⊕⊝⊝⊝ |
| Adverse events (proportion) ‐ interferon‐alpha versus no intervention | 10 per 1000 | 672 per 1000 | OR 203 | 33 | ⊕⊝⊝⊝ |
| Adverse events (proportion) ‐ interferon‐beta versus no intervention | 10 per 1000 | 220 per 1000 | OR 27.88 | 40 | ⊕⊝⊝⊝ |
| Adverse events: there were no adverse events in the comparison MTH‐68/B vaccine versus control. The number of adverse events was not reported for the comparison interferon‐alpha versus control. The proportion of people with adverse events and number of adverse events was not reported for the comparison pegylated interferon‐alpha plus ribavirin versus pegylated interferon‐alpha. | |||||
| Adverse events (number) ‐ interferon‐beta versus no intervention | 10 per 1000 | 147 per 1000 | OR 17 | 40 | ⊕⊝⊝⊝ |
| Health‐related quality of life | None of the trials reported this outcome. | ||||
| None of the trials reported health‐related quality of life, cirrhosis, decompensated liver disease, liver transplantation, or hepatocellular carcinoma. | |||||
| *The basis for the assumed risk is the mean control group proportion (or control group rate) unless there were no events in the control group when the control group proportion (or control group rate) was considered as 1%. The corresponding risk (and its 95% confidence interval) is based on the assumed risk in the comparison group and the relative effect of the intervention (and its 95% CI). CI: confidence interval; OR: odds ratio; RCT: randomised clinical trial. | |||||
| GRADE Working Group grades of evidence | |||||
| 1 Downgraded 2 levels for high risk of bias. | |||||
| Intervention versus no intervention or control intervention (control) for acute hepatitis C infection: secondary outcomes | |||||
| Patient or population: people with acute hepatitis C infection Intervention: multiple (see below) Control: multiple (see below) Settings: secondary or tertiary care | |||||
| Outcomes | Illustrative comparative risks* (95% CI) | Relative effect | No of participants | Quality of the evidence | |
| Assumed risk | Corresponding risk | ||||
| Control | Intervention | ||||
| Liver transplantation | None of the trials reported this outcome. | ||||
| Decompensated liver disease | None of the trials reported this outcome. | ||||
| Cirrhosis | None of the trials reported this outcome. | ||||
| Hepatocellular carcinoma | None of the trials reported this outcome. | ||||
| Chronic HCV infection†‐ interferon‐alpha versus no intervention | 848 per 1000 | 601 per 1000 | OR 0.27 | 99 | ⊕⊝⊝⊝ |
| Chronic HCV infection†‐ interferon‐beta versus no intervention | 833 per 1000 | 259 per 1000 | OR 0.07 | 90 | ⊕⊝⊝⊝ |
| Chronic HCV infection†‐ MTH‐68/B vaccine versus no intervention | 263 per 1000 | 91 per 1000 | OR 0.28 | 41 | ⊕⊝⊝⊝ |
| Chronic HCV infection†‐ pegylated interferon‐alpha plus ribavirin versus pegylated interferon‐alpha | 204 per 1000 | 181 per 1000 | OR 0.86 | 237 | ⊕⊝⊝⊝ |
| *The basis for the assumed risk is the mean control group proportion. The corresponding risk (and its 95% confidence interval) is based on the assumed risk in the comparison group and the relative effect of the intervention (and its 95% CI). †Chronic HCV infection was measured by absence of sustained virological response (i.e. the presence of circulating virus at least 6 months after cessation of treatment). CI: confidence interval; HCV: hepatitis C virus; OR: odds ratio; RCT: randomised clinical trial. | |||||
| GRADE Working Group grades of evidence | |||||
| 1 Downgraded 2 levels for high risk of bias (i.e. within study risk of bias). | |||||
| Study name | Intervention | Control | Period of follow‐up (months) | Randomisation | Blinding of participants and healthcare professionals | Blinding of outcome assessors | Missing outcome bias | Selective outcome reporting bias | For‐profit bias |
| Interferon‐alpha | No intervention | 12 | Unclear | High | Unclear | Low | High | Unclear | |
| Interferon‐alpha | No intervention | 12 | Unclear | High | Unclear | High | Low | High | |
| Interferon‐alpha | No intervention | 18 | Unclear | High | Unclear | High | High | High | |
| Interferon‐beta | No intervention | 36 | Low | High | Unclear | High | High | Unclear | |
| Interferon‐beta | No intervention | 36 | Unclear | High | Unclear | Low | High | Unclear | |
| Interferon‐beta | No intervention | 22.5 | Unclear | High | High | Low | Low | Low | |
| MTH‐68/B vaccine | No intervention | 12 | Unclear | High | Unclear | Low | Low | Unclear | |
| Pegylated interferon‐alpha | No intervention | 6 | Unclear | Unclear | Unclear | High | High | Unclear | |
| Pegylated interferon‐alpha | Pegylated interferon‐alpha plus ribavirin | 6 | Unclear | High | Low | High | Low | High | |
| Pegylated interferon‐alpha | Pegylated interferon‐alpha plus ribavirin | 12 | Unclear | High | Unclear | Low | High | High |
| Outcome or subgroup title | No. of studies | No. of participants | Statistical method | Effect size |
| 1 Serious adverse events (proportion) Show forest plot | 4 | Odds Ratio (M‐H, Fixed, 95% CI) | Subtotals only | |
| 1.1 Interferon‐beta versus no intervention | 1 | 40 | Odds Ratio (M‐H, Fixed, 95% CI) | 0.0 [0.0, 0.0] |
| 1.2 MTH‐68/B vaccine versus no intervention | 1 | 41 | Odds Ratio (M‐H, Fixed, 95% CI) | 0.0 [0.0, 0.0] |
| 1.3 Pegylated interferon‐alpha plus ribavirin versus pegylated interferon‐alpha | 2 | 237 | Odds Ratio (M‐H, Fixed, 95% CI) | 1.72 [0.70, 4.21] |
| 2 Serious adverse events (number) Show forest plot | 4 | Rate Ratio (Fixed, 95% CI) | Subtotals only | |
| 2.1 Interferon‐beta versus no intervention | 1 | 40 | Rate Ratio (Fixed, 95% CI) | 0.0 [0.0, 0.0] |
| 2.2 MTH‐68/B vaccine versus no intervention | 1 | 41 | Rate Ratio (Fixed, 95% CI) | 0.0 [0.0, 0.0] |
| 2.3 Pegylated interferon‐alpha plus ribavirin versus pegylated interferon‐alpha | 2 | 237 | Rate Ratio (Fixed, 95% CI) | 2.74 [1.40, 5.33] |
| 3 Adverse events (proportion) Show forest plot | 3 | Odds Ratio (M‐H, Fixed, 95% CI) | Subtotals only | |
| 3.1 Interferon‐alpha versus no intervention | 1 | 33 | Odds Ratio (M‐H, Fixed, 95% CI) | 203.0 [9.01, 4574.81] |
| 3.2 Interferon‐beta versus no intervention | 1 | 40 | Odds Ratio (M‐H, Fixed, 95% CI) | 27.88 [1.48, 526.12] |
| 3.3 MTH‐68/B vaccine versus no intervention | 1 | 41 | Odds Ratio (M‐H, Fixed, 95% CI) | 0.0 [0.0, 0.0] |
| 4 Adverse events (number) Show forest plot | 2 | Odds Ratio (Fixed, 95% CI) | Subtotals only | |
| 4.1 Interferon‐beta versus no intervention | 1 | 40 | Odds Ratio (Fixed, 95% CI) | 17.00 [0.98, 294.53] |
| 4.2 MTH‐68/B vaccine versus no intervention | 1 | 41 | Odds Ratio (Fixed, 95% CI) | 0.0 [0.0, 0.0] |
| 5 Chronic HCV infection Show forest plot | 9 | Odds Ratio (M‐H, Random, 95% CI) | Subtotals only | |
| 5.1 Interferon‐alpha versus no intervention | 3 | 99 | Odds Ratio (M‐H, Random, 95% CI) | 0.27 [0.09, 0.76] |
| 5.2 Interferon‐beta versus no intervention | 3 | 90 | Odds Ratio (M‐H, Random, 95% CI) | 0.07 [0.00, 1.24] |
| 5.3 MTH‐68/B vaccine versus no intervention | 1 | 41 | Odds Ratio (M‐H, Random, 95% CI) | 0.28 [0.05, 1.65] |
| 5.4 Pegylated interferon‐alpha plus ribavirin versus pegylated interferon‐alpha | 2 | 237 | Odds Ratio (M‐H, Random, 95% CI) | 0.86 [0.41, 1.79] |