Scolaris Content Display Scolaris Content Display

Study Flow Diagram
Figuras y tablas -
Figure 1

Study Flow Diagram

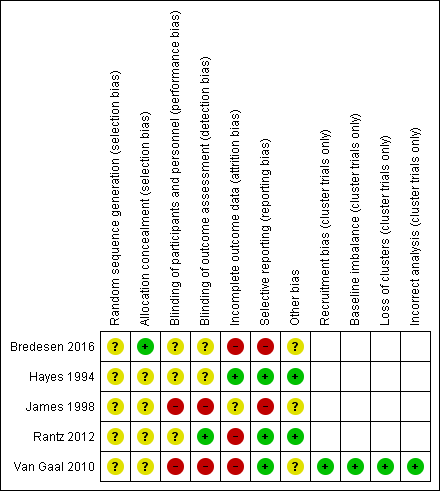
Risk of bias summary: review authors' judgements about each risk of bias item for each included study
Figuras y tablas -
Figure 2

Risk of bias summary: review authors' judgements about each risk of bias item for each included study

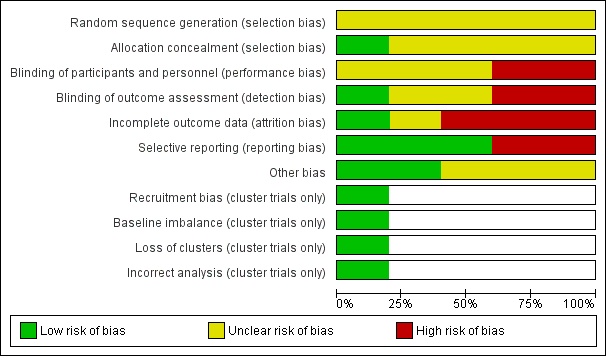
Risk of bias graph: review authors' judgements about each risk of bias item presented as percentages across all included studies
Figuras y tablas -
Figure 3

Risk of bias graph: review authors' judgements about each risk of bias item presented as percentages across all included studies

Comparison 1 Education versus no education, Outcome 1 Knowledge hospital group.
Figuras y tablas -
Analysis 1.1

Comparison 1 Education versus no education, Outcome 1 Knowledge hospital group.

Comparison 1 Education versus no education, Outcome 2 Knowledge nursing‐home group.
Figuras y tablas -
Analysis 1.2

Comparison 1 Education versus no education, Outcome 2 Knowledge nursing‐home group.

Comparison 2 Training, monitoring and observation vs monitoring and observation, Outcome 1 Pressure ulcer developed.
Figuras y tablas -
Analysis 2.1

Comparison 2 Training, monitoring and observation vs monitoring and observation, Outcome 1 Pressure ulcer developed.

Comparison 3 Training monitoring and observation vs observation alone, Outcome 1 Pressure ulcer developed.
Figuras y tablas -
Analysis 3.1

Comparison 3 Training monitoring and observation vs observation alone, Outcome 1 Pressure ulcer developed.

Comparison 4 Monitoring and observation vs observation alone, Outcome 1 Pressure ulcer developed.
Figuras y tablas -
Analysis 4.1

Comparison 4 Monitoring and observation vs observation alone, Outcome 1 Pressure ulcer developed.

Comparison 5 Education via didactic lecture versus video, Outcome 1 Knowledge.
Figuras y tablas -
Analysis 5.1

Comparison 5 Education via didactic lecture versus video, Outcome 1 Knowledge.

Comparison 6 E‐learning versus classroom teaching, Outcome 1 Correct classification of pressure ulcer photographs.
Figuras y tablas -
Analysis 6.1

Comparison 6 E‐learning versus classroom teaching, Outcome 1 Correct classification of pressure ulcer photographs.

Summary of findings for the main comparison. Education compared to no education for preventing pressure ulcers

Education compared to no education for preventing pressure ulcers

Patient or population: staff caring for patients at risk of pressure ulcers
Settings: hospital and nursing homes
Intervention: education
Comparison: no education

Outcomes

Illustrative comparative risks* (95% CI)

Relative effect
(95% CI)

No of participants
(studies)

Quality of the evidence
(GRADE)

Comments

Assumed risk

Corresponding risk

No education

Education

Knowledge in hospital group

Mean knowledge score with no education was 5.7

Mean knowledge score was 0.30 units higher (1.0 lower to 1.6 higher)

10
(1 study)

⊕⊝⊝⊝
very low1

It is uncertain whether there is a difference in health professionals' knowledge depending on whether they receive education or no education on pressure ulcer prevention

Knowledge in nursing‐home group

Mean knowledge score with no education was 5.1

Mean knowledge score was 0.30 units higher (0.77 lower to 1.37 higher)

10
(1 study)

⊕⊝⊝⊝
very low1

Change in health professionals' clinical behaviour

Not reported

Incidence of new pressure ulcers

Not reported

Severity of pressure ulcers

Not reported

Patient‐reported outcomes

Not reported

Carer‐reported outcomes

Not reported

*The basis for the assumed risk (e.g. the median control group risk across studies) is provided in footnotes. The corresponding risk (and its 95% confidence interval) is based on the assumed risk in the comparison group and the relative effect of the intervention (and its 95% CI).
CI: Confidence interval

GRADE Working Group grades of evidence

High quality: we are very confident that the true effect lies close to that of the estimate of the effect

Moderate quality: we are moderately confident in the effect estimate; the true effect is likely to be close to the estimate of effect, but there is a possibility that it is substantially different

Low quality: we are moderately confident in the effect estimate; the true effect is likely to be close to the estimate of effect, but there is a possibility that it is substantially different

Very low quality: we have very little confidence in the effect estimate; the true effect is likely to be substantially different from the estimate of effect

1Downgraded four times: serious limitations due to performance bias, detection bias and attrition bias; indirectness due to use of a non validated instrument to assess knowledge; serious imprecision due to a wide confidence interval and small sample size.

Figuras y tablas -
Summary of findings for the main comparison. Education compared to no education for preventing pressure ulcers
Summary of findings 2. Training, monitoring and observation compared to monitoring and observation for preventing pressure ulcers

Training, monitoring and observation compared to monitoring and observation for preventing pressure ulcers

Patient or population: staff caring for patients at risk of pressure ulcers
Settings: nursing homes
Intervention: training, monitoring and observation
Comparison: monitoring and observation

Outcomes

Illustrative comparative risks* (95% CI)

Relative effect
(95% CI)

No of participants
(studies)

Quality of the evidence
(GRADE)

Comments

Assumed risk

Corresponding risk

Monitoring and observation

Training, monitoring and observation

Change in health professionals' knowledge

Not reported

Change in health professionals' clinical behaviour

Not reported

Incidence of new pressure ulcers

Study population

RR 0.63
(0.37 to 1.05)

345
(1 study)

⊕⊝⊝⊝
very low1

It is uncertain whether there is a difference in pressure ulcer incidence when using different components of educational intervention such as training, monitoring and observation compared with monitoring and observation

183 per 1000

115 per 1000
(68 to 192)

Severity of new pressure ulcers

No data were presented by the study author

Patient‐reported outcomes

Insufficient data within the study report to further interrogate this outcome

Carer‐reported outcomes

Insufficient data within the study report to further interrogate this outcome

*The basis for the assumed risk (e.g. the median control group risk across studies) is provided in footnotes. The corresponding risk (and its 95% confidence interval) is based on the mean risk in the comparison group and the relative effect of the intervention (and its 95% CI).
CI: confidence interval; RR: risk ratio

GRADE Working Group grades of evidence

High quality: we are very confident that the true effect lies close to that of the estimate of the effect

Moderate quality: we are moderately confident in the effect estimate; the true effect is likely to be close to the estimate of effect, but there is a possibility that it is substantially different

Low quality: we are moderately confident in the effect estimate; the true effect is likely to be close to the estimate of effect, but there is a possibility that it is substantially different

Very low quality: we have very little confidence in the effect estimate; the true effect is likely to be substantially different from the estimate of effect

1Downgraded three times: very serious limitations due to performance, detection and reporting bias; serious imprecision due to wide confidence interval.

Figuras y tablas -
Summary of findings 2. Training, monitoring and observation compared to monitoring and observation for preventing pressure ulcers
Summary of findings 3. Training, monitoring and observation compared to observation alone for preventing pressure ulcers

Training, monitoring and observation compared to observation alone for preventing pressure ulcers

Patient or population: staff caring for patients at risk of pressure ulcers
Settings: nursing homes
Intervention: training, monitoring and observation
Comparison: observation alone

Outcomes

Illustrative comparative risks* (95% CI)

Relative effect
(95% CI)

No of participants
(studies)

Quality of the evidence
(GRADE)

Comments

Assumed risk

Corresponding risk

Observation alone

Training monitoring and observation

Change in health professionals' knowledge

Not reported

Change in health professionals' clinical behaviour

Not reported

Incidence of new pressure ulcers

Study population

RR 1.21
(0.6 to 2.43)

325
(1 study)

⊕⊝⊝⊝
very low1

It is uncertain whether there is a difference in pressure ulcer incidence when using different components of educational intervention such as training, monitoring and observation compared with observation alone

94 per 1000

114 per 1000
(57 to 229)

Severity of new pressure ulcers

Not reported

Patient‐reported outcomes

Insufficient data within the study report to further interrogate this outcome

Carer‐reported outcomes

Insufficient data within the study report to further interrogate this outcome

*The basis for the assumed risk (e.g. the median control group risk across studies) is provided in footnotes. The corresponding risk (and its 95% confidence interval) is based on the mean risk in the comparison group and the relative effect of the intervention (and its 95% CI).
CI: confidence interval; RR: risk ratio

GRADE Working Group grades of evidence

High quality: we are very confident that the true effect lies close to that of the estimate of the effect

Moderate quality: we are moderately confident in the effect estimate; the true effect is likely to be close to the estimate of effect, but there is a possibility that it is substantially different

Low quality: we are moderately confident in the effect estimate; the true effect is likely to be close to the estimate of effect, but there is a possibility that it is substantially different

Very low quality: we have very little confidence in the effect estimate; the true effect is likely to be substantially different from the estimate of effect

1Downgraded three times: very serious limitations due to performance, detection and reporting bias; serious imprecision due to wide confidence interval.

Figuras y tablas -
Summary of findings 3. Training, monitoring and observation compared to observation alone for preventing pressure ulcers
Summary of findings 4. Monitoring and observation compared to observation alone for preventing pressure ulcers

Monitoring and observation compared to observation alone for preventing pressure ulcers

Patient or population: staff caring for patients at risk of pressure ulcers
Settings: nursing homes
Intervention: monitoring and observation
Comparison: observation alone

Outcomes

Illustrative comparative risks* (95% CI)

Relative effect
(95% CI)

No of participants
(studies)

Quality of the evidence
(GRADE)

Comments

Assumed risk

Corresponding risk

Observation alone

Monitoring and observation

Change in health professionals' knowledge

Not reported

Change in health professionals' clinical behaviour

Not reported

Incidence of new pressure ulcers

Study population

RR 1.93
(0.96 to 3.88)

232
(1 study)

⊕⊝⊝⊝
very low1

It is uncertain whether there is a difference in pressure ulcer incidence when using different components of educational intervention such as monitoring and observation compared with observation alone

94 per 1000

182 per 1000
(91 to 366)

Severity of new pressure ulcers

No data are presented by the study author

Patient reported outcomes

Insufficient data within the study report to further interrogate this outcome

Carer reported outcomes

Insufficient data within the study report to further interrogate this outcome

*The basis for the assumed risk (e.g. the median control group risk across studies) is provided in footnotes. The corresponding risk (and its 95% confidence interval) is based on the mean risk in the comparison group and the relative effect of the intervention (and its 95% CI).
CI: confidence interval; RR: risk ratio

GRADE Working Group grades of evidence

High quality: we are very confident that the true effect lies close to that of the estimate of the effect

Moderate quality: we are moderately confident in the effect estimate; the true effect is likely to be close to the estimate of effect, but there is a possibility that it is substantially different

Low quality: we are moderately confident in the effect estimate; the true effect is likely to be close to the estimate of effect, but there is a possibility that it is substantially different

Very low quality: we have very little confidence in the effect estimate; the true effect is likely to be substantially different from the estimate of effect

1Downgraded three times: very serious limitation due to performance, detection and reporting bias; serious imprecision due to wide confidence interval.

Figuras y tablas -
Summary of findings 4. Monitoring and observation compared to observation alone for preventing pressure ulcers
Summary of findings 5. Didactic education versus video education for preventing pressure ulcers

Education versus video for preventing pressure ulcers

Patient or population: staff caring for patients at risk of pressure ulcers
Settings: urban acute care hospital
Intervention: video education

Comparison: didactic lecture

Outcomes

Illustrative comparative risks* (95% CI)

Relative effect
(95% CI)

No of participants
(studies)

Quality of the evidence
(GRADE)

Comments

Assumed risk

Corresponding risk

Didactic education

Video education

Change in health professionals' knowledge

Mean knowledge score with

didactic education was 84.62

Mean knowledge score was 4.60 units higher (3.8 units to 6.12 units higher)

102
(1 study)

⊕⊝⊝⊝
very low1

It is uncertain whether education delivered in different formats such as didactic or video‐based format makes a difference to health professionals' knowledge of pressure ulcer prevention

Change in health professionals' clinical behaviour

Not reported

Incidence of new pressure ulcers

Not reported

Severity of pressure ulcers

Not reported

Patient‐reported outcomes

Not reported

Carer‐reported outcomes

Not reported

*The basis for the assumed risk (e.g. the median control group risk across studies) is provided in footnotes. The corresponding risk (and its 95% confidence interval) is based on the mean risk in the comparison group and the relative effect of the intervention (and its 95% CI).
CI: Confidence interval;

GRADE Working Group grades of evidence

High quality: we are very confident that the true effect lies close to that of the estimate of the effect

Moderate quality: we are moderately confident in the effect estimate; the true effect is likely to be close to the estimate of effect, but there is a possibility that it is substantially different

Low quality: we are moderately confident in the effect estimate; the true effect is likely to be close to the estimate of effect, but there is a possibility that it is substantially different

Very low quality: we have very little confidence in the effect estimate; the true effect is likely to be substantially different from the estimate of effect

1Downgraded three times: serious limitation due to unclear risk of selection, performance and detection bias; very serious imprecision due to small sample size and wide confidence intervals.

Figuras y tablas -
Summary of findings 5. Didactic education versus video education for preventing pressure ulcers
Summary of findings 6. E‐learning versus classroom education for preventing pressure ulcers

E‐learning compared with classroom education for preventing pressure ulcers

Patient or population: staff caring for patients at risk of pressure ulcers

Settings: hospitals and nursing homes

Intervention: e‐learning

Comparison: classroom education

Outcomes

Illustrative comparative risks* (95% CI)

Relative effect
(95% CI)

No of participants
(studies)

Quality of the evidence
(GRADE)

Comments

Assumed risk

Corresponding risk

Classroom education

E‐learning

Knowledge of pressure ulcer

classification

Study population

RR 0.92 (0.80 to 1.07)

18 participants
(1 study)

very low1
⊕⊝⊝⊝

It is uncertain whether education delivered in different formats such as e‐learning or classroom‐based format makes a difference to health professionals' knowledge of pressure ulcer prevention

694 per 1000

638 per 1000
(555 to 742)

Change in health professionals' clinical behaviour

Not reported

Incidence of new pressure ulcers

Not reported

Severity of pressure ulcers

Not reported

Patient‐reported outcomes

Not reported

Carer‐reported outcomes

Not reported

*The basis for the assumed risk (e.g. the median control group risk across studies) is provided in footnotes. The corresponding risk (and its 95% confidence interval) is based on the mean risk in the comparison group and the relative effect of the intervention (and its 95% CI).
CI: confidence interval; RR: risk ratio

GRADE Working Group grades of evidence

High quality: we are very confident that the true effect lies close to that of the estimate of the effect

Moderate quality: we are moderately confident in the effect estimate; the true effect is likely to be close to the estimate of effect, but there is a possibility that it is substantially different

Low quality: we are moderately confident in the effect estimate; the true effect is likely to be close to the estimate of effect, but there is a possibility that it is substantially different

Very low quality: we have very little confidence in the effect estimate; the true effect is likely to be substantially different from the estimate of effect

1Downgraded three times: serious limitations due to high risk of attrition and selective reporting bias; unclear risk of performance, selection, detection and other bias; serious imprecision due to small sample size and wide confidence intervals.

Figuras y tablas -
Summary of findings 6. E‐learning versus classroom education for preventing pressure ulcers
Comparison 1. Education versus no education

Outcome or subgroup title

No. of studies

No. of participants

Statistical method

Effect size

1 Knowledge hospital group Show forest plot

1

Mean Difference (IV, Fixed, 95% CI)

Totals not selected

2 Knowledge nursing‐home group Show forest plot

1

Mean Difference (IV, Fixed, 95% CI)

Totals not selected

Figuras y tablas -
Comparison 1. Education versus no education
Comparison 2. Training, monitoring and observation vs monitoring and observation

Outcome or subgroup title

No. of studies

No. of participants

Statistical method

Effect size

1 Pressure ulcer developed Show forest plot

1

Risk Ratio (M‐H, Fixed, 95% CI)

Totals not selected

Figuras y tablas -
Comparison 2. Training, monitoring and observation vs monitoring and observation
Comparison 3. Training monitoring and observation vs observation alone

Outcome or subgroup title

No. of studies

No. of participants

Statistical method

Effect size

1 Pressure ulcer developed Show forest plot

1

Risk Ratio (M‐H, Fixed, 95% CI)

Totals not selected

Figuras y tablas -
Comparison 3. Training monitoring and observation vs observation alone
Comparison 4. Monitoring and observation vs observation alone

Outcome or subgroup title

No. of studies

No. of participants

Statistical method

Effect size

1 Pressure ulcer developed Show forest plot

1

Risk Ratio (M‐H, Fixed, 95% CI)

Totals not selected

Figuras y tablas -
Comparison 4. Monitoring and observation vs observation alone
Comparison 5. Education via didactic lecture versus video

Outcome or subgroup title

No. of studies

No. of participants

Statistical method

Effect size

1 Knowledge Show forest plot

1

Mean Difference (IV, Fixed, 95% CI)

Totals not selected

Figuras y tablas -
Comparison 5. Education via didactic lecture versus video
Comparison 6. E‐learning versus classroom teaching

Outcome or subgroup title

No. of studies

No. of participants

Statistical method

Effect size

1 Correct classification of pressure ulcer photographs Show forest plot

1

Risk Ratio (M‐H, Fixed, 95% CI)

Totals not selected

Figuras y tablas -
Comparison 6. E‐learning versus classroom teaching