Program penyelarasan kembali bekerja untuk menambahbaik kembali bekerja dalam kalangan pekerja bercuti sakit.
Abstract
Background
To limit long‐term sick leave and associated consequences, insurers, healthcare providers and employers provide programmes to facilitate disabled people's return to work. These programmes include a variety of coordinated and individualised interventions. Despite the increasing popularity of such programmes, their benefits remain uncertain. We conducted a systematic review to determine the long‐term effectiveness of return‐to‐work coordination programmes compared to usual practice in workers at risk for long‐term disability.
Objectives
To assess the effects of return‐to‐work coordination programmes versus usual practice for workers on sick leave or disability.
Search methods
We searched the Cochrane Central Register of Controlled Trials (CENTRAL; 2016, Issue 11), MEDLINE, Embase, CINAHL and PsycINFO up to 1 November 2016.
Selection criteria
We included randomised controlled trials (RCTs) that enrolled workers absent from work for at least four weeks and randomly assigned them to return‐to‐work coordination programmes or usual practice.
Data collection and analysis
Two review authors independently screened titles, abstracts and full‐text articles for study eligibility; extracted data; and assessed risk of bias from eligible trials. We contacted authors for additional data where required. We conducted random‐effects meta‐analyses and used the GRADE approach to rate the quality of the evidence.
Main results
We identified 14 studies from nine countries that enrolled 12,568 workers. Eleven studies focused on musculoskeletal problems, two on mental health and one on both. Most studies (11 of 14) followed workers 12 months or longer. Risk of bias was low in 10 and high in 4 studies, but findings were not sensitive to their exclusion.
We found no benefits for return‐to‐work coordination programmes on return‐to‐work outcomes.
For short‐term follow‐up of six months, we found no effect on time to return to work (hazard ratio (HR) 1.32, 95% confidence interval (CI) 0.93 to 1.88, low‐quality evidence), cumulative sickness absence (mean difference (MD) −16.18 work days per year, 95% CI −32.42 to 0.06, moderate‐quality evidence), the proportion of participants at work at end of the follow‐up (risk ratio (RR) 1.06, 95% CI 0.86 to 1.30, low‐quality evidence) or on the proportion of participants who had ever returned to work, that is, regardless of whether they had remained at work until last follow‐up (RR 0.87, 95% CI 0.63 to 1.19, very low‐quality evidence).
For long‐term follow‐up of 12 months, we found no effect on time to return to work (HR 1.25, 95% CI 0.95 to 1.66, low‐quality evidence), cumulative sickness absence (MD −14.84 work days per year, 95% CI −38.56 to 8.88, low‐quality evidence), the proportion of participants at work at end of the follow‐up (RR 1.06, 95% CI 0.99 to 1.15, low‐quality evidence) or on the proportion of participants who had ever returned to work (RR 1.03, 95% CI 0.97 to 1.09, moderate‐quality evidence).
For very long‐term follow‐up of longer than 12 months, we found no effect on time to return to work (HR 0.93, 95% CI 0.74 to 1.17, low‐quality evidence), cumulative sickness absence (MD 7.00 work days per year, 95% CI −15.17 to 29.17, moderate‐quality evidence), the proportion of participants at work at end of the follow‐up (RR 0.94, 95% CI 0.82 to 1.07, low‐quality evidence) or on the proportion of participants who had ever returned to work (RR 0.95, 95% CI 0.88 to 1.02, low‐quality evidence).
We found only small benefits for return‐to‐work coordination programmes on patient‐reported outcomes. All differences were below the minimal clinically important difference (MID).
Authors' conclusions
Offering return‐to‐work coordination programmes for workers on sick leave for at least four weeks results in no benefits when compared to usual practice. We found no significant differences for the outcomes time to return to work, cumulative sickness absence, the proportion of participants at work at end of the follow‐up or the proportion of participants who had ever returned to work at short‐term, long‐term or very long‐term follow‐up. For patient‐reported outcomes, we found only marginal effects below the MID. The quality of the evidence ranged from very low to moderate across all outcomes.
Ringkasan bahasa mudah
Keberkesanan penyelarasan program kembali bekerja bagi pekerja yang bercuti sakit.
Apakah matlamat ulasan ini?
Matlamat ulasan ini ialah untuk membandingkan kesan penyelarasan program kembali bekerja dengan amalan asal bagi pekerja yang bercuti sakit atau kurang upaya.
Mesej utama
Kami mendapati bahawa penyelarasan program kembali bekerja tiada kesan berbanding hasil amalan asal kembali bekerja. Hasil‐hasil tersebut adalah masa kembali bekerja, ketiadaan kerana sakit kumulatif, perkadaran pekerja di akhir susulan dan perkadaran yang kembali bekerja. Kami tidak menemui manfaat jangka pendek atau jangka panjang.
Kami hanya menemui manfaat yang kecil untuk hasil yang dilaporkan sendiri oleh pesakit. Kesemua kesan‐kesan tersebut adalah kecil dari perbezaan penting klinikal minima.
Apakah yang dikaji dalam ulasan ini?
Kembali bekerja selepas bercuti sakit jangka panjang penting bagi masyarakat, majikan dan pekerja itu sendiri. Intervensi yang mungkin untuk tujuan ini adalah penyelarasan program kembali bekerja, juga disebut pengurusan kes atau penjagaan bersama. Program‐program ini melibatkan kerjasama profesional kesihatan dengan pekerja untuk membantu menangani ketidakupayaan bekerja. Program penyelarasan kembali bekerja berbeza dari segi tempoh dan reka bentuk. Secara umumnya, ia melibatkan penilaian halangan yang menyekat kembalinya untuk bekerja dan pelan individu untuk melenyapkan halangan dan mengembalikan pekerja untuk bekerja. Komponen rawatan mungkin termasuk kaunseling, terapi fizikal atau pekerjaan dan penjagaan pakar.
Penyelarasan program kembali bekerja memerlukan sumber yang banyak. Namun, keberkesanannya adalah tidak pasti.
Apakah keputusan utama ulasan?
Kami melibatkan 14 kajian rawak terkawal yang merangkumi 12,568 pekerja dengan masalah rangka otot dan kesihatan mental. Pekerja hendaklah bercuti sakit untuk sekurang‐kurangnya empat minggu.
Bagi susulan jangka pendek enam bulan, penyelarasan program kembali bekerja mungkin memberi kesan yang kecil atau tiada perbezaan langsung bagi masa kembali bekerja (bukti kualiti rendah), mungkin memberi kesan kecil atau tiada perbezaan ketiadaan akibat sakit kumulatif (bukti kuailiti sederhana), mungkin memberi kesan kecil atau tiada perbezaan perkadaran peserta bekerja di akhir susulan (bukti berkualiti rendah). Akhirnya, kami tidak pasti sama ada program tersebut menambahbaik perkadaran peserta yang kembali bekerja kerana kualiti bukti dinilai sebagai sangat rendah.
Bagi susulan jangka panjang 12 bulan, penyelarasan program kembali bekerja mungkin memberi kesan kecil atau tiada perbezaan bagi masa kembali bekerja, ketiadaan akibat sakit kumulaif atau perkadaran peserta bekerja di akhir susulan (semua bukti berkualiti rendah) dan ia hanya menunjukkan sedikit atau tiada perbezaan kepada perkadaran peserta yang kembali bekerja (bukti berkualiti sederhana).
Bagi susulan jangka panjang lebih dari 12 bulan, penyelarasan program kembali bekerja mungkin memberi kesan kecil atau tiada perbezaan bagi masa kembali bekerja (bukti kualiti rendah), mungkin memberi kesan kecil atau tiada perbezaan ketiadaan akibat sakit kumulatif (bukti kuailiti sederhana), mungkin memberi kesan kecil atau tiada perbezaan perkadaran peserta bekerja di akhir susulan dan perkadaran peserta yang kembali bekerja (kedua‐dua bukti berkualiti rendah).
Kami hanya mendapati manfaat yang kecil bagi hasil laporan pesakit termasuk sakit, keupayaan berfungsi, murung dan kerisauan.Kesemua kesan adalah lebih kecil dari perbezaan penting klinikal minima.
Oleh kerana kami mendapati terlalu banyak bukti berkualiti rendah dan sangat rendah ini bermaksud kajian baru cenderung untuk mengubah keputusan tersebut.
Bagaimanakah untuk mengemaskini ulasan ini?
Kami mencari literatur saintifik sehingga 1 November 2016.
Authors' conclusions
Summary of findings
| Return to work coordination programmes compared to usual practice for improving return to work in workers on sick leave | |||||
| Patient or population: workers on sick leave | |||||
| Outcomes | Anticipated absolute effects* (95% CI) | Relative effect | № of participants | Quality of the evidence | |
| Risk with usual practice | Risk with return‐to‐work coordination programmes | ||||
| Time to return to work ‐ short‐term | — | — | HR 1.32 | 161 | ⊕⊕⊝⊝ |
| Time to return to work ‐ long‐term | — | — | HR 1.25 | 1935 | ⊕⊕⊝⊝ |
| Time to return to work ‐ very long‐term | — | — | HR 0.93 | 474 | ⊕⊕⊝⊝ |
| Cumulative sickness absence in work days ‐ short‐term | The mean cumulative sickness absence was 79.14 work days | The mean cumulative | — | 113 | ⊕⊕⊕⊝ |
| Cumulative sickness absence in work days ‐ long‐term | The mean cumulative sickness absence was 144 work days | The mean cumulative | — | 1339 | ⊕⊕⊝⊝ |
| Cumulative sickness absence in work days ‐ very long‐term | The mean cumulative sickness absence was 466 work days | The mean cumulative | — | 8052 | ⊕⊕⊕⊝ |
| Proportion at work at end of the follow‐up ‐ short‐term | 53 per 100 | 56 per 100 | RR 1.06 | 1388 | ⊕⊕⊝⊝ |
| Proportion at work at end of the follow‐up ‐ long‐term | 60 per 100 | 64 per 100 | RR 1.06 | 3061 | ⊕⊕⊝⊝ |
| Proportion at work at end of the follow‐up ‐ very long‐term | 53 per 100 | 49 per 100 | RR 0.94 | 815 | ⊕⊕⊝⊝ |
| Proportion who had ever returned to work ‐ short‐term | 57 per 100 | 49 per 100 | RR 0.87 | 675 | ⊕⊝⊝⊝ |
| Proportion who had ever returned to work ‐ long‐term | 69 per 100 | 71 per 100 | RR 1.03 | 3822 | ⊕⊕⊕⊝ |
| Proportion who had ever returned to work ‐ very long‐term | 75 per 100 | 71 per 100 | RR 0.95 | 938 | ⊕⊕⊝⊝ |
| *The risk in the intervention group (and its 95% confidence interval) is based on the assumed risk in the comparison group and the relative effect of the intervention (and its 95% CI). | |||||
| GRADE Working Group grades of evidence | |||||
| a Downgraded 1 level for risk of bias (attrition bias, reporting bias). | |||||
Background
Description of the condition
Most industrialised countries recognise long‐term sick leave as an increasing public health problem (Canadian Human Rights Commission 2007; Henderson 2005; OECD 2010), which affects society through loss of productivity and work disability claims (Arends 2012). NICE 2009 defines long‐term sick leave as an absence from work for at least four weeks.
Statistics from the Organisation for Economic Co‐operation and Development (OECD) countries show that 5.7% of the working age population (20 to 64 years of age) received disability benefits in 2010 (OECD 2014 a), ranging from 0.6% to 10.4% across countries. Mental health problems were the leading causes for sick leave, followed by musculoskeletal disorders (Arends 2012; Henderson 2005). For workers, long‐term sick leave implies health risks as well as occupational, social and economic deprivation (Henderson 2005; OECD 2003).
The duration of sick leave and the likelihood to return to work have an inverse relationship: being sick‐listed for six months or longer resulted in an 80% chance of remaining off work for five years (Waddell 2006). Once on disability benefits, people tend not to go back to work; they rather move onto another benefit or retire (OECD 2010).
Description of the intervention
To limit long‐term sick leave and associated consequences, insurers, healthcare providers and employers may provide special programmes that facilitate workers' return. These programmes run under a variety of names, such as case management, integrated or collaborative care, or return‐to‐work coordination programmes. They differ widely in content, set‐up and duration, and their components include a variety of interventions, such as occupational therapy, physiotherapy, psychological therapy, medical interventions, workplace ergonomics, education and social therapy. All components are individually adjusted to the worker's needs.
Despite increasing popularity, there is limited evidence regarding the short‐ and long‐term effectiveness and cost‐effectiveness of return‐to‐work programmes (Berchtold 2006; Hofmarcher 2007; NICE 2009; Palmer 2012).
How the intervention might work
Return‐to‐work programmes identify barriers that may prevent workers from successfully returning to work and assess their strengths and limitations. A designated coordinator then provides the worker with individually tailored interventions to overcome these barriers (Craig 2013).
Possible barriers are:
-
physical (e.g. a painful joint due to osteoarthritis, chronic obstructive lung disease);
-
mental (e.g. low resilience due to depression or a personality disorder);
-
functional (e.g. low endurance, minor flexibility to adapt to new situations, restricted range of motion);
-
workplace‐related (elements of the workplace may be unsuitable, e.g. lack of job autonomy); and
-
psychosocial (e.g. interpersonal problems with the supervisor, challenging family situation, burdening financial situation).
Early multidisciplinary interventions seem appropriate and promising ways to return people to work (Department for Work and Pensions 2013; Hoefsmit 2012).
Effective return‐to‐work coordination programmes depend on good communication between the various stakeholders (i.e. workers and their families, employers, supervisors, healthcare providers, and insurers) and on smooth coordination of the various components included in the programme. The return‐to‐work coordinator plays a pivotal role by ensuring communication and a joint understanding regarding expectations for all stakeholders (IWH 2007). Face‐to‐face contact between the worker and the return‐to‐work coordinator favours an optimal selection and implementation of the return‐to‐work interventions and intensifies the worker's accountability to the programme.
Why it is important to do this review
Long‐term sick leave results in serious consequences for individuals and other stakeholders as well as for the society at large. Return‐to‐work coordination programmes may respond to this challenge, but they represent complex and costly interventions requiring substantial human and financial resources. The sparse and heterogeneous evidence on their effectiveness calls for an investigation into their impact.
We published a former version of this review (Schandelmaier 2012). The importance and timeliness of the subject required an update with a new search for relevant studies.
Objectives
To assess the effects of return‐to‐work coordination programmes versus usual practice for workers on sick leave or disability.
Methods
Criteria for considering studies for this review
Types of studies
We included randomised controlled trials (RCTs) irrespective of their language of publication. We included studies reported as full text, those published as abstract only and unpublished data.
Types of participants
We included studies in adults of working age (16 to 65 years) who:
-
were on full‐ or part‐time sick leave continuously for at least four weeks or were receiving long‐term disability benefits; and
-
were employed at the time of sick‐listing.
At least 80% of the participants in a study had to fulfil both criteria. We included studies irrespective of the cause of sick leave or disability, the setting or the benefit scheme (e.g. private or government provider).
Types of interventions
Experimental intervention
We included trials comparing return‐to‐work coordination programmes to usual practice. No uniform definition of return‐to‐work coordination programmes exists. We defined such programmes as follows.
-
The objective is to promote return to work.
-
The return‐to‐work coordinator(s) and the affected worker have at least one face‐to‐face contact.
-
The process starts with an assessment of the worker's needs and leads to an individually tailored return‐to‐work plan.
-
The implementation of the return‐to‐work plan is managed by the return‐to‐work coordinator(s).
In our definition, 'individually tailored' implies a personalised set of actions directed at the worker, the employer, the workplace, or other factors in the return‐to‐work process. Adjustment to the needs of the worker within a pre‐defined action, such as individually tailored physical therapy, was not sufficient to meet the criterion. Consequently, the return‐to‐work plan had to allow for more than one possible action.
We included studies where public or private insurers offered return‐to‐work coordination programmes to people on sick leave due to impaired health ('in‐house programmes'). In addition, we considered return‐to‐work coordination programmes that could be contracted by insurers ('commissioned programmes'). We assumed that both have comparable effects as long as they share the goal of returning to work.
We excluded employer‐initiated return‐to‐work coordination programmes. Such programmes encounter fewer barriers in implementing workplace‐directed interventions than insurers or third‐party return‐to‐work coordinators and are typically not available for smaller companies.
Control intervention
We classified the level of support for the control groups as low, moderate or high. To get a better understanding of what usual practice in the different countries entailed, we contacted all authors and asked them to provide additional information.
We classified usual practice by a healthcare provider (e.g. a general practitioner or a physical therapist or other generally accessible rehabilitation professionals) as a low level of support. We classified conventional case management (e.g. as provided by the municipality or the insurer), usual sickness guidance by an occupational practitioner or a brief clinical intervention as a moderate level of support. We classified a clinical intervention in addition to a conventional case management as a high level of support.
Types of outcome measures
Primary outcomes
Our primary outcome of interest was return to work, which was measured in studies using several descriptive outcomes. We included studies that reported at least one of the following.
-
Time to return to work.
-
Cumulative sickness absence.
-
Proportion at work at end of the follow‐up.
-
Proportion ever returned to work.
Since almost all of the included studies reported on the outcome 'proportion of participants who had ever returned to work', we added it post hoc. This outcome captures workers who returned to work (for a defined time span) during the follow‐up time, regardless of whether they stayed at work or took sick leave again.
We further considered whether the individual returned to:
-
full‐time or part‐time work; and
-
the former or a modified occupation.
Secondary outcomes
If included studies provided data on patient‐reported outcomes, we collected the following.
-
Physical, mental, social or overall functioning.
-
Pain, depression and anxiety.
-
Quality of life.
-
Satisfaction of patients, employers, and social insurance organisations.
Search methods for identification of studies
Electronic searches
We conducted a systematic literature search to identify published and unpublished trials that could be eligible for inclusion in this review. We developed a search strategy for PubMed and then adapted it for use in the other electronic databases (Appendix 1; Appendix 2; Appendix 3; Appendix 4; Appendix 5). In order to avoid language bias, we used our international network to assess all non‐English language papers for potential inclusion in our review.
We searched the following electronic databases from their inception to 1 November 2016.
-
MEDLINE via PubMed (including the 'related citations' feature).
-
Embase.
-
CINAHL.
-
PsycINFO.
-
Cochrane Central Register of Controlled Trials (CENTRAL; 2016, Issue 11).
Searching other resources
We scanned the bibliographies of all eligible trials and other relevant publications, including reviews and meta‐analyses. For relevant publications that were listed in the Web of Science, we scanned citing articles with the 'times cited' feature.
Data collection and analysis
Selection of studies
Three authors (SS, NV, RK) independently screened the titles and abstracts of all identified citations and acquired full‐text articles that at least one author deemed potentially eligible. Subsequently, two authors (SS, NV) independently assessed the full‐text articles for eligibility; we resolved disagreements through discussion or by arbitration with a third author (RK). We identified and excluded duplicates and collated multiple reports of the same study so that each study rather than each report was the unit of interest. For details of excluded studies see Characteristics of excluded studies.
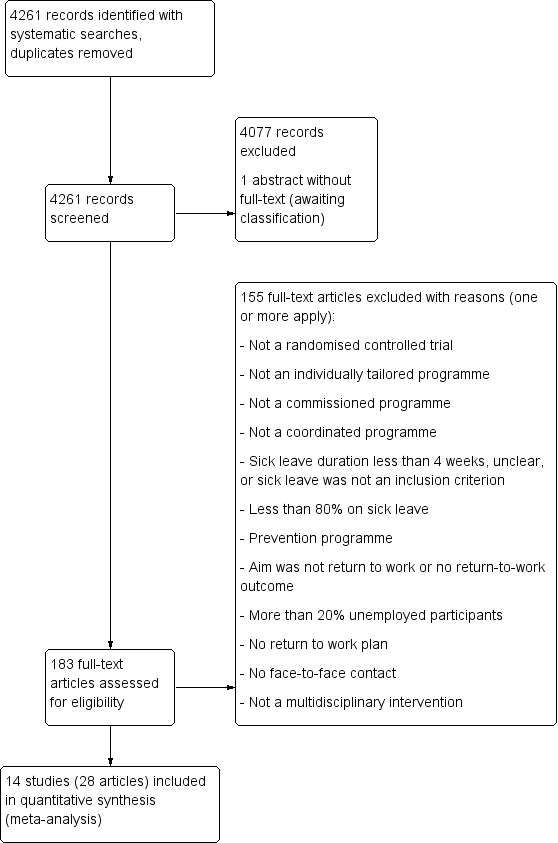
We recorded the selection process to complete a PRISMA flow diagram (Moher 2009). For details see Figure 1.

PRISMA Study flow diagram
Data extraction and management
Using a standardised form, we extracted the following data.
-
Characteristics of study design.
-
Setting.
-
Participants.
-
Study eligibility criteria.
-
Intervention details.
-
Outcomes.
-
Funding sources and stated conflicts of interest.
Two pairs of authors (SS, JB, SE, NV) independently extracted data and resolved disagreement by discussion or by arbitration with a third author (RK). If information was insufficient or uncertain for data extraction, we contacted the study authors for clarification.
One author (NV) transferred data into the Cochrane statistical software, Review Manager 5 (RevMan 2014); another author (TZ) cross‐checked the transferred data.
Assessment of risk of bias in included studies
Two authors (SS, NV) independently assessed all included studies for risk of bias using the Cochrane tool for assessing risk of bias (Higgins 2011). We referred to a third author (RK) to resolve disagreements. We evaluated the following risk of bias domains (Higgins 2011).
-
Sequence generation.
-
Allocation concealment.
-
Blinding.
-
Incomplete outcome data.
-
Selective outcome reporting.
-
Other sources of bias.
We further assessed cluster‐RCTs for recruitment bias and appropriate statistical analysis (Higgins 2011).
We modified the Cochrane tool for assessing risk of bias (Higgins 2011): the response options of 'definitely yes' and 'probably yes' conferred low risk of bias, while the response options of 'definitely no' and 'probably no' conferred high risk of bias (Akl 2012). We graded each potential source of bias as high, low or unclear and provided a quote from the study report together with a justification for our judgment in the 'Risk of bias' table. We considered random sequence generation, allocation concealment, selective outcome reporting and incomplete outcome data to be key domains. We judged a study to be at high risk of bias when we judged one or more key domains to be at high risk of bias. Conversely, we judged a study to have a low risk of bias when we judged low risk of bias for all key domains. We summarised the risk of bias judgments across different studies for each of the domains listed.
We assessed blinding of outcome assessment and completeness of data for return‐to‐work outcomes and patient‐reported outcomes separately. We judged studies to be at high risk of attrition bias if they had more than 15% losses to follow‐up for return‐to‐work outcomes.
We summarised and presented the results of our risk of bias assessment in Figure 2 and Figure 3 as described in the Cochrane Handbook for Systematic Reviews of Interventions (Higgins 2011). Where information on risk of bias related to unpublished data or correspondence with the author, we noted this in the 'Risk of bias' tables.

Risk of bias graph: review author's judgements about each risk of bias item presented as percentages across all included studies.

Risk of bias summary: review authors' judgements about each risk of bias item for each included study.
Assessment of bias in conducting the systematic review
We conducted the review according to our published protocol (Vogel 2015), reporting any deviations in the section Differences between protocol and review.
Measures of treatment effect
We entered outcome data for each study into the data tables in RevMan 2014 to calculate the treatment effects. We expressed dichotomous outcomes as risk ratios (RRs) and time‐to‐event outcomes as hazard ratios (HRs). We calculated absolute effects through risk differences (RDs). We recalculated sickness absence days in work days where necessary. For patient‐reported outcomes presented in different units, we transformed them into units on the scale of the most familiar instrument before pooling mean differences (MDs) (Thorlund 2011).
We used the minimal clinically important difference (MID) to improve the interpretation of patient‐reported outcomes (Johnston 2010). If studies reported only effect estimates and their 95% confidence intervals (CIs) or standard errors, we entered these data into RevMan 2014 using the generic inverse variance method. If studies with time‐to‐event outcomes failed to report HRs, we extracted individual patient data from survival curves, verified the extracted data by comparing the original plot with the plot derived from the extracted data, and then calculated the HRs and associated 95% CIs.
We considered longer‐lasting return to work to be the most important outcome. If we detected varying measures of return to work, we concentrated on the one that expressed long‐term outcome best. If available, we focused on outcomes with at least four weeks of lasting return to work, even if a longer interval might be more meaningful.
Unit of analysis issues
In the case of cluster‐RCTs, we followed the methods in the Cochrane Handbook for Systematic Reviews of Interventions (Higgins 2011). For studies that employed a cluster‐randomised design and that reported sufficient data to be included in the meta‐analysis but did not make an allowance for the design effect, we calculated the design effect based on a fairly large assumed intracluster correlation (ICC) of 0.10. We based this assumption of 0.10 being a realistic estimate by analogy on studies about implementation research (Campbell 2001).
Dealing with missing data
We contacted study authors to obtain data missing from their reports when necessary. If we could not obtain essential information within a reasonable time, we judged the respective risk of bias domain to be unclear. If we could not obtain numerical outcome data such as standard deviations (SD) or correlation coefficients, we calculated them from other available statistics such as P values according to the methods described in Higgins 2011. In case of missing values, we analysed the available data without imputations as a complete case analysis (Higgins 2011).
Assessment of heterogeneity
We assessed clinical homogeneity of the results of the included studied based on similarity of intervention, participants, outcome and follow‐up. We followed the algorithm provided by (Verbeek 2012). We considered participants as similar when they were of working age and on sick leave for at least four weeks. In the presence of statistical heterogeneity, we investigated differences between workers with musculoskeletal diseases and workers with mental health problems.
We considered interventions as similar when they were multidisciplinary return‐to‐work interventions tailored to the needs of the sick‐listed worker (as stated in Criteria for considering studies for this review). We considered outcome measures as similar when they reported on time to return to work, cumulative sickness absence, proportion of participants at work at a specific time point or proportion who had ever returned to work. We regarded short‐term (up to 6 months), long‐term (6 to 12 months) and very long‐term (longer than 12 months) follow‐up times as different.
We assessed heterogeneity by visual inspection of forest plots and by using the I² statistic. We then quantified the degree of heterogeneity as follows (Higgins 2011).
-
0% to 40% might not be important.
-
30% to 60% may represent moderate heterogeneity.
-
50% to 90% may represent substantial heterogeneity.
-
75% to 100% considerable heterogeneity.
In the presence of substantial heterogeneity and sufficient number of studies, we conducted subgroup analyses as described below (Subgroup analysis and investigation of heterogeneity).
Assessment of reporting biases
We tried to prevent reporting bias by searching across multiple databases and by including articles irrespective of their language. If we detected multiple articles on the same study, we extracted data only once. We assessed publication bias by funnel plots (Higgins 2011).
Data synthesis
We pooled data using the generic inverse variance method in RevMan 2014 according to Higgins 2011. If sufficient data were available, we performed a meta‐analysis. Since it is implausible that the true effect is the same in all considered studies, we considered a random‐effects model more appropriate for meta‐analyses. All our estimates include 95% CIs. For analyses not available within RevMan 2014, we used the R software (R 2015).
We expressed pooled effects of dichotomous outcomes as RRs and time‐to‐event outcomes as HRs. We calculated illustrative RDs by using the median baseline risk. We pooled effects of continuous outcomes as differences between group means (MDs). For patient‐reported outcomes, we calculated the proportion of patients who experienced an improvement greater than the MID ('substantial improvement') and pooled the RD (Thorlund 2011). If available, we used baseline‐adjusted effect estimates.
Subgroup analysis and investigation of heterogeneity
We planned to conduct subgroup analyses to detect different effects if we found at least 10 studies in a meta‐analysis. We specified the following a priori hypotheses for possible subgroup differences.
-
Methodology: trials with high risk of bias show larger effects.
-
Intervention: effects increase with return‐to‐work coordination programmes starting earlier (within three months) in the course of sick leave.
-
Intervention: effects increase with the involvement of the employers.
-
Controls: effects decrease with the intensity of support for the control group (ranging from no support to other form of return‐to‐work coordination programmes).
We were unable to carry out subgroup analyses; no meta‐analyses included 10 or more studies.
Sensitivity analysis
We performed a sensitivity analysis to test the robustness of our results by omitting studies with a high risk of bias.
Reaching conclusions
We based our conclusions only on findings from the quantitative synthesis of included studies for this review. We considered the different return‐to‐work outcomes as measurements of the same concept and based our conclusion on all of them. We avoided making recommendations for practice based on more than just the evidence, such as values and available resources. Our implications for research suggest priorities for future research and outline the remaining uncertainties in the area.
Summary of findings table
We used the GRADE approach as described in Higgins 2011 and present the quality of the evidence in the summary of findings Table for the main comparison.
Results
Description of studies
Results of the search
We identified 14 relevant RCTs and included them in our meta‐analyses. Figure 1 illustrates the details of the search.
Included studies
Study design
All of the 14 included studies were RCTs with a parallel design. Three studies were cluster‐RCTs (Donceel 1999; Van der Feltz‐Cornelis 2010; Volker 2015). See Characteristics of included studies for further details.
Participants
We included 12,568 participants, 30% of whom were women. The range of participants per study was 50 to 8050 with a median of 220 participants. The mean age was 41.8 years. Eleven studies enrolled workers with musculoskeletal health problems, two enrolled workers with mental health problems (Van der Feltz‐Cornelis 2010; Volker 2015), and one study investigated both (Purdon 2006). Twelve studies included only employed participants, Davey 1994 included 96% employed participants, and Scholz 2015 included 93% employed participants. Workers in all studies were on sick leave: in seven studies they were on partial or full sick leave (Feuerstein 2003; Jensen 2012; Lambeek 2010; Myhre 2014; Scholz 2015; Stapelfeldt 2011; Volker 2015), while the rest of the studies included only workers on full sick leave. In five studies the length of work absence was shorter than three months (Bültmann 2009; Donceel 1999; Jensen 2012; Rossignol 2000; Stapelfeldt 2011); in four studies, longer than three months (Davey 1994; Lambeek 2010; Lindh 1997; Myhre 2014); in three studies, from 1 to 6 months (Feuerstein 2003; Purdon 2006; Volker 2015); and in one study, from 1 to 11 months (Van der Feltz‐Cornelis 2010). Scholz 2015 did not provide data, but the inclusion of participants with severe accidents made a sick leave duration of at least four weeks plausible. For further details see Characteristics of included studies.
Setting
Recruitment procedures took place from June 1995 to August 2011; this information was missing in four studies. Most of the studies took place in Europe, in: Belgium (Donceel 1999), Denmark (Bültmann 2009; Jensen 2012; Stapelfeldt 2011), the Netherlands (Lambeek 2010; Van der Feltz‐Cornelis 2010; Volker 2015), Norway (Myhre 2014), Sweden (Lindh 1997), Switzerland (Scholz 2015), and the UK (Davey 1994; Purdon 2006). Rossignol 2000 was in Canada, and Feuerstein 2003 was in the USA. For details of the recruitment procedures see Characteristics of included studies.
Experimental intervention
Although the return‐to‐work coordination programmes differed in structure, components, team members and duration, all included a tailored, multidisciplinary, coordinated intervention with an individual assessment and a return‐to‐work plan.
A variety of specialists were involved in the interventions, most often an occupational physician, a general practitioner or physician, a mental health specialist, a physical or occupational therapist, and a social worker. For further information see Table 1 and Characteristics of included studies. The duration of the return‐to‐work coordination programmes varied substantially. Some studies delivered the programme tailored to the worker's needs, others until successful return to work or for a defined period. Heterogeneous reporting precluded a descriptive summary (e.g. total number of weeks, median number of weeks, range of weeks). For details see Characteristics of included studies.
| Occupational or rehabilitation physician | General practitioner | (Occupational) physiotherapist | Psychologist, psychiatrist, psychotherapist | Occupational therapist | Social worker | Chiropractor | Other | |
| X | — | X | X | — | X | X | — | |
| X | — | X | X | X | — | — | — | |
| X (social insurance physician) | X | — | — | — | — | — | Other healthcare personnel, social insurance agent | |
| — | — | — | — | — | — | — | “[E].g. supervisor, injury compensation specialist, medical providers, claims examiner” | |
| X | X | X | — | X | X | — | — | |
| X | — | X | — | X | — | — | Medical specialist | |
| X | — | X | X | X | X | — | Nurse, vocational counsellor | |
| X | — | X | — | — | — | — | Case worker, medical specialist, group discussions, lecturer | |
| — | — | X | X | — | — | X | Podiatrists, osteopaths and dieticians | |
| X | — | X | — | — | — | X | — | |
| X (insurance physician) | X | X | — | X | — | — | Outpatient care provider, inpatient care provider, other care provider | |
| X | X | X | — | X | X | — | — | |
| X | X | — | X | — | — | — | — | |
| X | X | — | X | — | — | — | Web‐based eHealth Modules |
X = involved discipline
The study coordinator contacted and enlisted the involvement of the employer in eight studies (Bültmann 2009; Feuerstein 2003; Jensen 2012; Lambeek 2010; Myhre 2014; Purdon 2006; Scholz 2015; Stapelfeldt 2011). One study reported no direct contact but described workplace accommodations as needed (Rossignol 2000). In five studies the employer was not involved in the intervention.
In five studies the intervention started less than three months after inclusion (Bültmann 2009; Donceel 1999; Jensen 2012; Rossignol 2000; Stapelfeldt 2011), while in four studies it started later than three months (Davey 1994; Lambeek 2010; Lindh 1997; Myhre 2014). In four studies the start of the intervention ranged from one to six months after inclusion, while the final study did not provide information.
Control intervention
We classified five studies as using a control intervention with a low level of support (Davey 1994; Donceel 1999; Lindh 1997; Purdon 2006; Rossignol 2000), while seven provided a moderate level of support (Bültmann 2009; Feuerstein 2003; Lambeek 2010; Myhre 2014; Scholz 2015; Van der Feltz‐Cornelis 2010; Volker 2015), and two studies offered a high level of support (Jensen 2012; Stapelfeldt 2011).
One study performed at two sites used the pre‐existing intervention at each site: either a brief or a comprehensive multidisciplinary intervention (Myhre 2014). However, authors showed similar effects for these treatment programmes.
Outcomes
Primary outcomes
Nine studies retrieved the primary outcomes on return to work from administrative data (Bültmann 2009; Feuerstein 2003; Jensen 2012; Lindh 1997; Myhre 2014; Rossignol 2000; Scholz 2015; Stapelfeldt 2011; Volker 2015). Two studies used a combination of administrative data and self‐report (Lambeek 2010; Van der Feltz‐Cornelis 2010). Other studies used a semi‐structured interview in combination with information from claims files (Davey 1994), a standardised questionnaire (Donceel 1999), or a face‐to‐face survey (Purdon 2006).
Nine studies reported on time to return to work (Donceel 1999; Feuerstein 2003; Jensen 2012; Lambeek 2010; Myhre 2014; Rossignol 2000; Stapelfeldt 2011; Van der Feltz‐Cornelis 2010; Volker 2015), 7 studies reported on cumulative sickness absence (Bültmann 2009; Jensen 2012; Lambeek 2010; Myhre 2014; Scholz 2015; Stapelfeldt 2011; Volker 2015), 7 studies reported on the proportion of participants at work at end of the follow‐up (Bültmann 2009; Davey 1994; Donceel 1999; Jensen 2012; Lindh 1997; Purdon 2006; Van der Feltz‐Cornelis 2010), and 12 studies reported on the proportion of participants who had ever returned to work (Davey 1994; Donceel 1999; Feuerstein 2003; Jensen 2012; Lambeek 2010; Lindh 1997; Myhre 2014; Purdon 2006; Rossignol 2000; Stapelfeldt 2011; Van der Feltz‐Cornelis 2010; Volker 2015).
Definitions of return to work varied: eight studies used full‐time return to work (i.e. suspension of sickness benefits) (Donceel 1999; Feuerstein 2003; Jensen 2012; Lambeek 2010; Myhre 2014; Purdon 2006; Stapelfeldt 2011; Van der Feltz‐Cornelis 2010), and four studies applied full and partial return to work (Davey 1994; Lindh 1997; Rossignol 2000; Scholz 2015). Two studies reported data on full and partial return to work separately (Bültmann 2009; Volker 2015).
Six studies reported successful return to work without additional specification (Bültmann 2009; Davey 1994; Donceel 1999; Feuerstein 2003; Lindh 1997; Scholz 2015). Eight studies defined lasting return to work for at least two days (Rossignol 2000), two weeks (Purdon 2006), four weeks (Jensen 2012; Lambeek 2010; Stapelfeldt 2011; Van der Feltz‐Cornelis 2010; Volker 2015), or five weeks (Myhre 2014).
Secondary outcomes
Included studies also collected data on patient‐reported outcomes. We analysed secondary outcomes on pain (Bültmann 2009; Feuerstein 2003; Jensen 2012; Lambeek 2010; Myhre 2014; Purdon 2006; Rossignol 2000), overall function (Bültmann 2009; Jensen 2012; Lambeek 2010; Myhre 2014; Purdon 2006; Rossignol 2000), physical function (Feuerstein 2003; Jensen 2012; Lambeek 2010; Purdon 2006; Rossignol 2000), mental function (Feuerstein 2003; Jensen 2012; Purdon 2006), social function (Jensen 2012; Purdon 2006), depression (Davey 1994; Myhre 2014; Van der Feltz‐Cornelis 2010; Volker 2015), and anxiety (Davey 1994; Myhre 2014; Volker 2015).
We found insufficient data for meta‐analyses on quality of life and on the satisfaction of workers, employers or social insurance organisations.
Follow‐up
We regarded a follow‐up of up to 6 months as short‐term (Davey 1994; Rossignol 2000; Van der Feltz‐Cornelis 2010); between 6 and 12 months, as long‐term (Bültmann 2009; Donceel 1999; Lambeek 2010; Myhre 2014; Purdon 2006; Stapelfeldt 2011; Volker 2015); and more than 12 months, as very long‐term (Feuerstein 2003 (16 months); Jensen 2012 (24 months); Lindh 1997 (60 months); Scholz 2015 (72 months)). Duration of follow‐up times ranged from 3 to 72 months.
Excluded studies
We assessed 183 full text articles and excluded 155 for not meeting our inclusion criteria. See Characteristics of excluded studies for details.
Risk of bias in included studies
Risk of bias varied across studies (Figure 2). We judged 10 studies to be at low risk of bias (Bültmann 2009; Davey 1994; Donceel 1999; Jensen 2012; Lambeek 2010; Myhre 2014; Rossignol 2000; Scholz 2015; Stapelfeldt 2011; Volker 2015). We judged four studies to be at high risk of bias based on lack of allocation concealment (Feuerstein 2003), incomplete outcome data (Feuerstein 2003; Lindh 1997; Purdon 2006; Van der Feltz‐Cornelis 2010), and selective outcome reporting (Feuerstein 2003; Van der Feltz‐Cornelis 2010). See Figure 3 for details.
Allocation
Eleven studies reported concealed allocation and suitable methods of randomisation; we judged them to be at low risk of selection bias. Feuerstein 2003 omitted allocation concealment, so we judged the study to be at high risk of selection bias. Donceel 1999 and Lindh 1997 reported no concealment; we judged them to be at unclear risk of selection bias.
Blinding
We judged all studies to be at high risk of bias, acknowledging that successful blinding towards the intervention may be very challenging or not feasible at all. All but three studies succeeded in blinded outcome assessment by using administrative data on return to work (Donceel 1999;Feuerstein 2003;Purdon 2006) (see Types of outcome measures).
Incomplete outcome data
We found high risk of attrition bias for four studies (Feuerstein 2003; Lindh 1997; Purdon 2006; Van der Feltz‐Cornelis 2010).
Selective reporting
Two studies were at high risk of reporting bias. Feuerstein 2003 did not publish return‐to‐work outcomes but provided (incomplete) data on request. Van der Feltz‐Cornelis 2010 did not pre‐specify return to work as a primary outcome: it changed from 'level of functioning' in the protocol to 'time until return to work for at least four weeks'. They did not report the level of functioning.
Other potential sources of bias
We judged two studies to have a potential source of bias because of low adherence among participants (Purdon 2006; Volker 2015), while one study had baseline imbalances between the groups (Rossignol 2000).
Effects of interventions
Return‐to‐work coordination programmes versus usual practice
We compared return‐to‐work coordination programmes to usual practice. See summary of findings Table for the main comparison for the effects of the intervention for all outcomes and the GRADE assessment of quality of the evidence per outcome.
Primary outcomes
Time to return to work
Based on nine studies, we found no significant differences in the Hazard Ratios (HR) of time to return to work (Analysis 1.1, Figure 4).

Forest plot of comparison: time to return to work. RTWCP = return‐to‐work coordination programmes
The HR at short‐term follow‐up was 1.32 (95% CI 0.93 to 1.88, two studies, low quality evidence, low heterogeneity). The HR at long‐term follow‐up was 1.25 (95% CI 0.95 to 1.66, six studies, low quality evidence, substantial heterogeneity). The HR at very long‐term follow‐up was 0.93 (95% CI 0.74 to 1.17, two studies, low quality evidence, low heterogeneity).
Cumulative sickness absence
Based on seven studies, we found no significant differences in cumulative sickness absence (Analysis 1.3, Figure 5).
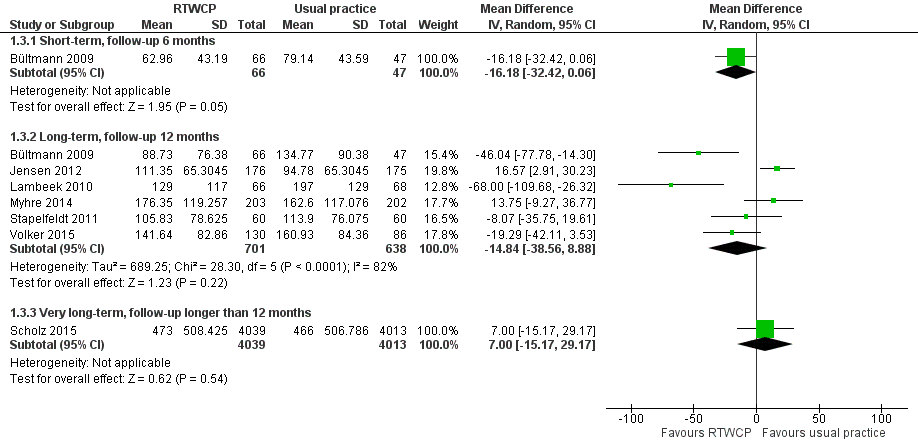
Forest plot of comparison: cumulative sickness absence in work days. RTWCP = return‐to‐work coordination programmes
The Mean Difference (MD) at short‐term follow‐up was 16.18 work days per year lower (95% CI −32.42 to 0.06, one study, moderate quality evidence). The MD at long‐term follow‐up was 14.84 work days per year lower (95% CI −38.56 to 8.88, six studies, low quality evidence, substantial heterogeneity). The MD at very long‐term follow‐up was 7.00 work days per year higher (95% CI −15.17 to 29.17, one study, moderate quality evidence).
Proportion of participants at work at end of the follow‐up
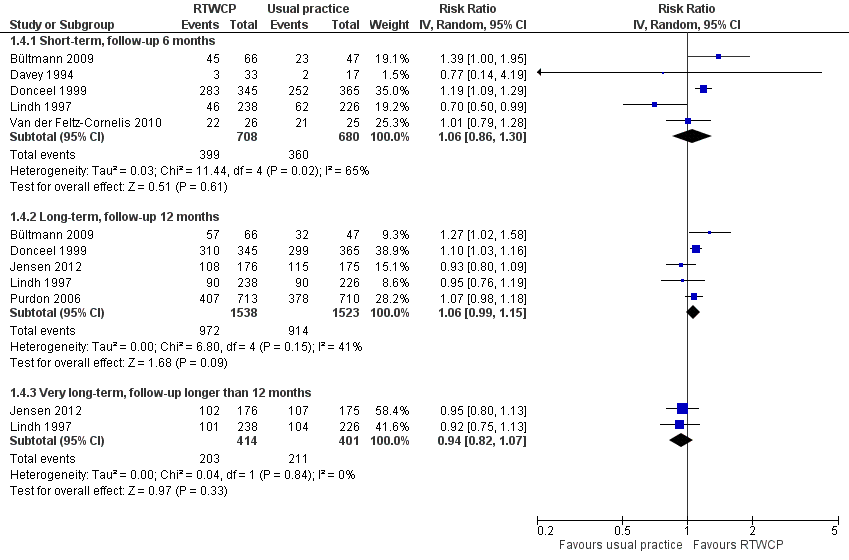
Based on seven studies, we found no significant differences in the proportion of participants at work at end of the follow‐up (Analysis 1.4, Figure 6).

Forest plot of comparison: proportion at work at end of the follow‐up. RTWCP = return‐to‐work coordination programmes
The Risk Ratio (RR) at short‐term follow‐up was 1.06 (95% CI 0.86 to 1.30, five studies, low quality evidence, substantial heterogeneity). The RR at long‐term follow‐up was 1.06 (95% CI 0.99 to 1.15, five studies, low quality evidence, moderate heterogeneity). The RR at very long‐term follow‐up was 0.94 (95% CI 0.82 to 1.07, two studies, low quality evidence, low heterogeneity).
The absolute effect for the intervention versus control was 4 in 100 more individuals returning to work at short‐term follow‐up (95% CI 8 fewer to 16 more), 4 in 100 more at long‐term follow‐up (95% CI 2 fewer to 9 more), and 3 in 100 fewer at very long‐term follow‐up (95% CI 10 fewer to 3 more).
Proportion of participants who had ever returned to work
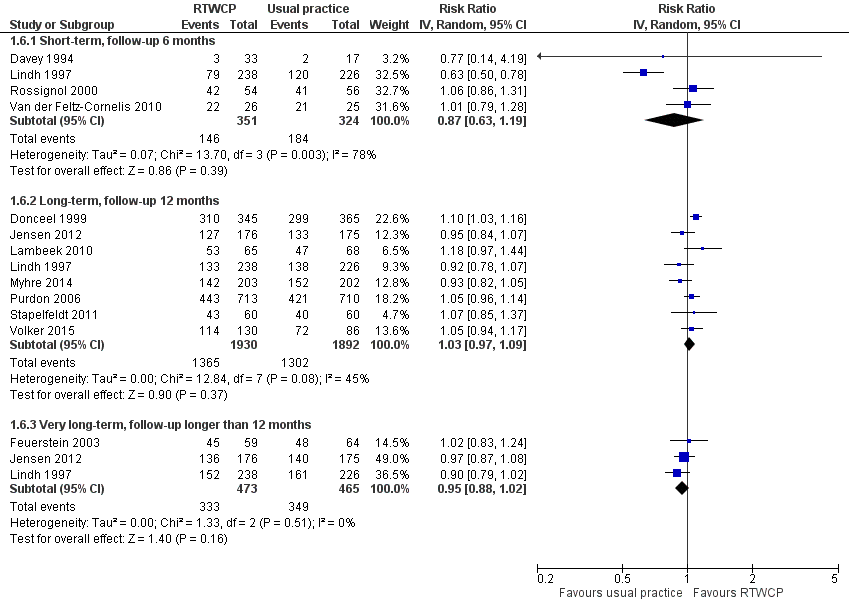
Based on 12 studies, we found no significant differences in the proportion of participants who had ever returned to work (Analysis 1.6, Figure 7).

Forest plot of comparison: proportion who had ever returned to work. RTWCP = return‐to‐work coordination programmes
The RR at short‐term follow‐up was 0.87 (95% CI 0.63 to 1.19, four studies, very low quality evidence, substantial heterogeneity). The RR at long‐term follow‐up was 1.03 (95% CI 0.97 to 1.09, eight studies, moderate quality evidence, moderate heterogeneity). The RR at very long‐term follow‐up was 0.95 (95% CI 0.88 to 1.02, three studies, low quality evidence, low heterogeneity).
The absolute effect for the intervention versus control was 6 in 100 fewer individuals having ever returned to work for any time period at short‐term follow‐up (95% CI 19 fewer to 8 more), 2 in 100 more at long‐term follow‐up (95% CI 2 fewer to 6 more), and 4 in 100 fewer at very long‐term follow‐up (95% CI 10 fewer to 1 more).
Sensitivity analyses
For the primary outcomes, we conducted sensitivity analyses for studies at high risk of bias and cluster‐RCTs.
Omitting studies at high risk of bias revealed a significant difference in the proportion of participants working at end of the short‐term follow‐up (RR 1.20, 95% CI 1.10 to 1.30; Analysis 1.5). We found no significant changes for the time to return to work (Analysis 1.2), cumulative sickness absence (no high risk af bias studies), or the proportion of participants who had ever returned to work (Analysis 1.7)
For cluster‐RCTs (Donceel 1999; Van der Feltz‐Cornelis 2010; Volker 2015), we calculated the design effect based on an ICC of 0.10. We found no relevant changes in the effect estimates or CIs.
Subgroup analysis and investigation of heterogeneity
In the presence of substantial heterogeneity, we wanted to conduct subgroup analyses according to our a priori hypotheses; however, we found too few studies in each subgroup to compare them in meaningful subgroup analyses.
Heterogeneity was substantial for time to return to work at long‐term follow‐up (I² = 78%; Analysis 1.1), cumulative sickness absence at a long‐term follow‐up (I² = 82%; Analysis 1.3), the proportion of participants at work at the end of short‐term follow‐up (I² = 65%; Analysis 1.4), and for the proportion who had ever returned to work at short‐term follow‐up (I² = 78%; Analysis 1.6).
Eliminating high risk of bias studies resolved heterogeneity for the proportion at work and the proportion who had ever returned to work. Eliminating two outliers, both clearly in favour for return‐to‐work coordination programmes (Donceel 1999; Lambeek 2010), reduced heterogeneity for time to return to work to a moderate level, even though these programmes showed no obvious differences to other studies. Heterogeneity for cumulative sickness absence at a long‐term follow‐up remained substantial and unexplained: even if we just analysed Jensen 2012 and Stapelfeldt 2011, two studies within the identical setting, identical recruitment procedure and identical interventions, heterogeneity remained moderate (I² = 59%).
Secondary outcomes
Pain
Seven studies reported on pain, and we found a significant MD and Risk Difference (RD) for long‐term follow‐up. However, the difference was not clinically important (Minimally Important Difference (MID) = −10.0 points on a 0 to 100 scale).
The MD at short‐term follow‐up was −4.76 points (95% CI −14.89 to 5.36, four studies, low quality evidence); at long‐term follow‐up, −2.98 points (95% CI −5.33 to −0.63, six studies, moderate quality evidence); and at very long‐term follow‐up, −7.20 points (95% CI −15.76 to 1.36, one study, very low quality evidence; Analysis 2.1).
The proportion of participants in the intervention group whose pain improved substantially was 3% (95% CI 0% to 6%) at long‐term follow‐up and not significantly different from control at short‐term (RD −3%, 95% CI −11% to 5%) or very long‐term follow‐up follow‐up (RD −2%, 95% CI −11% to 7%; Analysis 2.2).
Overall function
Six studies reported on overall function, and we found a significant MD at short‐term follow‐up and no significant RDs. The effect did not reach the MID of 10 points on a 0 to 100 scale.
The MD at short‐term follow‐up was 8.13 points (95% CI 3.95 to 12.32, three studies, moderate quality evidence) and at long‐term follow‐up, 2.74 points (95% CI −0.15 to 5.64, five studies, moderate quality evidence; Analysis 2.3).
The proportion of participants in the intervention group whose overall function improved substantially was not significantly different from control (RD 16%, 95% CI −4% to 37% and RD 0%, 95% CI −9% to 9%, respectively; Analysis 2.4).
Physical function
Five studies reported on physical function, but we found no significant MDs or RDs (MID = 8.4 points on a 0 to 100 scale).
The MD at short‐term follow‐up was 3.47 points (95% CI −3.26 to 10.20, three studies, low quality evidence); at long‐term follow‐up, 2.19 points (95% CI −2.29 to 6.67, four studies, very low quality evidence); and at very long‐term follow‐up, 1.85 points (95% CI −2.25 to 5.95, one study, very low quality evidence; Analysis 2.5).
The proportion of participants in the intervention group whose physical function improved substantially was not significantly different from control (short‐term: RD 3%, 95% CI −7% to 13%; long‐term: RD 1%, 95% CI −2 to 3%; very long‐term: RD 0%, 95% CI −2% to 2%; Analysis 2.6).
Social function
Two studies reported on social function, and we found no significant MDs or RDs (MID = 11.7 points on a 0 to 100 scale).
The MD at long‐term follow‐up was 2.84 points (95% CI −0.09 to 5.77, two studies, low quality evidence; Analysis 2.7).
The proportion of participants in the intervention group whose social function improved substantially was not significantly different from control (RD 1%, 95% CI −2% to 4%; Analysis 2.8).
Mental function
Three studies reported on mental function. We found a significant MD at long‐term and very long‐term follow‐up and no significant RDs (MID = 7.3 points on a 0 to 100 scale).
The MD at short‐term follow‐up was 1.85 points (95% CI −2.67 to 6.37, one study, very low quality evidence); at long‐term follow‐up, 3.14 points (95% CI 1.16 to 5.11, three studies, moderate quality evidence); and at very long‐term follow‐up, 6.09 points (95% CI 0.56 to 11.63, one study, very low quality evidence; Analysis 2.9).
The proportion of participants in the intervention group whose mental function improved substantially was not significantly different from control (short‐term: RD 0%, 95% CI −1% to 1%; long‐term: RD 0%, 95% CI −1% to 1%; and very long‐term: RD 0%, 95% CI −1% to 1%; Analysis 2.10).
Depression
Four studies reported on depression, but we found no significant MDs or RDs (MID = 5.0 on a 0 to 27 scale).
The MD at short‐term follow‐up was 0.37 points (95% CI −2.81 to 3.55, three studies, low quality evidence) and for long‐term follow‐up, 0.00 points (95% CI −1.07 to 1.07, two studies, moderate quality evidence; Analysis 2.11).
The proportion of participants in the intervention group that experienced substantial change in depression was not significantly different from control (short term: RD 3%, 95% CI −7% to 12%; and long term: RD 1%, 95% CI −4% to 6%; Analysis 2.12).
Anxiety
Three studies reported on anxiety, but we found no significant MDs or RDs (MID = 4.0 on a 0 to 21 scale).
The MD at short‐term follow‐up was −0.02 points (95% CI −3.24 to 3.21, two studies, low quality, P = 0.99) and for long‐term follow‐up, 0.97 points (95% CI −0.17 to 2.12, two studies, moderate quality, P = 0.1; Analysis 2.13).
The proportion of participants in the intervention group that experienced substantial change in anxiety was not significantly different from control (short term: RD −1%, 95% CI −8% to 7 and long‐term: RD 2%, 95% CI −3% to 8%; Analysis 2.14).
Discussion
Summary of main results
We included 14 RCTs comparing return‐to‐work coordination programmes to usual practice. Very low‐ to moderate‐quality evidence suggests no benefits on return‐to‐work outcomes.
For the outcomes time to return to work, cumulative sickness absence, proportion of participants working at end of the follow‐up and proportion who had ever returned to work, we found no significant differences at short‐term (6 months), long‐term (12 months) or very long‐term (longer than 12 months) follow‐up.
Omitting high risk of bias studies showed a significantly higher proportion of participants returning to work at short‐term follow‐up but there were no relevant changes for any other outcome.
Regarding the patient‐reported outcomes, we found no differences greater than the MID. The quality of the evidence ranged from very low to moderate.
Overall completeness and applicability of evidence
We performed an extensive literature search without language restriction and screened almost 4000 records. Furthermore, the review authors contributed with their professional expertise in the field of work disability and insurance medicine to find ongoing or unpublished studies. Risk of selection bias is therefore low. However, we found only two studies in workers with common mental health problems.
We identified studies from nine different countries, reflecting a broad variety of healthcare systems. Differences in the healthcare systems and benefit schemes of each country might have an additional effect on the return‐to‐work outcome.
Quality of the evidence
We included 14 RCTs with more than 12,500 workers. We considered this a large number of participants.
The risk of bias was low in 10 studies and high in 4 studies because of reporting bias, attrition bias or detection bias. None of the studies blinded participants or personnel, but most studies retrieved return‐to‐work data through administrative databases (11 of 14).
According to the GRADE system, the quality of the evidence was very low to moderate through the different outcomes. Besides high risk of attrition or reporting bias, we downgraded the quality of evidence for inconsistency (substantial heterogeneity) and imprecision (a confidence interval spanning a negative and positive effect or a small population size).
Potential biases in the review process
At least two authors independently performed all subjective steps in the review process. We reported on individual studies, not articles, to prevent reporting bias, but we extracted data from all related articles. Funnel plots (not shown) did not suggest the presence of publication bias. If required, we recalculated sickness absence into work days to pool the MD or recalculated SDs from studies when only P values or standard errors were given. If studies reported no time‐to‐event outcomes, we extracted data from survival curves and verified it by comparing the original plot with the plot derived from the extracted data, and then calculated the HRs and associated 95% CIs.
Due to methodological considerations we included only RCTs and excluded non‐RCTs. We already knew we had an adequate number of RCTs because of our previous non‐Cochrane version of this review (Schandelmaier 2012). Furthermore, we decided to exclude studies without at least one face‐to‐face contact and employer‐initiated programmes, which were not our focus. However, we did not have to exclude studies solely for these reasons.
It is challenging to compare multidisciplinary programmes that allow for different interventions, in different intensities, with different support for the control group. However, we tried to choose appropriate inclusion and exclusion criteria. Unfortunately, we did not find enough data to explore further heterogeneity by means of subgroup analyses.
Agreements and disagreements with other studies or reviews
In the previous version of this review (Schandelmaier 2012), we found significant effects for all four of the return‐to‐work outcomes in favour for return‐to‐work coordination programmes. Our new search identified five additional publications: all of them with low risk of bias, a follow‐up ranging from 12 months to 72 months, and moderate to high support for the control group. Thus, we conclude that the quality of research as well as the quality of usual practice has improved.
Other reviews on interventions facilitating return to work have different foci but partly overlap regarding the included studies. In summary, they give no clear recommendations regarding return‐to‐work coordination programmes.
Recently, Van Vilsteren 2015 investigated workplace interventions to prevent disability in workers on sick leave. Especially for workers with musculoskeletal disorders, they found evidence that workplace interventions reduce time to first return to work and cumulative duration of sickness absence. For time to lasting return to work, they found only low‐quality evidence for workplace interventions.
Nieuwenhuijsen 2014 analysed interventions to improve return to work in people with depression. Moderate‐quality evidence suggested that adding a work‐directed intervention to a clinical intervention reduced the number of days on sick leave compared to a clinical intervention alone. For adults with adjustment disorders, Arends 2012 found that cognitive behavioural therapy did not significantly reduce time to partial or full return to work compared with no treatment. For problem‐solving therapy, they found a significant effect on partial return to work after one year compared to non‐guideline based care, but there was no significant effect on time to full return to work.
Palmer 2012 completed a systematic review regarding the effectiveness of community‐ and workplace‐based interventions to reduce sickness absence and job loss. They concluded that most interventions, especially in large and high‐quality studies, show small beneficial effects. No intervention was clearly superior to another, but effort‐intensive interventions were less effective than simple programmes. Clayton 2011 reviewed studies with an individual focus to return people with disabilities and long‐term illnesses back to work. Personal advisors and individual case management helped some participants back to work, but authors concluded that existing programmes must be modified and extended for the more complex needs of those workers further from the labour market. Kuoppala 2008 found that return‐to‐work programmes decreased long sick leaves but not the proportion who returned to work. They emphasised the benefit of involving the workplace in rehabilitation efforts.
PRISMA Study flow diagram

Risk of bias graph: review author's judgements about each risk of bias item presented as percentages across all included studies.

Risk of bias summary: review authors' judgements about each risk of bias item for each included study.

Forest plot of comparison: time to return to work. RTWCP = return‐to‐work coordination programmes

Forest plot of comparison: cumulative sickness absence in work days. RTWCP = return‐to‐work coordination programmes
Forest plot of comparison: proportion at work at end of the follow‐up. RTWCP = return‐to‐work coordination programmes
Forest plot of comparison: proportion who had ever returned to work. RTWCP = return‐to‐work coordination programmes

Comparison 1 Return‐to‐work outcomes, Outcome 1 Time to return to work.
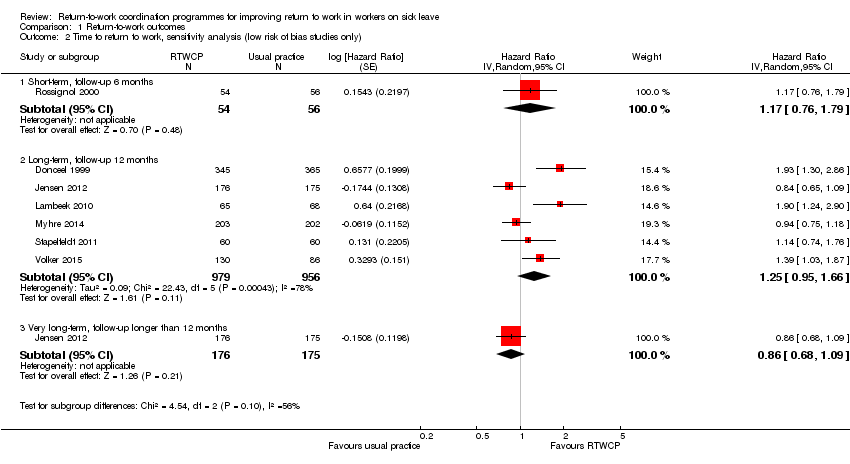
Comparison 1 Return‐to‐work outcomes, Outcome 2 Time to return to work, sensitivity analysis (low risk of bias studies only).

Comparison 1 Return‐to‐work outcomes, Outcome 3 Cumulative sickness absence in work days.
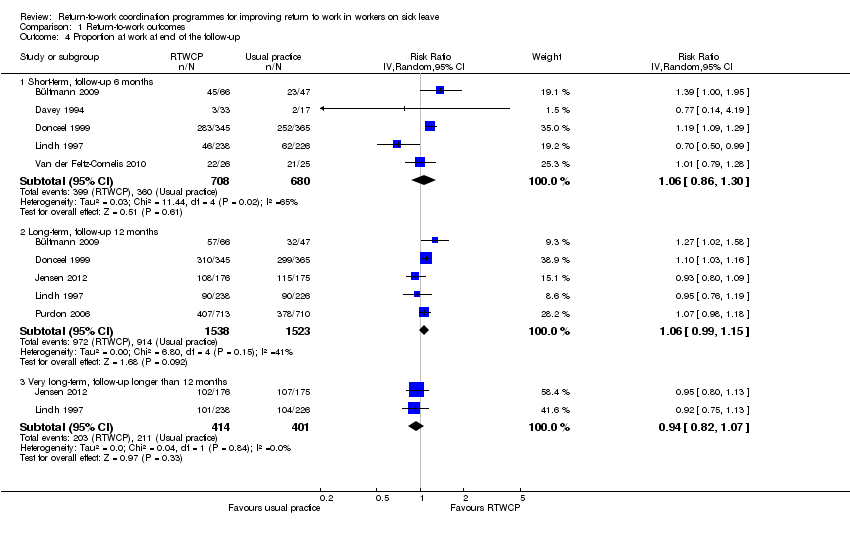
Comparison 1 Return‐to‐work outcomes, Outcome 4 Proportion at work at end of the follow‐up.
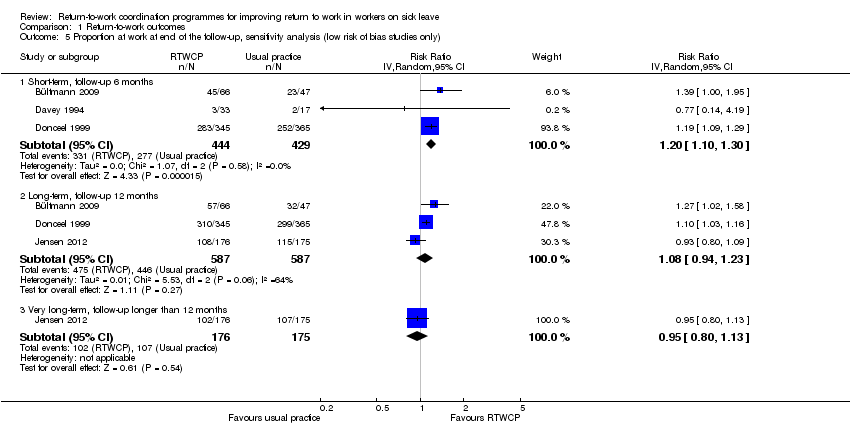
Comparison 1 Return‐to‐work outcomes, Outcome 5 Proportion at work at end of the follow‐up, sensitivity analysis (low risk of bias studies only).
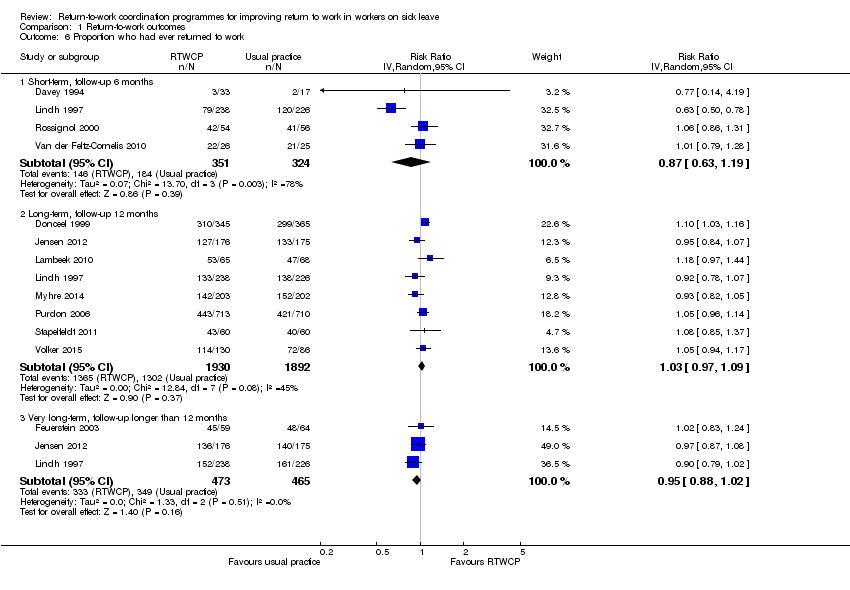
Comparison 1 Return‐to‐work outcomes, Outcome 6 Proportion who had ever returned to work.

Comparison 1 Return‐to‐work outcomes, Outcome 7 Proportion who had ever returned to work, sensitivity analysis (low risk of bias studies only).

Comparison 2 Patient‐reported outcomes, Outcome 1 Pain ‐ scale 0 to 100 (higher score indicates improvement) ‐ MID 10.0.

Comparison 2 Patient‐reported outcomes, Outcome 2 Pain ‐ pooled RDs of workers with an improvement greater than the MID of 10.0.

Comparison 2 Patient‐reported outcomes, Outcome 3 Overall function ‐ scale 0 to 100 (higher score indicates improvement) ‐ MID 10.0.

Comparison 2 Patient‐reported outcomes, Outcome 4 Overall function ‐ pooled RDs of workers with an improvement greater than the MID of 10.0.

Comparison 2 Patient‐reported outcomes, Outcome 5 Physical function ‐ scale 0 to 100 (higher score indicates improvement) ‐ MID 8.4.
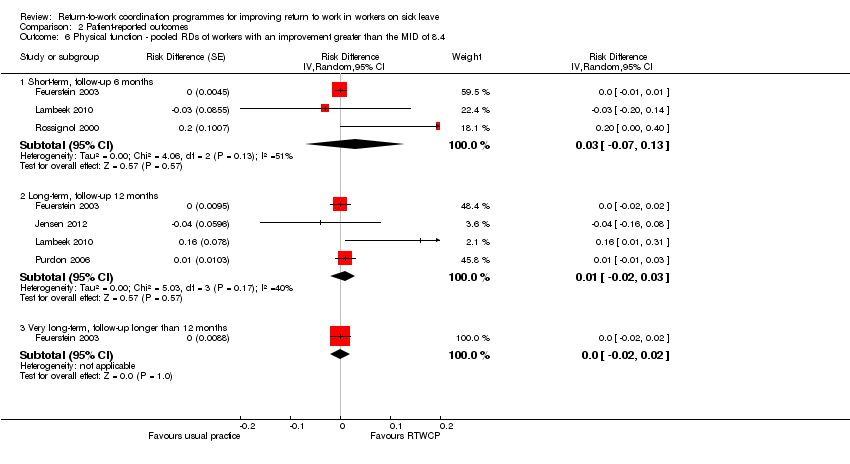
Comparison 2 Patient‐reported outcomes, Outcome 6 Physical function ‐ pooled RDs of workers with an improvement greater than the MID of 8.4.
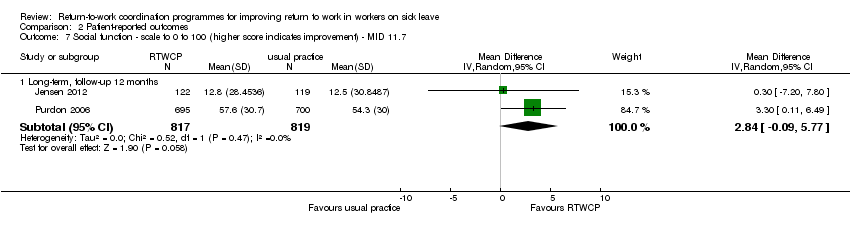
Comparison 2 Patient‐reported outcomes, Outcome 7 Social function ‐ scale to 0 to 100 (higher score indicates improvement) ‐ MID 11.7.
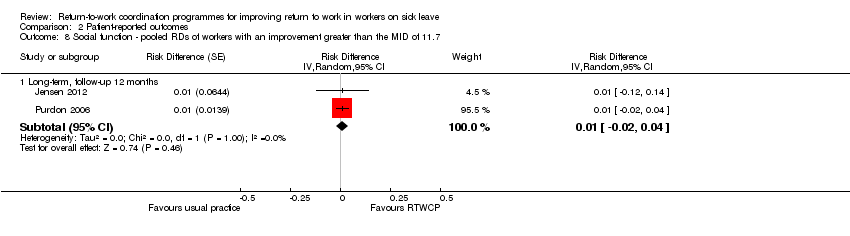
Comparison 2 Patient‐reported outcomes, Outcome 8 Social function ‐ pooled RDs of workers with an improvement greater than the MID of 11.7.

Comparison 2 Patient‐reported outcomes, Outcome 9 Mental function ‐ scale to 0 to 100 (higher score indicates improvement) ‐ MID 7.3.

Comparison 2 Patient‐reported outcomes, Outcome 10 Mental function ‐ pooled RDs of workers with an improvement greater than the MID of 7.3.
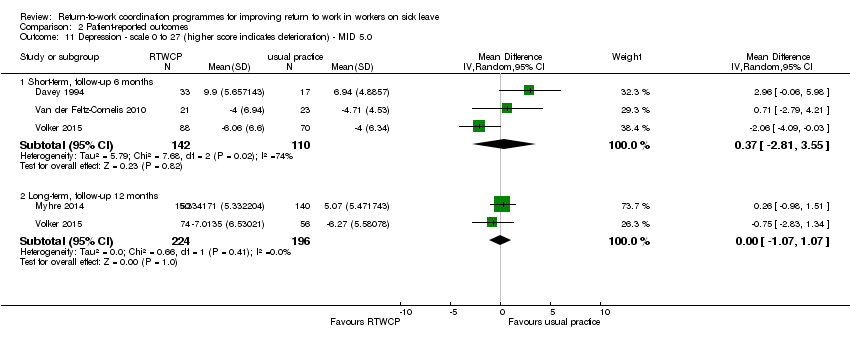
Comparison 2 Patient‐reported outcomes, Outcome 11 Depression ‐ scale 0 to 27 (higher score indicates deterioration) ‐ MID 5.0.

Comparison 2 Patient‐reported outcomes, Outcome 12 Depression ‐ pooled RDs of workers with an improvement greater than the MID of 5.0.
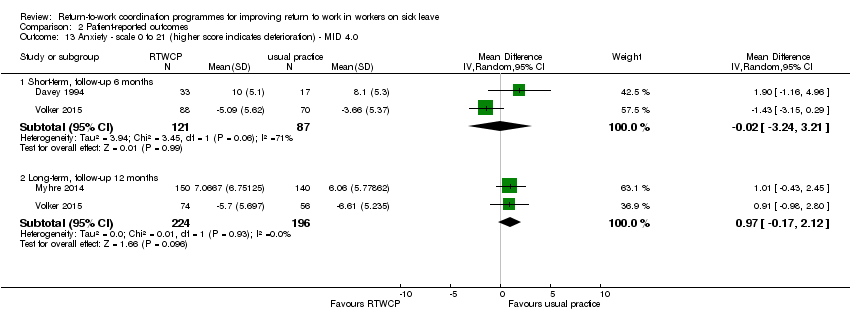
Comparison 2 Patient‐reported outcomes, Outcome 13 Anxiety ‐ scale 0 to 21 (higher score indicates deterioration) ‐ MID 4.0.
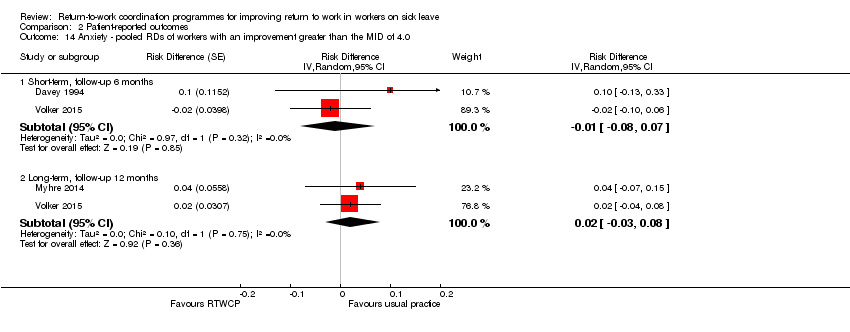
Comparison 2 Patient‐reported outcomes, Outcome 14 Anxiety ‐ pooled RDs of workers with an improvement greater than the MID of 4.0.
| Return to work coordination programmes compared to usual practice for improving return to work in workers on sick leave | |||||
| Patient or population: workers on sick leave | |||||
| Outcomes | Anticipated absolute effects* (95% CI) | Relative effect | № of participants | Quality of the evidence | |
| Risk with usual practice | Risk with return‐to‐work coordination programmes | ||||
| Time to return to work ‐ short‐term | — | — | HR 1.32 | 161 | ⊕⊕⊝⊝ |
| Time to return to work ‐ long‐term | — | — | HR 1.25 | 1935 | ⊕⊕⊝⊝ |
| Time to return to work ‐ very long‐term | — | — | HR 0.93 | 474 | ⊕⊕⊝⊝ |
| Cumulative sickness absence in work days ‐ short‐term | The mean cumulative sickness absence was 79.14 work days | The mean cumulative | — | 113 | ⊕⊕⊕⊝ |
| Cumulative sickness absence in work days ‐ long‐term | The mean cumulative sickness absence was 144 work days | The mean cumulative | — | 1339 | ⊕⊕⊝⊝ |
| Cumulative sickness absence in work days ‐ very long‐term | The mean cumulative sickness absence was 466 work days | The mean cumulative | — | 8052 | ⊕⊕⊕⊝ |
| Proportion at work at end of the follow‐up ‐ short‐term | 53 per 100 | 56 per 100 | RR 1.06 | 1388 | ⊕⊕⊝⊝ |
| Proportion at work at end of the follow‐up ‐ long‐term | 60 per 100 | 64 per 100 | RR 1.06 | 3061 | ⊕⊕⊝⊝ |
| Proportion at work at end of the follow‐up ‐ very long‐term | 53 per 100 | 49 per 100 | RR 0.94 | 815 | ⊕⊕⊝⊝ |
| Proportion who had ever returned to work ‐ short‐term | 57 per 100 | 49 per 100 | RR 0.87 | 675 | ⊕⊝⊝⊝ |
| Proportion who had ever returned to work ‐ long‐term | 69 per 100 | 71 per 100 | RR 1.03 | 3822 | ⊕⊕⊕⊝ |
| Proportion who had ever returned to work ‐ very long‐term | 75 per 100 | 71 per 100 | RR 0.95 | 938 | ⊕⊕⊝⊝ |
| *The risk in the intervention group (and its 95% confidence interval) is based on the assumed risk in the comparison group and the relative effect of the intervention (and its 95% CI). | |||||
| GRADE Working Group grades of evidence | |||||
| a Downgraded 1 level for risk of bias (attrition bias, reporting bias). | |||||
| Occupational or rehabilitation physician | General practitioner | (Occupational) physiotherapist | Psychologist, psychiatrist, psychotherapist | Occupational therapist | Social worker | Chiropractor | Other | |
| X | — | X | X | — | X | X | — | |
| X | — | X | X | X | — | — | — | |
| X (social insurance physician) | X | — | — | — | — | — | Other healthcare personnel, social insurance agent | |
| — | — | — | — | — | — | — | “[E].g. supervisor, injury compensation specialist, medical providers, claims examiner” | |
| X | X | X | — | X | X | — | — | |
| X | — | X | — | X | — | — | Medical specialist | |
| X | — | X | X | X | X | — | Nurse, vocational counsellor | |
| X | — | X | — | — | — | — | Case worker, medical specialist, group discussions, lecturer | |
| — | — | X | X | — | — | X | Podiatrists, osteopaths and dieticians | |
| X | — | X | — | — | — | X | — | |
| X (insurance physician) | X | X | — | X | — | — | Outpatient care provider, inpatient care provider, other care provider | |
| X | X | X | — | X | X | — | — | |
| X | X | — | X | — | — | — | — | |
| X | X | — | X | — | — | — | Web‐based eHealth Modules | |
| X = involved discipline | ||||||||
| Outcome or subgroup title | No. of studies | No. of participants | Statistical method | Effect size |
| 1 Time to return to work Show forest plot | 9 | Hazard Ratio (Random, 95% CI) | Subtotals only | |
| 1.1 Short‐term, follow‐up 6 months | 2 | 161 | Hazard Ratio (Random, 95% CI) | 1.32 [0.93, 1.88] |
| 1.2 Long‐term, follow‐up 12 months | 6 | 1935 | Hazard Ratio (Random, 95% CI) | 1.25 [0.95, 1.66] |
| 1.3 Very long‐term, follow‐up longer than 12 months | 2 | 474 | Hazard Ratio (Random, 95% CI) | 0.93 [0.74, 1.17] |
| 2 Time to return to work, sensitivity analysis (low risk of bias studies only) Show forest plot | 7 | Hazard Ratio (Random, 95% CI) | Subtotals only | |
| 2.1 Short‐term, follow‐up 6 months | 1 | 110 | Hazard Ratio (Random, 95% CI) | 1.17 [0.76, 1.79] |
| 2.2 Long‐term, follow‐up 12 months | 6 | 1935 | Hazard Ratio (Random, 95% CI) | 1.25 [0.95, 1.66] |
| 2.3 Very long‐term, follow‐up longer than 12 months | 1 | 351 | Hazard Ratio (Random, 95% CI) | 0.86 [0.68, 1.09] |
| 3 Cumulative sickness absence in work days Show forest plot | 7 | Mean Difference (IV, Random, 95% CI) | Subtotals only | |
| 3.1 Short‐term, follow‐up 6 months | 1 | 113 | Mean Difference (IV, Random, 95% CI) | ‐16.18 [‐32.42, 0.06] |
| 3.2 Long‐term, follow‐up 12 months | 6 | 1339 | Mean Difference (IV, Random, 95% CI) | ‐14.84 [‐38.56, 8.88] |
| 3.3 Very long‐term, follow‐up longer than 12 months | 1 | 8052 | Mean Difference (IV, Random, 95% CI) | 7.0 [‐15.17, 29.17] |
| 4 Proportion at work at end of the follow‐up Show forest plot | 7 | Risk Ratio (IV, Random, 95% CI) | Subtotals only | |
| 4.1 Short‐term, follow‐up 6 months | 5 | 1388 | Risk Ratio (IV, Random, 95% CI) | 1.06 [0.86, 1.30] |
| 4.2 Long‐term, follow‐up 12 months | 5 | 3061 | Risk Ratio (IV, Random, 95% CI) | 1.06 [0.99, 1.15] |
| 4.3 Very long‐term, follow‐up longer than 12 months | 2 | 815 | Risk Ratio (IV, Random, 95% CI) | 0.94 [0.82, 1.07] |
| 5 Proportion at work at end of the follow‐up, sensitivity analysis (low risk of bias studies only) Show forest plot | 4 | Risk Ratio (IV, Random, 95% CI) | Subtotals only | |
| 5.1 Short‐term, follow‐up 6 months | 3 | 873 | Risk Ratio (IV, Random, 95% CI) | 1.20 [1.10, 1.30] |
| 5.2 Long‐term, follow‐up 12 months | 3 | 1174 | Risk Ratio (IV, Random, 95% CI) | 1.08 [0.94, 1.23] |
| 5.3 Very long‐term, follow‐up longer than 12 months | 1 | 351 | Risk Ratio (IV, Random, 95% CI) | 0.95 [0.80, 1.13] |
| 6 Proportion who had ever returned to work Show forest plot | 12 | Risk Ratio (IV, Random, 95% CI) | Subtotals only | |
| 6.1 Short‐term, follow‐up 6 months | 4 | 675 | Risk Ratio (IV, Random, 95% CI) | 0.87 [0.63, 1.19] |
| 6.2 Long‐term, follow‐up 12 months | 8 | 3822 | Risk Ratio (IV, Random, 95% CI) | 1.03 [0.97, 1.09] |
| 6.3 Very long‐term, follow‐up longer than 12 months | 3 | 938 | Risk Ratio (IV, Random, 95% CI) | 0.95 [0.88, 1.02] |
| 7 Proportion who had ever returned to work, sensitivity analysis (low risk of bias studies only) Show forest plot | 8 | Risk Ratio (IV, Random, 95% CI) | Subtotals only | |
| 7.1 Short‐term, follow‐up 6 months | 2 | 160 | Risk Ratio (IV, Random, 95% CI) | 1.06 [0.86, 1.31] |
| 7.2 Long‐term, follow‐up 12 months | 6 | 1935 | Risk Ratio (IV, Random, 95% CI) | 1.04 [0.96, 1.11] |
| 7.3 Very long‐term, follow‐up longer than 12 months | 1 | 351 | Risk Ratio (IV, Random, 95% CI) | 0.97 [0.87, 1.08] |
| Outcome or subgroup title | No. of studies | No. of participants | Statistical method | Effect size |
| 1 Pain ‐ scale 0 to 100 (higher score indicates improvement) ‐ MID 10.0 Show forest plot | 7 | Mean Difference (IV, Random, 95% CI) | Subtotals only | |
| 1.1 Short‐term, follow‐up 6 months | 4 | 427 | Mean Difference (IV, Random, 95% CI) | ‐4.76 [‐14.89, 5.36] |
| 1.2 Long‐term, follow‐up 12 months | 6 | 2319 | Mean Difference (IV, Random, 95% CI) | ‐2.98 [‐5.33, ‐0.63] |
| 1.3 Very long‐term, longer than 12 months | 1 | 80 | Mean Difference (IV, Random, 95% CI) | ‐7.20 [‐15.76, 1.36] |
| 2 Pain ‐ pooled RDs of workers with an improvement greater than the MID of 10.0 Show forest plot | 7 | Risk Difference (Random, 95% CI) | Subtotals only | |
| 2.1 Short‐term, follow‐up 6 months | 4 | Risk Difference (Random, 95% CI) | ‐0.03 [‐0.11, 0.05] | |
| 2.2 Long‐term, follow‐up 12 months | 6 | Risk Difference (Random, 95% CI) | ‐0.03 [‐0.06, ‐0.00] | |
| 2.3 Very long‐term, longer than 12 months | 1 | Risk Difference (Random, 95% CI) | ‐0.02 [‐0.11, 0.07] | |
| 3 Overall function ‐ scale 0 to 100 (higher score indicates improvement) ‐ MID 10.0 Show forest plot | 6 | Mean Difference (IV, Random, 95% CI) | Subtotals only | |
| 3.1 Short‐term, follow‐up 6 months | 3 | 295 | Mean Difference (IV, Random, 95% CI) | 8.13 [3.95, 12.32] |
| 3.2 Long‐term, follow‐up 12 months | 5 | 2235 | Mean Difference (IV, Random, 95% CI) | 2.74 [‐0.15, 5.64] |
| 4 Overall function ‐ pooled RDs of workers with an improvement greater than the MID of 10.0 Show forest plot | 6 | Risk Difference (Random, 95% CI) | Subtotals only | |
| 4.1 Short‐term, follow‐up, 6 months | 3 | Risk Difference (Random, 95% CI) | 0.16 [‐0.04, 0.37] | |
| 4.2 Long‐term, follow‐up 12 months | 5 | Risk Difference (Random, 95% CI) | 0.00 [‐0.09, 0.09] | |
| 5 Physical function ‐ scale 0 to 100 (higher score indicates improvement) ‐ MID 8.4 Show forest plot | 5 | Mean Difference (IV, Random, 95% CI) | Subtotals only | |
| 5.1 Short‐term, follow‐up 6 months | 3 | 336 | Mean Difference (IV, Random, 95% CI) | 3.47 [‐3.26, 10.20] |
| 5.2 Long‐term, follow‐up 12 months | 4 | 1860 | Mean Difference (IV, Random, 95% CI) | 2.19 [‐2.29, 6.67] |
| 5.3 Very long‐term, follow‐up longer than 12 months | 1 | 78 | Mean Difference (IV, Random, 95% CI) | 1.85 [‐2.25, 5.95] |
| 6 Physical function ‐ pooled RDs of workers with an improvement greater than the MID of 8.4 Show forest plot | 5 | Risk Difference (Random, 95% CI) | Subtotals only | |
| 6.1 Short‐term, follow‐up 6 months | 3 | Risk Difference (Random, 95% CI) | 0.03 [‐0.07, 0.13] | |
| 6.2 Long‐term, follow‐up 12 months | 4 | Risk Difference (Random, 95% CI) | 0.01 [‐0.02, 0.03] | |
| 6.3 Very long‐term, follow‐up longer than 12 months | 1 | Risk Difference (Random, 95% CI) | 0.0 [‐0.02, 0.02] | |
| 7 Social function ‐ scale to 0 to 100 (higher score indicates improvement) ‐ MID 11.7 Show forest plot | 2 | Mean Difference (IV, Random, 95% CI) | Subtotals only | |
| 7.1 Long‐term, follow‐up 12 months | 2 | 1636 | Mean Difference (IV, Random, 95% CI) | 2.84 [‐0.09, 5.77] |
| 8 Social function ‐ pooled RDs of workers with an improvement greater than the MID of 11.7 Show forest plot | 2 | Risk Difference (Random, 95% CI) | Subtotals only | |
| 8.1 Long‐term, follow‐up 12 months | 2 | Risk Difference (Random, 95% CI) | 0.01 [‐0.02, 0.04] | |
| 9 Mental function ‐ scale to 0 to 100 (higher score indicates improvement) ‐ MID 7.3 Show forest plot | 3 | Mean Difference (IV, Random, 95% CI) | Subtotals only | |
| 9.1 Short‐term, follow‐up 6 months | 1 | 125 | Mean Difference (IV, Random, 95% CI) | 1.85 [‐2.67, 6.37] |
| 9.2 Long‐term, follow‐up 12 months | 3 | 1737 | Mean Difference (IV, Random, 95% CI) | 3.14 [1.16, 5.11] |
| 9.3 Very long‐term, follow‐up longer than 12 months | 1 | 78 | Mean Difference (IV, Random, 95% CI) | 6.09 [0.56, 11.63] |
| 10 Mental function ‐ pooled RDs of workers with an improvement greater than the MID of 7.3 Show forest plot | 3 | Risk Difference (Random, 95% CI) | Subtotals only | |
| 10.1 Short‐term, follow‐up 6 months | 1 | Risk Difference (Random, 95% CI) | 0.0 [‐0.01, 0.01] | |
| 10.2 Long‐term, follow‐up 12 months | 3 | Risk Difference (Random, 95% CI) | 0.00 [‐0.01, 0.01] | |
| 10.3 Very long‐term, follow‐up longer than 12 months | 1 | Risk Difference (Random, 95% CI) | 0.0 [‐0.01, 0.01] | |
| 11 Depression ‐ scale 0 to 27 (higher score indicates deterioration) ‐ MID 5.0 Show forest plot | 4 | Mean Difference (IV, Random, 95% CI) | Subtotals only | |
| 11.1 Short‐term, follow‐up 6 months | 3 | 252 | Mean Difference (IV, Random, 95% CI) | 0.37 [‐2.81, 3.55] |
| 11.2 Long‐term, follow‐up 12 months | 2 | 420 | Mean Difference (IV, Random, 95% CI) | ‐0.00 [‐1.07, 1.07] |
| 12 Depression ‐ pooled RDs of workers with an improvement greater than the MID of 5.0 Show forest plot | 4 | Risk Difference (Random, 95% CI) | Subtotals only | |
| 12.1 Short‐term, follow‐up 6 months | 3 | Risk Difference (Random, 95% CI) | 0.03 [‐0.07, 0.12] | |
| 12.2 Long‐term, follow‐up 12 months | 2 | Risk Difference (Random, 95% CI) | 0.01 [‐0.04, 0.06] | |
| 13 Anxiety ‐ scale 0 to 21 (higher score indicates deterioration) ‐ MID 4.0 Show forest plot | 3 | Mean Difference (IV, Random, 95% CI) | Subtotals only | |
| 13.1 Short‐term, follow‐up 6 months | 2 | 208 | Mean Difference (IV, Random, 95% CI) | ‐0.02 [‐3.24, 3.21] |
| 13.2 Long‐term, follow‐up 12 months | 2 | 420 | Mean Difference (IV, Random, 95% CI) | 0.97 [‐0.17, 2.12] |
| 14 Anxiety ‐ pooled RDs of workers with an improvement greater than the MID of 4.0 Show forest plot | 3 | Risk Difference (Random, 95% CI) | Subtotals only | |
| 14.1 Short‐term, follow‐up 6 months | 2 | Risk Difference (Random, 95% CI) | ‐0.01 [‐0.08, 0.07] | |
| 14.2 Long‐term, follow‐up 12 months | 2 | Risk Difference (Random, 95% CI) | 0.02 [‐0.03, 0.08] | |