Program penyelarasan kembali bekerja untuk menambahbaik kembali bekerja dalam kalangan pekerja bercuti sakit.
Appendices
Appendix 1. MEDLINE search strategy
1. "absenteeism"[tw]
2. "sick days"[tw]
3. "illness days"[tw]
4. "sick listed"[tw]
5. ("long term"[tw] OR "absence"[tw] OR "leave"[tw]) AND ("disability"[tw] OR "sickness"[tw] OR "sick"[tw])
6. ("benefit"[tw] OR "benefits"[tw] OR "pension"[tw] OR "pensions"[tw]) AND ("claimant"[tw] OR "claimants"[tw] OR "claim"[tw] OR "claims"[tw])
7. "work disablement"[tw]
8. "work disability"[tw]
9. "working disability"[tw]
10. "work absence"[tw]
11. ("injured"[tw] OR "injury"[tw] OR "accident"[tw] OR "sickness"[tw] OR "sick"[tw] OR "disability"[tw] OR "disabled"[tw] OR "disablement"[tw] OR "invalid"[tw] OR "invalidity"[tw] OR "absent"[tw] OR "absence"[tw]) AND ("worker"[tw] OR "workers"[tw] OR "employee"[tw] OR "employees"[tw])
12. ("sickness"[tw] OR "disability"[tw] OR "disabled"[tw] OR "disablement"[tw] OR "invalid"[tw] OR "invalidity"[tw] OR "absent"[tw] OR "absence"[tw] OR "out of work"[tw] OR "social security"[tw] OR "social insurance"[tw]) AND ("benefit"[tw] OR "benefits"[tw] OR "beneficiaries"[tw] OR "beneficiary"[tw] OR "claimant"[tw] OR "claimants"[tw] OR "claim"[tw] OR "claims"[tw] OR "pension"[tw] OR "pensions"[tw] OR "pensioners"[tw] OR "pensioner"[tw] OR "compensation"[tw] OR "compensations"[tw])
13. "Insurance, disability"[tw]
14. "disability insurance"[tw]
15. ("workman's"[tw] OR "workman"[tw] OR "workmans"[tw] OR "workmen's"[tw] OR "workmen"[tw] OR "workmens"[tw] OR "worker's"[tw] OR "worker"[tw] OR "workers"[tw]) AND ("compensation"[tw] OR "compensations"[tw])
16. "case management"[tw]
17. "case manager"[tw]
18. "absence management"[tw]
19. "assertive community treatment"[tw]
20. "management programme"[tw]
21. "management program"[tw]
22. ("project"[tw] OR "programme"[tw] OR "program"[tw] OR "model"[tw] OR "interview"[tw] OR "interviews"[tw] OR "plan"[tw] OR "measure"[tw] OR "measures"[tw] OR "intervention"[tw] OR "interventions"[tw] OR "rehabilitation"[tw] OR "management"[tw]) AND ("co ordinator"[tw] OR "coordinator"[tw] OR "coordination"[tw] OR "co ordination"[tw] OR "coordinated"[tw] OR "co ordinated"[tw] OR "multidisciplinary"[tw] OR "multi disciplinary"[tw] OR "multi professional"[tw] OR "multiprofessional"[tw] OR "multimodal"[tw] OR "multi modal"[tw] OR "integrated"[tw] OR "patient centred"[tw] OR "patient focused"[tw] OR "individual"[tw] OR "individually"[tw] OR "face to face"[tw] OR "one on one"[tw] OR "in person"[tw] OR "personal"[tw] OR "personally"[tw] OR "customized"[tw] OR "customised"[tw] OR "tailored"[tw] OR "on the job"[tw] OR "work focused"[tw] OR "work related"[tw] OR "workplace"[tw] OR "work location"[tw] OR "work‐site"[tw] OR "work place"[tw] OR "job site"[tw] OR "worksite"[tw] OR "occupational"[tw] OR "vocational"[tw] OR "return to work"[tw] OR "return to work" [mesh] OR "counselling"[tw] OR "reintegration"[tw])
23. "rehabilitation"[tw] AND ("project"[tw] OR "programme"[tw] OR "program"[tw] OR "plan"[tw] OR "model"[tw] OR "measure"[tw] OR "measures"[tw] OR "intervention"[tw] OR "interview"[tw] OR "interviews"[tw] OR "intervention"[tw] OR "interventions"[tw] OR "management"[tw])
24. "randomized controlled trial"[pt]
25. "controlled clinical trial"[pt]
26. "randomized"[tiab]
27. "randomised"[tiab]
28. "randomly"[tiab]
29. "trial"[ti]
30. "clinical trials as topic"[mesh: noexp]
31. OR / 1 ‐ 15
32. OR / 16 ‐ 23
33. OR / 24 ‐ 30
34. AND / 31 – 33
Appendix 2. EMBASE search strategy
(("absenteeism" OR "sick days" OR "illness days" OR "sick listed" OR (("long term" OR "absence" OR "leave" ) NEAR/3 ("disability" OR "sickness" OR "sick")) OR (("benefit" OR "benefits" OR "pension" OR "pensions") AND ("claimant" OR "claimants" OR "claim" OR "claims")) OR "work disablement" OR "work disability" OR "working disability" OR "work absence" OR (("injured" OR "injury" OR "accident" OR "sickness" OR "sick" OR "disability" OR "disabled" OR "disablement" OR "invalid" OR "invalidity" OR "absent" OR "absence") AND ("worker" OR "workers" OR "employee" OR "employees")) OR (("sickness" OR "disability" OR "disabled" OR "disablement" OR "invalid" OR "invalidity" OR "absent" OR "absence" OR "out of work" OR "social security" OR "social insurance") NEAR/3 ("benefit" OR "benefits" OR "beneficiaries" OR "beneficiary" OR "claimant" OR "claimants" OR "claim" OR "claims" OR "pension" OR "pensions" OR "pensioners" OR "pensioner" OR "compensation" OR "compensations")) OR "Insurance, disability" OR "disability insurance" OR (("workman?s" OR "workman" OR "workmans" OR "workmen?s" OR "workmen" OR "workmens" OR "worker?s" OR "worker" OR "workers") Near/3 ("compensation" OR "compensations"))) AND ("case management" OR "case anager" OR "absence management" OR "assertive community treatment" OR "management programme" OR "management program" OR (("project" OR "programme" OR "program" OR "model" OR "interview" OR "interviews" OR "plan" OR "measure" OR "measures" OR "intervention" OR "interventions" OR "rehabilitation" OR "management") NEAR/3 ("co ordinator" OR "coordinator" OR "coordination" OR "co ordination" OR "coordinated" OR "co ordinated" OR "multidisciplinary" OR "multi disciplinary" OR "multi professional" OR "multiprofessional" OR "multimodal" OR "multi modal" OR "integrated" OR "patient centred" OR "patient focused" OR "individual" OR "individually" OR "face to face" OR "one on one" OR "in person" OR "personal" OR "personally" OR "customized" OR "customised" OR "tailored" OR "on the job" OR "work focused" OR "work related" OR "workplace" OR "work location" OR "work‐site" OR "work place" OR "job site" OR "worksite" OR "occupational" OR "vocational" OR "return to work" OR "counselling" OR "reintegration")) OR (("project" OR "programme" OR "program" OR "plan" OR "model" OR "measure" OR "measures" OR "intervention" OR "interview" OR "interviews" OR "intervention" OR "interventions" OR "management") NEAR/3 "rehabilitation"))):ti:ab:de AND ([controlled clinical trial]/lim OR [randomized controlled trial]/lim OR "randomized":ti:ab OR "randomly":ti:ab OR "trial":ti OR "controlled clinical trial":de OR "single blind procedure":de OR "double blind procedure":de OR "triple blind procedure":de OR (doubl* next blind*):ti:ab OR (singl* next blind*):ti:ab OR (assign*):ti:ab OR (allocate*):ti:ab OR (volunteer*):ti:ab) AND [embase]/lim
Appendix 3. CINAHL search strategy
TX (("absenteeism" OR "sick days" OR "illness days" OR "sick listed" OR (("long term" OR "absence" OR "leave") AND ("disability" OR "sickness" OR "sick")) OR (("benefit" OR "benefits" OR "pension" OR "pensions") AND ("claimant" OR "claimants" OR "claim" OR "claims")) OR "work disablement" OR "work disability" OR "working disability" OR "work absence" OR (("injured" OR "injury" OR "accident" OR "sickness" OR "sick" OR "disability" OR "disabled" OR "disablement" OR "invalid" OR "invalidity" OR "absent" OR "absence") AND ("worker" OR "workers" OR "employee" OR "employees")) OR (("sickness" OR "disability" OR "disabled" OR "disablement" OR "invalid" OR "invalidity" OR "absent" OR "absence" OR "out of work" OR "social security" OR "social insurance") AND ("benefit" OR "benefits" OR "beneficiaries" OR "beneficiary" OR "claimant" OR "claimants" OR "claim" OR "claims" OR "pension" OR "pensions" OR "pensioners" OR "pensioner" OR "compensation" OR "compensations")) OR "Insurance, disability" OR "disability insurance" OR (("workman?s" OR "workman" OR "workmans" OR "workmen?s" OR "workmen" OR "workmens" OR "worker?s" OR "worker" OR "workers") AND ("compensation" OR "compensations"))) AND ("case management" OR "case manager" OR "absence management" OR "assertive community Treatment" OR "management programme" OR "management program" OR (("project" OR "programme" OR "program" OR "model" OR "interview" OR "interviews" OR "plan" O "measure" OR "measures" OR "intervention" OR "interventions" OR "rehabilitation" OR "management") AND ("co ordinator" OR "coordinator" OR "coordination" OR "co ordination" OR "coordinated" OR "co ordinated" OR "multidisciplinary" OR "multi disciplinary" OR "multi professional" OR "multiprofessional" OR "multimodal" OR "multi modal" OR "integrated" OR "patient centred" OR "patient focused" OR "individual" OR "individually" OR "face to face" OR "one on one" OR "in person" OR "personal" OR "personally" OR "customized" OR "customised" OR "tailored" OR "on the job" OR "work focused" OR "work related" OR "workplace" OR "work location" OR "work‐site" OR "work place" OR "job site" OR "worksite" OR "occupational" OR "vocational" OR "return to work" OR "counselling" OR "reintegration")) OR (("project" OR "programme" OR "program" OR "plan" OR "model" OR "measure" OR "measures" OR "intervention" OR "interview" OR "interviews" OR "intervention" OR "interventions" OR "management" ) AND "rehabilitation"))) AND (TI (randomly OR randomi?ed OR trial) OR AB (randomly OR randomi?ed))
Appendix 4. PsycINFO search strategy
(("absenteeism" OR "sick days" OR "illness days" OR "sick listed" OR (("long term" OR "absence" OR "leave" ) ADJ3 ("disability" OR "sickness" OR "sick")) OR (("benefit" OR "benefits" OR "pension" OR "pensions") AND ("claimant" OR "claimants" OR "claim" OR "claims")) OR "work disablement" OR "work disability" OR "working disability" OR "work absence" OR (("injured" OR "injury" OR "accident" OR "sickness" OR "sick" OR "disability" OR "disabled" OR "disablement" OR "invalid" OR "invalidity" OR "absent" OR "absence") AND ("worker" OR "workers" OR "employee" OR "employees")) OR (("sickness" OR "disability" OR "disabled" OR "disablement" OR "invalid" OR "invalidity" OR "absent" OR "absence" OR "out of work" OR "social security" OR "social insurance") ADJ3 ("benefit" OR "benefits" OR "beneficiaries" OR "beneficiary" OR "claimant" OR "claimants" OR "claim" OR "claims" OR "pension" OR "pensions" OR "pensioners" OR "pensioner" OR "compensation" OR "compensations")) OR "Insurance, disability" OR "disability insurance" OR (("workman?s" OR "workman" OR "workmans" OR "workmen?s" OR "workmen" OR "workmens" OR "worker?s" OR "worker" OR "workers") Adj3 ("compensation" OR "compensations"))) AND ("case management" OR "case manager" OR "absence management" OR "assertive community Treatment" OR "management programme" OR "management program" OR (("project" OR "programme" OR "program" OR "model" OR "interview" OR "interviews" OR "plan" OR "measure" OR "measures" OR "intervention" OR "interventions" OR "rehabilitation" OR "management") ADJ3 ("co ordinator" OR "coordinator" OR "coordination" OR "co ordination" OR "coordinated" OR "co ordinated" OR "multidisciplinary" OR "multi disciplinary" OR "multi professional" OR "multiprofessional" OR "multimodal" OR "multi modal" OR "integrated" OR "patient centred" OR "patient focused" OR "individual" OR "individually" OR "face to face" OR "one on one" OR "in person" OR "personal" OR "personally" OR "customized" OR "customised" OR "tailored" OR "on the job" OR "work focused" OR "work related" OR "workplace" OR "work location" OR "work‐site" OR "work place" OR "job site" OR "worksite" OR "occupational" OR "vocational" OR "return to work" OR "counselling" OR "reintegration")) OR (("project" OR "programme" OR "program" OR "plan" OR "model" OR "measure" OR "measures" OR "intervention" OR "interview" OR "interviews" OR "intervention" OR "interventions" OR "management") ADJ3 "rehabilitation"))).tw. AND ("random*".ti,ab. OR "trial".ti.)
Appendix 5. CENTRAL search strategy
("Absenteeism" OR "sick leave" OR "sick absence" OR "sickness absence" OR "sick listed" OR ("long term" AND ("sickness" OR "sick")) OR "sickness benefit" OR "sickness benefits" OR (("benefit" OR "benefits" OR "pension" OR "pensions") AND ("claimant" OR "claimants" OR "claim" OR "claims")) OR "work disablement" OR "working disablement" OR "work disability" OR "working disability" OR (("injured" OR "injury" OR "accident" OR "sickness" OR "sick" OR "disability" OR "disabled" OR "disablement" OR "invalid" OR "invalidity" OR "absent" OR "absence" ) AND ("worker" OR "workers" OR "employee" OR "employees")) OR (("disability" OR "disabled" OR "disablement" OR "invalid" OR "invalidity" OR "absent" OR "absence" OR "out of work" OR "Social Security" OR "Insurance OR Disability" ) AND ("benefit" OR "benefits" OR "beneficiaries" OR "beneficiary" OR "claimant" OR "claimants" OR "claim" OR "claims" OR "pension" OR "pensions" OR "pensioners" OR "pensioner"))) AND ("case management" OR "case management" OR "case manager" OR "absence management" OR "assertive community Treatment" OR "management programmme" OR "management program" OR (("project" OR "programme" OR "program" OR "Model" OR "interview" OR "interviews" OR "plan" OR "measure" OR "measures" OR "intervention" OR "interventions" OR "rehabilitation" OR "rehabilitation" OR "management") AND ("co ordinator" OR "coordinator" OR "coordination" OR "co ordination" OR "coordinated" OR "co ordinated" OR "multidisciplinary" OR "multi disciplinary" OR "multi professional" OR "multiprofessional" OR "multimodal" OR "multi modal" OR "integrated" OR "patient centred" OR "patient focused" OR "individual" OR "individually" OR "face to face" OR "one on one" OR "in person" OR "personal" OR "personally" OR "customized" OR "customised" OR "tailored" OR "on the job" OR "work focused" OR "work related" OR "workplace" OR "occupational" OR "vocational" OR "return to work" OR "counselling" OR "reintegration")) OR (("project" OR "programme" OR "program" OR "plan" OR "Model" OR "measure" OR "measures" OR "intervention" OR "interview" OR "interviews" OR intervention OR interventions OR "management") AND "rehabilitation"))
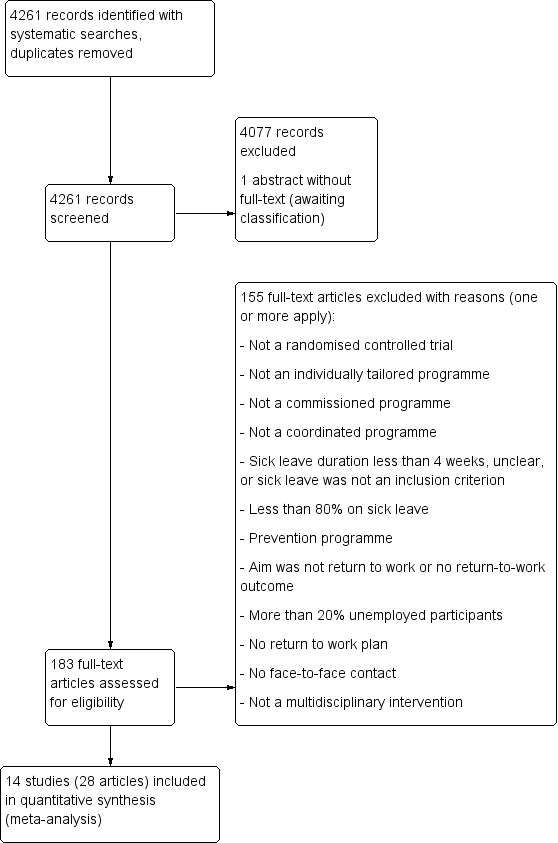
PRISMA Study flow diagram

Risk of bias graph: review author's judgements about each risk of bias item presented as percentages across all included studies.

Risk of bias summary: review authors' judgements about each risk of bias item for each included study.

Forest plot of comparison: time to return to work. RTWCP = return‐to‐work coordination programmes

Forest plot of comparison: cumulative sickness absence in work days. RTWCP = return‐to‐work coordination programmes
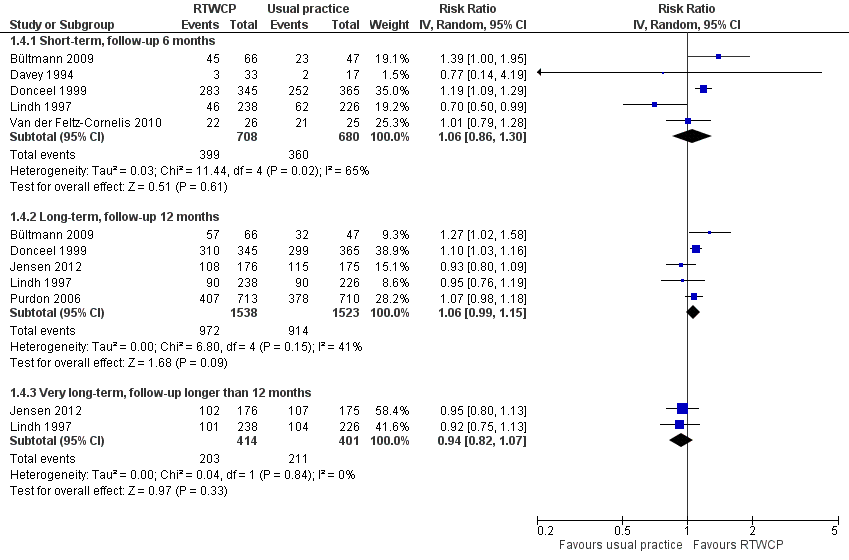
Forest plot of comparison: proportion at work at end of the follow‐up. RTWCP = return‐to‐work coordination programmes
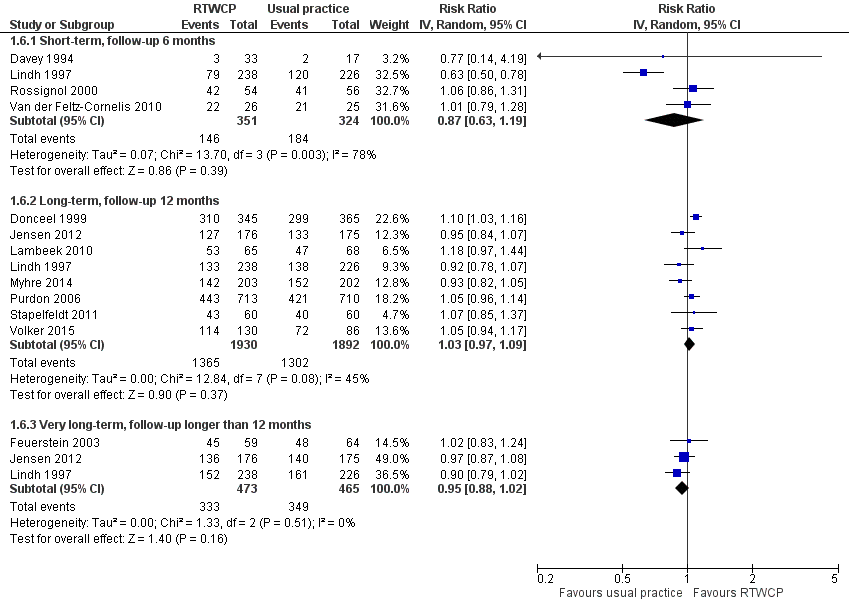
Forest plot of comparison: proportion who had ever returned to work. RTWCP = return‐to‐work coordination programmes

Comparison 1 Return‐to‐work outcomes, Outcome 1 Time to return to work.
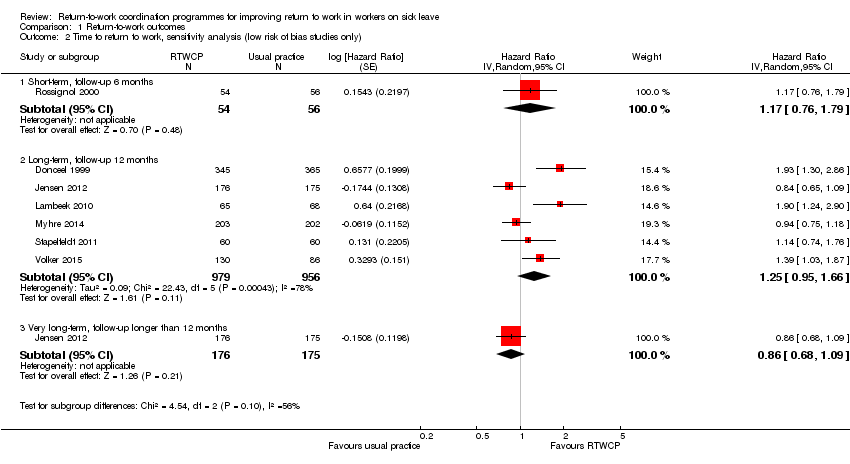
Comparison 1 Return‐to‐work outcomes, Outcome 2 Time to return to work, sensitivity analysis (low risk of bias studies only).

Comparison 1 Return‐to‐work outcomes, Outcome 3 Cumulative sickness absence in work days.
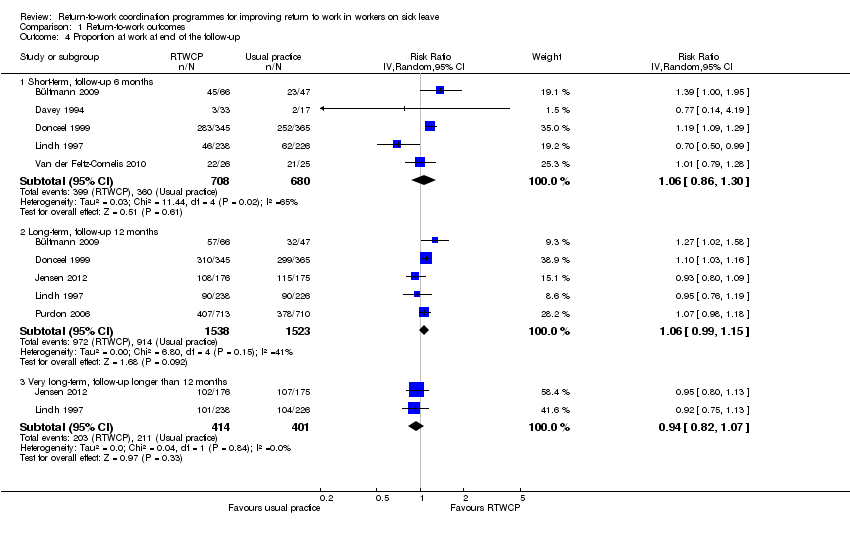
Comparison 1 Return‐to‐work outcomes, Outcome 4 Proportion at work at end of the follow‐up.
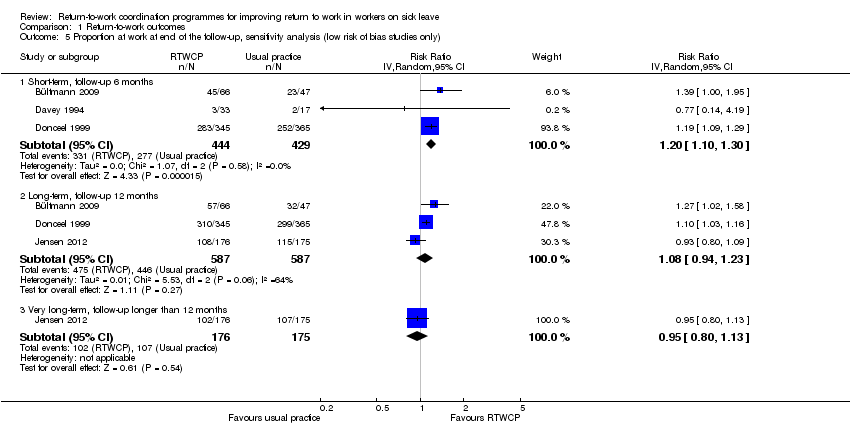
Comparison 1 Return‐to‐work outcomes, Outcome 5 Proportion at work at end of the follow‐up, sensitivity analysis (low risk of bias studies only).
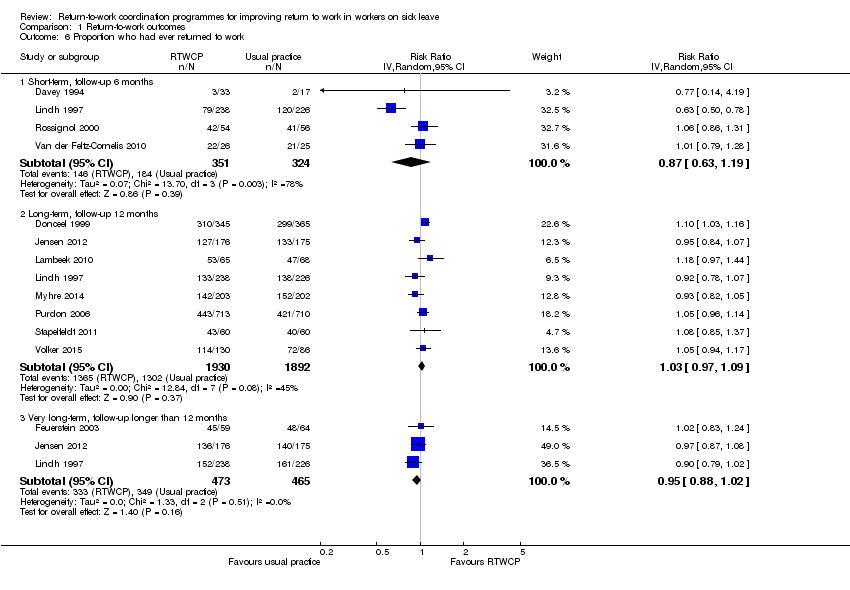
Comparison 1 Return‐to‐work outcomes, Outcome 6 Proportion who had ever returned to work.

Comparison 1 Return‐to‐work outcomes, Outcome 7 Proportion who had ever returned to work, sensitivity analysis (low risk of bias studies only).

Comparison 2 Patient‐reported outcomes, Outcome 1 Pain ‐ scale 0 to 100 (higher score indicates improvement) ‐ MID 10.0.

Comparison 2 Patient‐reported outcomes, Outcome 2 Pain ‐ pooled RDs of workers with an improvement greater than the MID of 10.0.

Comparison 2 Patient‐reported outcomes, Outcome 3 Overall function ‐ scale 0 to 100 (higher score indicates improvement) ‐ MID 10.0.

Comparison 2 Patient‐reported outcomes, Outcome 4 Overall function ‐ pooled RDs of workers with an improvement greater than the MID of 10.0.

Comparison 2 Patient‐reported outcomes, Outcome 5 Physical function ‐ scale 0 to 100 (higher score indicates improvement) ‐ MID 8.4.
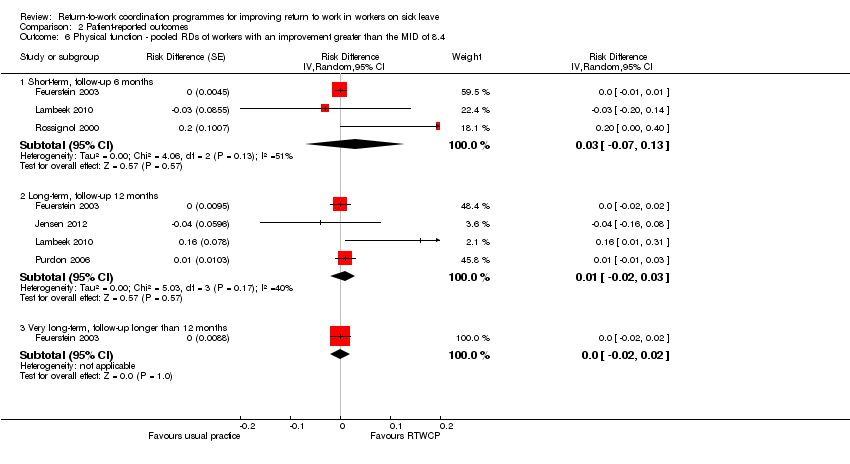
Comparison 2 Patient‐reported outcomes, Outcome 6 Physical function ‐ pooled RDs of workers with an improvement greater than the MID of 8.4.
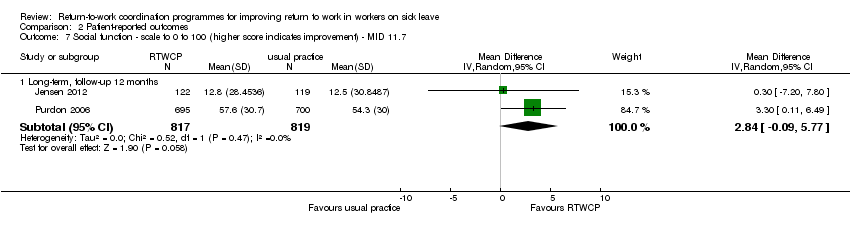
Comparison 2 Patient‐reported outcomes, Outcome 7 Social function ‐ scale to 0 to 100 (higher score indicates improvement) ‐ MID 11.7.
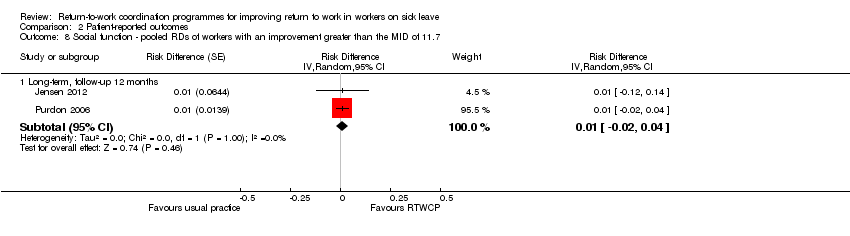
Comparison 2 Patient‐reported outcomes, Outcome 8 Social function ‐ pooled RDs of workers with an improvement greater than the MID of 11.7.

Comparison 2 Patient‐reported outcomes, Outcome 9 Mental function ‐ scale to 0 to 100 (higher score indicates improvement) ‐ MID 7.3.

Comparison 2 Patient‐reported outcomes, Outcome 10 Mental function ‐ pooled RDs of workers with an improvement greater than the MID of 7.3.
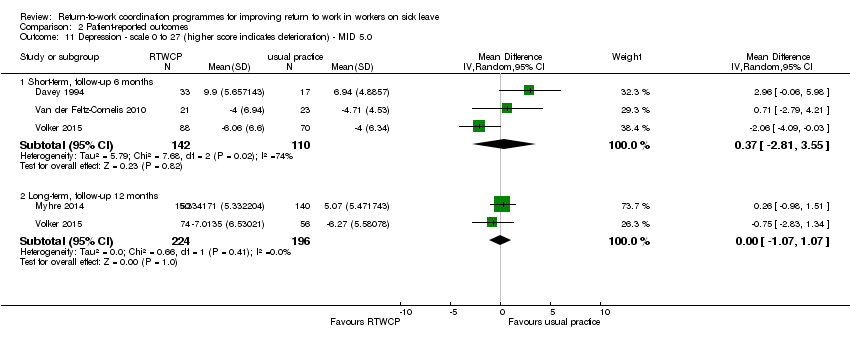
Comparison 2 Patient‐reported outcomes, Outcome 11 Depression ‐ scale 0 to 27 (higher score indicates deterioration) ‐ MID 5.0.

Comparison 2 Patient‐reported outcomes, Outcome 12 Depression ‐ pooled RDs of workers with an improvement greater than the MID of 5.0.
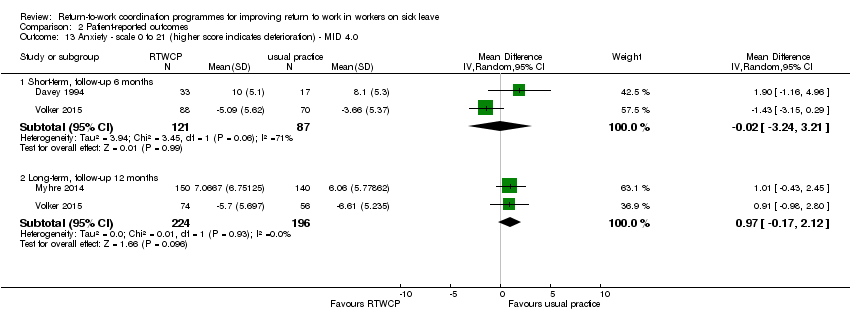
Comparison 2 Patient‐reported outcomes, Outcome 13 Anxiety ‐ scale 0 to 21 (higher score indicates deterioration) ‐ MID 4.0.
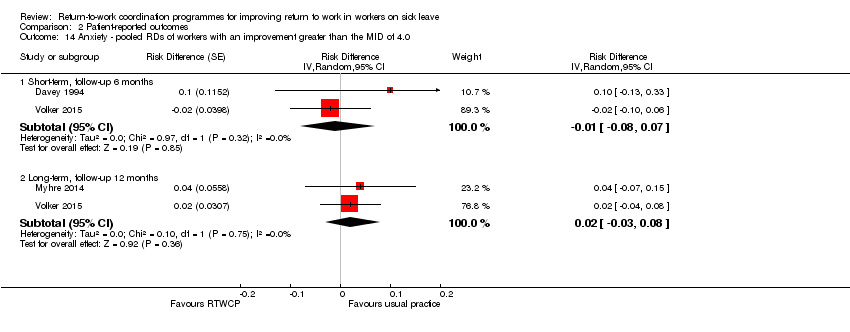
Comparison 2 Patient‐reported outcomes, Outcome 14 Anxiety ‐ pooled RDs of workers with an improvement greater than the MID of 4.0.
| Return to work coordination programmes compared to usual practice for improving return to work in workers on sick leave | |||||
| Patient or population: workers on sick leave | |||||
| Outcomes | Anticipated absolute effects* (95% CI) | Relative effect | № of participants | Quality of the evidence | |
| Risk with usual practice | Risk with return‐to‐work coordination programmes | ||||
| Time to return to work ‐ short‐term | — | — | HR 1.32 | 161 | ⊕⊕⊝⊝ |
| Time to return to work ‐ long‐term | — | — | HR 1.25 | 1935 | ⊕⊕⊝⊝ |
| Time to return to work ‐ very long‐term | — | — | HR 0.93 | 474 | ⊕⊕⊝⊝ |
| Cumulative sickness absence in work days ‐ short‐term | The mean cumulative sickness absence was 79.14 work days | The mean cumulative | — | 113 | ⊕⊕⊕⊝ |
| Cumulative sickness absence in work days ‐ long‐term | The mean cumulative sickness absence was 144 work days | The mean cumulative | — | 1339 | ⊕⊕⊝⊝ |
| Cumulative sickness absence in work days ‐ very long‐term | The mean cumulative sickness absence was 466 work days | The mean cumulative | — | 8052 | ⊕⊕⊕⊝ |
| Proportion at work at end of the follow‐up ‐ short‐term | 53 per 100 | 56 per 100 | RR 1.06 | 1388 | ⊕⊕⊝⊝ |
| Proportion at work at end of the follow‐up ‐ long‐term | 60 per 100 | 64 per 100 | RR 1.06 | 3061 | ⊕⊕⊝⊝ |
| Proportion at work at end of the follow‐up ‐ very long‐term | 53 per 100 | 49 per 100 | RR 0.94 | 815 | ⊕⊕⊝⊝ |
| Proportion who had ever returned to work ‐ short‐term | 57 per 100 | 49 per 100 | RR 0.87 | 675 | ⊕⊝⊝⊝ |
| Proportion who had ever returned to work ‐ long‐term | 69 per 100 | 71 per 100 | RR 1.03 | 3822 | ⊕⊕⊕⊝ |
| Proportion who had ever returned to work ‐ very long‐term | 75 per 100 | 71 per 100 | RR 0.95 | 938 | ⊕⊕⊝⊝ |
| *The risk in the intervention group (and its 95% confidence interval) is based on the assumed risk in the comparison group and the relative effect of the intervention (and its 95% CI). | |||||
| GRADE Working Group grades of evidence | |||||
| a Downgraded 1 level for risk of bias (attrition bias, reporting bias). | |||||
| Occupational or rehabilitation physician | General practitioner | (Occupational) physiotherapist | Psychologist, psychiatrist, psychotherapist | Occupational therapist | Social worker | Chiropractor | Other | |
| X | — | X | X | — | X | X | — | |
| X | — | X | X | X | — | — | — | |
| X (social insurance physician) | X | — | — | — | — | — | Other healthcare personnel, social insurance agent | |
| — | — | — | — | — | — | — | “[E].g. supervisor, injury compensation specialist, medical providers, claims examiner” | |
| X | X | X | — | X | X | — | — | |
| X | — | X | — | X | — | — | Medical specialist | |
| X | — | X | X | X | X | — | Nurse, vocational counsellor | |
| X | — | X | — | — | — | — | Case worker, medical specialist, group discussions, lecturer | |
| — | — | X | X | — | — | X | Podiatrists, osteopaths and dieticians | |
| X | — | X | — | — | — | X | — | |
| X (insurance physician) | X | X | — | X | — | — | Outpatient care provider, inpatient care provider, other care provider | |
| X | X | X | — | X | X | — | — | |
| X | X | — | X | — | — | — | — | |
| X | X | — | X | — | — | — | Web‐based eHealth Modules | |
| X = involved discipline | ||||||||
| Outcome or subgroup title | No. of studies | No. of participants | Statistical method | Effect size |
| 1 Time to return to work Show forest plot | 9 | Hazard Ratio (Random, 95% CI) | Subtotals only | |
| 1.1 Short‐term, follow‐up 6 months | 2 | 161 | Hazard Ratio (Random, 95% CI) | 1.32 [0.93, 1.88] |
| 1.2 Long‐term, follow‐up 12 months | 6 | 1935 | Hazard Ratio (Random, 95% CI) | 1.25 [0.95, 1.66] |
| 1.3 Very long‐term, follow‐up longer than 12 months | 2 | 474 | Hazard Ratio (Random, 95% CI) | 0.93 [0.74, 1.17] |
| 2 Time to return to work, sensitivity analysis (low risk of bias studies only) Show forest plot | 7 | Hazard Ratio (Random, 95% CI) | Subtotals only | |
| 2.1 Short‐term, follow‐up 6 months | 1 | 110 | Hazard Ratio (Random, 95% CI) | 1.17 [0.76, 1.79] |
| 2.2 Long‐term, follow‐up 12 months | 6 | 1935 | Hazard Ratio (Random, 95% CI) | 1.25 [0.95, 1.66] |
| 2.3 Very long‐term, follow‐up longer than 12 months | 1 | 351 | Hazard Ratio (Random, 95% CI) | 0.86 [0.68, 1.09] |
| 3 Cumulative sickness absence in work days Show forest plot | 7 | Mean Difference (IV, Random, 95% CI) | Subtotals only | |
| 3.1 Short‐term, follow‐up 6 months | 1 | 113 | Mean Difference (IV, Random, 95% CI) | ‐16.18 [‐32.42, 0.06] |
| 3.2 Long‐term, follow‐up 12 months | 6 | 1339 | Mean Difference (IV, Random, 95% CI) | ‐14.84 [‐38.56, 8.88] |
| 3.3 Very long‐term, follow‐up longer than 12 months | 1 | 8052 | Mean Difference (IV, Random, 95% CI) | 7.0 [‐15.17, 29.17] |
| 4 Proportion at work at end of the follow‐up Show forest plot | 7 | Risk Ratio (IV, Random, 95% CI) | Subtotals only | |
| 4.1 Short‐term, follow‐up 6 months | 5 | 1388 | Risk Ratio (IV, Random, 95% CI) | 1.06 [0.86, 1.30] |
| 4.2 Long‐term, follow‐up 12 months | 5 | 3061 | Risk Ratio (IV, Random, 95% CI) | 1.06 [0.99, 1.15] |
| 4.3 Very long‐term, follow‐up longer than 12 months | 2 | 815 | Risk Ratio (IV, Random, 95% CI) | 0.94 [0.82, 1.07] |
| 5 Proportion at work at end of the follow‐up, sensitivity analysis (low risk of bias studies only) Show forest plot | 4 | Risk Ratio (IV, Random, 95% CI) | Subtotals only | |
| 5.1 Short‐term, follow‐up 6 months | 3 | 873 | Risk Ratio (IV, Random, 95% CI) | 1.20 [1.10, 1.30] |
| 5.2 Long‐term, follow‐up 12 months | 3 | 1174 | Risk Ratio (IV, Random, 95% CI) | 1.08 [0.94, 1.23] |
| 5.3 Very long‐term, follow‐up longer than 12 months | 1 | 351 | Risk Ratio (IV, Random, 95% CI) | 0.95 [0.80, 1.13] |
| 6 Proportion who had ever returned to work Show forest plot | 12 | Risk Ratio (IV, Random, 95% CI) | Subtotals only | |
| 6.1 Short‐term, follow‐up 6 months | 4 | 675 | Risk Ratio (IV, Random, 95% CI) | 0.87 [0.63, 1.19] |
| 6.2 Long‐term, follow‐up 12 months | 8 | 3822 | Risk Ratio (IV, Random, 95% CI) | 1.03 [0.97, 1.09] |
| 6.3 Very long‐term, follow‐up longer than 12 months | 3 | 938 | Risk Ratio (IV, Random, 95% CI) | 0.95 [0.88, 1.02] |
| 7 Proportion who had ever returned to work, sensitivity analysis (low risk of bias studies only) Show forest plot | 8 | Risk Ratio (IV, Random, 95% CI) | Subtotals only | |
| 7.1 Short‐term, follow‐up 6 months | 2 | 160 | Risk Ratio (IV, Random, 95% CI) | 1.06 [0.86, 1.31] |
| 7.2 Long‐term, follow‐up 12 months | 6 | 1935 | Risk Ratio (IV, Random, 95% CI) | 1.04 [0.96, 1.11] |
| 7.3 Very long‐term, follow‐up longer than 12 months | 1 | 351 | Risk Ratio (IV, Random, 95% CI) | 0.97 [0.87, 1.08] |
| Outcome or subgroup title | No. of studies | No. of participants | Statistical method | Effect size |
| 1 Pain ‐ scale 0 to 100 (higher score indicates improvement) ‐ MID 10.0 Show forest plot | 7 | Mean Difference (IV, Random, 95% CI) | Subtotals only | |
| 1.1 Short‐term, follow‐up 6 months | 4 | 427 | Mean Difference (IV, Random, 95% CI) | ‐4.76 [‐14.89, 5.36] |
| 1.2 Long‐term, follow‐up 12 months | 6 | 2319 | Mean Difference (IV, Random, 95% CI) | ‐2.98 [‐5.33, ‐0.63] |
| 1.3 Very long‐term, longer than 12 months | 1 | 80 | Mean Difference (IV, Random, 95% CI) | ‐7.20 [‐15.76, 1.36] |
| 2 Pain ‐ pooled RDs of workers with an improvement greater than the MID of 10.0 Show forest plot | 7 | Risk Difference (Random, 95% CI) | Subtotals only | |
| 2.1 Short‐term, follow‐up 6 months | 4 | Risk Difference (Random, 95% CI) | ‐0.03 [‐0.11, 0.05] | |
| 2.2 Long‐term, follow‐up 12 months | 6 | Risk Difference (Random, 95% CI) | ‐0.03 [‐0.06, ‐0.00] | |
| 2.3 Very long‐term, longer than 12 months | 1 | Risk Difference (Random, 95% CI) | ‐0.02 [‐0.11, 0.07] | |
| 3 Overall function ‐ scale 0 to 100 (higher score indicates improvement) ‐ MID 10.0 Show forest plot | 6 | Mean Difference (IV, Random, 95% CI) | Subtotals only | |
| 3.1 Short‐term, follow‐up 6 months | 3 | 295 | Mean Difference (IV, Random, 95% CI) | 8.13 [3.95, 12.32] |
| 3.2 Long‐term, follow‐up 12 months | 5 | 2235 | Mean Difference (IV, Random, 95% CI) | 2.74 [‐0.15, 5.64] |
| 4 Overall function ‐ pooled RDs of workers with an improvement greater than the MID of 10.0 Show forest plot | 6 | Risk Difference (Random, 95% CI) | Subtotals only | |
| 4.1 Short‐term, follow‐up, 6 months | 3 | Risk Difference (Random, 95% CI) | 0.16 [‐0.04, 0.37] | |
| 4.2 Long‐term, follow‐up 12 months | 5 | Risk Difference (Random, 95% CI) | 0.00 [‐0.09, 0.09] | |
| 5 Physical function ‐ scale 0 to 100 (higher score indicates improvement) ‐ MID 8.4 Show forest plot | 5 | Mean Difference (IV, Random, 95% CI) | Subtotals only | |
| 5.1 Short‐term, follow‐up 6 months | 3 | 336 | Mean Difference (IV, Random, 95% CI) | 3.47 [‐3.26, 10.20] |
| 5.2 Long‐term, follow‐up 12 months | 4 | 1860 | Mean Difference (IV, Random, 95% CI) | 2.19 [‐2.29, 6.67] |
| 5.3 Very long‐term, follow‐up longer than 12 months | 1 | 78 | Mean Difference (IV, Random, 95% CI) | 1.85 [‐2.25, 5.95] |
| 6 Physical function ‐ pooled RDs of workers with an improvement greater than the MID of 8.4 Show forest plot | 5 | Risk Difference (Random, 95% CI) | Subtotals only | |
| 6.1 Short‐term, follow‐up 6 months | 3 | Risk Difference (Random, 95% CI) | 0.03 [‐0.07, 0.13] | |
| 6.2 Long‐term, follow‐up 12 months | 4 | Risk Difference (Random, 95% CI) | 0.01 [‐0.02, 0.03] | |
| 6.3 Very long‐term, follow‐up longer than 12 months | 1 | Risk Difference (Random, 95% CI) | 0.0 [‐0.02, 0.02] | |
| 7 Social function ‐ scale to 0 to 100 (higher score indicates improvement) ‐ MID 11.7 Show forest plot | 2 | Mean Difference (IV, Random, 95% CI) | Subtotals only | |
| 7.1 Long‐term, follow‐up 12 months | 2 | 1636 | Mean Difference (IV, Random, 95% CI) | 2.84 [‐0.09, 5.77] |
| 8 Social function ‐ pooled RDs of workers with an improvement greater than the MID of 11.7 Show forest plot | 2 | Risk Difference (Random, 95% CI) | Subtotals only | |
| 8.1 Long‐term, follow‐up 12 months | 2 | Risk Difference (Random, 95% CI) | 0.01 [‐0.02, 0.04] | |
| 9 Mental function ‐ scale to 0 to 100 (higher score indicates improvement) ‐ MID 7.3 Show forest plot | 3 | Mean Difference (IV, Random, 95% CI) | Subtotals only | |
| 9.1 Short‐term, follow‐up 6 months | 1 | 125 | Mean Difference (IV, Random, 95% CI) | 1.85 [‐2.67, 6.37] |
| 9.2 Long‐term, follow‐up 12 months | 3 | 1737 | Mean Difference (IV, Random, 95% CI) | 3.14 [1.16, 5.11] |
| 9.3 Very long‐term, follow‐up longer than 12 months | 1 | 78 | Mean Difference (IV, Random, 95% CI) | 6.09 [0.56, 11.63] |
| 10 Mental function ‐ pooled RDs of workers with an improvement greater than the MID of 7.3 Show forest plot | 3 | Risk Difference (Random, 95% CI) | Subtotals only | |
| 10.1 Short‐term, follow‐up 6 months | 1 | Risk Difference (Random, 95% CI) | 0.0 [‐0.01, 0.01] | |
| 10.2 Long‐term, follow‐up 12 months | 3 | Risk Difference (Random, 95% CI) | 0.00 [‐0.01, 0.01] | |
| 10.3 Very long‐term, follow‐up longer than 12 months | 1 | Risk Difference (Random, 95% CI) | 0.0 [‐0.01, 0.01] | |
| 11 Depression ‐ scale 0 to 27 (higher score indicates deterioration) ‐ MID 5.0 Show forest plot | 4 | Mean Difference (IV, Random, 95% CI) | Subtotals only | |
| 11.1 Short‐term, follow‐up 6 months | 3 | 252 | Mean Difference (IV, Random, 95% CI) | 0.37 [‐2.81, 3.55] |
| 11.2 Long‐term, follow‐up 12 months | 2 | 420 | Mean Difference (IV, Random, 95% CI) | ‐0.00 [‐1.07, 1.07] |
| 12 Depression ‐ pooled RDs of workers with an improvement greater than the MID of 5.0 Show forest plot | 4 | Risk Difference (Random, 95% CI) | Subtotals only | |
| 12.1 Short‐term, follow‐up 6 months | 3 | Risk Difference (Random, 95% CI) | 0.03 [‐0.07, 0.12] | |
| 12.2 Long‐term, follow‐up 12 months | 2 | Risk Difference (Random, 95% CI) | 0.01 [‐0.04, 0.06] | |
| 13 Anxiety ‐ scale 0 to 21 (higher score indicates deterioration) ‐ MID 4.0 Show forest plot | 3 | Mean Difference (IV, Random, 95% CI) | Subtotals only | |
| 13.1 Short‐term, follow‐up 6 months | 2 | 208 | Mean Difference (IV, Random, 95% CI) | ‐0.02 [‐3.24, 3.21] |
| 13.2 Long‐term, follow‐up 12 months | 2 | 420 | Mean Difference (IV, Random, 95% CI) | 0.97 [‐0.17, 2.12] |
| 14 Anxiety ‐ pooled RDs of workers with an improvement greater than the MID of 4.0 Show forest plot | 3 | Risk Difference (Random, 95% CI) | Subtotals only | |
| 14.1 Short‐term, follow‐up 6 months | 2 | Risk Difference (Random, 95% CI) | ‐0.01 [‐0.08, 0.07] | |
| 14.2 Long‐term, follow‐up 12 months | 2 | Risk Difference (Random, 95% CI) | 0.02 [‐0.03, 0.08] | |