Eisentherapie für präoperative Anämie
Appendices
Appendix 1. Search strategies
Cochrane Injuries Group Specialised Register & Cochrane Central Register of Controlled Trials (CENTRAL) (Cochrane Library)
#1MESH DESCRIPTOR iron EXPLODE ALL TREES
#2MESH DESCRIPTOR ferric compounds EXPLODE ALL TREES
#3MESH DESCRIPTOR ferrous compounds EXPLODE ALL TREES
#4iron:TI,AB,KY
#5(((ferric OR ferrous) adj5 (compound*))):TI,AB,KY
#6#1 OR #2 OR #3 OR #4 OR #5
#7MESH DESCRIPTOR preoperative period EXPLODE ALL TREES
#8MESH DESCRIPTOR preoperative care
#9(((prior OR before) adj3 (surg* OR operat*))):TI,AB,KY
#10pre?operat*:TI,AB,KY
#11#7 OR #8 OR #9 OR #10
#12#6 AND #11
#13#12 NOT INMEDLINE NOT INEMBASE
Ovid MEDLINE(R), Ovid MEDLINE(R) In‐Process & Other Non‐Indexed Citations, Ovid MEDLINE(R) Daily and Ovid OLDMEDLINE(R)
1. exp Iron/
2. exp Ferric Compounds/
3. exp Ferrous Compounds/
4. iron.ab,ti.
5. ((ferric or ferrous) adj5 compound*).ab,ti.
6. or/1‐5
7. Pre?operat*.ab,ti.
8. ((prior or before) adj3 (surg* or operat*)).ab,ti.
9. exp Preoperative Period/
10. Preoperative Care/
11. 7 or 8 or 9 or 10
12. 6 and 11
13. randomi?ed.ab,ti.
14. randomized controlled trial.pt.
15. controlled clinical trial.pt.
16. placebo.ab.
17. clinical trials as topic.sh.
18. randomly.ab.
19. trial.ti.
20. Comparative Study/
21. 13 or 14 or 15 or 16 or 17 or 18 or 19 or 20
22. (animals not (humans and animals)).sh.
23. 21 not 22
24. 12 and 23
Embase Classic + Embase (OvidSP)
1. exp Iron/
2. exp Ferric Compounds/
3. exp Ferrous Compounds/
4. iron.ab,ti.
5. ((ferric or ferrous) adj5 compound*).ab,ti.
6. or/1‐5
7. Pre?operat*.ab,ti.
8. ((prior or before) adj3 (surg* or operat*)).ab,ti.
9. exp Preoperative Period/
10. Preoperative Care/
11. 7 or 8 or 9 or 10
12. 6 and 11
13. exp Randomized Controlled Trial/
14. exp controlled clinical trial/
15. exp controlled study/
16. comparative study/
17. randomi?ed.ab,ti.
18. placebo.ab.
19. *Clinical Trial/
20. exp major clinical study/
21. randomly.ab.
22. (trial or study).ti.
23. 13 or 14 or 15 or 17 or 18 or 19 or 20 or 21 or 22
24. exp animal/ not (exp human/ and exp animal/)
25. 23 not 24
26. 12 and 25
PubMed
(((((((("Comparative Study"[Publication Type]) OR "Randomized Controlled Trial"[Publication Type]) OR "Controlled Clinical Trial"[Publication Type])) OR (((((((randomized[Title/Abstract]) OR randomised[Title/Abstract]) OR placebo[Title/Abstract]) OR randomly[Title/Abstract]) OR trial[Title/Abstract]) OR groups[Title/Abstract]) OR group[Title/Abstract]))) NOT (("Animals"[Mesh]) NOT ("Animals"[Mesh] AND "Humans"[Mesh])))) AND (((((((("preoperative surgery"[Title/Abstract]) OR "before surgery"[Title/Abstract]) OR "before surgical intervention"[Title/Abstract]) OR "before operation"[Title/Abstract])) OR (("Preoperative Period"[Mesh]) OR "Preoperative Care"[Mesh:noexp]))) AND (((((iron[Title/Abstract]) OR Ferrous compound*[Title/Abstract]) OR ferric compound*[Title/Abstract])) OR ((("Iron"[Mesh]) OR "Ferric Compounds"[Mesh]) OR "Ferrous Compounds"[Mesh])))
Web of Science Index Expanded (SCI‐EXPANDED) & Conference Proceedings Citation Index‐Science (CPCI‐S)
#9#8 AND #7 AND #6
#8TS=((preoperative or pre‐operative) AND (care or period))
#7TS=(iron or "ferric compounds" or "ferrous compounds")
#6#5 AND #4
#5TS=(human*)
#4#3 OR #2 OR #1
#3TS=((singl* OR doubl* OR trebl* OR tripl*) SAME (blind* OR mask*))
#2TS=(controlled clinical trial OR controlled trial OR clinical trial OR placebo)
#1TS=(randomised OR randomized OR randomly OR random order OR random sequence OR random allocation OR randomly allocated OR at random OR randomized controlled trial)
Clinicaltrials.gov
( preoperative OR pre‐operative ) AND INFLECT EXACT "Interventional" [STUDY‐TYPES] AND anaemia [DISEASE] AND iron [TREATMENT]
WHO International Clinical Trials Registry Platform (ICTRP) Search Portal
Title: Surgery
AND
Condition: Anaemia
AND
Recruitment status: ALL

Study flow diagram.

Risk of bias graph: review authors' judgements about each risk of bias item presented as percentages across all included studies. Three studies are included in this review.

Risk of bias summary: review authors' judgements about each risk of bias item for each included study.

Comparison 1 Iron therapy versus placebo or no iron therapy, Outcome 1 Proportion of patients who received a blood transfusion.

Comparison 1 Iron therapy versus placebo or no iron therapy, Outcome 2 Haemoglobin levels pre‐treatment (g/dL).

Comparison 1 Iron therapy versus placebo or no iron therapy, Outcome 3 Haemoglobin levels at end of treatment pre‐op (g/dL).

Comparison 1 Iron therapy versus placebo or no iron therapy, Outcome 4 Haemoglobin levels after treatment post‐op (g/dL).
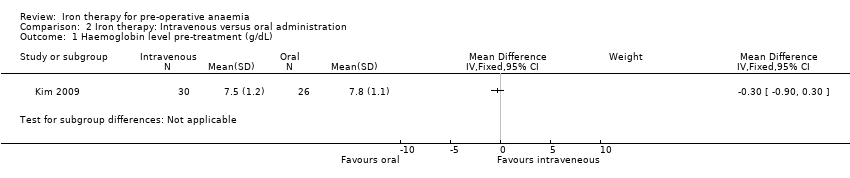
Comparison 2 Iron therapy: Intravenous versus oral administration, Outcome 1 Haemoglobin level pre‐treatment (g/dL).

Comparison 2 Iron therapy: Intravenous versus oral administration, Outcome 2 Haemoglobin level post‐treatment pre‐op (g/dL).

Comparison 2 Iron therapy: Intravenous versus oral administration, Outcome 3 Ferritin level pre‐treatment (ɥg/L).

Comparison 2 Iron therapy: Intravenous versus oral administration, Outcome 4 Ferritin level post‐treatment (ɥg/L).
| Iron therapy versus placebo or no iron therapy for pre‐operative anaemia | ||||||
| Patient or population: Patients with pre‐operative anaemia | ||||||
| Outcomes | Illustrative comparative risks* (95% CI) | Relative effect | No of Participants | Quality of the evidence | Comments | |
| Assumed risk | Corresponding risk | |||||
| Control | Iron therapy | |||||
| Proportion of patients who received a blood transfusion | 635 per 1000 | 356 per 1000 | RR 0.56 | 38 | ⊕⊕⊝⊝ | |
| Amount of blood transfused per patient (in units) | Data from two small studies could not be combined as they were skewed and reported as medians and ranges. One RCT in 18 people reported a difference in medians of 0 (interquartile range: 1) with iron therapy. Another RCT in 20 people reported a median difference of 1 unit with iron therapy (range 0 to 2). | ‐ | 38 | ⊕⊕⊝⊝ | It is not possible to combine the data because they are skewed. These are the raw data. | |
| Post‐operative mortality | ‐ | ‐ | ‐ | ‐ | ‐ | This outcome was not reported in either of the two studies available. |
| Post‐operative morbidity | ‐ | ‐ | ‐ | ‐ | ‐ | This outcome was not reported in either of the two studies available. |
| Any validated measure of quality of life | ‐ | ‐ | ‐ | ‐ | ‐ | This outcome was not reported in either of the two studies available. |
| Haemoglobin levels at end of treatment pre‐op (g/dL) | mean 11.9 g/dL (SD 2.6) | mean 11.2 g/d L(SD 1.95) | The mean haemoglobin levels at end of treatment pre‐op (g/dl) in the intervention groups was 0.7 g/dL lower | 18 | ⊕⊕⊝⊝ | Data from one study; the raw data are presented. |
| *The basis for the assumed risk (e.g. the median control group risk across studies) is provided in footnotes. The corresponding risk (and its 95% confidence interval) is based on the assumed risk in the comparison group and the relative effect of the intervention (and its 95% CI). | ||||||
| GRADE Working Group grades of evidence | ||||||
| 1 Only two small randomised control trials and a subset of anaemic patients resulting in a very small number of participants. | ||||||
| Iron therapy: Intravenous versus oral administration for pre‐operative anaemia | ||||||
| Patient or population: Patients with pre‐operative anaemia | ||||||
| Outcomes | Illustrative comparative risks* (95% CI) | Relative effect | No of Participants | Quality of the evidence | Comments | |
| Assumed risk | Corresponding risk | |||||
| Oral iron therapy | Intravenous iron therapy | |||||
| Proportion of patients who received a blood transfusion | ‐ | ‐ | ‐ | ‐ | ‐ | This outcome was not reported in the one study available. |
| Amount of blood transfused per patient (in units) | ‐ | ‐ | ‐ | ‐ | ‐ | This outcome was not reported in the one study available. |
| Post‐operative mortality | ‐ | ‐ | ‐ | ‐ | ‐ | This outcome was not reported in the one study available. |
| Post‐operative morbidity | ‐ | ‐ | ‐ | ‐ | ‐ | This outcome was not reported in the one study available. |
| Any validated measure of quality of life | ‐ | ‐ | ‐ | ‐ | ‐ | This outcome was not reported in the one study available. |
| Haemoglobin levels at end of treatment pre‐op (g/dL) | mean 8.6 g/dL (SD 1.4) | mean 10.5 g/dL (SD 1.4) | The mean haemoglobin levels at end of treatment pre‐op (g/dl) in the intravenous group was | 56 | ⊕⊕⊝⊝ | |
| *The basis for the assumed risk (e.g. the median control group risk across studies) is provided in footnotes. The corresponding risk (and its 95% confidence interval) is based on the assumed risk in the comparison group and the relative effect of the intervention (and its 95% CI). | ||||||
| GRADE Working Group grades of evidence | ||||||
| 1 Study excluded those with less than 80% compliance with therapy and compliance was lower in the oral administration group. | ||||||
| Outcome or subgroup title | No. of studies | No. of participants | Statistical method | Effect size |
| 1 Proportion of patients who received a blood transfusion Show forest plot | 2 | 38 | Risk Ratio (M‐H, Fixed, 95% CI) | 0.56 [0.27, 1.18] |
| 2 Haemoglobin levels pre‐treatment (g/dL) Show forest plot | 1 | Mean Difference (IV, Fixed, 95% CI) | Totals not selected | |
| 3 Haemoglobin levels at end of treatment pre‐op (g/dL) Show forest plot | 1 | Mean Difference (IV, Fixed, 95% CI) | Totals not selected | |
| 4 Haemoglobin levels after treatment post‐op (g/dL) Show forest plot | 1 | Mean Difference (IV, Fixed, 95% CI) | Totals not selected | |
| Outcome or subgroup title | No. of studies | No. of participants | Statistical method | Effect size |
| 1 Haemoglobin level pre‐treatment (g/dL) Show forest plot | 1 | Mean Difference (IV, Fixed, 95% CI) | Subtotals only | |
| 2 Haemoglobin level post‐treatment pre‐op (g/dL) Show forest plot | 1 | Mean Difference (IV, Fixed, 95% CI) | Subtotals only | |
| 3 Ferritin level pre‐treatment (ɥg/L) Show forest plot | 1 | Mean Difference (IV, Fixed, 95% CI) | Subtotals only | |
| 4 Ferritin level post‐treatment (ɥg/L) Show forest plot | 1 | Mean Difference (IV, Fixed, 95% CI) | Subtotals only | |