Tasas de respuesta y de remisión placebo en los ensayos aleatorios de tratamiento de inducción y mantenimiento para la colitis ulcerosa
Información
- DOI:
- https://doi.org/10.1002/14651858.CD011572.pub2Copiar DOI

- Base de datos:
-
- Cochrane Database of Systematic Reviews
- Versión publicada:
-
- 08 septiembre 2017see what's new
- Tipo:
-
- Intervention
- Etapa:
-
- Review
- Grupo Editorial Cochrane:
-
Grupo Cochrane de Salud digestiva
- Copyright:
-
- Copyright © 2017 The Cochrane Collaboration. Published by John Wiley & Sons, Ltd.
Cifras del artículo
Altmetric:
Citado por:
Autores
Contributions of authors
Study design: Vipul Jairath, GY Zou, Clear E Parker, John K MacDonald, Simon Travis, Geert D'Haens, William J Sandborn
Data screening: Vipul Jairath, Claire E Parker
Data extraction: Vipul Jairath, Claire E Parker, Turki AlAmeel, Mohammad Al Beshir, Majid A Almadi, Talal Al‐Taweel, Nathan SS Atkinson, Sujata Biswas, Thomas Chapman, Parambir S Dulai, Mark A Glaire, Daniël R Hoekman, Andreas Koutsoumpas, Elizabeth Minas, Mahmoud H Mosli, Mark Samaan
Statistical analysis: Vipul Jairath, GY Zou
Manuscript preparation: Vipul Jairath, Claire E Parker
Revision for intellectual content: Vipul Jairath, Claire E Parker, Turki AlAmeel, Mohammad Al Beshir, Majid A Almadi, Talal Al‐Taweel, Nathan SS Atkinson, Sujata Biswas, Thomas Chapman, Parambir S Dulai, Mark A Glaire, Daniël R Hoekman, Andreas Koutsoumpas, Elizabeth Minas, Mahmoud H Mosli, Mark Samaan, John K MacDonald, Simon Travis, Geert D'Haens, William J Sandborn
Declarations of interest
Vipul Jairath has received consulting fees from Sandoz, Takeda, Abbvie, Janssen; and speakers fees from Takeda, Abbvie, Ferring, Janssen All of these financial activities are outside of the submitted work.
GY Zou: None known
Claire E Parker: None known
John K MacDonald: None known
Turki AlAmeel: None known
Mohammad Al Beshir: None known
Majid A Almadi: None known
Talal Al‐Taweel has received consulting fees from AbbVie and Takeda; and lecture fees from Abbvie and Janssen and travel/accommodations/meeting expenses from Abbvie, Janssen, Novartis, Newbridge and Takeda. All of these financial activities are outside the submitted work.
Nathan Atkinson has received funds from AbbVie for travel/accommodations/meeting expenses. All of these financial activities are outside the submitted work.
Sujata Biswas: None known
Thomas Chapman has received support for a DPhil in Biomedical and Clinical Sciences from the Wellcome Trust and Oxford BRC. The topic of study relates to the immunology of Crohn's disease. Dr Chapman has no other known declarations of interest.
Parambir Dulai has received consulting fees from Takeda, research support (grants/grants pending) from Takeda and Pfizer; and payment for lectures from Takeda. All of these financial activities are outside of the submitted work.
Mark A Glaire: None known
Daniël R Hoekman: None known
Andreas Koutsoumpas: None known
Elizabeth MInas: None known
Mahmoud H Mosli: None known
Mark Samaan: None known
Reena Khanna has received honoraria from AbbVie, Jansen, Pfizer, Shire, and Takeda for consultancy. All of these financial activities are outside of the submitted work.
Simon Travis declined commercial consultancy or speaking engagements to avoid any perception of a conflict of interest as President of ECCO 2012‐2014. Since then he has received fees for consulting from AbbVie, Astra Zeneca, Celgene, Falk, Ferring, GSK, Janssen, Merck (to the Institution), Novartis, Novo Nordisk (both self and Institution), NPS Pharmaceuticals, Pfizer, Proximagen, Takeda, Topivert, Vertex (to the Institution), Warner‐Chilcott Amgen, Biogen, Boehringer Ingelheim, Bristol‐Myers Squibb, Cosmo, Lilly, Neovacs, Shire, Sigmoid Pharma, UCB, VHsquared and Vifor; lecture fee(s) from AbbVie, Ferring, Takeda, Amgen, Biogen, fee(s) for expert testimony to the FDA and EMA from Cosmo Technologies and Santarus; royalties from Wiley Blackwel, Elsevier and Oxford University Press for books; and funding from Schering Plough, Procter & Gamble, Merck and AbbVie for part salary for a nurse involved in therapeutic education. All of these financial activities are outside of the submitted work.
Geert D’Haens has received consulting fees from Abbvie, Ablynx, Actogenix, Amgen, AM Pharma, AstraZeneca, Boerhinger Ingelheim, Cosmo, Ferring, DrFALK Pharma, Celgene, Celltrion, Centocor/Jansen Biologics, Engene, Galapagos, Giuliani, GSK, Hospira, Millenium/Takeda, Mitsubishi Pharma, MSD, Mundipharma, Novonordisk, Pfizer, Prometheus Laboratories, Receptos, Salix, Sandoz, SetpointShire, TEVA, Tigenix, Tillotts, and Versant; he has received grants/has grants pending from Abbvie, MSD, Takeda, GSK, GivenImaging and Photopill; he has received payment for lectures from Abbvie, Ferring, Centocor/Jansen Biologics, Millenium/Takeda, MSD, Shire, and Tillotts; he has stock options with Engene. All of these financial activities are outside the submitted work.
William Sandborn has received consultancy fees from Abbott Laboratories, ActoGeniX NV, AGI Therapeutics, Inc., Alba Therapeutics Corporation, Albireo, Alfa Wasserman, Amgen, AM‐Pharma BV, Anaphore, Astellas Pharma, Athersys, Inc., Atlantic Healthcare Limited, Axcan Pharma (now Aptalis), BioBalance Corporation, Boehringer‐Ingelheim Inc, Bristol Meyers Squibb: (both money paid to WS and institution), Celegene, Celek Pharmaceuticals, Cellerix SL, Cerimon Pharmaceuticals, ChemoCentryx, CoMentis, Cosmo Technologies, Coronado Biosciences, Cytokine Pharmasciences, Eagle Pharmaceuticals, Eisai Medical Research Inc., Elan Pharmaceuticals: (both money paid to WS and institution), EnGene, Inc., Eli Lilly, Enteromedics: (both money paid to WS and institution), Exagen Diagnostics, Inc., Ferring Pharmaceuticals, Flexion Therapeutics, Inc., Funxional Therapeutics Limited, Genzyme Corporation, Genentech (now Roche): (both money paid to WS and institution), Gilead Sciences, Given Imaging, Glaxo Smith Kline, Human Genome Sciences, Ironwood Pharmaceuticals (previously Microbia Inc.), Janssen (previously Centocor): (both money paid to WS and institution), KaloBios Pharmaceuticals, Inc., Lexicon Pharmaceuticals, Lycera Corporation, Meda Pharmaceuticals (previously Alaven Pharmaceuticals), Merck Research Laboratories, MerckSerono, Millennium Pharmaceuticals (subsequently merged with Takeda): (both money paid to WS and institution), Nisshin Kyorin Pharmaceuticals Co., Ltd., Novo Nordisk A/S, NPS Pharmaceuticals, Optimer Pharmaceuticals, Orexigen Therapeutics, Inc., PDL Biopharma: (money paid to institution), Pfizer: (both money paid to WS and institution), Procter and Gamble: (both money paid to WS and institution), Prometheus Laboratories, ProtAb Limited, Purgenesis Technologies, Inc., Relypsa, Inc., Salient Pharmaceuticals, Salix Pharmaceuticals, Inc., Santarus, Schering Plough Corporation (acquired by Merck), Shire Pharmaceuticals: (money paid to institution), Sigmoid Pharma Limited, Sirtris Pharmaceuticals, Inc. (a GSK company), S.L.A. Pharma (UK) Limited, Takeda: (both money paid to WS and institution), Targacept, Teva Pharmaceuticals, Therakos, Tillotts Pharma AG (acquired by Zeria Pharmaceutical Co., Ltd), TxCell SA, UCB Pharma: (both money paid to WS and institution), Viamet Pharmaceuticals, Vascular Biogenics Limited (VBL), Warner Chilcott UK Limited, Wyeth (now Pfizer); fees for expert testimony: Dickinson, Prud'Homme, Adams & Ingram; Grants/Grants Pending: Abbott Laboratories, Bristol Meyers Squibb, Genentech, Glaxo Smith Kline, Janssen (previously Centocor), Millennium Pharmaceuticals (now Takeda), Novartis, Pfizer, Procter and Gamble Pharmaceuticals, Shire Pharmaceuticals, UCB Pharma; payment for lectures: Abbott Laboratories, Bristol Meyers Squibb, Janssen (previously Centocor); patents: Sandborn WJ. Use of topical azathioprine to treat inflammatory bowel disorders. United States patent number: 5,691,343. Date of patent: November 25, 1997; Sandborn WJ, Rhodes J. Colonic delivery of nicotine to treat inflammatory bowel disease. South African patent number: 97/1020. Date of patent: January 28, 1998; Sandborn WJ. Use of azathioprine to treat Crohn's disease. United States patent number: 5,733,915. Date of patent: March 31, 1998; Sandborn WJ, Rhodes J. Colonic delivery of nicotine to treat inflammatory bowel disease. United States patent number: 5,846,983. Date of patent: December 8, 1998; Sandborn WJ. Azathioprine compositions for colonic administration. New Zealand patent number: 306062. Date of Patent: February 11, 1999; Sandborn WJ. Azathioprine compositions for colonic administration. Singapore patent number: 45647. Date of Patent: March 14, 1999; Sandborn WJ, Rhodes J, Rhodes P, Evans BK. Colonic delivery of nicotine to treat inflammatory bowel disease. United States patent number: 5,889,028. Date of patent: March 30, 1999; Sandborn WJ. Topical formulations of azathioprine to treat inflammatory bowel disorders. United States patent number: 5,905,081. Date of Patent: May 18, 1999; Sandborn WJ. Azathioprine compositions for colonic administration. Australia patent number: 707168. Date of Patent: October 14, 1999; Sandborn WJ, Rhodes J, Evans BK. Intestinal absorption of nicotine to treat nicotine responsive conditions. Australia patent number: 718052. Date of patent: July 20, 2000; Sandborn WJ, Rhodes J. Colonic delivery of nicotine to treat inflammatory bowel disease. United States patent number: 6,166,044. Date of patent: December 26, 2000; Sandborn WJ. Use of topical azathioprine and thioguanine to treat colorectal adenomas. United States patent number: 6,166,024. Date of patent: December 26, 2000; Rhodes J, Evans BK, Rhodes P, Sandborn WJ. Intestinal absorption of nicotine to treat nicotine responsive conditions. United States patent number: 6,238,689. Date of patent: May 29, 2001; Sandborn, WJ. Azathioprine compositions for colonic administration. Czech Republic patent number: 290428. Date of patent: May 27, 2002; Sandborn, WJ, Rhodes J. Colonic delivery of nicotine to treat IBD. Mexico patent number: 209636. Date of Patent August 12, 2002; Sandborn WJ. Enema and enterically‐coated oral dosage forms of azathioprine. United States Patent No.: 6,432,967. Date of patent: August 13, 2002; Sandborn WJ, Rhodes J. Colonic delivery of nicotine to treat nicotine responsive conditions. Europe patent number: 0954337. Date of patent: November 2, 2002; Sandborn WJ, Rhodes J, Rhodes P, Evans BK. Colonic delivery of nicotine to treat IBD. Europe patent number: 893998. Date of patent: April 15, 2003; Sandborn WJ, Rhodes J, Rhodes P, Evans BK. Colonic delivery of nicotine to treat inflammatory bowel disease. Hong Kong patent number: HK1019043. Date of patent: August 1, 2003; Sandborn WJ, Rhodes J, Rhodes P, Evans BK. Colonic delivery of nicotine to treat IBD. China patent number: ZL97192177. Date of patent: November 12, 2003; Sandborn W, Rhodes J, Rhodes P, Evans B. Colonic delivery of nicotine to treat inflammatory bowel disease. Czech patent number: 293616. Patent date: 2004; Rhodes J, Sandborn WJ, Rhodes P, Evans BK. Colonic deliver of nicotine to treat inflammatory bowel disease. Canada patent number: 2,246,235. Patent date: 2007; Sachetto JP, Sandborn WJ, Tremaine WJ. Pharmaceutical composition for the treatment of inflammatory bowel disease. United States patent number: 7341741. Patent date 2008; Rhodes J, Evans BK, Rhodes P, Sandborn WJ. Intestinal absorption of nicotine to treat nicotine responsive conditions. Canadian patent number: 2,260,909. Patent date 2008; Levy MJ, Camilleri ML, Murray JA, Sandborn WJ. Obesity treatment and device. United States patent number: 7,803,195 B2. Date of patent September 28, 2010; Dr Sandborn has stock options with Enteromedics. All of these financial activities are outside of the submitted work.
Brian Feagan has received fee(s) from Abbott/AbbVie, Amgen, Astra Zeneca, Avaxia Biologics Inc., Bristol‐Myers Squibb, Celgene, Centocor Inc., Elan/Biogen, Ferring, JnJ/Janssen, Merck, Novartis, Novonordisk, Pfizer, Prometheus Laboratories, Protagonist, Salix Pharma, Takeda, Teva, Tillotts Pharma AG, UCB Pharma for Board membership; fee(s) from Abbott/AbbVie, Actogenix, Albireo Pharma, Amgen, Astra Zeneca, Avaxia Biologics Inc., Axcan, Baxter Healthcare Corp., Boehringer‐Ingelheim, Bristol‐Myers Squibb, Calypso Biotech, Celgene, Elan/Biogen, EnGene, Ferring Pharma, Roche/Genentech, GiCare Pharma, Gilead, Given Imaging Inc., GSK, Ironwood Pharma, Janssen Biotech (Centocor), JnJ/Janssen, Kyowa Kakko Kirin Co Ltd., Lexicon, Lilly, Merck, Millennium, Nektar, Novonordisk, Pfizer, Prometheus Therapeutics and Diagnostics, Protagonist, Receptos, Salix Pharma, Serono, Shire, Sigmoid Pharma, Synergy Pharma Inc., Takeda, Teva Pharma, Tillotts, UCB Pharma, Vertex Pharma, Warner‐Chilcott, Wyeth, Zealand, and Zyngenia for consultancy; and lecture fee(s) from: Abbott/AbbVie, JnJ/Janssen, Takeda, Warner‐Chilcott, and UCB Pharma. All of these activities are outside the submitted work.
Acknowledgements
Partial funding for the Cochrane IBD Group (April 1, 2016 ‐ March 31, 2018) has been provided by Crohn's and Colitis Canada (CCC).
Version history
| Published | Title | Stage | Authors | Version |
| 2017 Sep 08 | Placebo response and remission rates in randomised trials of induction and maintenance therapy for ulcerative colitis | Review | Vipul Jairath, GY Zou, Claire E Parker, John K MacDonald, Turki AlAmeel, Mohammad Al Beshir, Majid A Almadi, Talal Al‐Taweel, Nathan SS Atkinson, Sujata Biswas, Thomas Chapman, Parambir S Dulai, Mark A Glaire, Daniël R Hoekman, Andreas Koutsoumpas, Elizabeth Minas, Mahmoud H Mosli, Mark Samaan, Reena Khanna, Simon Travis, Geert D'Haens, William J Sandborn, Brian G Feagan | |
| 2015 Mar 09 | Placebo response and remission rates in randomized trials of induction and maintenance therapy for ulcerative colitis | Protocol | Vipul Jairath, GY Zou, Claire E Parker, John K MacDonald, Turki AlAmeel, Mohammad Al Beshir, Majid A Almadi, Talal Al‐Taweel, Nathan SS Atkinson, Sujata Biswas, Thomas Chapman, Parambir S Dulai, Mark A Glaire, Daniël R Hoekman, Andreas Koutsoumpas, Elizabeth Minas, Mahmoud H Mosli, Mark Samaan, Margaret K Vandervoort, Simon Travis, Geert D'Haens, Barrett G Levesque, William J Sandborn, Brian G Feagan | |
Keywords
MeSH
Medical Subject Headings (MeSH) Keywords
- *Induction Chemotherapy [statistics & numerical data];
- *Maintenance Chemotherapy [statistics & numerical data];
- Aminosalicylic Acids [*therapeutic use];
- Anti‐Inflammatory Agents, Non‐Steroidal [*therapeutic use];
- Biological Products [*therapeutic use];
- Colitis, Ulcerative [*drug therapy];
- Gastrointestinal Hemorrhage [complications, diagnosis];
- Placebo Effect;
- Randomized Controlled Trials as Topic;
- Rectum;
Medical Subject Headings Check Words
Adult; Humans;
PICO
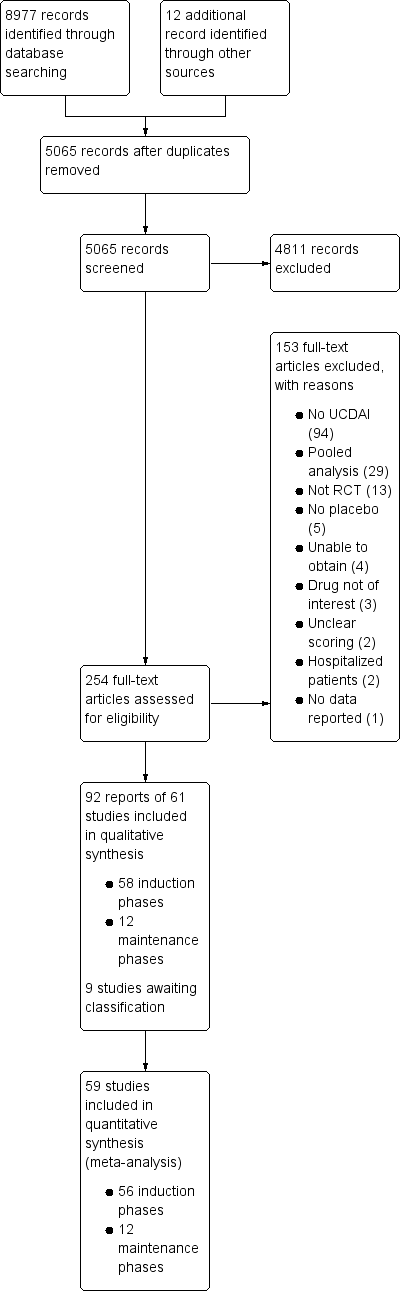
Study flow diagram.

Risk of bias summary: review authors' judgements about each risk of bias item for each included study.

Response rates in induction phases.

Remission rates in induction phases.

Response rates in maintenance phases.

Remission rates in maintenance phases.
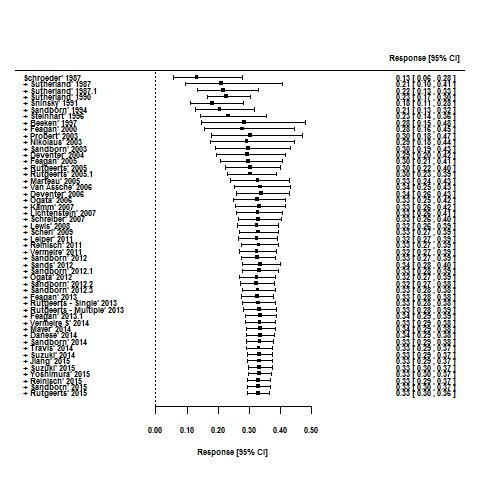
Cumulative placebo response rates 1987‐2015.

Cumulative placebo remission rates 1987‐2015.

Funnel plot test for asymmetry: response

Funnel plot test for asymmetry: remission
| Traditional design features | Novel design features | Other quality measures | |
| Increase in placebo response | Follow up > 12 months | Use of PROs | |
| Decrease in placebo response | Using treatment naive patients | Induction phases to identify drug non‐responders Adaptive group allocation Stepped wedge trial | Using biomarkers instead of PROs Enrolling patients with more severe disease Controlling for centre effects |
| Table constructed from information presented in Enck 2013. PRO: patient reported outcome | |||
| Increase in placebo response and remission rate | Longer study duration |
| Decrease in placebo response and remission rate | Defining response as UCDAI ≥ 3 |
| Table constructed from information presented in Su 2007 UCDAI: Ulcerative Colitis Disease Activity Index | |
| Trial | Phase | Setting (number of centres) | Comparator | Placebo patients | Mean age | Follow‐up (weeks) | Mean entry UCDAI score | Response definition | Remission definition | |
| 1 | induction (1) | Multicenter, single country (NS) | Budesonide foam | NS | NS | 6 | NS | NS | RBS = 0, endoscopic sub score < 1 and stool frequency sub score = 0 or decrease > 1 | |
| 2 | induction (2) | Multicenter, multinational (4) | Aminosalicylate | 13 | 48 | 6 | 7.8 | Mean/median score improvement | NS | |
| 3 | induction (3) | Multicenter, multinational (26) | Methotrexate | 51 | NS | 24 | NS | NS | Mayo Clinic subscore < 2 with no item >1 | |
| 4 | induction (4) | Multicenter, multinational (30) | Tralokinumab | 55 | 41 | 24 | 8.3 | Decrease in Mayo ≥3 points and ≥30%; plus decrease in RBS of ≥1 point or absolute RBS 0 /1 | Mayo score ≤2 points; no individual sub score >1 point | |
| 5 | induction (5) | Multicenter, multinational (30) | Alicaforsen | 22 | 50 | 6 | 6.5 | Decrease in RBS of 0‐1or more from baseline | NS | |
| 6 | induction (6) | Multicenter (NS) | Alicaforsen | 8 | 4 | 7.5 | Percent reduction in DAI | NS | ||
| 7 | induction (7) | Multicenter, single country (NS) | Vedolizumab | 8 | NS | 4 | 8 | Improvement in Baron ≥ 2 points | Mayo 0; Modified Baron 0 | |
| 8 | induction (8) | Multicenter, single country (20) | Vedolizumab | 63 | 38.9 | 6 | 6.7 | Improvement in UCCS ≥ 3 points | UCCS ≤ 1 and a modified Baron ≤ 1 | |
| 9 | induction (9) | Multicenter, multinational (26) | Mesalamine | 141 | 40.4 | 10 | NS | UCDAI decrease by ≥3 points | UCDAI, SFS and RBS scores of 0, and no fecal urgency | |
| 10 | induction (10) | Multicenter, multinational (211) | Vedolizumab | 149 | 41.2 | 6 | 8.6 | Decrease in Mayo ≥3 points and ≥30%; plus decrease in RBS of ≥1 point or absolute RBS 0 /1 | Mayo score ≤ 2 points; no individual sub score > 1 point | |
| maintenance (1) | Multicenter, multinational (211) | Vedolizumab | 126 | 40.3 | 52 | 8.4 | Decrease in Mayo ≥3 points and ≥30%; plus decrease in RBS of ≥1 point or absolute RBS 0 /1 | Mayo score ≤ 2 points; no individual sub score > 1 point | ||
| 11 | maintenance (2) | Multicenter (9) | Mesalamine | 34 | 37.3 | 96 | NS | NS | UCDAI score = 0 was the definition of clinical and endoscopic remission Relapse defined as symptoms of rectal bleeding or increase in stool frequency for > 1 wk and endoscopic evidence of inflammation | |
| 12 | induction (11) | Single centre | Infliximab | 41 | 34.5 | 8 | NS | Decrease in total MCS > 3 points or > 30% from baseline, with a decrease in RBS > 1 point or an absolute RBS of 0 or 1 | Total Mayo score = 2 points with no individual sub score > 1 point | |
| maintenance (3) | Single centre | Infliximab | 41 | 34.5 | 30 | NS | Decrease in total MCS > 3 points or > 30% from baseline, with a decrease in RBS > 1 point or an absolute RBS of 0 or 1 | Total Mayo score of < 2 points with no individual sub score > 1 point | ||
| 13 | induction (12) | Multicenter. multinational (49) | MMX mesalamine | 86 | 43.2 | 8 | NS | UCDAI decrease by ≥3 points | UCDAI ≤1+ RBS=0 + SFS=0 ; and ≥1 point reduction in sigmoidoscopy score | |
| 14 | induction (13) | Single country (1) | Rituximab | 8 | 50 | 24 | 7.6 | Decrease in Mayo ≥ 3 points | Decrease in Mayo to ≤ 2 | |
| 15 | induction (14) | Multicenter, single country (15) | Rosiglitazone | 53 | 12 | NS | Decrease in Mayo ≥2 points | Mayo score ≤ 2 | ||
| 16 | induction (15) | Multicenter, multinational (52) | MMX mesalamine | 93 | 42.6 | 8 | NS | UCDAI decrease by ≥3 points | UCDAI ≤1+ RBS=0 + SFS=0 ; and ≥1 point reduction in sigmoidoscopy score | |
| 17 | maintenance (4) | Multicenter, multinational (48) | Mesalamine | 96 | 46 | 24 | NS | NS | Relapse free at 6 months | |
| 18 | induction (16) | Multicenter, multinational (43) | Mesalazine enema | 56 | NS | 8 | NS | UCDAI decrease by ≥2 points | UCDAI ≤1 | |
| 19 | induction (17) | Multicenter, multinational (54) | BMS‐936557 | 54 | 41.8 | 8 | 7.9 | Decrease in Mayo ≥3 points and ≥30%; plus decrease in RBS of ≥1 point or absolute RBS 0 /1 | Mayo score ≤2 points; no individual sub score >1 point | |
| 20 | induction (18) | Multicenter, multinational (6) | rIFN‐β‐1a | 7 | 6 | NS | Reduction of ≥3 points in the UCSS symptoms score and PGA | All clinical UCSS sub scores equal to 0, with a proctosigmoidoscopy score of 0 or 1 | ||
| 21 | induction (19) | Multicenter, single country (17) | Tacrolimus | 21 | 30 | 2 | 9.4 | Reduction in DAI of more than 4 points with improvement of all categories | Complete resolution of all symptoms (all assessment scores were zero) | |
| 22 | induction (20) | Multicenter, single country (NS) | Tacrolimus | 30 | NS | 2 | 9.1 | Reduction in DAI of more than 4 points with improvement of all categories | Total DAI score 2 with all individual sub scores of 0 or 1 | |
| 23 | induction (21) | Multicenter, single country (12) | Methotrexate | 37 | 38.9 | 36 | 6.8 | NS | MCS (including the endoscopic sub score) of < 3 with no steroid use, and without a score of < 2 without sigmoidoscopy results | |
| maintenance (5) | Multicenter, single country (12) | Methotrexate | 37 | 38.9 | 36 | 6.8 | NS | Relapse was an increase in the MCS of > 3 (not including sigmoidoscopy) and/or reintroduction of steroids at a dose of > 300 mg/month | ||
| 25 | induction (22) | Multicenter, multinational (4) | Infliximab | 20 | NS | 6 | 8.5 | Decrease in Baron of ≥ 1 | UCCS ≤ 2 AND/OR Baron score = 0 | |
| 25 | induction (23) | Multicenter, multinational (94) | Adalimumab | 130 | NS | 8 | 8.7 | Decrease in Mayo > 3 points and decrease in the RBS >1/absolute RBS of 0 or 1 | Mayo score < 2 with no individual sub score > 1 | |
| 26 | induction (24) | Multicenter, multinational (38) | Anrukinzumab | 21 | 36.6 | 32 | 6.6 | Decrease from baseline of ≥3 points in total Mayo score, with at least a 30% change, accompanied by ≥1 point decrease or absolute score of 0 or 1 in RBS | Defined as proportion of subjects with a total Mayo score ≤ 2, with no individual sub score > 1 | |
| 27 | induction (25) | NS | Budesonide MMX® | NS | NS | NS | rectal bleeding and stool frequency sub scores = 0 | |||
| 28 | induction (26) | Multicenter, multinational (62) | Infliximab | 121 | 41.4 | 8 | 8.4 | Decrease in Mayo ≥3 points and ≥30%; plus decrease in RBS of ≥1 point or absolute RBS 0 /1 | Mayo score ≤2 points; no individual sub score >1 point | |
| maintenance (6) | ||||||||||
| 29 | induction (27) | Multicenter, multinational (55) | Infliximab | 123 | 39.3 | 8 | 8.5 | Decrease in Mayo ≥3 points and ≥30%; plus decrease in RBS of ≥1 point or absolute RBS 0 /1 | Mayo score ≤2 points; no individual sub score >1 point | |
| maintenance (7) | ||||||||||
| 30 | induction (28) | Multicenter, multinational (15) | Etrolizumab | 5 | 30.2 | 4 | 9 | Decrease in Mayo ≥3 points and ≥30%; plus decrease in RBS of ≥1 point or absolute RBS 0 /1 | Mayo score ≤2 points; no individual sub score >1 point | |
| 31 | induction (29) | Multicenter, multinational (15) | Etrolizumab | 5 | 39 | 5 | 10 | Decrease in Mayo ≥3 points and ≥30%; plus decrease in RBS of ≥1 point or absolute RBS 0 /1 | Mayo score ≤2 points; no individual sub score >1 point | |
| 32 | induction (30) | |||||||||
| 33 | induction (31) | Single centre | Cyclosporin | 20 | 4 | NS | Reduction of ≥3 points in DAI | UCDAI=0 | ||
| 34 | induction (32) | Multicenter, single country (15) | Repifermin | 28 | NS | 6 | Decrease in Mayo ≥3 points compared with baseline at week 4 | A score of zero on the sigmoidoscopy all sub scores = 0 (SFS, PGA, RBS) | ||
| 35 | induction (33) | Multicenter, multinational (103) | Adalimumab | 260 | 41.3 | 8 | 8.9 | Decrease in Mayo ≥ 3 points and ≥30%; plus decrease in RBS of ≥1 point or absolute RBS 0 /1 | Mayo score ≤2 points; no individual sub score >1 point | |
| maintenance (8) | ||||||||||
| 36 | induction (34) | Multicenter, multinational (108) | Budesonide MMX | 128 | 8 | NS | ≥3‐point decrease in UCDAI, and ≥1‐point reduction in the endoscopy sub score | UCDAI ≤1+ RBS=0 + SFS=0; no mucosal on colonoscopy ; and ≥1 point reduction in sigmoidoscopy score | ||
| 37 | induction (35) | Multicenter, multinational (51) | Tofacitinib | 48 | 42.5 | 8 | 8.2 | Decrease in Mayo ≥3 points and ≥30%; plus decrease in RBS of ≥1 point or absolute RBS 0 /1 | MCS = 2 with no individual sub score> 1 | |
| 38 | induction (36) | Multicenter, multinational (142) | Abatacept | 140 | 40.9 | 12 | 8.8 | Decrease in Mayo ≥3 points and ≥30%; plus decrease in RBS of ≥1 point or absolute RBS 0 /1 | MCS = 2 with no individual sub score> 1 | |
| maintenance (9) | Multicenter, multinational (142) | Abatacept | 66 | NS | 52 | NS | NS | NS | ||
| 39 | induction (37) | Multicenter, multinational (NS) | Budesonide Foam | NS | NS | 7.9 | NS | Endoscopy score ≤ 1, RBS = 0 and improvement or no change from baseline in stool frequency subscales of MMDAI** | ||
| 40 | induction (38) | Multicenter, multinational (NS) | Budesonide Foam | NS | NS | NS | 8 | NS | Endoscopy score ≤ 1, RBS = 0 and improvement or no change from baseline in stool frequency subscales of MMDAI | |
| 41 | maintenance (10) | Multicenter, multinational (217) | Golimumab | 331 | 39 | 8 | 8.3 | Decrease in Mayo ≥3 points and ≥30%; plus decrease in RBS of ≥1 point or absolute RBS 0 /1 | Mayo score ≤2 points; no individual subscore >1 point | |
| 42 | induction (39) | Multicenter, multinational (251) | Golimumab | 156 | 40.2 | 54 | 8.3 | Decrease in Mayo ≥3 points and ≥30%; plus decrease in RBS of ≥1 point or absolute RBS 0 /1 | Mayo score ≤2 points; no individual subscore >1 point | |
| 43 | induction (40) | Multicenter, multinational (75) | Eldelumab | 83 | 42.7 | 11 | 8.6 | Mayo score < 2 points | Reduction | |
| 44 | induction (41) | Multicenter, multinational (46) | Basiliximab | 51 | 38 | 8 | NS | Decrease in Mayo ≥3 points and ≥30%; plus decrease in RBS of ≥1 point or absolute RBS 0 /1 | Mayo score ≤2 points; no individual subscore >1 point | |
| 45 | induction (42) | Multicenter, single country (55) | Balsalazide | 83 | 45.4 | 8 | 8 | ≥3 point improvement in modified Mayo, ≥1 point improvement in RBS | 0 for RBS and combined score of ≤2 for SFS and PGA using the Modified Mayo subscales | |
| 46 | induction (43) | Multicenter, single country (35) | Tetomilast | 62 | 45.5 | 8 | 7.5 | Reduction of ≥3 points in DAI | UCDAI ≤1 | |
| 47 | induction (44) | Single center | Mesalamine | 38 | 42.7 | 6 | NS | 'substantial' improvement in scores | Complete resolution of symptoms (total score 0) | |
| 48 | induction (45) | Multicenter, single country (9) | Mesalamine | 52 | 39.2 | 6 | NS | Reduction in the PGA score and in at least one other component score | Complete resolution of all symptoms with all assessment scores 0 | |
| 49 | induction (46) | Multicenter, single country (2) | Butyrate | 19 | 38.6 | 6 | 7.8 | Reduction of ≥2 points in UCDAI | UCDAI ≤1 | |
| 50 | induction (47) | Multicenter, multinational (8) | Aminosalicylate | 77 | 36 | 6 | NS | PGA, % drop in DAI from baseline (total and subscores) | NS§ | |
| 51 | induction (48) | Multicenter, single country (2) | Aminosalicylate | 30 | 36 | 6 | NS | PGA, mean DAI | NS | |
| 52 | induction (49) | Multicenter, multinational (7) | Aminosalicylate | 44 | 37.8 | 6 | 8.2 | PGA, mean DAI | NS | |
| 53 | maintenance (11) | Multicenter, single country (65) | Adalimumab | 96 | 41.3 | 52 | 8.5 | Decrease of > 3 points and > 30 % from | Full Mayo | |
| 54 | induction (51) | Multicenter, single country (NS) | Infliximab | 104 | NS | 8 | NS | NS | NS | |
| maintenance (12) | Multicenter, single country (NS) | Infliximab | 104 | NS | 30 | NS | NS | NS | ||
| 55 | induction (52) | Multicenter, multinational (69) | Budesonide MMX | 128 | 39.9 | 8 | 6.2 | ≥3‐point decrease in UCDAI, and ≥1‐point reduction in the endoscopy subscore | UCDAI ≤1+ RBS=0 + SFS=0; no mucosal on colonoscopy; and ≥1 point reduction in sigmoidoscopy score | |
| 56 | induction (53) | Multicenter, multinational (40) | Daclizumab | 56 | 40.7 | 20 | 8 | Decrease in Mayo ≥ 3 points | Mayo 0 for endoscopy and RBS; Mayo 0/1 for SFS† and PGA‡ | |
| 57 | induction (54) | Multicenter, multinational (17) | PF‐00547,659 | 20 | 47.9 | 4 | 7.5 | Decrease in Mayo ≥3 points and ≥30%; plus decrease in RBS of ≥1 point or absolute RBS 0 /1 | Mayo score ≤2 points; no individual subscore >1 point | |
| 58 | induction (55) | Multicenter. Multinational (40) | Etrolizumab | 43 | 37.5 | 10 | 9.1 | Decrease in Mayo ≥3 points and ≥30%; plus decrease in RBS of ≥1 point or absolute RBS 0 /1 | Mayo score ≤2 points; no individual subscore >1 point | |
| 59 | induction (56) | Multicenter, single country (45) | Aminosalicylate | 64 | 41.3 | 4 | 5.5 | NS | Rectal mucosal score of 0 or 1 | |
| 60 | induction (57) | Multicenter, single country (2) | NS | 13 | 42.7 | 6 | 7.4 | NS | DAI score of 0 | |
| 61 | induction (58) | Multicenter, single country (42) | AJM300 | 51 | 42.6 | 8 | 7.7 | Decrease in MCS of at least 3 points and | MCS of 2 or lower and no subscore higher than 1 | |
| NS: not stated RBS: rectal bleeding score DAI: Disease Activity Index UCCS: Ulcerative Colitis Clinical Score UCDAI: Ulcerative Colitis Disease Activity Index SFS: stool frequency score PGA: physician's global assessment | ||||||||||
| Response | Remission | |||||||
| Trials | Pooled rate % (95% CI) | I2 % | 12 P value | Trials | Pooled rate % (95% CI) | I2 % | I2 P value | |
| All trials | 50 | 33 (30‐36) | 73 | < 0.001 | 47 | 12 (9‐15) | 75 | < 0.001 |
| Trial setting | ||||||||
| Multi‐centre, single‐country | 14 | 29 (23‐35) | 64 | 0.003 | 16 | 11 (7‐17) | 75 | < 0.001 |
| Multi‐centre, multi‐national | 31 | 35 (31‐40) | 78 | < 0.001 | 27 | 12 (10‐16) | 79 | < 0.001 |
| Single‐centre | 4 | 26 (14‐44) | 62 | 0.06 | 3 | 6(2‐16) | 0 | 0.74 |
| Design | ||||||||
| Stand‐alone induction | 38 | 34 (29‐39) | 76 | < 0.001 | 35 | 11 (9‐14) | 68 | < 0.001 |
| Induction and maintenance | 12 | 32 (29‐35) | 28 | 0.04 | 12 | 13 (8‐20) | 87 | < 0.001 |
| First author country | ||||||||
| North America | 26 | 32 (27‐36) | 73 | < 0.001 | 23 | 11 (9‐15) | 72 | < 0.001 |
| Europe | 18 | 37 (30‐44) | 73 | < 0.001 | 17 | 12 (8‐18) | 74 | < 0.001 |
| Other | 6 | 29 (22‐38) | 55 | < 0.05 | 7 | 12 (5‐25) | 86 | < 0.001 |
| Drug class | ||||||||
| Corticosteroid | 2 | 23 (19‐29) | 0 | 1.0 | 2 | 5 (2‐11) | 48 | < 0.17 |
| Amicosalicylate | 11 | 32 (20‐47) | 92 | < 0.001 | 9 | 18 (12‐24) | 67 | < 0.005 |
| Immunosuppressant | 3 | 19 (7‐43) | 68 | 0.04 | 5 | 13 (3‐38) | 86 | < 0.001 |
| Biological | 29 | 35 (31‐38) | 52 | < 0.001 | 28 | 11 (9‐14) | 61 | < 0.001 |
| Other | 5 | 34 (25‐44) | 29 | 0.26 | 3 | 7 (3‐18) | 47 | 0.14 |
| Route of administration | ||||||||
| Topical | 7 | 39 (27‐53) | 73 | < 0.001 | 5 | 18 (9‐31) | 59 | 0.04 |
| Oral | 17 | 28 (22‐34) | 77 | < 0.001 | 16 | 10 (6‐17) | 88 | < 0.001 |
| Intravenous | 17 | 35 (30‐41) | 63 | < 0.001 | 17 | 13 (10‐17) | 57 | 0.003 |
| Subcutaneous | 8 | 35 (30‐40) | 42 | 0.05 | 8 | 8 (7‐10) | 4 | 0.44 |
| Disease severity on entry | ||||||||
| Mild‐moderate | 21 | 32 (25‐39) | 80 | < 0.001 | 18 | 12 (8‐17) | 77 | < 0.001 |
| Moderate‐severe | 29 | 34 (30‐38) | 59 | < 0.001 | 29 | 12 (9‐15) | 75 | < 0.001 |
| Disease duration on entry | ||||||||
| < 5 years | 5 | 47 (37‐57) | 53 | 0.06 | 9 | 21 (17‐25) | 0.0 | 0.4 |
| > 5 years | 29 | 33 (28‐38) | 81 | < 0.001 | 28 | 11 (8‐15) | 82 | < 0.001 |
| Inclusion criteria | ||||||||
| Minimum total score > 6 | 21 | 34 (30‐39) | 67 | < 0.001 | 21 | 12 (9‐17) | 83 | < 0.001 |
| Minimum total score < 6 | 24 | 34 (29‐40) | 69 | < 0.001 | 21 | 13 (9‐17) | 70 | < 0.001 |
| Endoscopy subscore for inclusion | ||||||||
| > 2 | 27 | 34 (30‐37) | 59 | < 0.001 | 27 | 12 (9‐15) | 71 | < 0.001 |
| < 2 | 4 | 46 (31‐61) | 79 | 0.002 | 4 | 25 (11‐48) | 90 | < 0.001 |
| Not stated | 17 | 29 (21‐39) | 79 | < 0.001 | 14 | 8 (5‐13) | 49 | 0.015 |
| Bleeding score for inclusion | ||||||||
| Yes | 9 | 37 (29‐45) | 77 | < 0.001 | 9 | 16 (10‐23) | 79 | < 0.001 |
| No/not stated | 41 | 32 (28‐36) | 70 | < 0.001 | 38 | 11 (8‐14) | 73 | < 0.001 |
| Duration of follow‐up visits | ||||||||
| < 8 weeks | 37 | 33 (29‐34) | 81 | < 0.001 | 32 | 11 (9‐14) | 71 | < 0.001 |
| > 8 weeks | 9 | 32 (27‐37) | 42 | < 0.001 | 11 | 14 (8‐23) | 85 | < 0.001 |
| Number of follow up visits | ||||||||
| < 3 | 16 | 32 (23‐44) | 81 | < 0.001 | 13 | 11 (7‐19) | 63 | 0.001 |
| > 3 | 24 | 34 (30‐38) | 69 | < 0.001 | 24 | 12 (9‐16) | 84 | < 0.001 |
| Publication date | ||||||||
| Before (and including) 2007 | 23 | 33 (26‐40) | 78 | < 0.001 | 19 | 13 (9‐19) | 75 | < 0.001 |
| After 2008 | 27 | 33 (29‐36) | 66 | < 0.001 | 28 | 11 (8‐14) | 4 | < 0.001 |
| Time point to measure remission | ||||||||
| < 6 weeks | 17 | 31 (23‐41) | 86 | < 0.001 | 19 | 11 (8‐17) | 70 | < 0.001 |
| > 6 weeks | 26 | 34 (31‐38) | 61 | < 0.001 | 26 | 12 (9‐15) | 71 | < 0.001 |
| Improvement in endoscopy subscore required for definition | ||||||||
| Yes | 21 | 31 (27‐36) | 77 | < 0.001 | 22 | 10 (7‐13) | 76 | < 0.001 |
| No | 29 | 35 (29‐40) | 69 | < 0.001 | 25 | 14 (10‐19) | 71 | < 0.001 |
| Improvement in bleeding subscore required for definition | ||||||||
| Yes | 13 | 31 (26‐37) | 66 | < 0.001 | 12 | 12 (9‐17) | 65 | 0.001 |
| No | 37 | 34 (30‐39) | 75 | < 0.001 | 35 | 12 (9‐15) | 77 | < 0.001 |
| Response | Remission | |||
| Study characteristic | Odds ratio (95% CI) | p value | Odds ratio (95% CI) | p value |
| Trial setting | ||||
| Multi‐centre, single‐country | 1.0 | 0.16 | 1.0 | 0.59 |
| Multi‐centre, multi‐national | 1.39 (0.96‐2.03) | 1.11 (0.64‐1.94) | ||
| Single‐centre | 0.95 (0.45‐1.99) | 0.56 (0.14‐2.22) | ||
| Design | ||||
| Stand‐alone induction vs. induction and maintenance | 0.86 (0.61‐1.22) | 0.40 | 1.21 (0.70‐2.07) | 0.50 |
| First author country | ||||
| North America | 1.0 | 0.24 | 1.0 | 0.80 |
| Europe | 1.28 (0.90‐1.81) | 1.15 (0.66‐2.01) | ||
| Other | 0.86 (0.52‐1.42) | 1.24 (0.59‐2.61) | ||
| Drug class | ||||
| Corticosteroid | 1.0 | 0.30 | 1.0 | |
| Amicosalicylate | 1.59 (0.75‐3.36) | 3.95 (1.37‐11.40) | 0.02 | |
| Immunosuppressant | 0.86 (0.30‐2.44) | 4.95 (1.47‐16.73) | ||
| Biological | 1.74 (0.86‐3.50) | 2.36 (0.83‐6.40) | ||
| Other | 1.69 (0.71‐3.98) | 1.48 (0.37‐5.88) | ||
| Route of administration | ||||
| Topical | 1.0 | 0.12 | 1.0 | |
| Oral | 0.58 (0.35‐0.98) | 0.62 (0.25‐1.53) | 0.34 | |
| Intravenous | 0.82 (0.49‐1.39) | 0.70 (0.29‐1.70) | ||
| Subcutaneous | 0.82 (0.45‐1.47) | 0.41 (0.15‐1.13) | ||
| Disease severity on entry | ||||
| Mild‐moderate vs. moderate‐severe | 1.10 (0.80‐1.51) | 0.57 | 0.94 (0.56‐1.56) | 0.80 |
| Disease duration on entry | ||||
| < 5 years vs > 5 years | 0.54 (0.32‐0.92) | 0.02 | 0.57 (0.30‐1.11) | 0.10 |
| Inclusion criteria | ||||
| Minimum total score > 6 vs. minimum total score < 6 | 1.00 (0.73‐1.35) | 0.98 | 1.00 (0.59‐1.68) | 0.99 |
| Endoscopy subscore for inclusion | ||||
| > 2 | 1.0 | 0.02 | 1.0 | 0.01 |
| > 1 | 1.70 (1.02‐2.82) | 2.60 (1.25‐5.42) | ||
| Not stated | 0.78 (0.56‐1.10) | 0.68 (0.39‐1.20) | ||
| Bleeding score for inclusion | ||||
| Yes vs. no/not stated | 1.70 (1.02‐2.82) | 0.02 | 0.67 (0.38‐1.20) | 0.18 |
| Duration of follow‐up visits | ||||
| < 8 weeks vs. > 8 weeks | 0.88 (0.57‐1.37) | 0.59 | 1.41 (0.77‐2.58) | 0.26 |
| Number of follow‐up visits | ||||
| < 3 weeks vs. > 3 weeks | 1.05 (0.70‐1.57) | 0.83 | 1.08 (0.55‐2.12) | 0.82 |
| Publication date | ||||
| Before (and including) 2007 vs. after 2007 | 0.96 (0.70‐1.33) | 0.81 | 0.77 (0.47‐1.29) | 0.32 |
| Improvement in endoscopy subscore required for definition | ||||
| Yes vs. no | 1.16 (0.85‐1.59) | 0.35 | 1.54 (0.95‐2.48) | 0.08 |
| Improvement in bleeding subscore required for definition | ||||
| Yes vs. no | 1.18 (0.83‐1.67) | 0.36 | 1.0 (0.58‐1.74) | 0.99 |
| Timepoint to measure response response/remission | ||||
| < 6 weeks vs. > 6 weeks | 1.08 (0.76‐1.53) | 0.68 | 0.97 (0.60‐1.59) | 0.92 |
| Number of follow‐up visits | ||||
| < 3 visits vs. > 3 visits | 1.05 (0.70‐1.57) | 0.83 | 1.08 (0.55‐2.12) | 0.82 |
| Duration of follow‐up | ||||
| < 8 weeks vs. > 8 weeks | 0.88 (0.57‐1.37) | 0.59 | 1.41 (0.77‐2.58) | 0.26 |
| Screening visits | ||||
| Yes vs. no | 1.12 (0.75‐0.66) | 0.6 | 0.95 (0.53‐1.72) | 0.9 |
| Number of trial centres | ||||
| per 1‐centre increment | 1.00 (1.00‐1.03) | 0.728 | 1.00 (0.99‐1.00) | 0.304 |
| Publication year | ||||
| Per 1 = year increment | 1.01 (0.99‐1.03) | 0.24 | 0.99 (0.95‐1.03) | 0.65 |
| Extensive disease/pancolitis | ||||
| > 30% vs. < 30% | 1.01 (0.69‐1.47) | 0.969 | 1.23 (0.64‐2.36) | 0.532 |
| Concurrent steroids | ||||
| Yes vs. no | 0.88 (0.59‐1.32) | 0.539 | 1.13(0.63‐2.05) | 0.68 |
| Concurrent immunosuppressive | ||||
| Yes vs. no | 0.76 (0.53‐1.16) | 0.727 | 0.18 (0.66‐2.10) | 0.575 |
| Ratio of active drug | ||||
| Placebo > 1 vs. < 1 | 1.01 (0.68‐1.50) | 0.972 | 0.91 (0.49‐1.67) | 0.757 |
| Primary time point to measure endpoint | ||||
| per 1‐week increment | 1.00 (0.93‐1.07) | 0.97 | 1.06 (1.02‐1.10) | 0.01 |